Pneumatic Multi-Pocket Elastomer Actuators for Metacarpophalangeal Joint Flexion and Abduction-Adduction

Abstract
:1. Introduction
1.1. Background
- Flexion-extension of finger Metacarpophalangeal (MCP) and thumb carpometacarpal joints
- Flexion-extension of Interphalangeal (IP) joints to form a hook
- Flexion-extension of MCP and proximal IP joints
- Forming a fist
- Finger and thumb abduction-adduction
- Thumb opposition to each finger and sliding thumb from the tip of little finger to its base
1.2. Related Research
1.3. Goals of This Study
2. Actuator Prototype Design
2.1. Design Principles
- Geometry of the elastomer structure;
- Heterogeneity of elastomer materials used;
- Material properties and geometry of embedded reinforcing and strain-limiting materials;
- Coupling between the actuator and the moved object or structure.
2.2. Functional Requirements
2.3. General Prototype Design Specifications
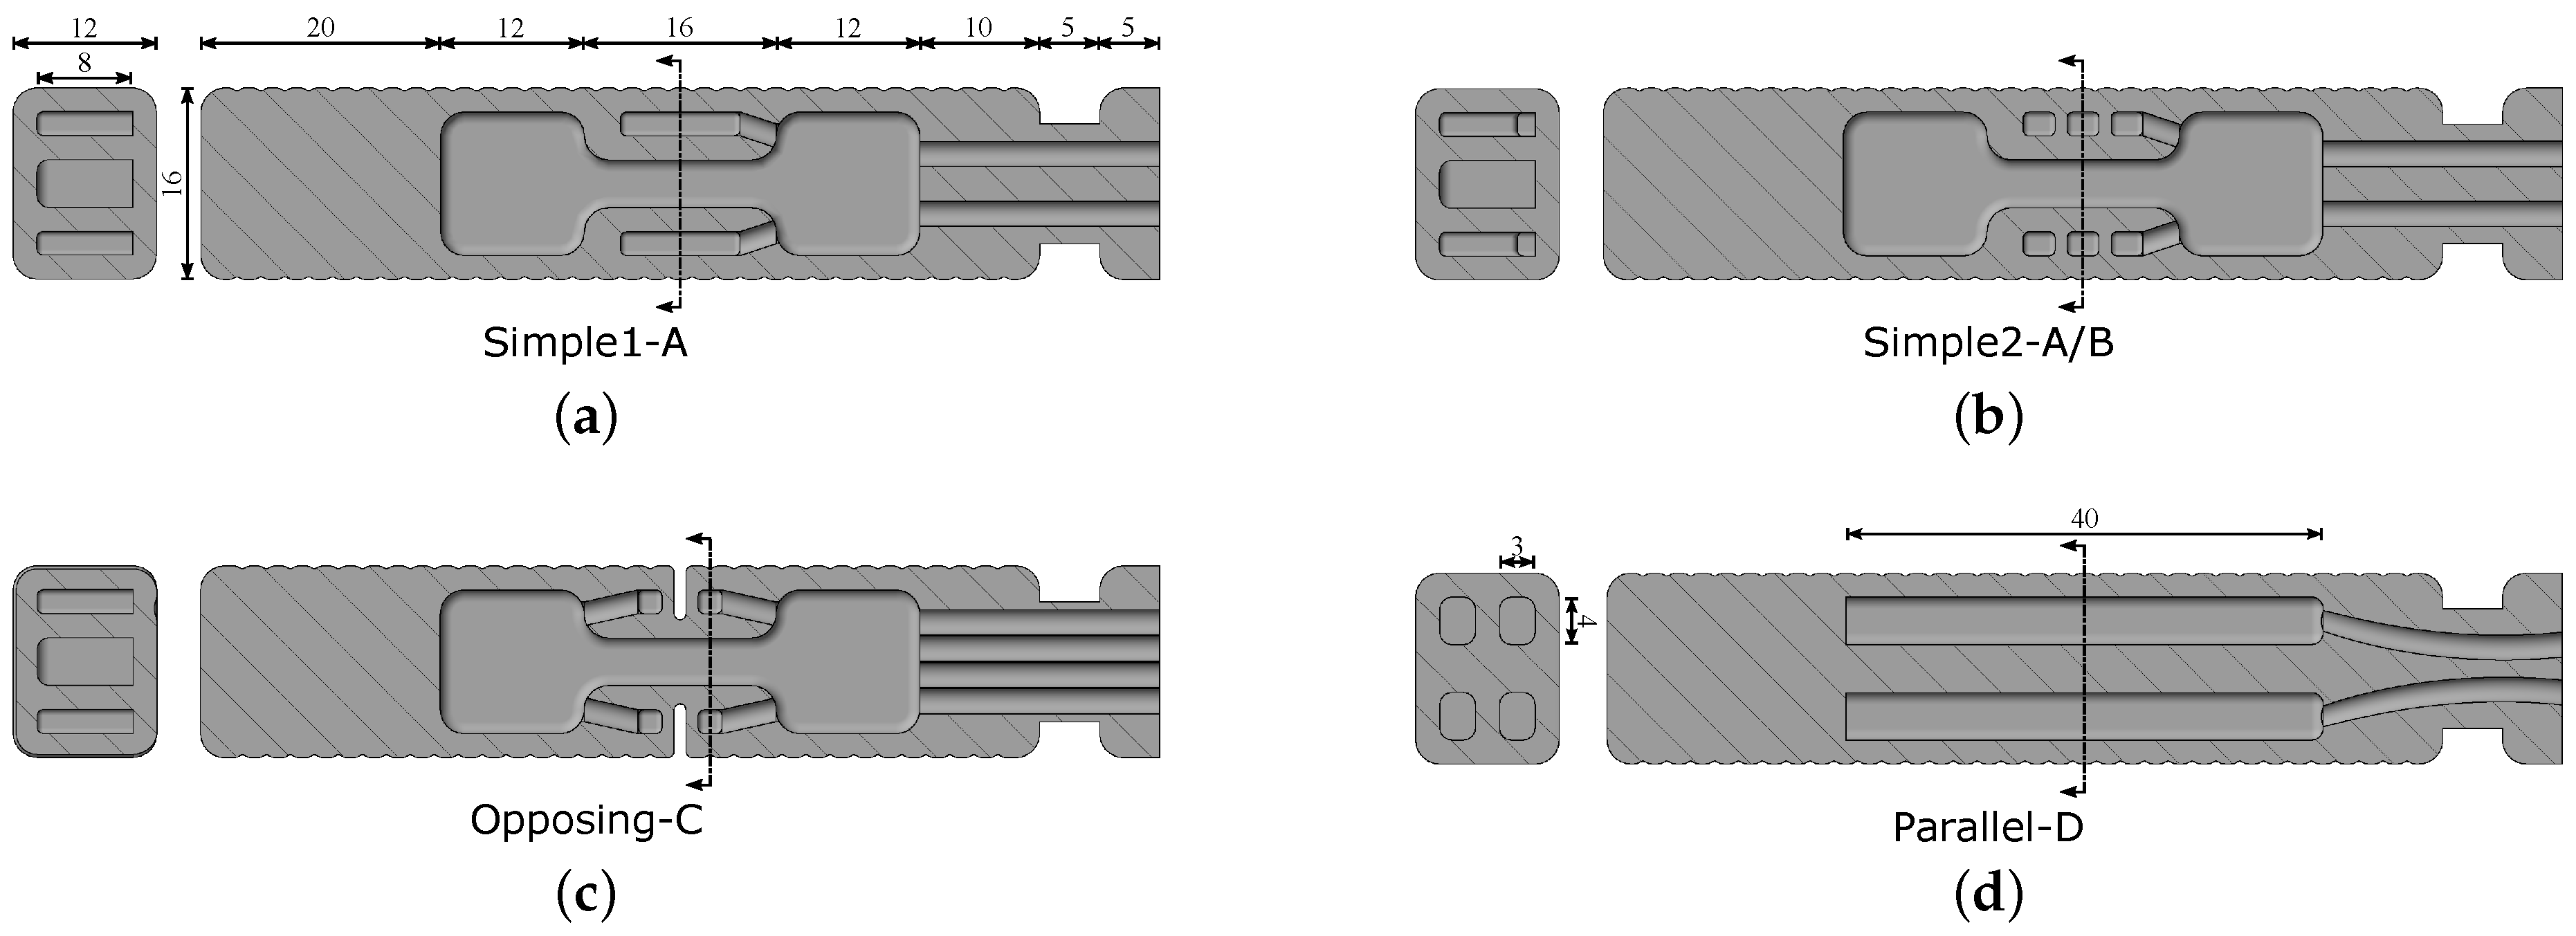
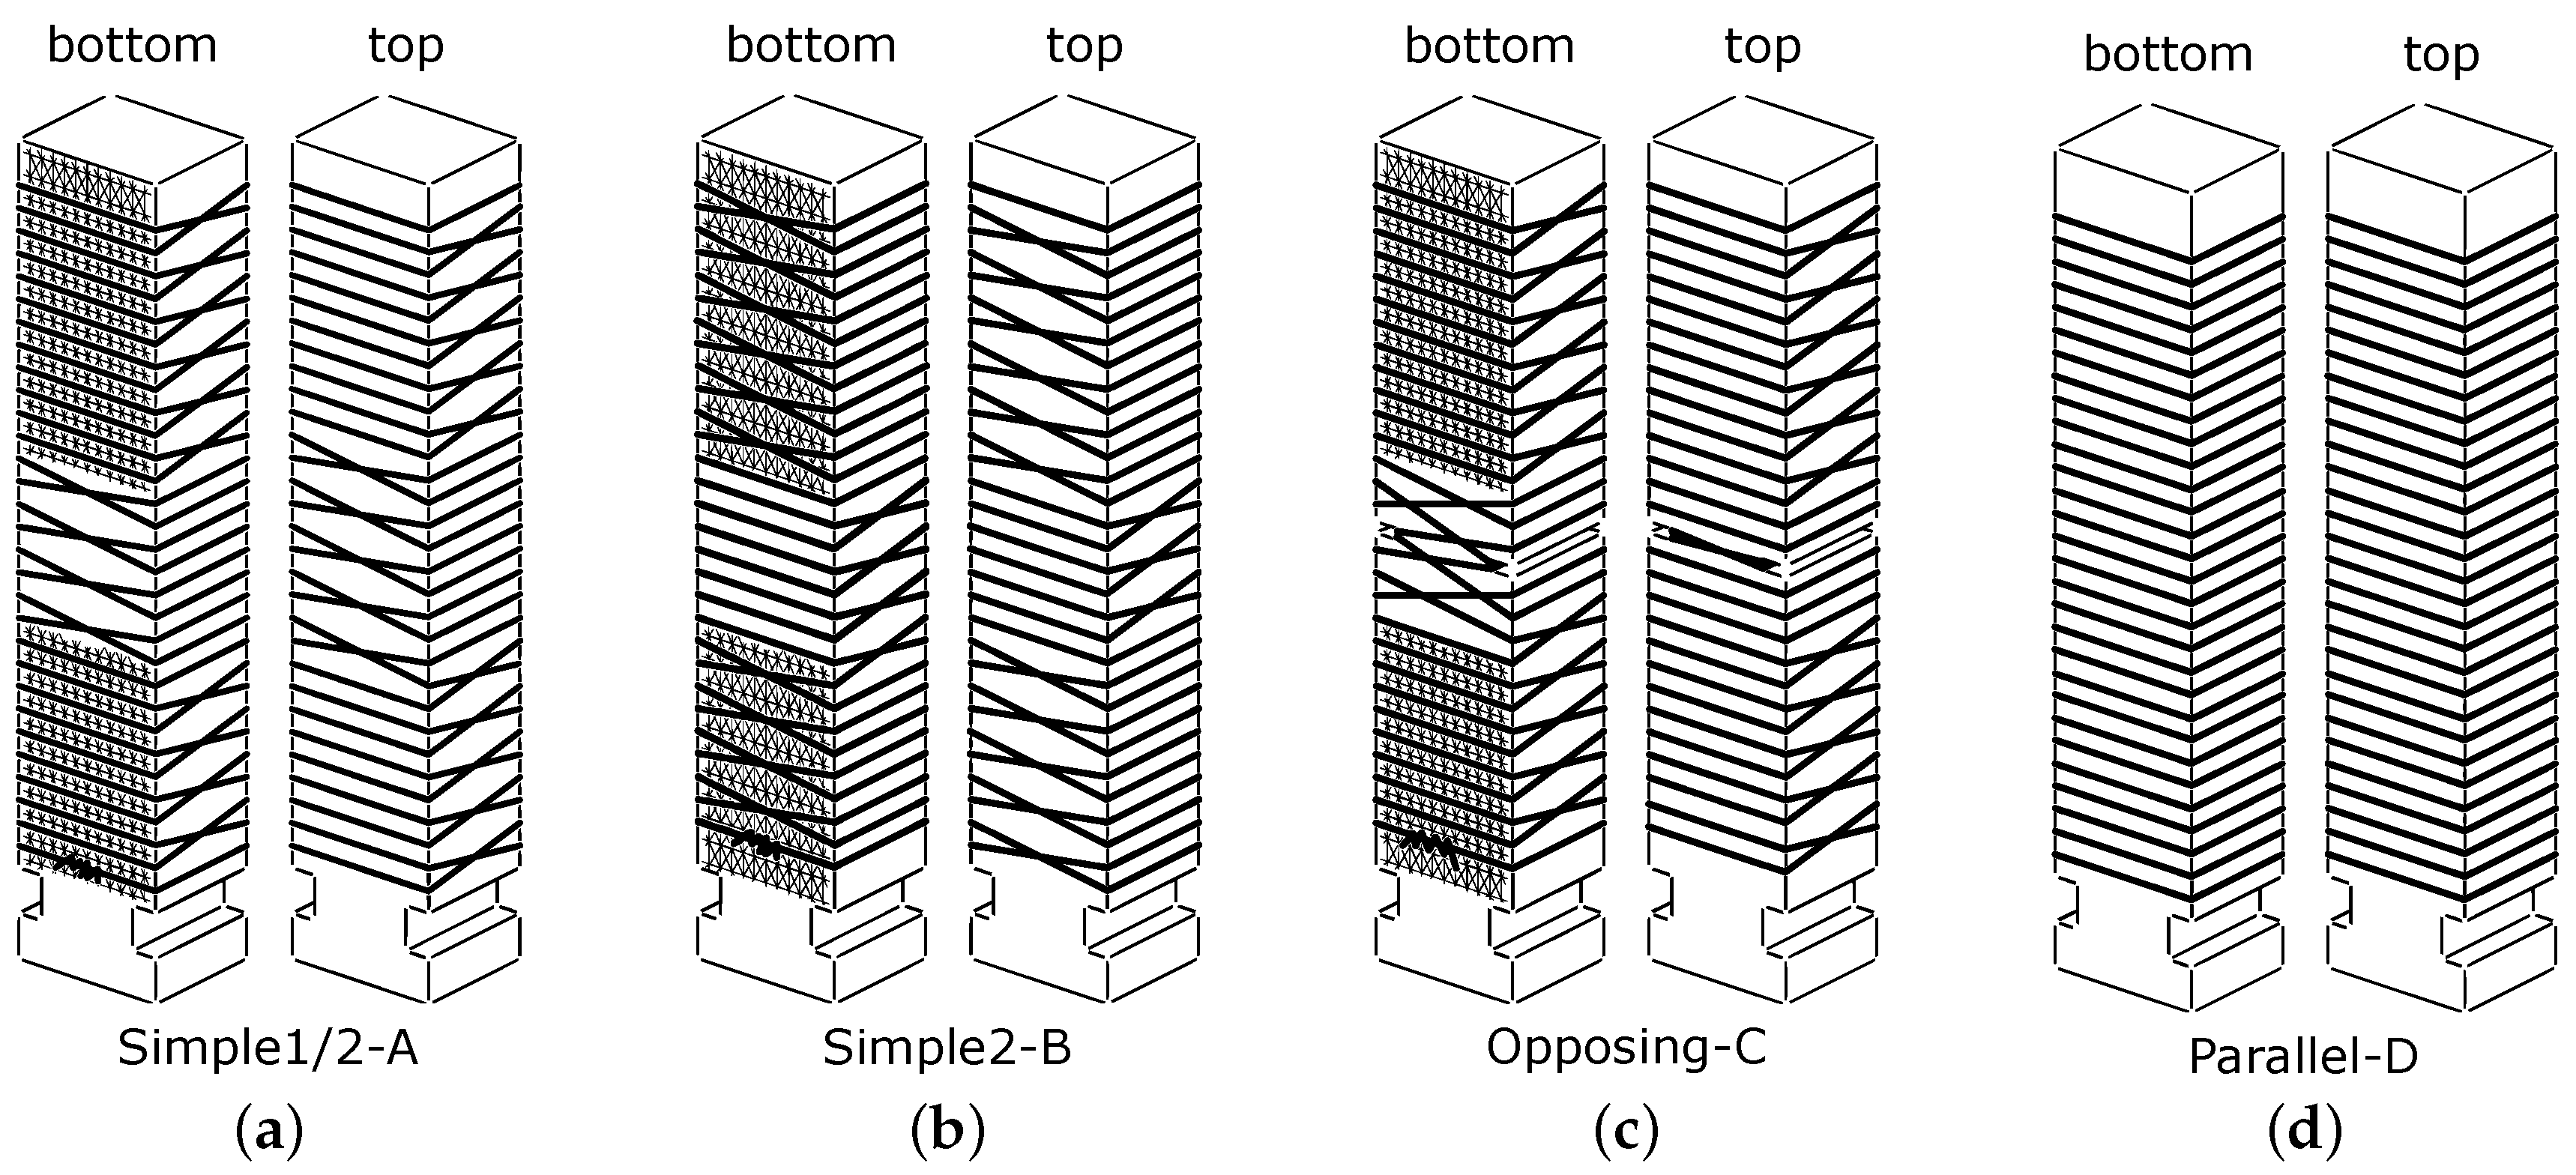
2.4. Simple Side-Pockets
2.5. Opposing Side-Pockets
2.6. Parallel Pockets
3. Prototype Fabrication and Evaluation
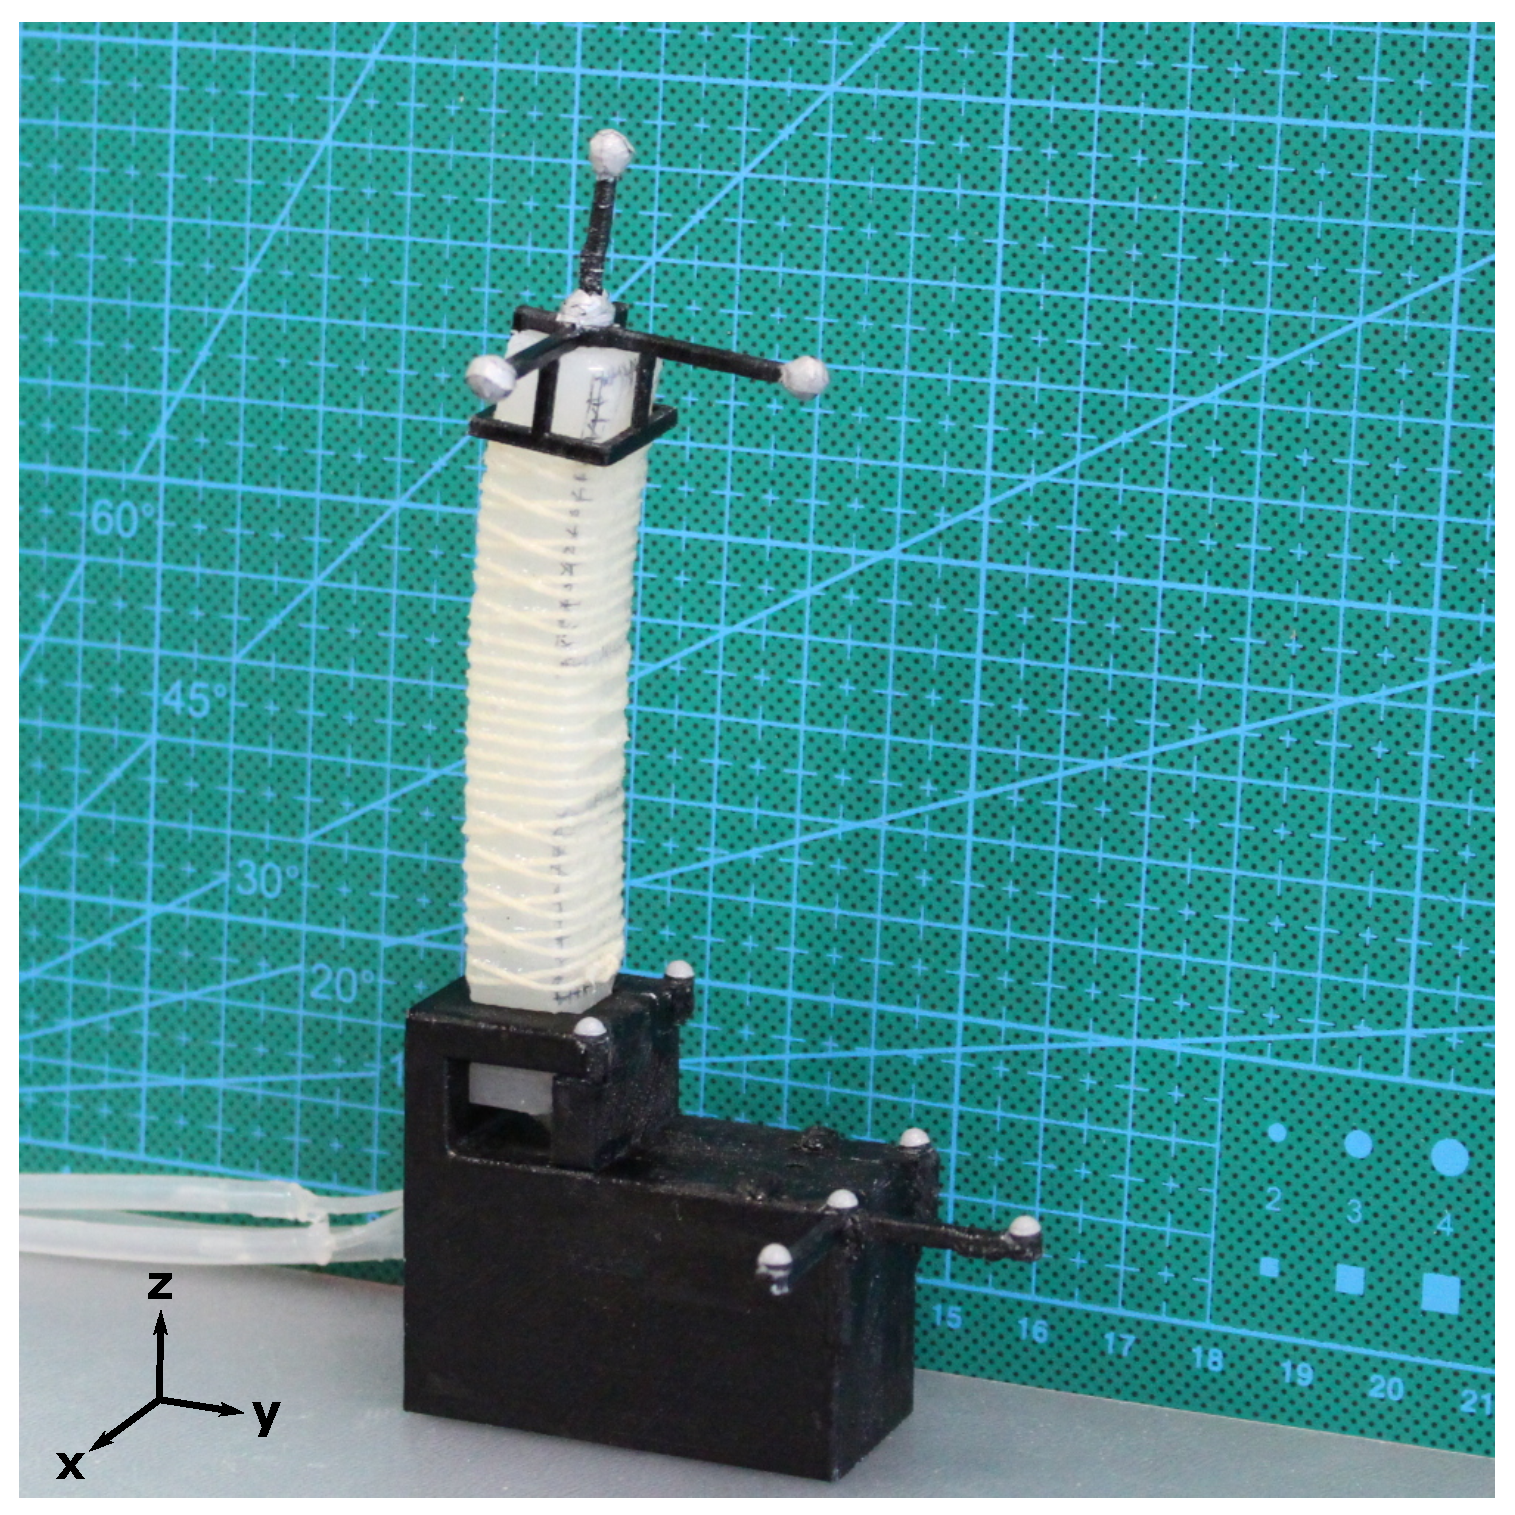
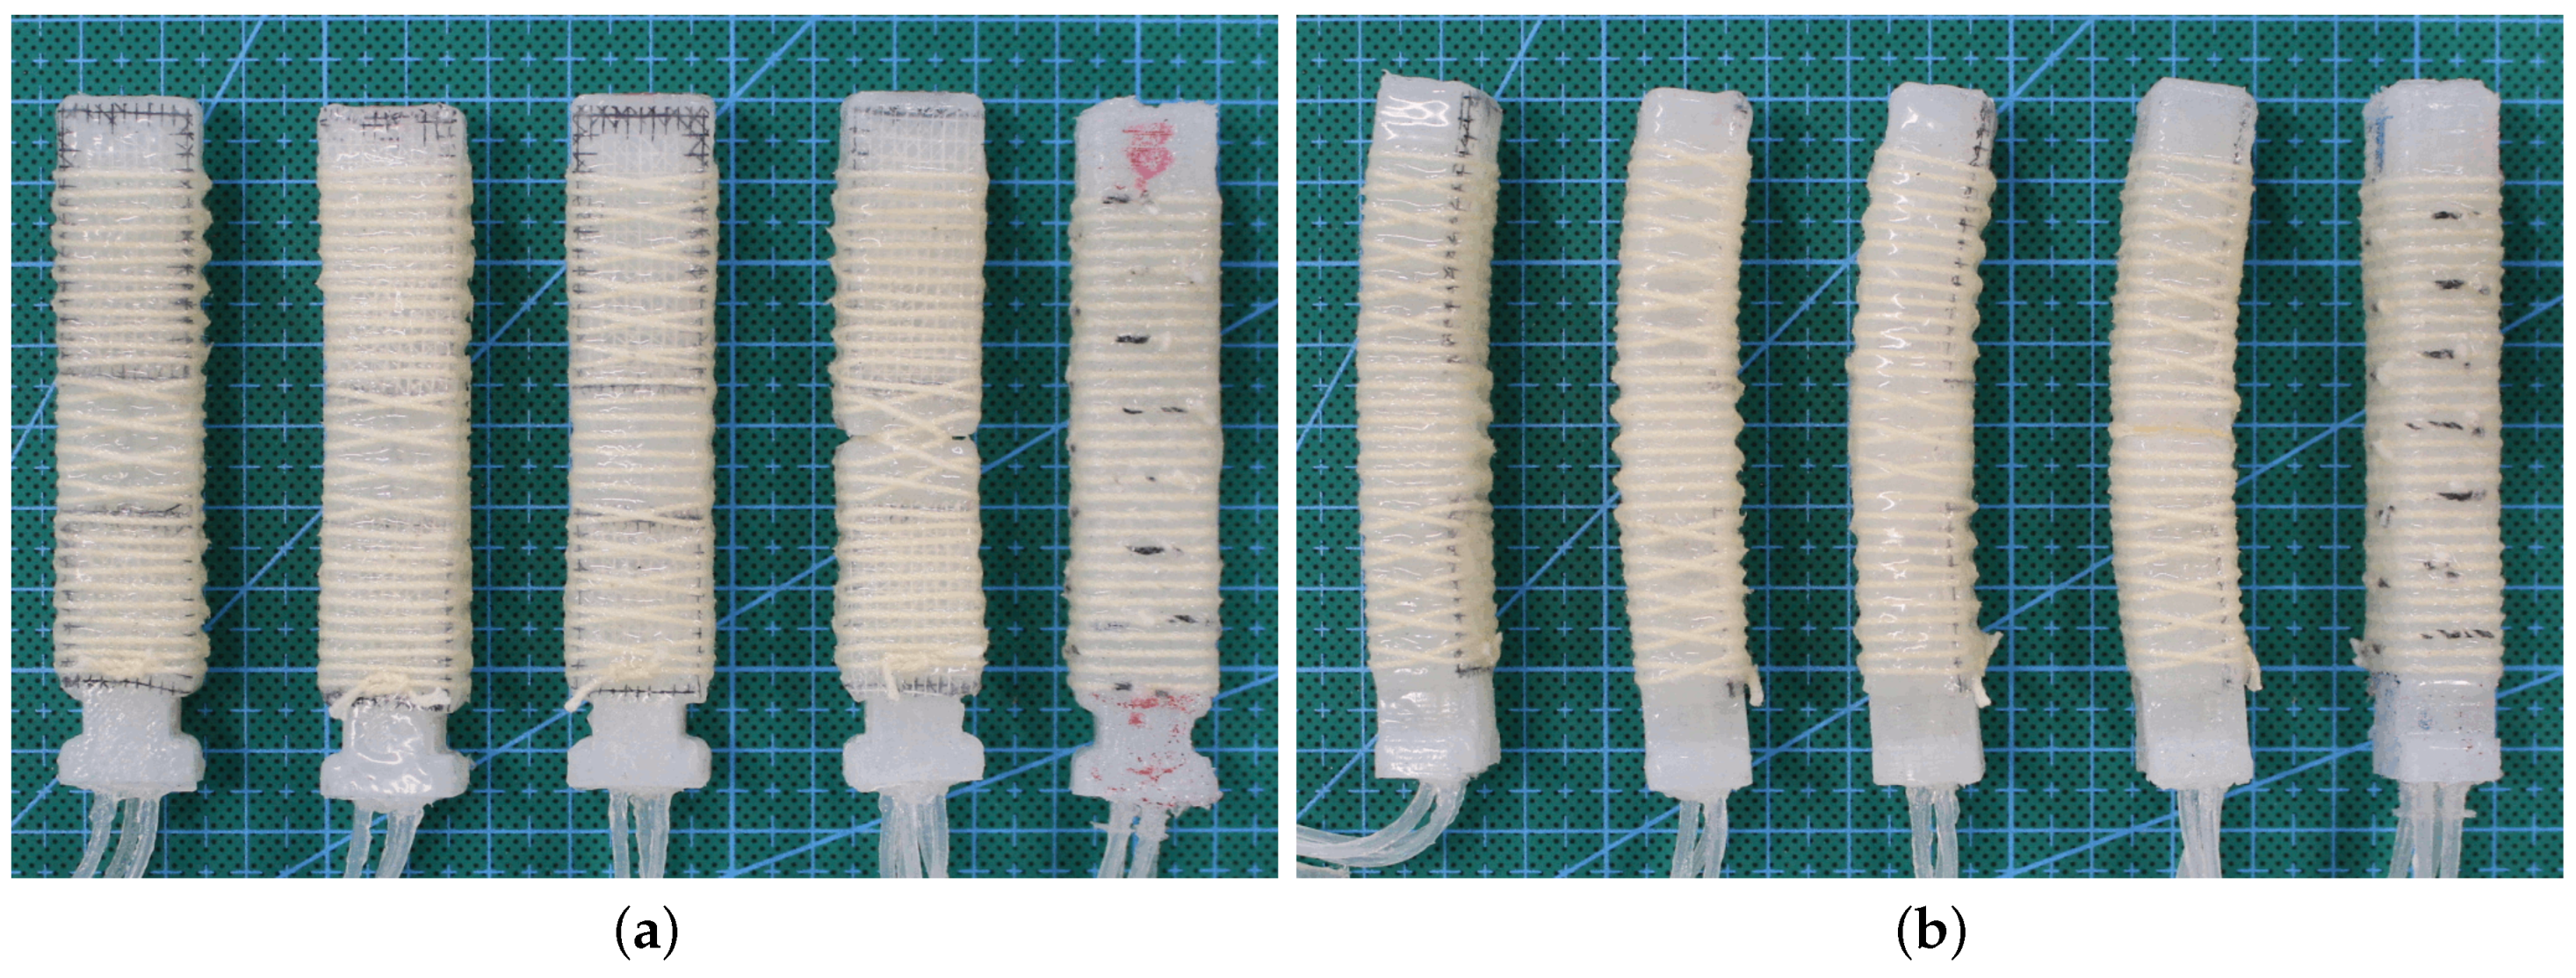
3.1. Fabrication
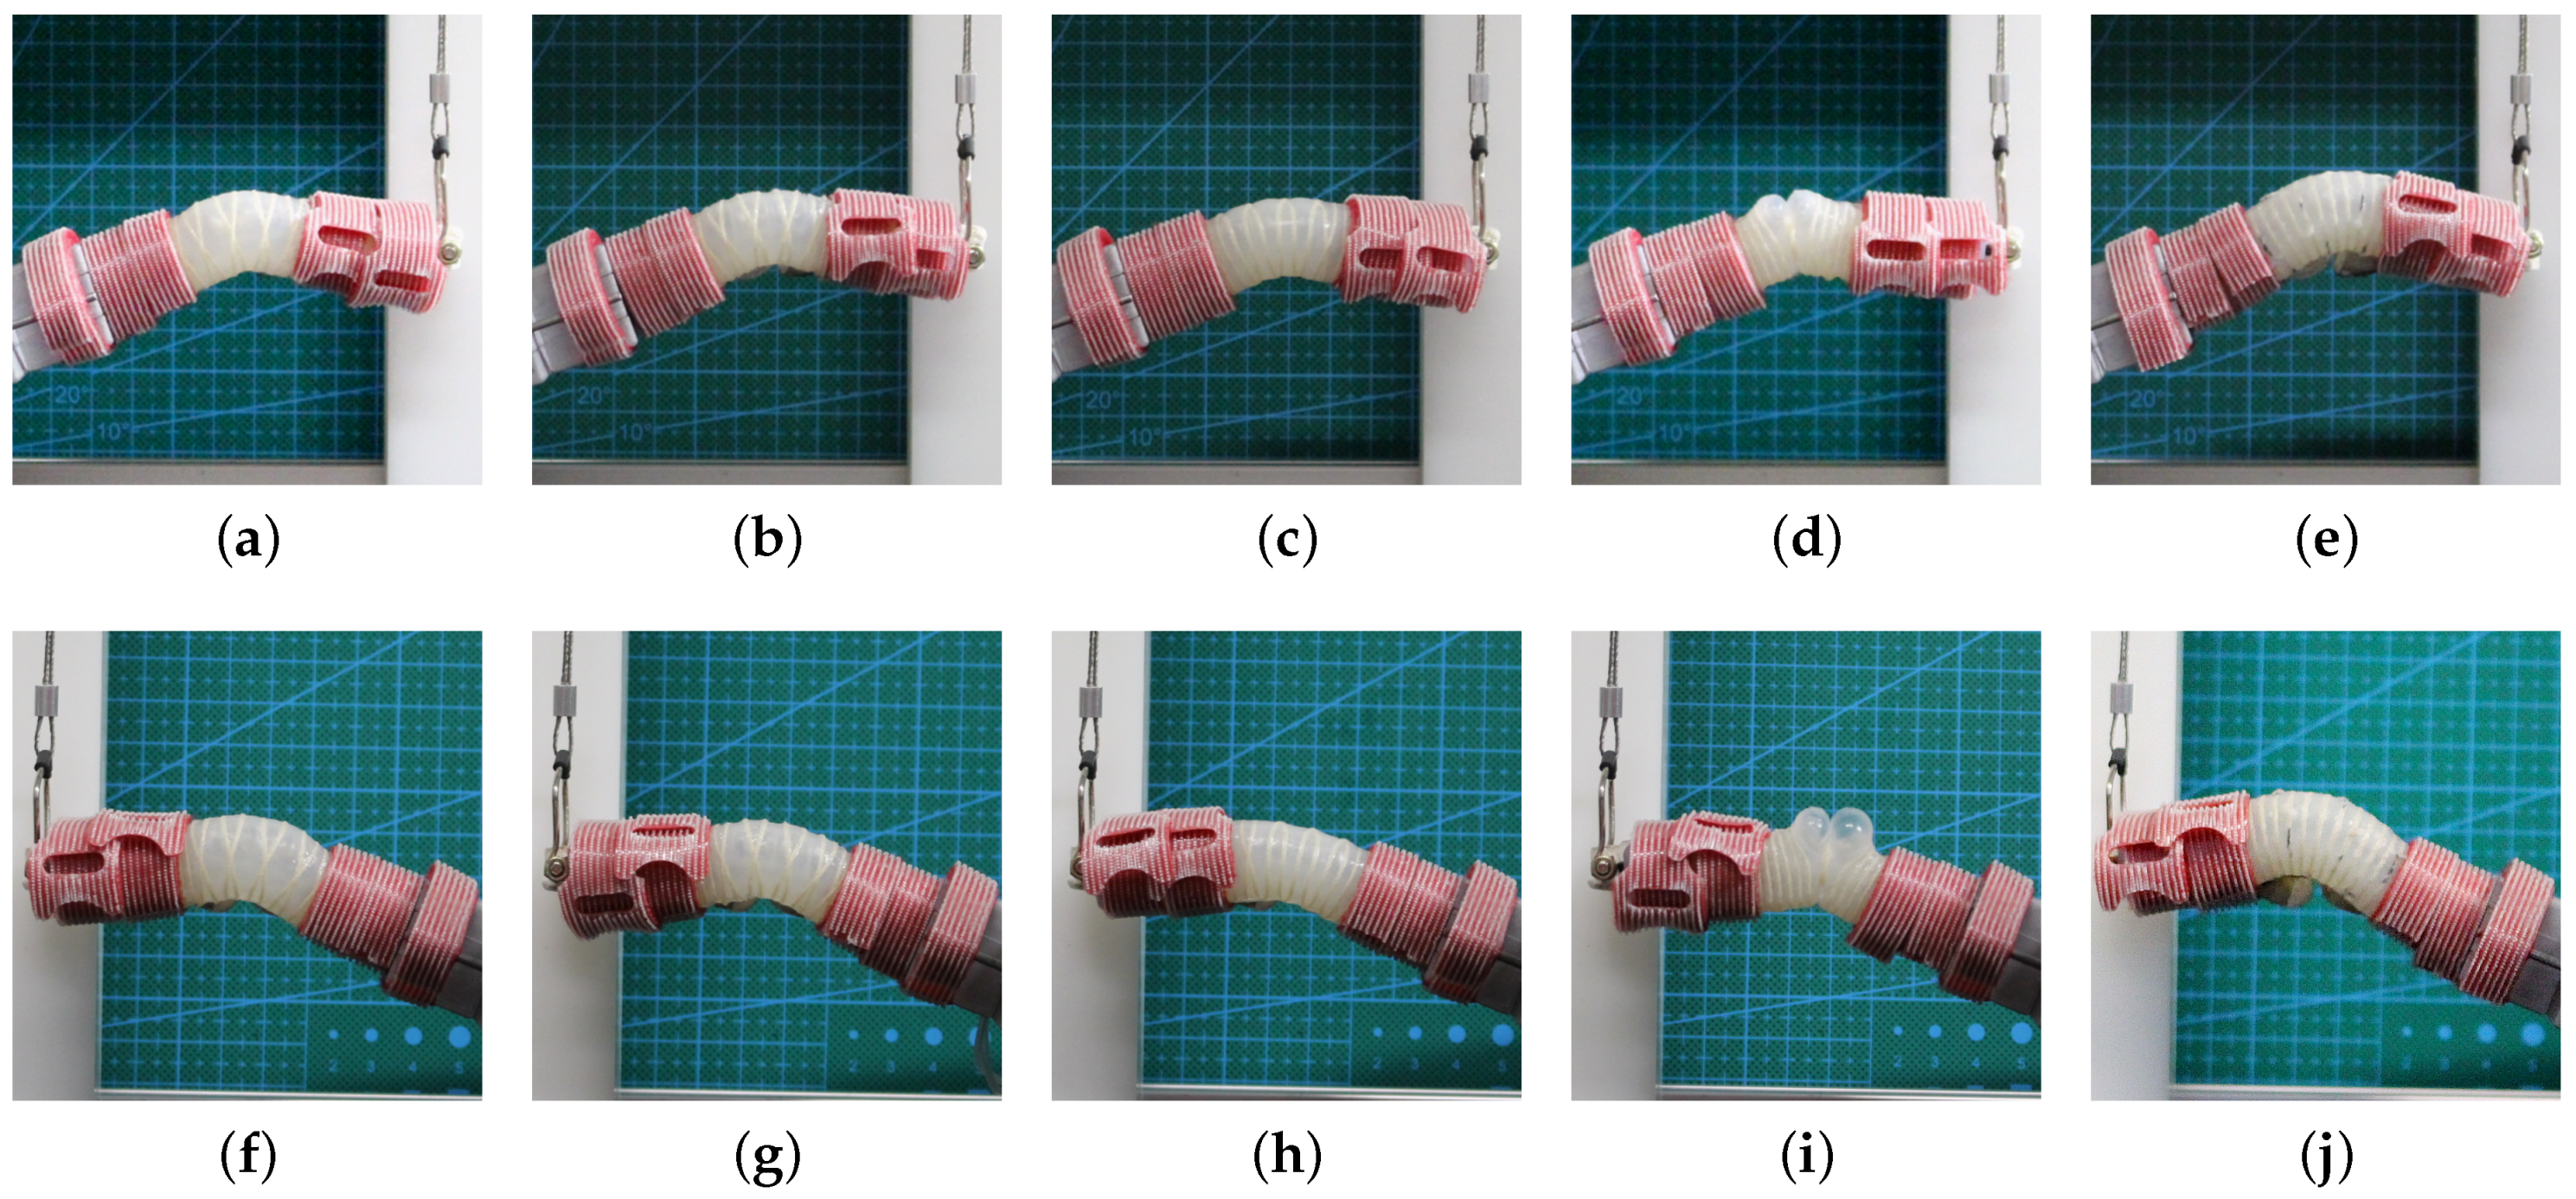
3.2. Trajectory Measurements
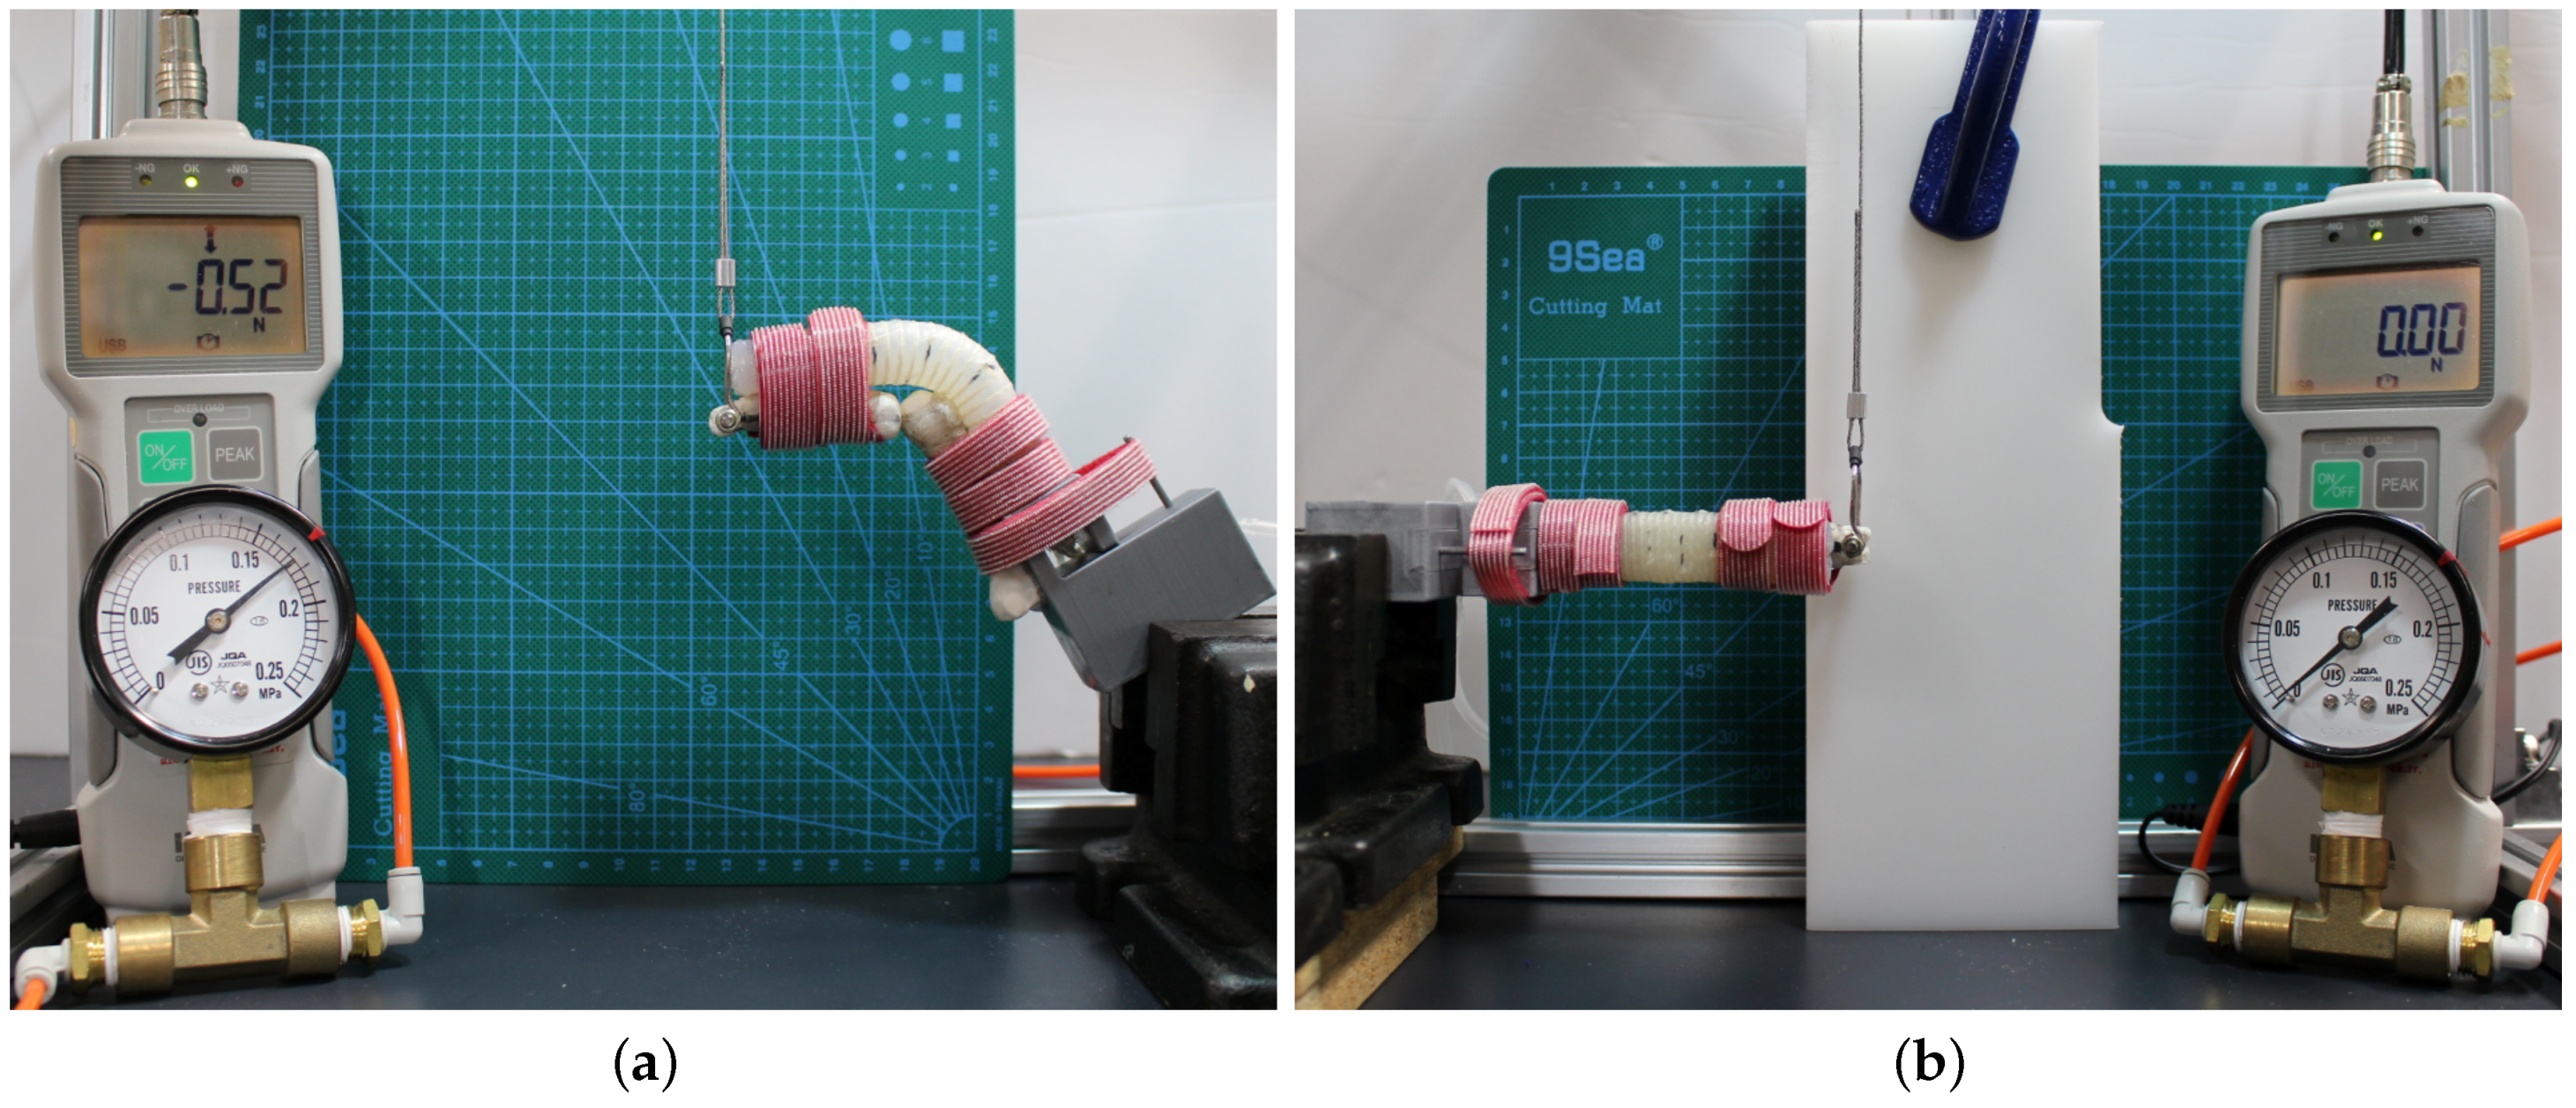
3.3. Torque Measurements
4. Results
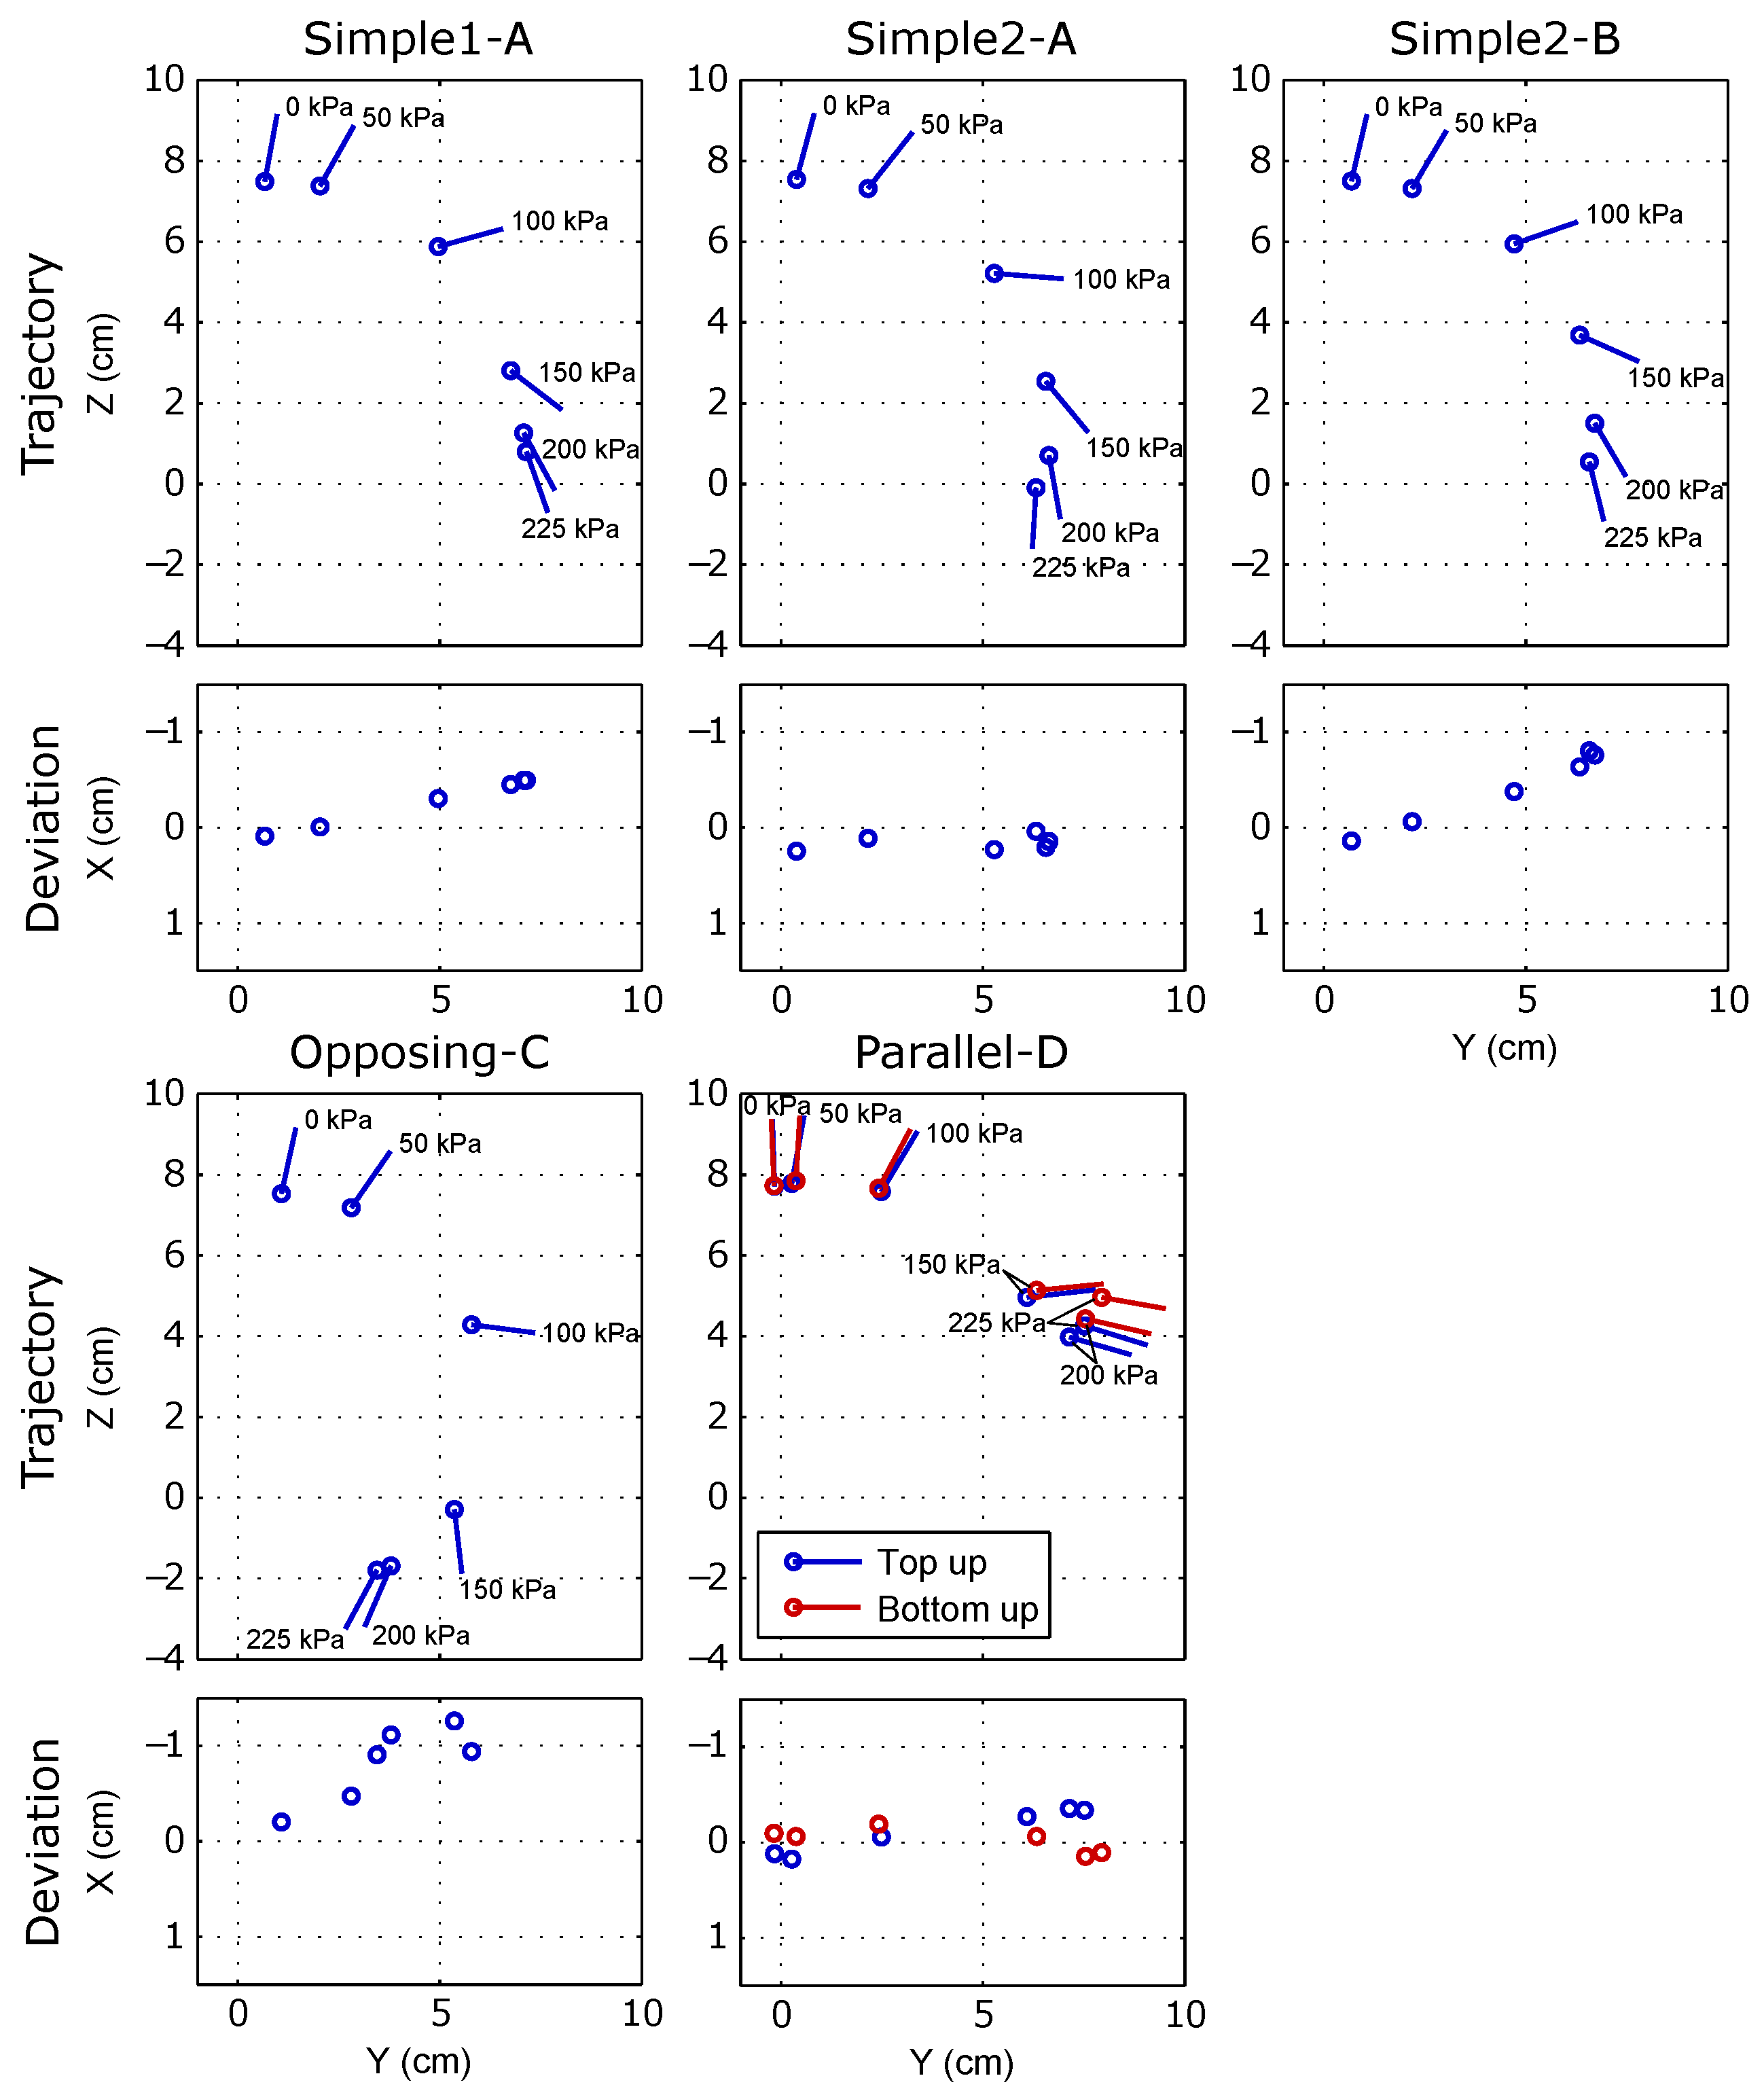
4.1. Trajectory, Flexion
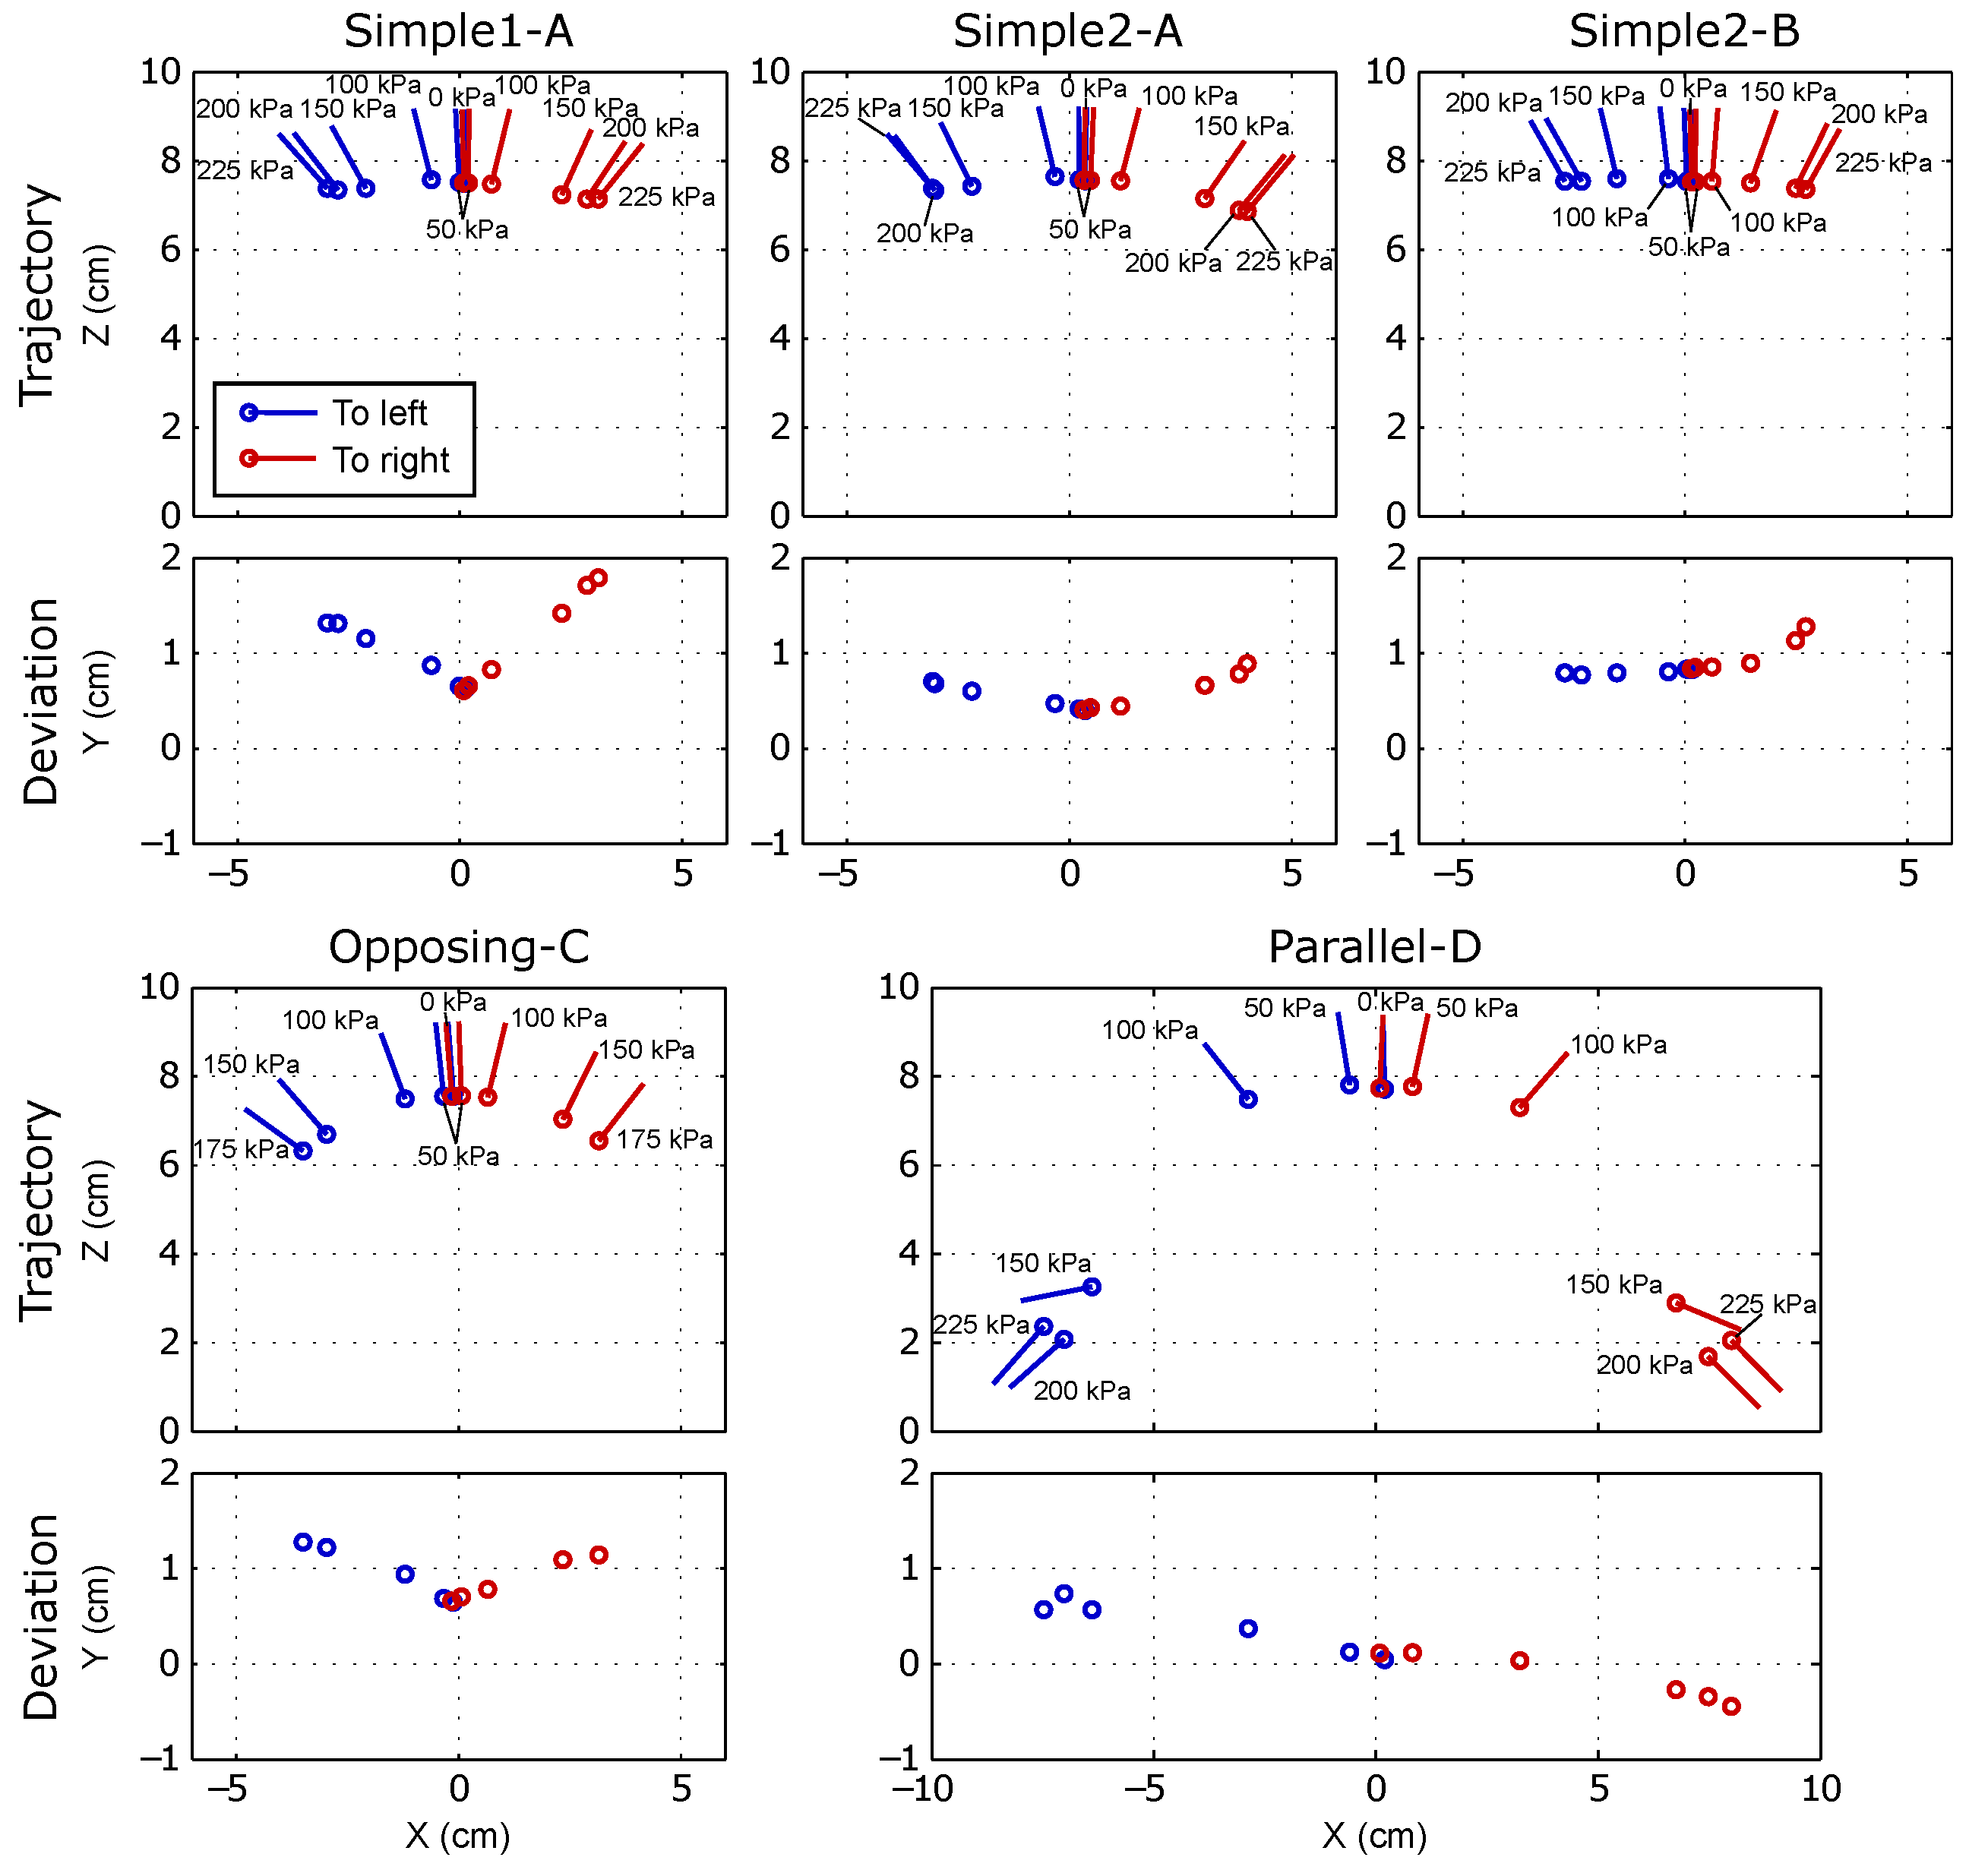
4.2. Trajectory, Abduction-Adduction
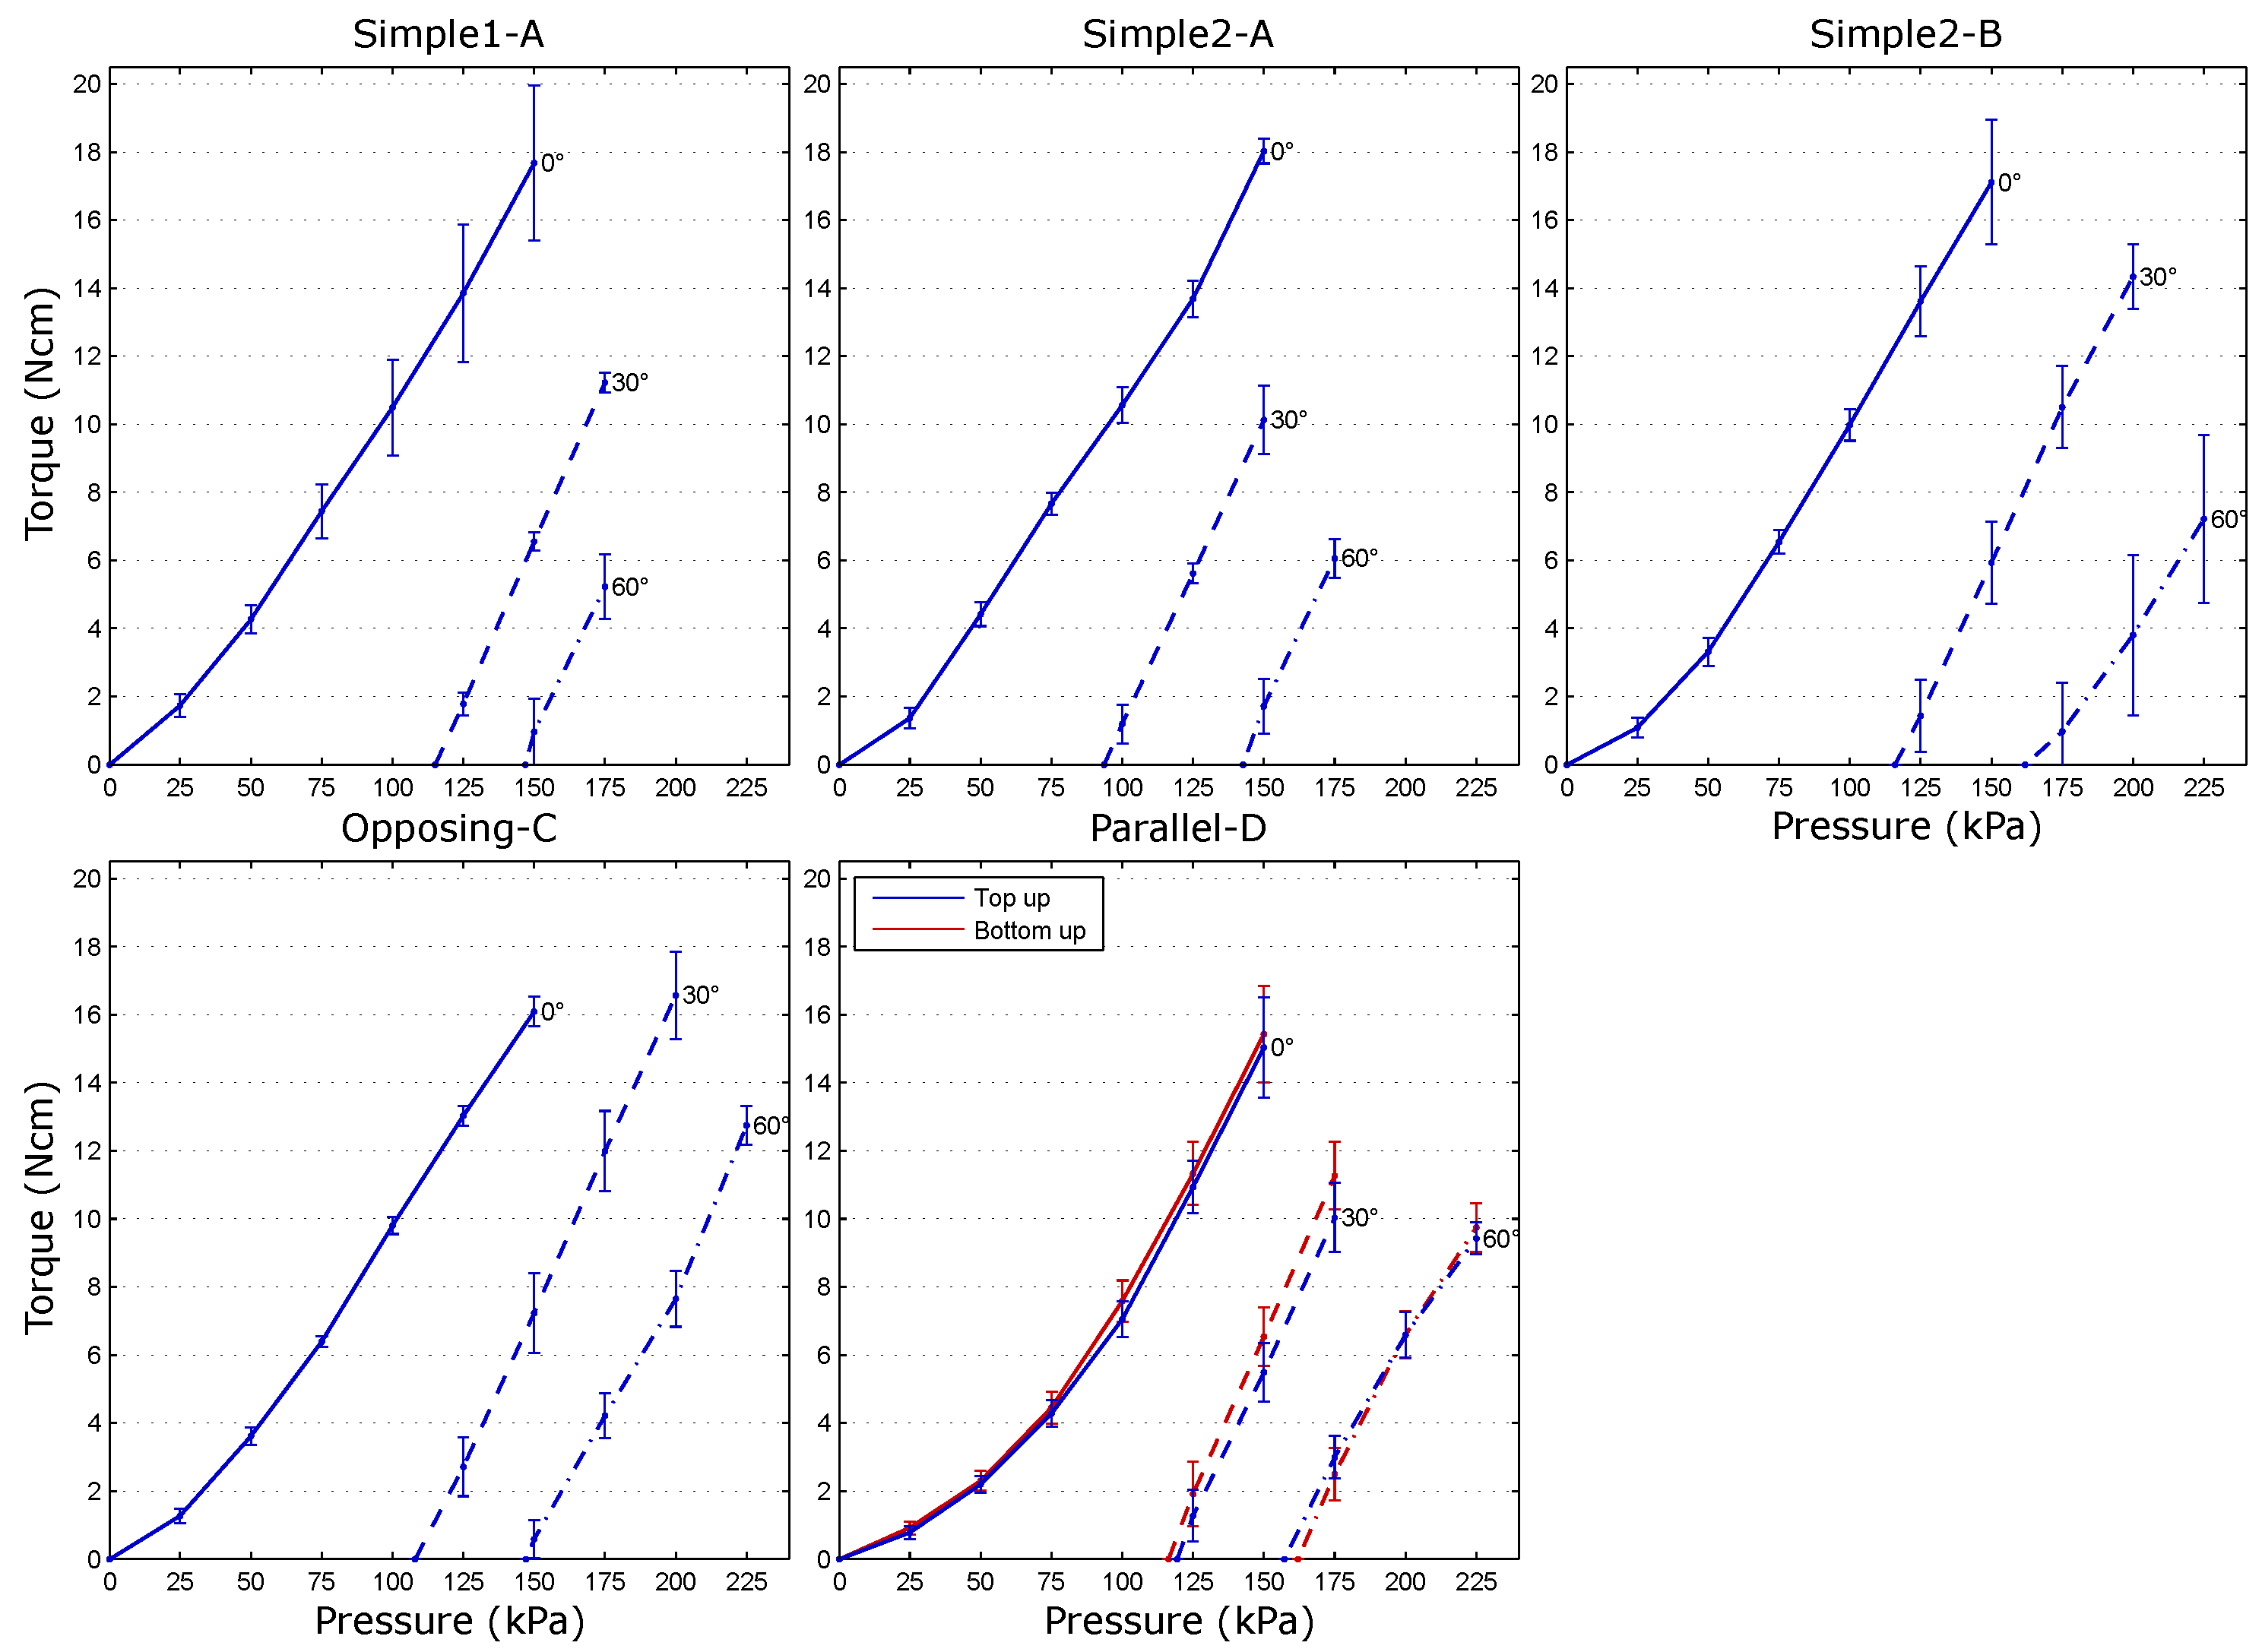
4.3. Torque, Flexion
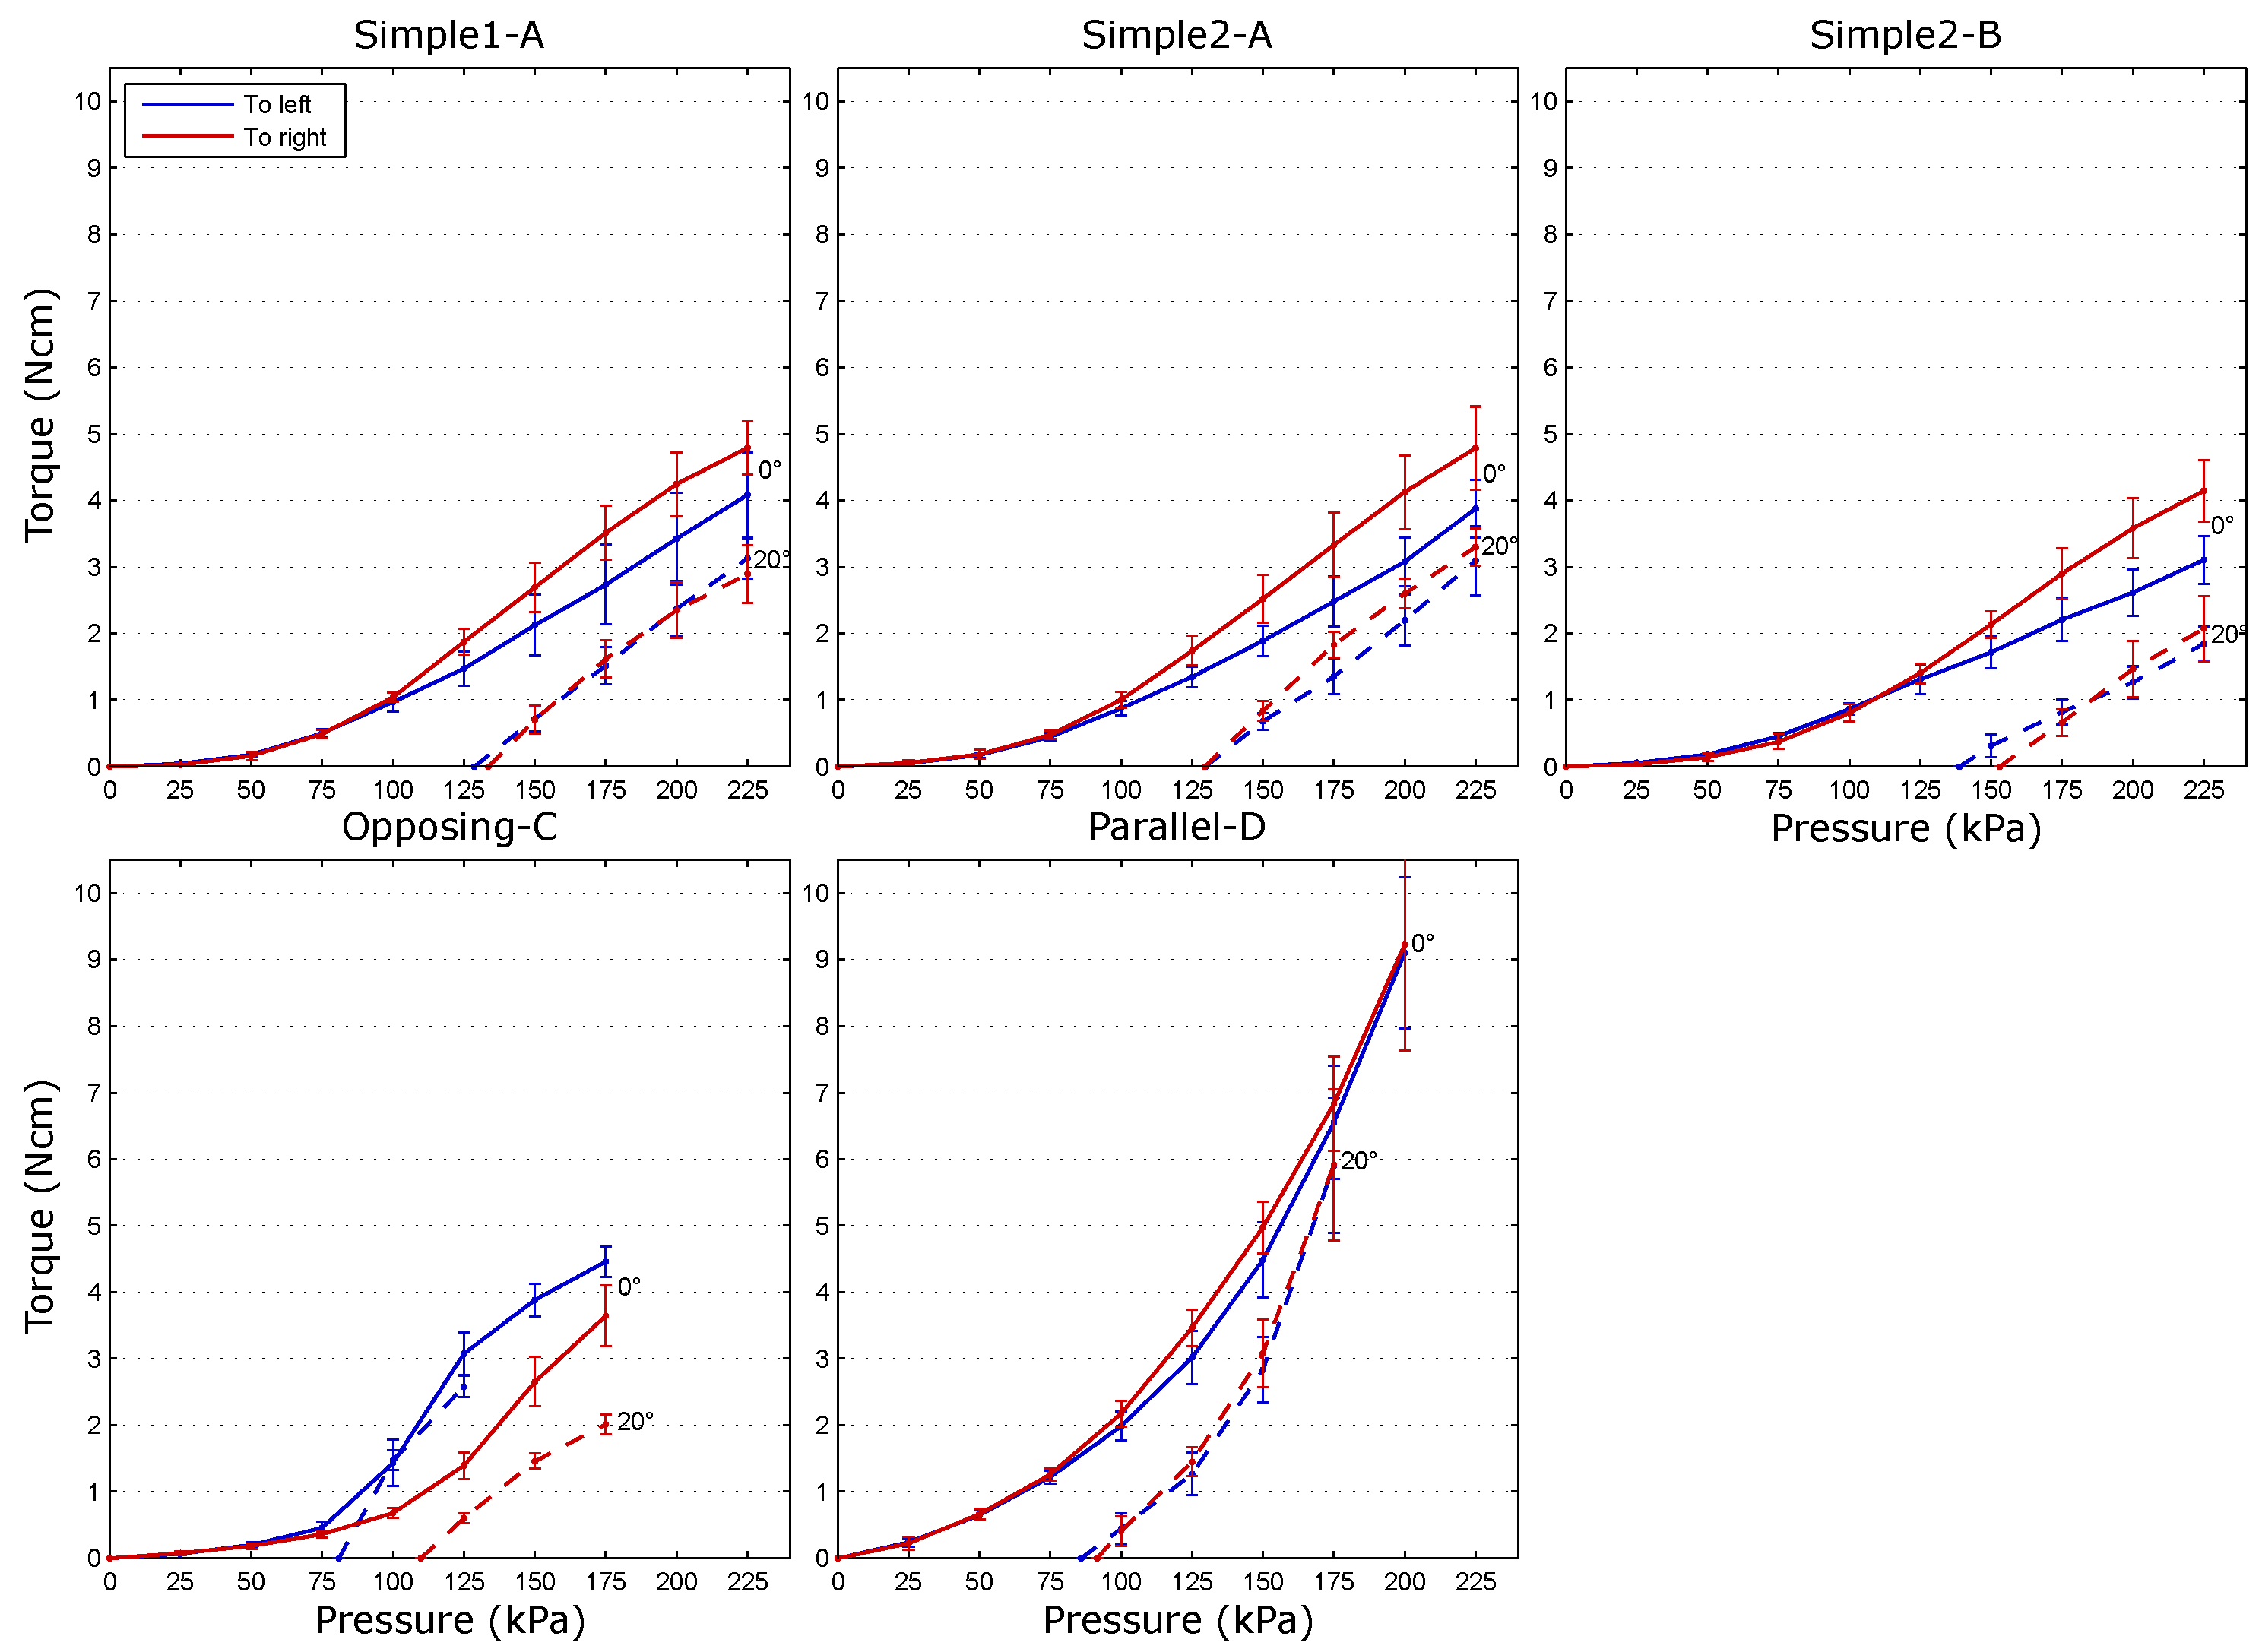
4.4. Torque, Abduction-Adduction
5. Discussion
5.1. Comparison of Prototype Performance
5.1.1. Coupling between Actuator Functions
5.1.2. Range of Motion and Torque
5.1.3. Safety and Reliability
5.2. Actuator Structure Improvements
5.2.1. Simple Side-Pockets
5.2.2. Opposing Side-Pockets
5.2.3. Parallel Pockets
5.3. Future Work
6. Conclusions
Supplementary Materials
Acknowledgments
Author Contributions
Conflicts of Interest
Abbreviations
| MCP | Metacarpophalangeal (joint) |
| IP | Interphalangeal (joint) |
| DoA | Degree of Actuation |
| DoF | Degree of Freedom |
References
- Heo, P.; Gu, G.M.; Lee, S.J.; Rhee, K.; Kim, J. Current hand exoskeleton technologies for rehabilitation and assistive engineering. Int. J. Precis. Eng. Manuf. 2012, 13, 807–824. [Google Scholar] [CrossRef]
- Lum, P.S.; Godfrey, S.B.; Brokaw, E.B.; Holley, R.J.; Nichols, D. Robotic approaches for rehabilitation of hand function after stroke. Am. J. Phys. Med. Rehabil. 2012, 91, S242–S254. [Google Scholar] [CrossRef] [PubMed]
- Maciejasz, P.; Eschweiler, J.; Gerlach-Hahn, K.; Jansen-Troy, A.; Leonhardt, S. A survey on robotic devices for upper limb rehabilitation. J. NeuroEng. Rehabil. 2014, 11. [Google Scholar] [CrossRef] [PubMed] [Green Version]
- Volpe, B.T.; Ferraro, M.; Lynch, D.; Christos, P.; Krol, J.; Trudell, C.; Krebs, H.I.; Hogan, N. Robotics and other devices in the treatment of patients recovering from stroke. Curr. Neurol. Neurosci. Rep. 2005, 5, 465–470. [Google Scholar] [CrossRef] [PubMed]
- Abidi, H.; Cianchetti, M. On intrinsic safety of soft robots. Front. Robot. AI 2017, 4. [Google Scholar] [CrossRef]
- Rus, D.; Tolley, M.T. Design, fabrication and control of soft robots. Nature 2015, 521, 467–475. [Google Scholar] [CrossRef] [PubMed]
- Belforte, G.; Eula, G.; Ivanov, A.; Sirolli, S. Soft pneumatic actuators for rehabilitation. Actuators 2014, 3, 84–106. [Google Scholar] [CrossRef]
- Kang, B.B.; Lee, H.; In, H.; Jeong, U.; Chung, J.; Cho, K.J. Development of a polymer-based tendon-driven wearable robotic hand. In Proceedings of the IEEE International Conference on Robotics and Automation (ICRA), Stockholm, Sweden, 16–21 May 2016; pp. 3750–3755. [Google Scholar]
- Park, Y.L.; Santos, J.; Galloway, K.G.; Goldfield, E.C.; Wood, R.J. A soft wearable robotic device for active knee motions using flat pneumatic artificial muscles. In Proceedings of the 2014 IEEE International Conference on Robotics and Automation (ICRA), Hong Kong, China, 31 May–7 June 2014; pp. 4805–4810. [Google Scholar]
- Zhao, H.; Li, Y.; Elsamadisi, A.; Shepherd, R. Scalable manufacturing of high force wearable soft actuators. Extreme Mech. Lett. 2015, 3, 89–104. [Google Scholar] [CrossRef]
- Moore, H.; Nichols, C.; Engles, M.L. Orthopaedic Physical Therapy; Churchill Livingstone: New York, NY, USA, 2009; Chapter 1; pp. 16–20. [Google Scholar]
- Noritsugu, T.; Takaiwa, M.; Sasaki, D. Power assist wear driven with pneumatic rubber artificial muscles. In Proceedings of the 15th International Conference on Mechatronics and Machine Vision in Practice, Auckland, New Zealand, 2–4 December 2008; pp. 539–544. [Google Scholar]
- Polygerinos, P.; Wang, Z.; Galloway, K.C.; Wood, R.J.; Walsh, C.J. Soft robotic glove for combined assistance and at-home rehabilitation. Robot. Auton. Syst. 2015, 73, 135–143. [Google Scholar] [CrossRef]
- Yap, H.K.; Khin, P.M.; Koh, T.H.; Sun, Y.; Liang, X.; Lim, J.H.; Yeow, C.H. A fully fabric-based bidirectional soft robotic glove for assistance and rehabilitation of hand impaired patients. IEEE Robot. Autom. Lett. 2017, 2, 1383–1390. [Google Scholar] [CrossRef]
- Gerboni, G.; Ranzani, T.; Diodato, A.; Ciuti, G.; Cianchetti, M.; Menciassi, A. Modular soft mechatronic manipulator for minimally invasive surgery (MIS): Overall architecture and development of a fully integrated soft module. Meccanica 2015, 50, 2865–2878. [Google Scholar] [CrossRef]
- Deimel, R.; Brock, O. A novel type of compliant and underactuated robotic hand for dexterous grasping. Int. J. Robot. Res. 2016, 35, 161–185. [Google Scholar] [CrossRef]
- Yap, H.K.; Lim, J.H.; Nasrallah, F.; Goh, J.C.H.; Yeow, C.H. A soft exoskeleton for hand assistive and rehabilitation application using pneumatic actuators with variable stiffness. In Proceedings of the 2015 IEEE International Conference on Robotics and Automation (ICRA), Seattle, WA, USA, 26–30 May 2015; pp. 4967–4972. [Google Scholar]
- Tarvainen, T.V.J.; Yu, W. Preliminary results on multi-pocket pneumatic elastomer actuators for human–robot interface in hand rehabilitation. In Proceedings of the 2015 IEEE International Conference on Robotics and Biomimetics (ROBIO), Zhuhai, China, 6–9 December 2015; pp. 2635–2639. [Google Scholar]
- Howell, L.L. Compliant Mechanisms; John Wiley & Sons: New York, NY, USA, 2001. [Google Scholar]
- Polygerinos, P.; Wang, Z.; Overvelde, J.T.B.; Galloway, K.C.; Wood, R.J.; Bertoldi, K.; Walsh, C.J. Modeling of soft fiber-reinforced bending actuators. IEEE Trans. Robot. 2015, 31, 778–789. [Google Scholar] [CrossRef]
- Udupa, G.; Sreedharan, P.; Dinesh, P.S.; Kim, D. Asymmetric bellow flexible pneumatic actuator for miniature robotic soft gripper. J. Robot. 2014, 2014. [Google Scholar] [CrossRef]
- Connolly, F.; Walsh, C.J.; Bertoldi, K. Automatic design of fiber-reinforced soft actuators for trajectory matching. Proc. Nat. Acad. Sci. USA 2017, 114, 51–56. [Google Scholar] [CrossRef] [PubMed]
- Connolly, F.; Polygerinos, P.; Walsh, C.J.; Bertoldi, K. Mechanical programming of soft actuators by varying fiber angle. Soft Robot. 2015, 2, 26–32. [Google Scholar] [CrossRef]
- Bishop-Moser, J.; Krishnan, G.; Kim, C.; Kota, S. Design of soft robotic actuators using fluid-filled fiber-reinforced elastomeric enclosures in parallel combinations. In Proceedings of the IEEE/RSJ International Conference on Intelligent Robots and Systems (IROS), Vilamoura, Portugal, 7–12 October 2012; pp. 4264–4269. [Google Scholar]
- Galloway, K.C.; Polygerinos, P.; Walsh, C.J.; Wood, R.J. Mechanically programmable bend radius for fiber-reinforced soft actuators. In Proceedings of the 16th International Conference on Advanced Robotics (ICAR), Montevideo, Uruguay, 25–29 November 2013; pp. 1–6. [Google Scholar]
- Hume, M.C.; Gellman, H.; McKellop, H.; Brumfield, R.H., Jr. Functional range of motion of the joints of the hand. J. Hand Surg. 1990, 15, 240–243. [Google Scholar] [CrossRef]
- Bishop, H.J.; Montgomery, J. Daniels and Worthingham’s Muscle Testing, 8th ed.; Saunders Elsevier: St. Louis, MO, USA, 2007. [Google Scholar]
- Kawasaki, H.; Kimura, H.; Ito, S.; Nishimoto, Y.; Hayashi, H.; Sakaeda. Hand rehabilitation support system based on self-motion control, with a clinical case report. In Proceedings of the 2006 World Automation Congress, Budapest, Hungary, 24–26 July 2006; pp. 1–6. [Google Scholar]
- Buryanov, A.; Kotiuk, V. Proportions of hand segments. Int. J. Morphol. 2010, 28, 755–758. [Google Scholar] [CrossRef]
- Galloway, K.C.; Becker, K.P.; Phillips, B.; Kirby, J.; Licht, S.; Tchernov, D.; Wood, R.J.; Gruber, D.F. Soft robotic grippers for biological sampling on deep reefs. Soft Robot. 2016, 3, 23–33. [Google Scholar] [CrossRef] [PubMed]
- Marchese, A.D.; Katzschmann, R.K.; Rus, D. A recipe for soft fluidic elastomer robots. Soft Robot. 2015, 2, 7–25. [Google Scholar] [CrossRef] [PubMed]
- Thingiverse. Available online: http://www.thingiverse.com/ (accessed on 14 March 2017).
- Ueki, S.; Kawasaki, H.; Ito, S.; Nishimoto, Y.; Abe, M.; Aoki, T.; Ishigure, Y.; Ojika, T.; Mouri, T. Development of a hand-assist robot with multi-degrees-of-freedom for rehabilitation therapy. IEEE/ASME Trans. Mechatron. 2012, 17, 136–146. [Google Scholar] [CrossRef]
- Cianchetti, M.; Ranzani, T.; Gerboni, G.; Falco, I.D.; Laschi, C.; Menciassi, A. STIFF-FLOP surgical manipulator: Mechanical design and experimental characterization of the single module. In Proceedings of the IEEE/RSJ International Conference on Intelligent Robots and Systems (IROS), Tokyo, Japan, 3–7 November 2013; pp. 3576–3581. [Google Scholar]
- Wall, V.; Deimel, R.; Brock, O. Selective stiffening of soft actuators based on jamming. In Proceedings of the 2015 IEEE International Conference on Robotics and Automation (ICRA), Seattle, WA, USA, 26–30 May 2015; pp. 252–257. [Google Scholar]
- Shepherd, R.F.; Stokes, A.A.; Nunes, R.M.D.; Whitesides, G.M. Soft machines that are resistant to puncture and that self seal. Adv. Mater. 2013, 25, 6709–6713. [Google Scholar] [CrossRef] [PubMed]


| Simple1-A | Simple2-A | Simple2-B | Opposing-C | Parallel-D | |
|---|---|---|---|---|---|
| Top Up/Bottom Up | |||||
| Flexion RoM | 160 | 184 | 166 | 208 | /103 |
| Simple1-A | Simple2-A | Simple2-B | Opposing-C | Parallel-D | |
|---|---|---|---|---|---|
| Abd-Add RoM to left | 42 | 40 | 30 | 54 | 139 |
| Abd-Add RoM to right | 39 | 40 | 30 | 38 | 135 |
| Simple1-A | Simple2-A | Simple2-B | Opposing-C | Parallel-D | ||
|---|---|---|---|---|---|---|
| Top Up/Bottom Up | ||||||
| Flexion 0 | 17.68 | 18.04 | 17.12 | 16.10 | 15.03/15.43 | (Ncm) |
| Flexion 30 | 11.23 | 10.13 | 14.34 | 16.57 | 10.04/11.26 | (Ncm) |
| Flexion 60 | 5.23 | 6.06 | 7.22 | 7.64 | 9.42/9.75 | (Ncm) |
| Simple1-A | Simple2-A | Simple2-B | Opposing-C | Parallel-D | ||
|---|---|---|---|---|---|---|
| Left/Right | Left/Right | Left/Right | Left/Right | Left/Right | ||
| Abd-Add 0 | 4.08/4.79 | 3.87/4.79 | 3.11/4.14 | 4.46/3.64 | 9.10/9.23 | (Ncm) |
| Abd-Add 20 | 3.13/2.89 | 3.09/3.30 | 1.85/2.07 | 2.58/2.01 | 5.90/5.91 | (Ncm) |
| Prototype | Advantages | Disadvantages | Coupling between Functions |
|---|---|---|---|
| Simple1-A | N/A | Gaps in reinforcements cause ballooning; wide radial expansion | High |
| Simple2-A | Strong structure; limited radial expansion | Gaps in reinforcements cause ballooning | Medium |
| Simple2-B | N/A | Reinforcement alignment weakens output and causes deviation to left in flexion | High |
| Opposing-C | Pivot-like sideways response; strong flexion | Excessive ballooning of side-pockets; sideways flexibility; asymmetric response | High |
| Parallel-D | 360 control; potential to adapt to thumb support | Excessive length extension | Low |
© 2017 by the authors. Licensee MDPI, Basel, Switzerland. This article is an open access article distributed under the terms and conditions of the Creative Commons Attribution (CC BY) license (http://creativecommons.org/licenses/by/4.0/).
Share and Cite
Tarvainen, T.V.J.; Yu, W. Pneumatic Multi-Pocket Elastomer Actuators for Metacarpophalangeal Joint Flexion and Abduction-Adduction. Actuators 2017, 6, 27. https://doi.org/10.3390/act6030027
Tarvainen TVJ, Yu W. Pneumatic Multi-Pocket Elastomer Actuators for Metacarpophalangeal Joint Flexion and Abduction-Adduction. Actuators. 2017; 6(3):27. https://doi.org/10.3390/act6030027
Chicago/Turabian StyleTarvainen, Tapio Veli Juhani, and Wenwei Yu. 2017. "Pneumatic Multi-Pocket Elastomer Actuators for Metacarpophalangeal Joint Flexion and Abduction-Adduction" Actuators 6, no. 3: 27. https://doi.org/10.3390/act6030027
APA StyleTarvainen, T. V. J., & Yu, W. (2017). Pneumatic Multi-Pocket Elastomer Actuators for Metacarpophalangeal Joint Flexion and Abduction-Adduction. Actuators, 6(3), 27. https://doi.org/10.3390/act6030027