Article

Nonlinearity Characterization of Flexible Hinge Piezoelectric Stages Under Dynamic Preload via a Force-Dependent Prandtl–Ishlinskii Model with a Force-Analyzed Finite Element Method

1
Academy for Engineering and Technology, Fudan University, Shanghai 200433, China
2
School of Mechanical Engineering, Shenyang Jianzhu University, Shenyang 110168, China
3
College of Integrated Circuits and Micro-Nano Electronics, Fudan University, Shanghai 200433, China
4
College of Tropical Crop Science, Yunnan Agricultural University, Pu’er 665099, China
*
Authors to whom correspondence should be addressed.
Actuators 2025, 14(8), 411; https://doi.org/10.3390/act14080411
Submission received: 19 July 2025 / Revised: 15 August 2025 / Accepted: 16 August 2025 / Published: 19 August 2025

Abstract

The operational performance of Flexible Hinge Piezoelectric Stages (FHPSs), essential components in precision engineering, is fundamentally constrained by the inherent hysteresis of the piezoelectric actuator (PEA). A significant deficiency in prevailing characterization methods is their failure to consider the dynamic nature of the mechanical preload exerted by the flexible hinge. This position-dependent preload induces substantial deviations in the PEA’s response characteristics, thereby compromising the predictive accuracy of conventional design frameworks. To address this limitation, this paper proposes a Force-Dependent Prandtl–Ishlinskii (FPI) model that explicitly formulates the PEA’s hysteretic behavior as a function of variable preload conditions. The FPI model is subsequently integrated into a comprehensive FPI-FFEM characterization framework. Within this framework, a Force-analyzed Finite Element Method (FFEM) is utilized to compute the dynamic preload throughout the actuator’s operational stroke. This information, notably neglected in conventional FEM analysis, is essential to the fidelity of the proposed FPI model. Experimental validation demonstrates the superior fidelity of the FPI model in comparison to the traditional PI model for tracking preload-induced nonlinearities. Furthermore, the complete FPI-FFEM framework exhibits substantially enhanced prediction accuracy relative to both conventional PI-FEM and advanced LDPI-FEM methodologies, as demonstrated by a significant reduction in the Mean Absolute Error (MAE).

1. Introduction

Flexible Hinge Piezoelectric Stages (FHPSs) are essential components in modern high-technology systems. They enable ultra-precision motion in devices like atomic force microscopes and micro-robotic manipulators [1,2,3]. These stages use a piezoelectric actuator (PEA) to provide fast, high-resolution displacement. A flexible hinge mechanism then guides and often amplifies this motion [4,5]. While these stages perform impressively, a significant challenge remains: accurately predicting their positioning behavior during the design phase. This difficulty arises from the complex, coupled relationship between the PEA and the flexible structure it drives.
The central problem is the PEA’s high sensitivity to multiple operating conditions. Its behavior is dominated by hysteresis, a nonlinear effect where the output displacement depends on the input voltage history [6,7]. This hysteresis is not static; it is also rate-dependent, meaning the shape and width of the hysteresis loop change with the driving signal’s frequency [8,9]. To add to this complexity, the PEA’s output is also highly sensitive to mechanical load. In a FHPS, this load is a variable reaction force, or preload, from the flexible hinge that changes with the stage’s position. This creates a fundamental electromechanical coupling. The actuator’s output determines the preload, and the preload modifies the actuator’s hysteresis. Conventional design and modeling approaches often overlook this complex feedback loop [10,11].
Current methods for FHPS analysis treat mechanical design and actuator modeling as separate tasks. Engineers use the Finite Element Method (FEM) to optimize the mechanical properties of the flexible hinge [12,13,14]. Meanwhile, they characterize the PEA’s hysteresis using phenomenological models like the Bouc–Wen (BW), Preisach, or Prandtl–Ishlinskii (PI) models [15,16,17,18]. While these foundational models are effective, the field continues to evolve. For example, recent research has produced advanced control strategies, like event-triggered adaptive control with modified PI models, to actively compensate for hysteresis and achieve high-performance trajectory tracking [19,20]. However, both classical models and advanced control schemes require system identification from an existing prototype. They do not solve the predictive challenge for a new design where the actuator’s dynamic, load-dependent behavior is unknown. This disconnect prevents engineers from predicting the final nonlinear performance before building a prototype, leading to costly and time-consuming design cycles.
To bridge this gap, this paper introduces an integrated predictive framework that unifies the analysis of the actuator and the flexible mechanism. Our primary contribution is the development of a Force-Dependent Prandtl–Ishlinskii (FPI) model. This model extends the classical PI framework to explicitly characterize how a PEA’s hysteresis loop changes with a variable external preload. Our second contribution is a holistic simulation methodology we term the FPI-Force-analyzed FEM (FPI-FFEM) framework. In this approach, a FEM simulation computes both the stage’s displacement and the corresponding reaction force from the hinge at every point in the actuator’s stroke. By feeding this dynamic force into the FPI model, our method can accurately predict the coupled, nonlinear behavior of the entire FHPS assembly. This provides a powerful new tool for analyzing and optimizing FHPS performance during the initial design phase.
The remainder of this paper is organized as follows. Section 2 details the development of the FPI model and the integrated FPI-FFEM framework. Section 3 presents the experimental setup and results, first validating the FPI model’s ability to capture load-dependent hysteresis and then verifying the accuracy of the complete FPI-FFEM method against a physical FHPS prototype. Finally, Section 4 provides concluding remarks and discusses future work.

2. The FPI-FFEM Method for Nonlinearity Characterization

This section establishes the proposed FPI-FFEM nonlinearity characterization method. It begins by reviewing the classical Prandtl–Ishlinskii (PI) model, then develops the FPI model to account for dynamic preload. Finally, it details the integration of the FPI model with the FFEM to achieve high-fidelity predictions of the complete stage behavior.

2.1. The Classical Prandtl–Ishlinskii Model

The Prandtl–Ishlinskii (PI) model is a powerful phenomenological tool for describing hysteresis, constructed through the weighted superposition of elementary hysteresis operators. For piezoelectric actuators (PEAs) driven by unipolar voltage, the one-sided play (OSP) operator is particularly suitable. The behavior of an OSP operator, denoted as y ( t ) = G r [ u ( t ) ] , as shown in Figure 1, is governed by the input voltage signal, u ( t ) , and a non-negative threshold, r. For a time interval [ 0 , t E ] partitioned by points 0 = t 0 < t 1 < < t N = t E such that u ( t ) is monotonic on each subinterval [ t j , t j + 1 ] , the operator’s output y ( t ) is defined recursively:
y ( 0 ) = G r [ u ( 0 ) ] = g r ( u ( 0 ) , y ( t 0 ) )
y ( t ) = G r [ u ( t ) ] = g r ( u ( t ) , y ( t i ) )     for   t i < t t i + 1
where the function g r ( u , y ) is given by the following:
g r ( u , y ) = max ( u r , min ( u , y ) )
The OSP operator’s output remains zero until the input u ( t ) exceeds the threshold r. Beyond this point, the output tracks the input. Upon a reversal in the input’s slope, the output holds its value until the input has decreased by an amount equal to the threshold r relative to the last extremum.
The complete PI model is then formulated by superimposing a series of these OSP operators, each with a unique threshold r i and a corresponding weight w i . The total predicted displacement, Y [ u ( t ) ] , is expressed as follows:
Y [ u ( t ) ] = w 0 u ( t ) + i = 1 n w i G r i [ u ( t ) ]
In Equation (4), n is the total number of OSP operators, and w 0 is a weighting coefficient for the linear component of the displacement.

2.2. Formulation of the Force Prandtl–Ishlinskii (FPI) Model

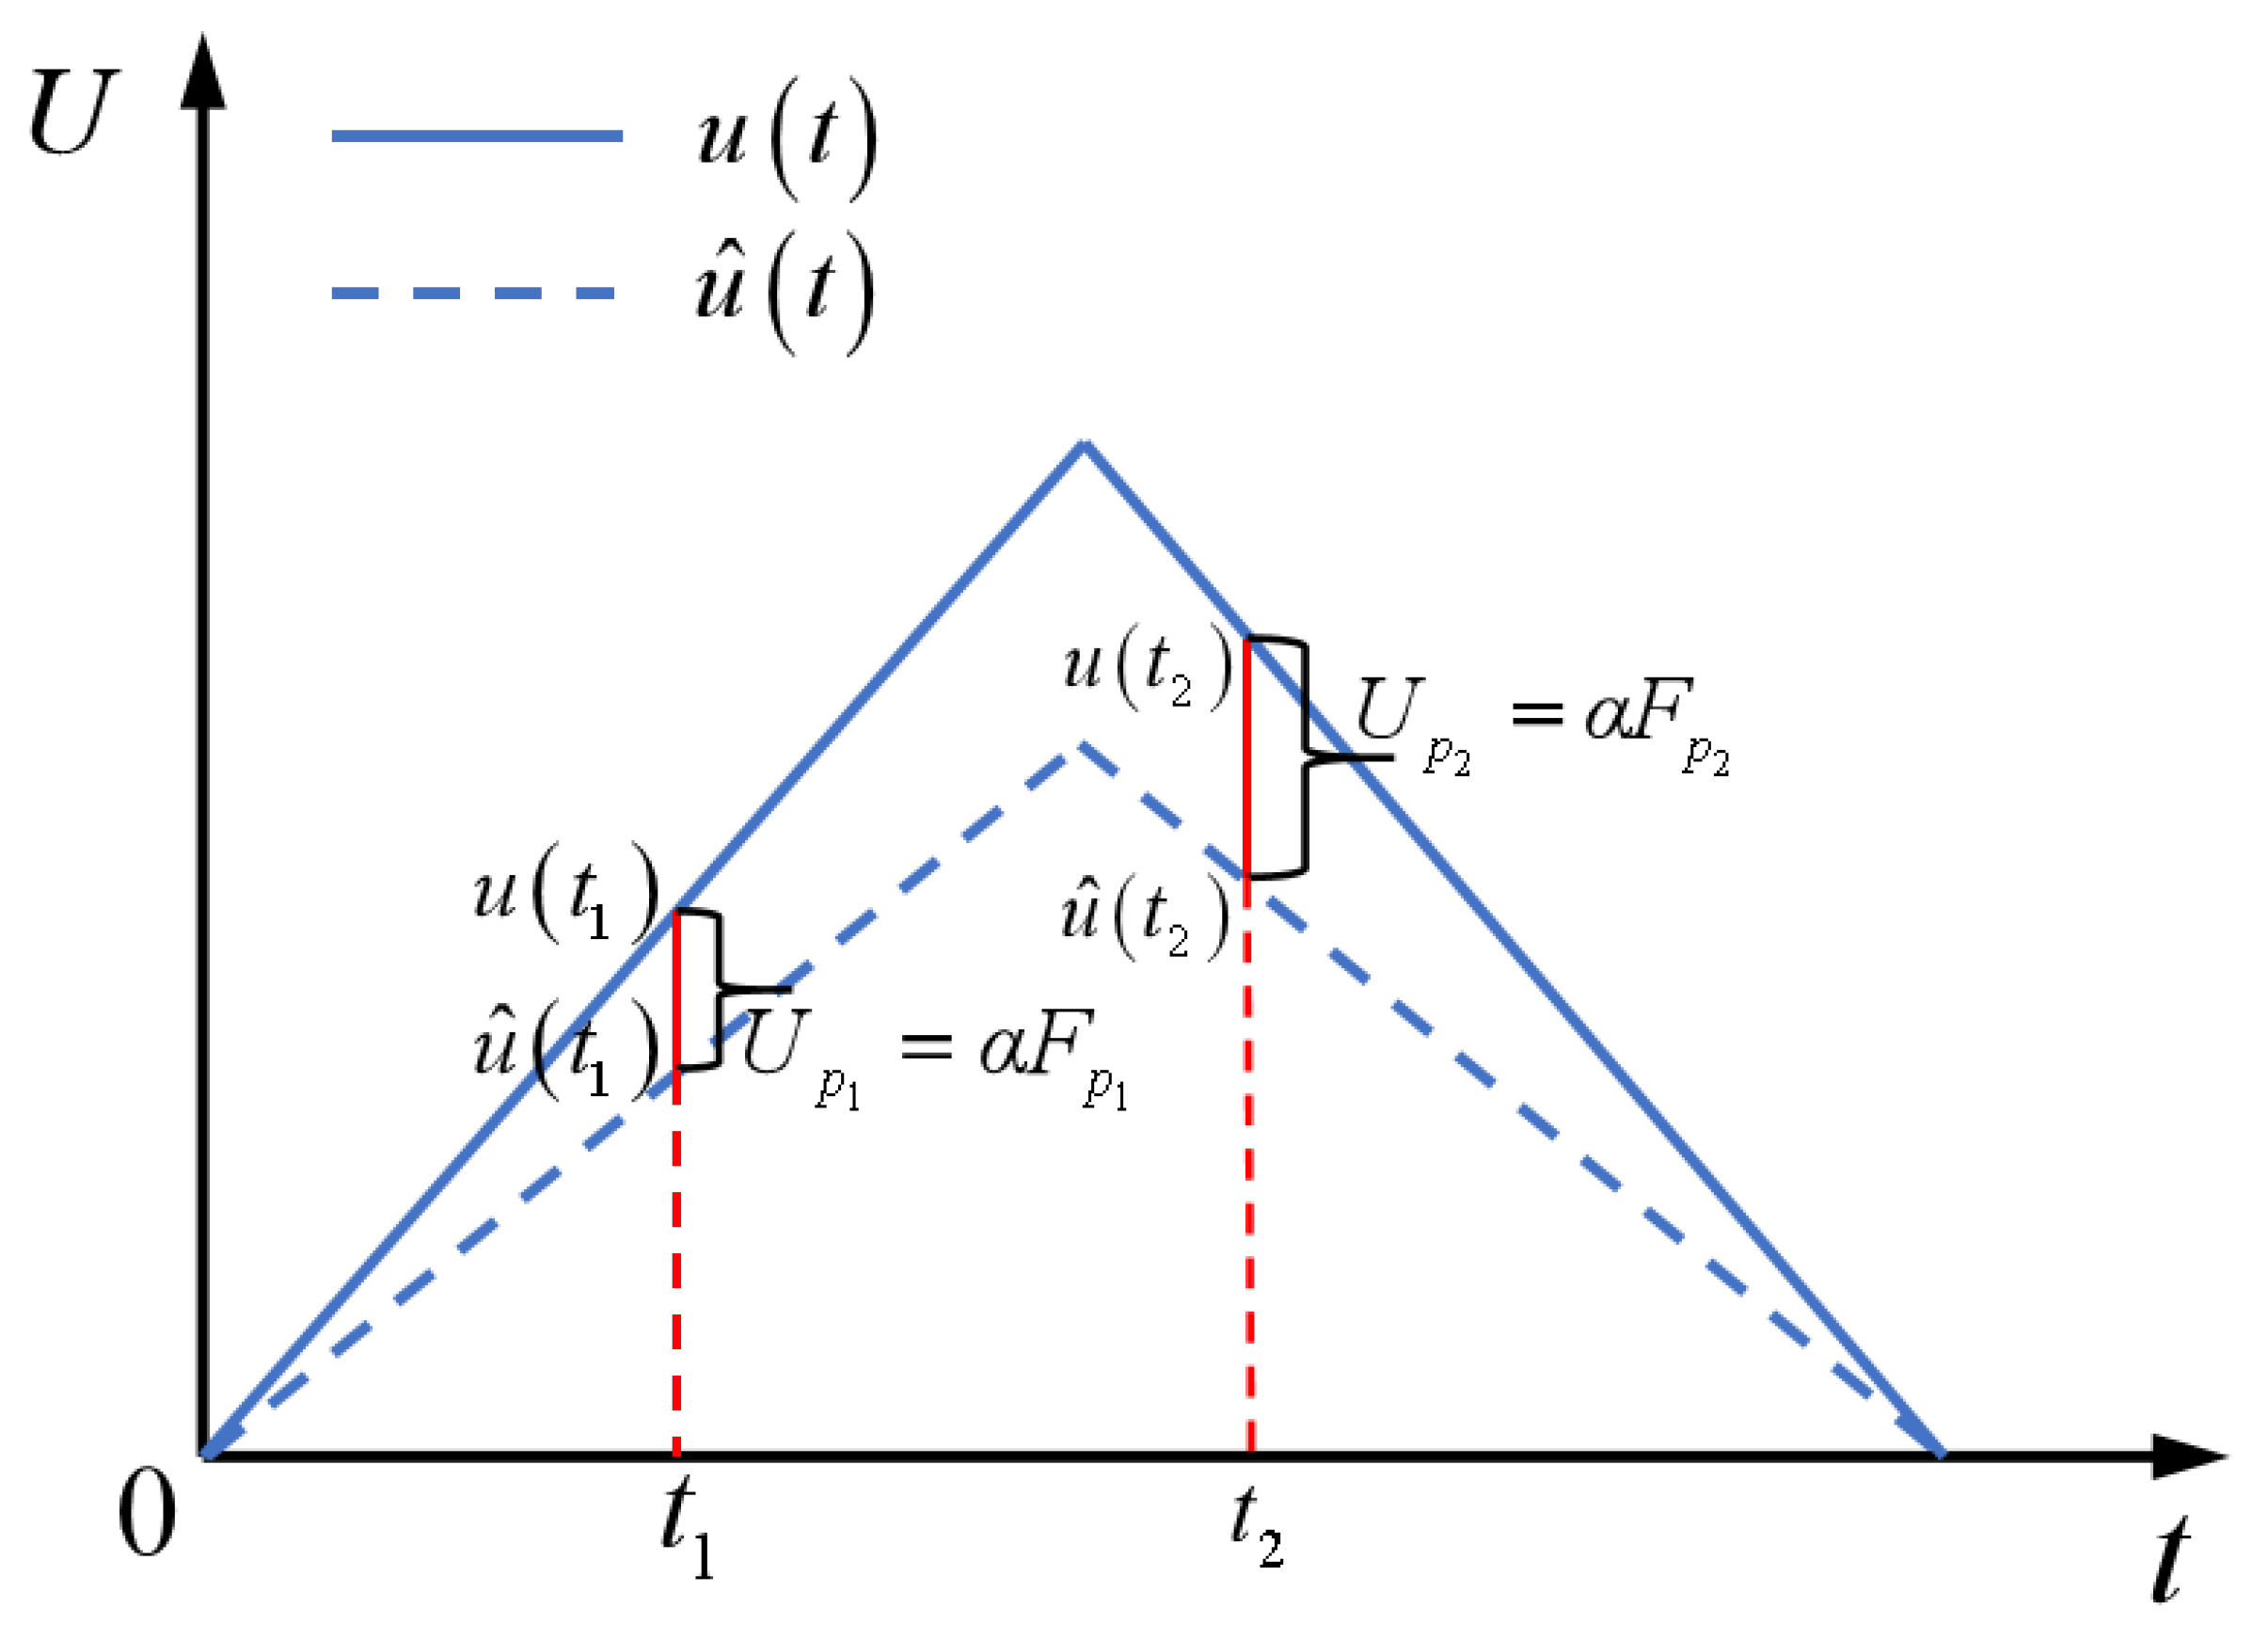
While the classical PI model is effective, it fails to account for a critical aspect of real-world operation: the influence of mechanical loading. In practical applications, PEAs are subjected to a structural preload, F p , to ensure stability and counteract inertial forces. This applied force compresses the piezoelectric stack, and via the direct piezoelectric effect, generates an internal charge, Q p . This charge induces a reverse voltage, U p , across the PEA’s internal capacitance, C e , which directly opposes the externally applied driving voltage.
Assuming the mechanical effects on non-piezoelectric components like adhesive layers are negligible, this reverse voltage is directly proportional to the preload force. This relationship can be expressed as follows:
U p = k f · F p
where k f is a force–voltage coupling coefficient. This coefficient encapsulates the physical properties of the actuator, including the number of active ceramic layers (n), the material’s longitudinal piezoelectric charge coefficient ( d 33 ) and the internal capacitance ( C e ), such that k f = ( n · d 33 ) / C e . While this equation provides a physical basis, the values of d 33 and C e can vary significantly with operating conditions and are often not known with high precision. Therefore, a key aspect of our proposed method is to treat k f not as a pre-determined constant, but as a model parameter to be identified directly from experimental data. This approach avoids reliance on uncertain datasheet values and captures the actuator’s true in situ behavior. This equation establishes a direct, quantifiable link between the mechanical domain (preload force F p ) and the electrical domain (reverse voltage U p ), as shown in Figure 2.
Consequently, the PEA does not respond to the applied voltage u ( t ) , but rather to an effective voltage, u ^ ( t ) , which is diminished by this preload-induced potential. This relationship is expressed as follows:
u ^ ( t ) = u ( t ) U p ( t )
A crucial insight, central to the novelty of this work, is that the preload F p is not static. As the PEA expands and contracts, it deforms the flexible hinge mechanism, causing continuous variations in the preload. This makes U p ( t ) a time-varying quantity that dynamically modulates the effective input voltage throughout the stage’s motion.
To capture this physical reality, we propose the Force Prandtl–Ishlinskii (FPI) model. This model is formulated by replacing the nominal input voltage in the classical PI structure with the effective voltage u ^ ( t ) from Equation (6). The resulting expression for the FPI model is as follows:
Y [ u ^ ( t ) ] = w 0 u ^ ( t ) + i = 1 n w i G r i [ u ^ ( t ) ]
In Equation (7), the output displacement, Y [ u ^ ( t ) ] , is now explicitly a function of the preload-modulated voltage. This formulation provides a more physically representative model of the actuator’s behavior by intrinsically coupling the mechanical and electrical domains.

2.3. Integration with the Force-Analyzed Finite Element Method (FFEM)

While the FPI model provides a robust mathematical framework for incorporating preload effects, its practical implementation is contingent upon knowing the dynamic preload–displacement relationship, F p ( t ) , inherent to the mechanical assembly. To address this critical dependency, our methodology integrates the FPI model with a specialized application of the Finite Element Method (FEM).
This integration marks a paradigm shift from conventional FEM applications. Instead of being leveraged for design validation through the evaluation of stress fields and structural deformations, FEM is repurposed in our approach as a computational tool for parameter identification. The analytical objective transitions from assessing distributed field quantities (e.g., stress and strain) to the precise extraction of a resultant reaction force at a critical interface. Given this focus on force analysis, we term this approach the Force-analyzed Finite Element Method (FFEM). This synergistic FPI-FFEM methodology facilitates the accurate characterization of the holistic nonlinear dynamics of the entire FHPS.
The FFEM simulation, executed within a platform such as ANSYS16.0 Workbench, serves two essential and complementary functions:
  • Quantification of Dynamic Preload: The principal function of the FFEM is to quantify with high precision the preload force exerted on the PEA as a function of its displacement. A digital twin of the FHPS is created, wherein the PEA’s expansion is simulated by applying a series of prescribed, incremental displacements to its interfacing surfaces with the flexible hinge. For each displacement increment, a static structural analysis is performed to compute the consequent reaction force. This systematic process generates a high-fidelity dataset that defines the functional relationship F p = f F ( x PEA ) , thereby mapping the PEA’s stroke to the corresponding preload it experiences. This simulated data provides the indispensable force input for calculating the effective voltage u ^ ( t ) within the FPI model.
  • Kinematic Characterization of the System: Concurrently, the FFEM simulation provides a rigorous characterization of the stage’s kinematics. For the identical set of prescribed PEA displacements, the simulation computes the resultant output displacement of the positioning platform. This establishes the system’s amplification ratio, x FHPS = f K ( x PEA ) , capturing nonlinearities that are often intractable to determine analytically through simplified geometric models.
The synergy between the phenomenological FPI model and the physics-based FFEM simulation is the cornerstone of this methodology. The FPI model encapsulates the intrinsic electromechanical hysteresis of the actuator, while the FFEM provides the specific, system-dependent boundary conditions (i.e., the preload and kinematic relationships) imposed by the mechanical design. As will be demonstrated in Section 3, this integrated FPI-FFEM method allows for an end-to-end prediction of the stage’s nonlinear output curve based solely on its design and the input driving voltage. The complete algorithm is detailed in Table 1. The features of the method designed in this section can be seen in Table 2.

3. Experiment and Discussion

This section presents a comprehensive experimental validation of the proposed methodology, structured to first verify the core FPI model and then demonstrate the predictive power of the integrated FPI-FFEM framework. To achieve this, an experimental setup is first introduced to characterize the piezoelectric actuator’s response under controlled, variable preloads, providing the data to confirm the FPI model’s superior accuracy over its classical counterpart. The validation then culminates in applying the complete FPI-FFEM method to a physical FHPS, where its predictions are benchmarked against direct measurements to verify its effectiveness as a design-phase tool.

3.1. Design of the Measurable Preload Experimental Setup

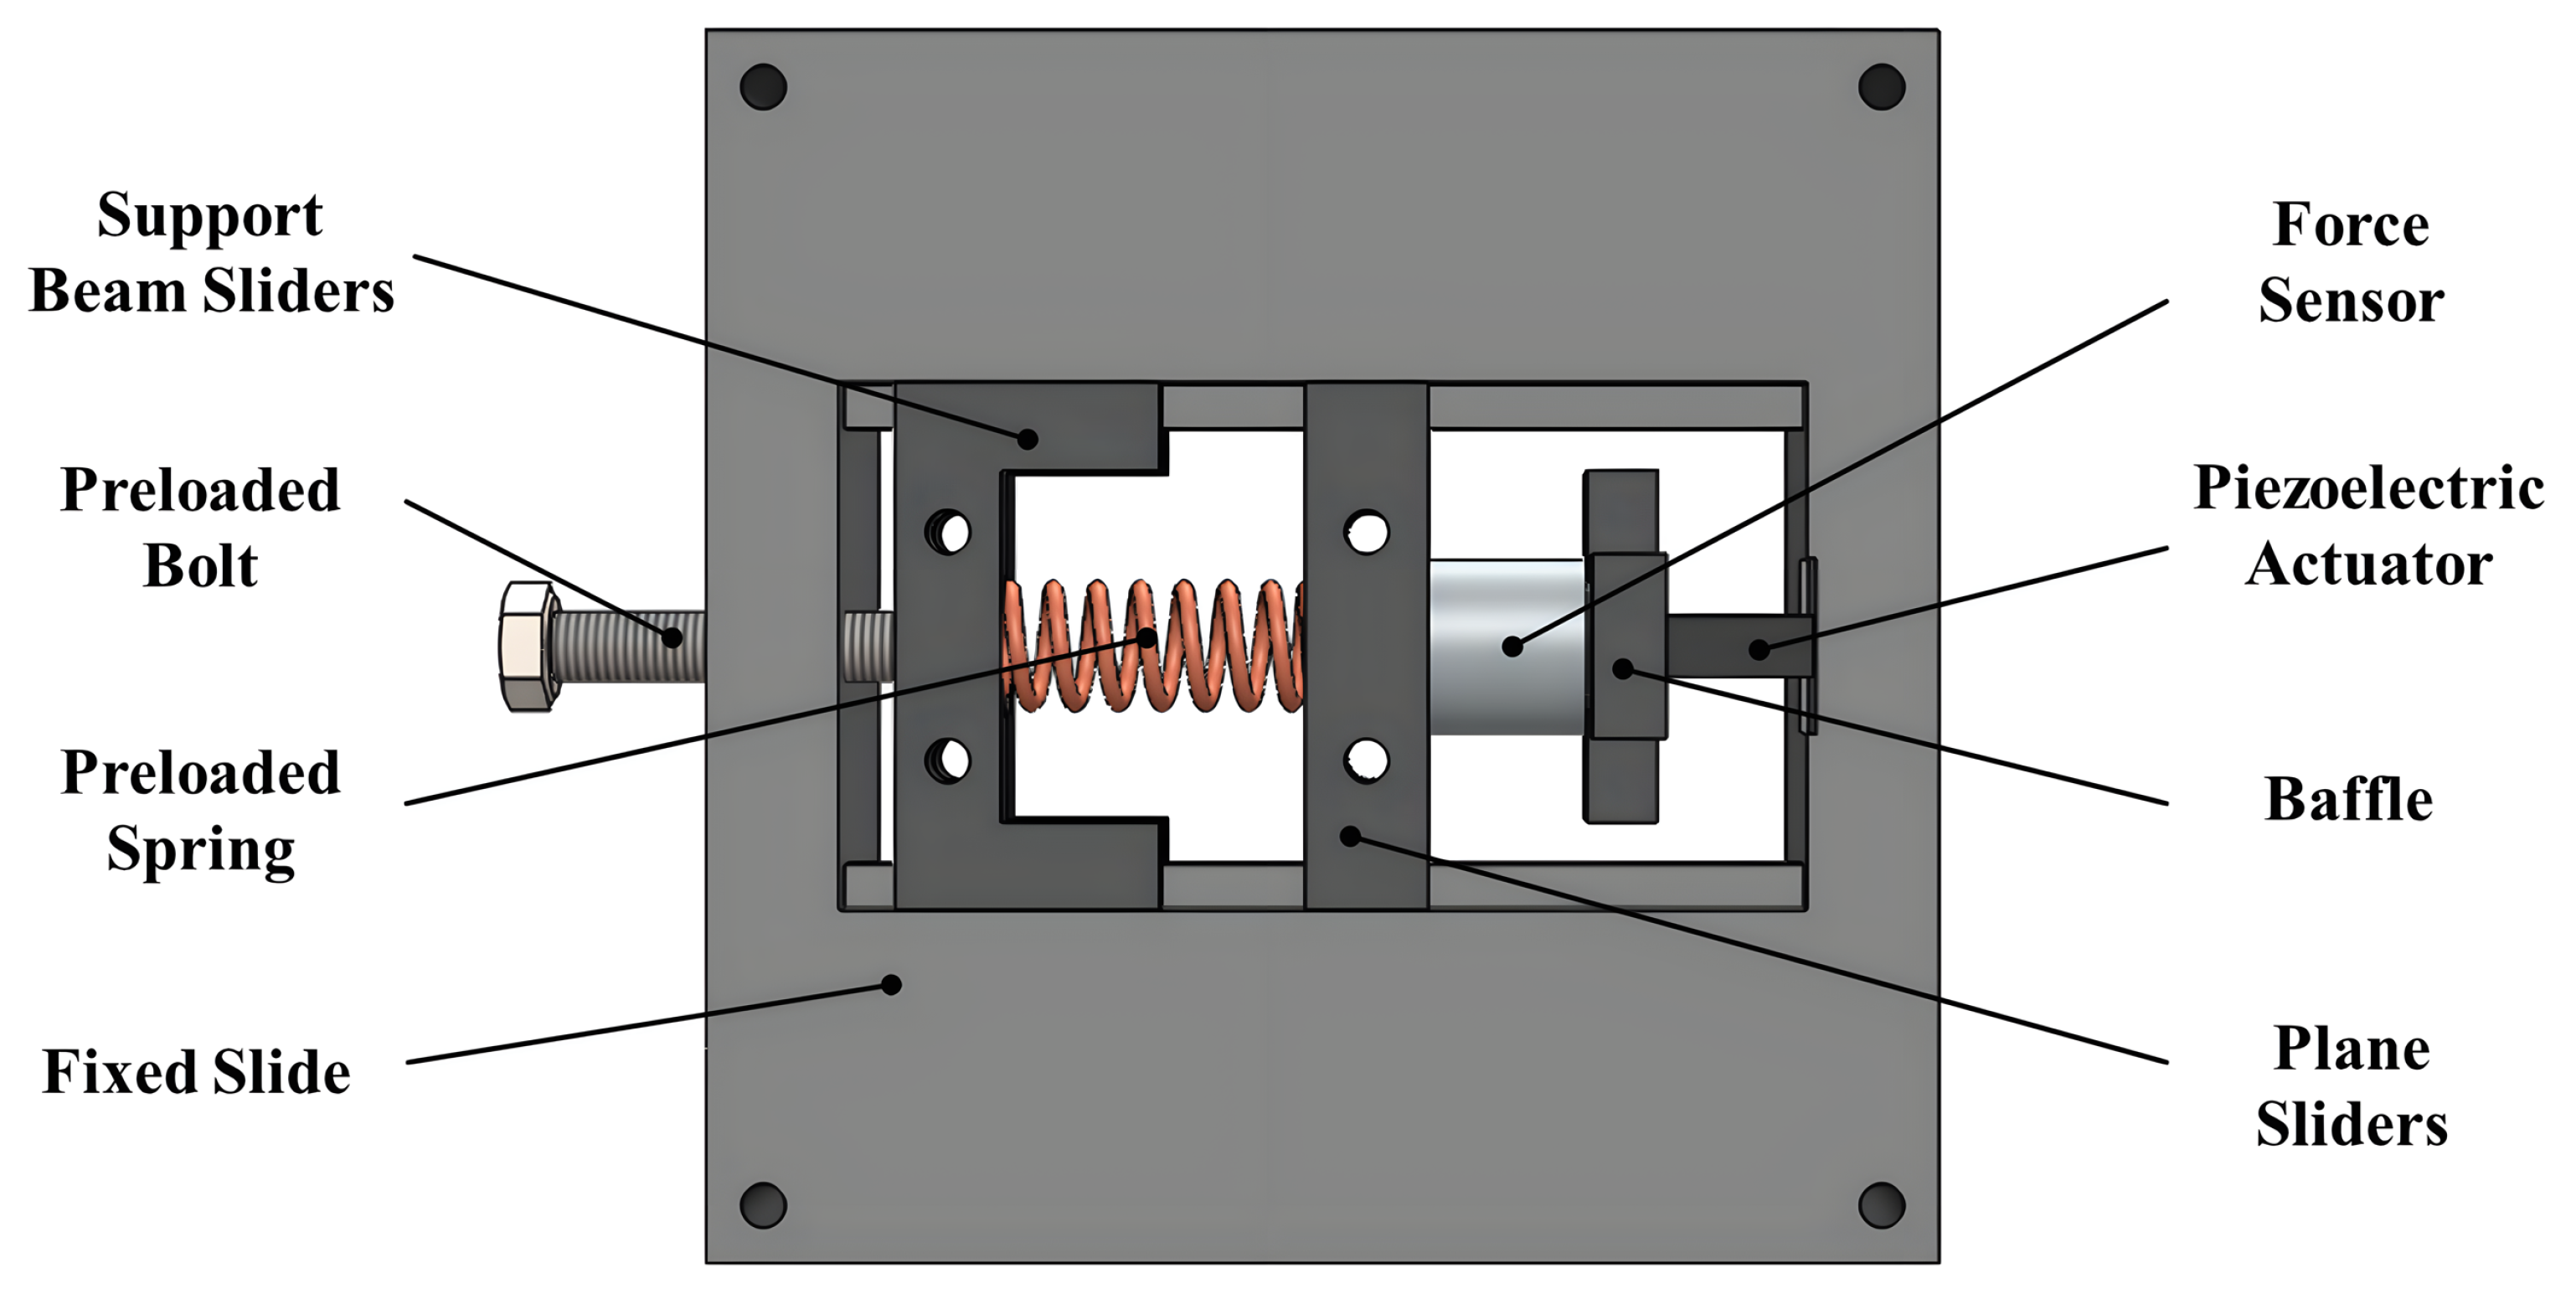
To investigate the effect of preload on the output displacement of the PEA, an experimental setup for measuring preload was designed, as shown in Figure 3. The setup consists of preloaded bolts to apply and adjust the initial preload force on the PEA. A high-stiffness compression spring ensures stable force application.
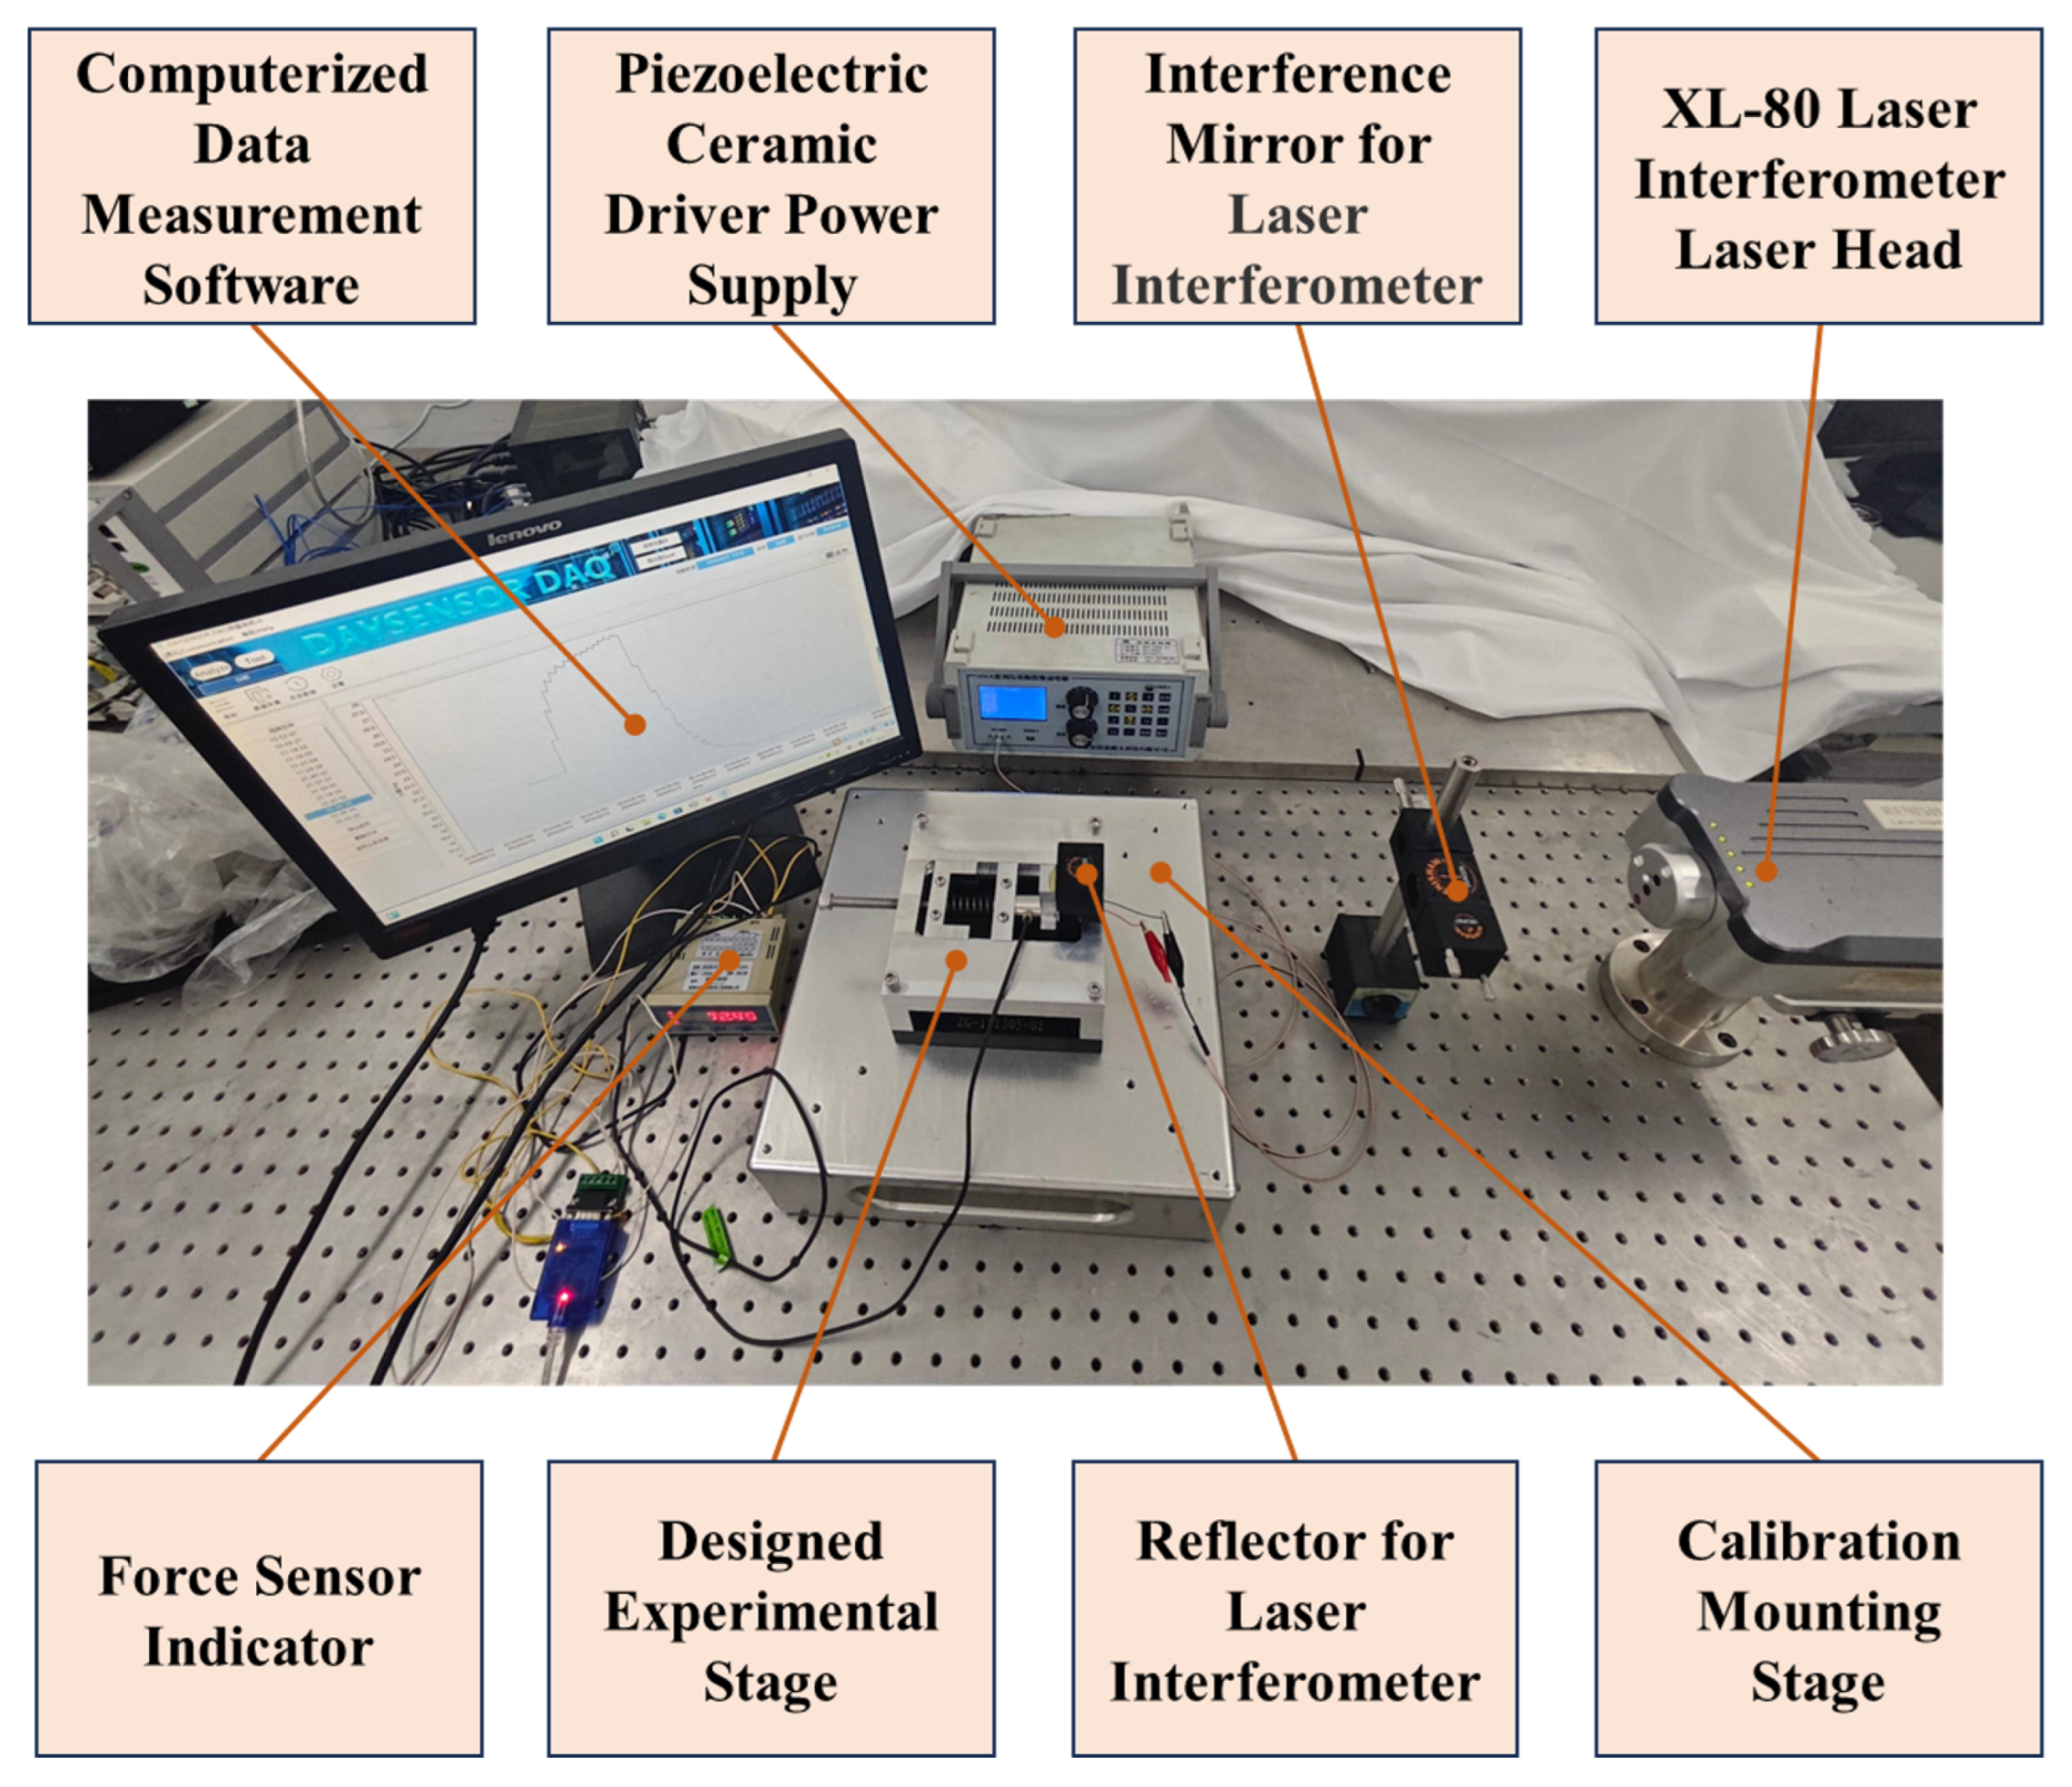
The core component is a soft piezoelectric actuator manufactured by Sanying MotionControl, which features a piezoelectric coefficient d 33 = 312 pm / V and a quality factor Q = 70 . The PEA is mounted between two sliders that move along fixed guide rails. A mirror, affixed to a baffle on the moving slider, is used with an XL-80 laser interferometer to precisely measure the PEA’s output displacement. A custom DYZ-107 column-type force sensor, provided by Daysensor, with a measurement range of 20 kg and an accuracy of 0.5%, is integrated into the assembly to measure the preload applied to the PEA in real time. The actuator is driven by a Coremorrow HVA-300V.A1 power supply.
The force and displacement data are transmitted to a computer for synchronous recording and analysis.

3.2. Validation of the FPI Model

To validate the accuracy of the FPI model, an experimental system was constructed based on the setup shown in Figure 4. The system was designed to measure the PEA’s hysteresis characteristics under various controlled preload conditions. The PEA used was a lead zirconate titanate (PZT) stack actuator (7 mm × 7 mm × 18 mm). The experimental procedure involved applying a series of initial preloads and, for each preload, driving the PEA with a sinusoidal voltage while recording the input voltage, output displacement and preload force. To ensure reliability, the experiments were conducted on a vibration-damping stage, and each test was repeated five times.
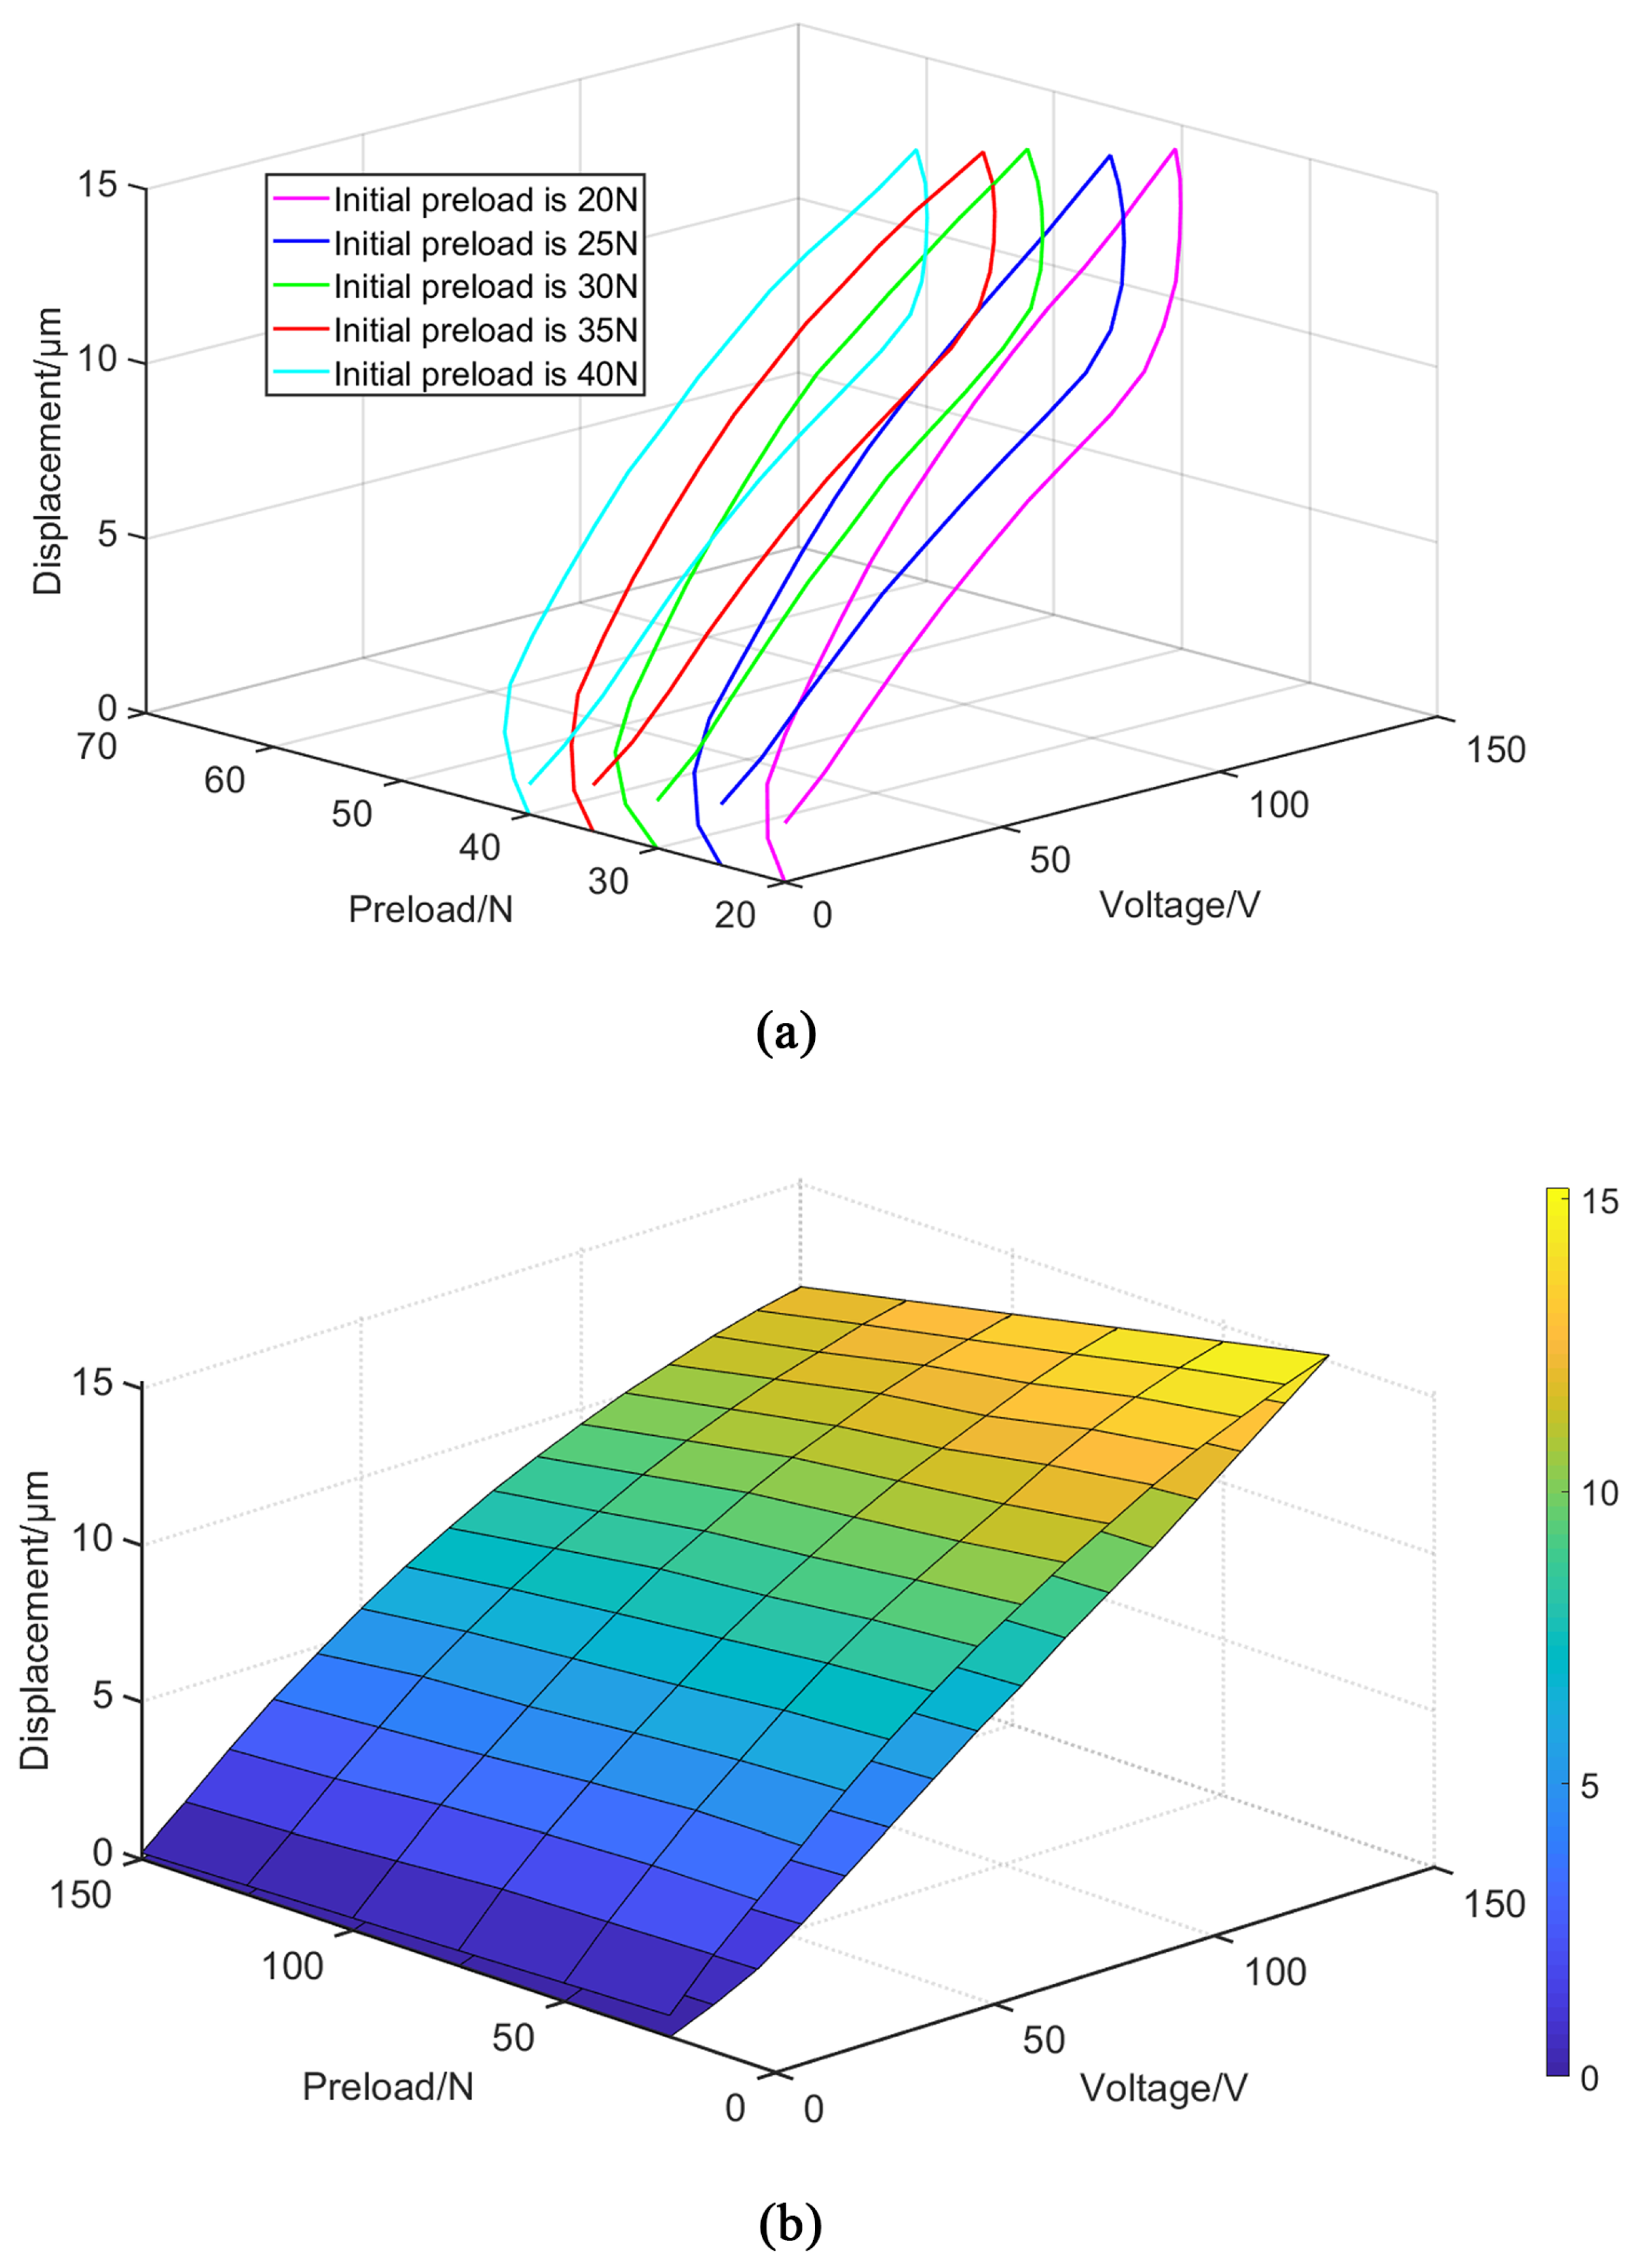
The collected data was used to construct a family of voltage–preload–displacement hysteresis curves, as shown in Figure 5a, which were then rendered into a 3D hysteresis surface (Figure 5b). The results confirm the theoretical analysis: as the preload increases, the maximum output displacement of the PEA decreases due to the reverse voltage effect.
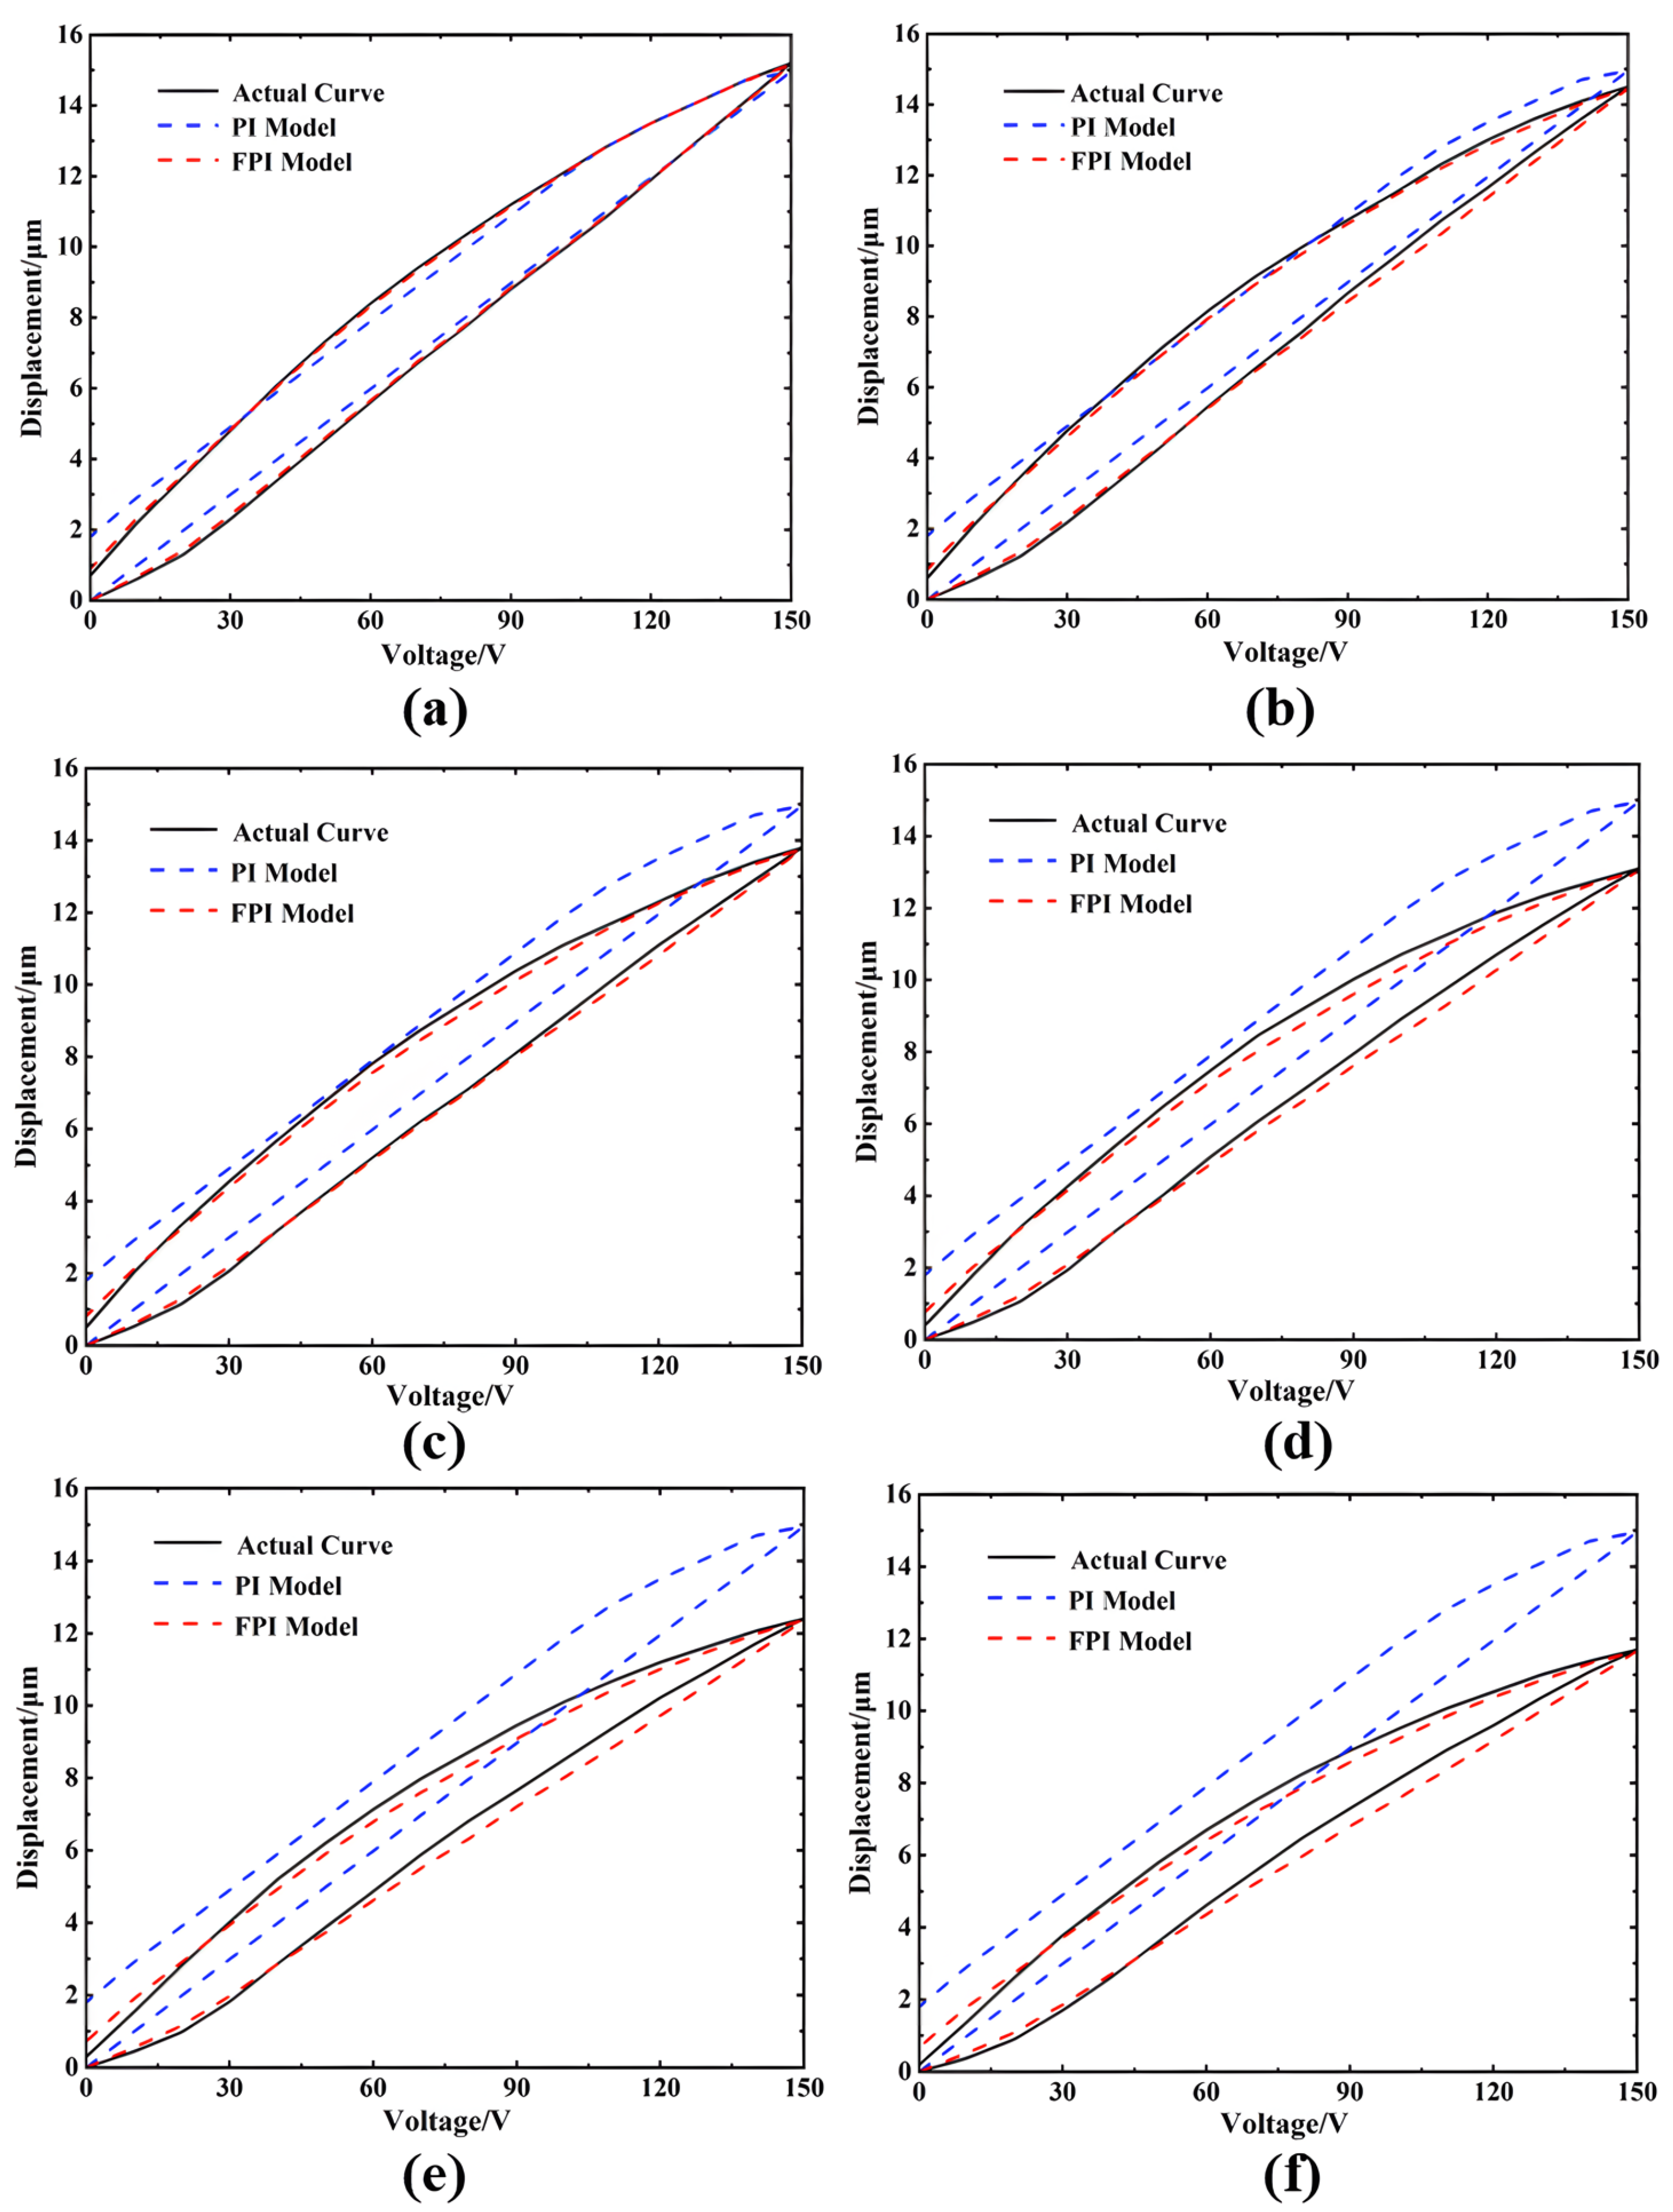
The FPI model and the classical PI model were then fitted to this experimental data. The identified parameters for each model are shown in Table 3. A comparison of the model predictions with the measured data under six different preload conditions is presented in Figure 6. The FPI model, which explicitly accounts for preload, demonstrates superior tracking of the maximum displacement across all conditions. In contrast, the PI model, identified at a single preload, fails to adapt. The modeling errors, quantified by Maximum Tracking Error (MTE) and Root Mean Square Error (RMSE), are shown in Figure 6, Figure 7 and Figure 8. The FPI model achieved an average reduction of 13.30% in MTE and 6.38% in RMSE compared to the PI model, confirming its higher accuracy in describing preload-dependent hysteresis.
e m a x ( % ) = max ( | x x d | ) max ( x d ) min ( x d ) × 100 %         e R M S E ( % ) = 1 N i = 1 N ( x i x d , i ) 2 max ( x d ) min ( x d ) × 100 %

3.3. Verification of the FPI-FFEM Nonlinearity Characterization Method

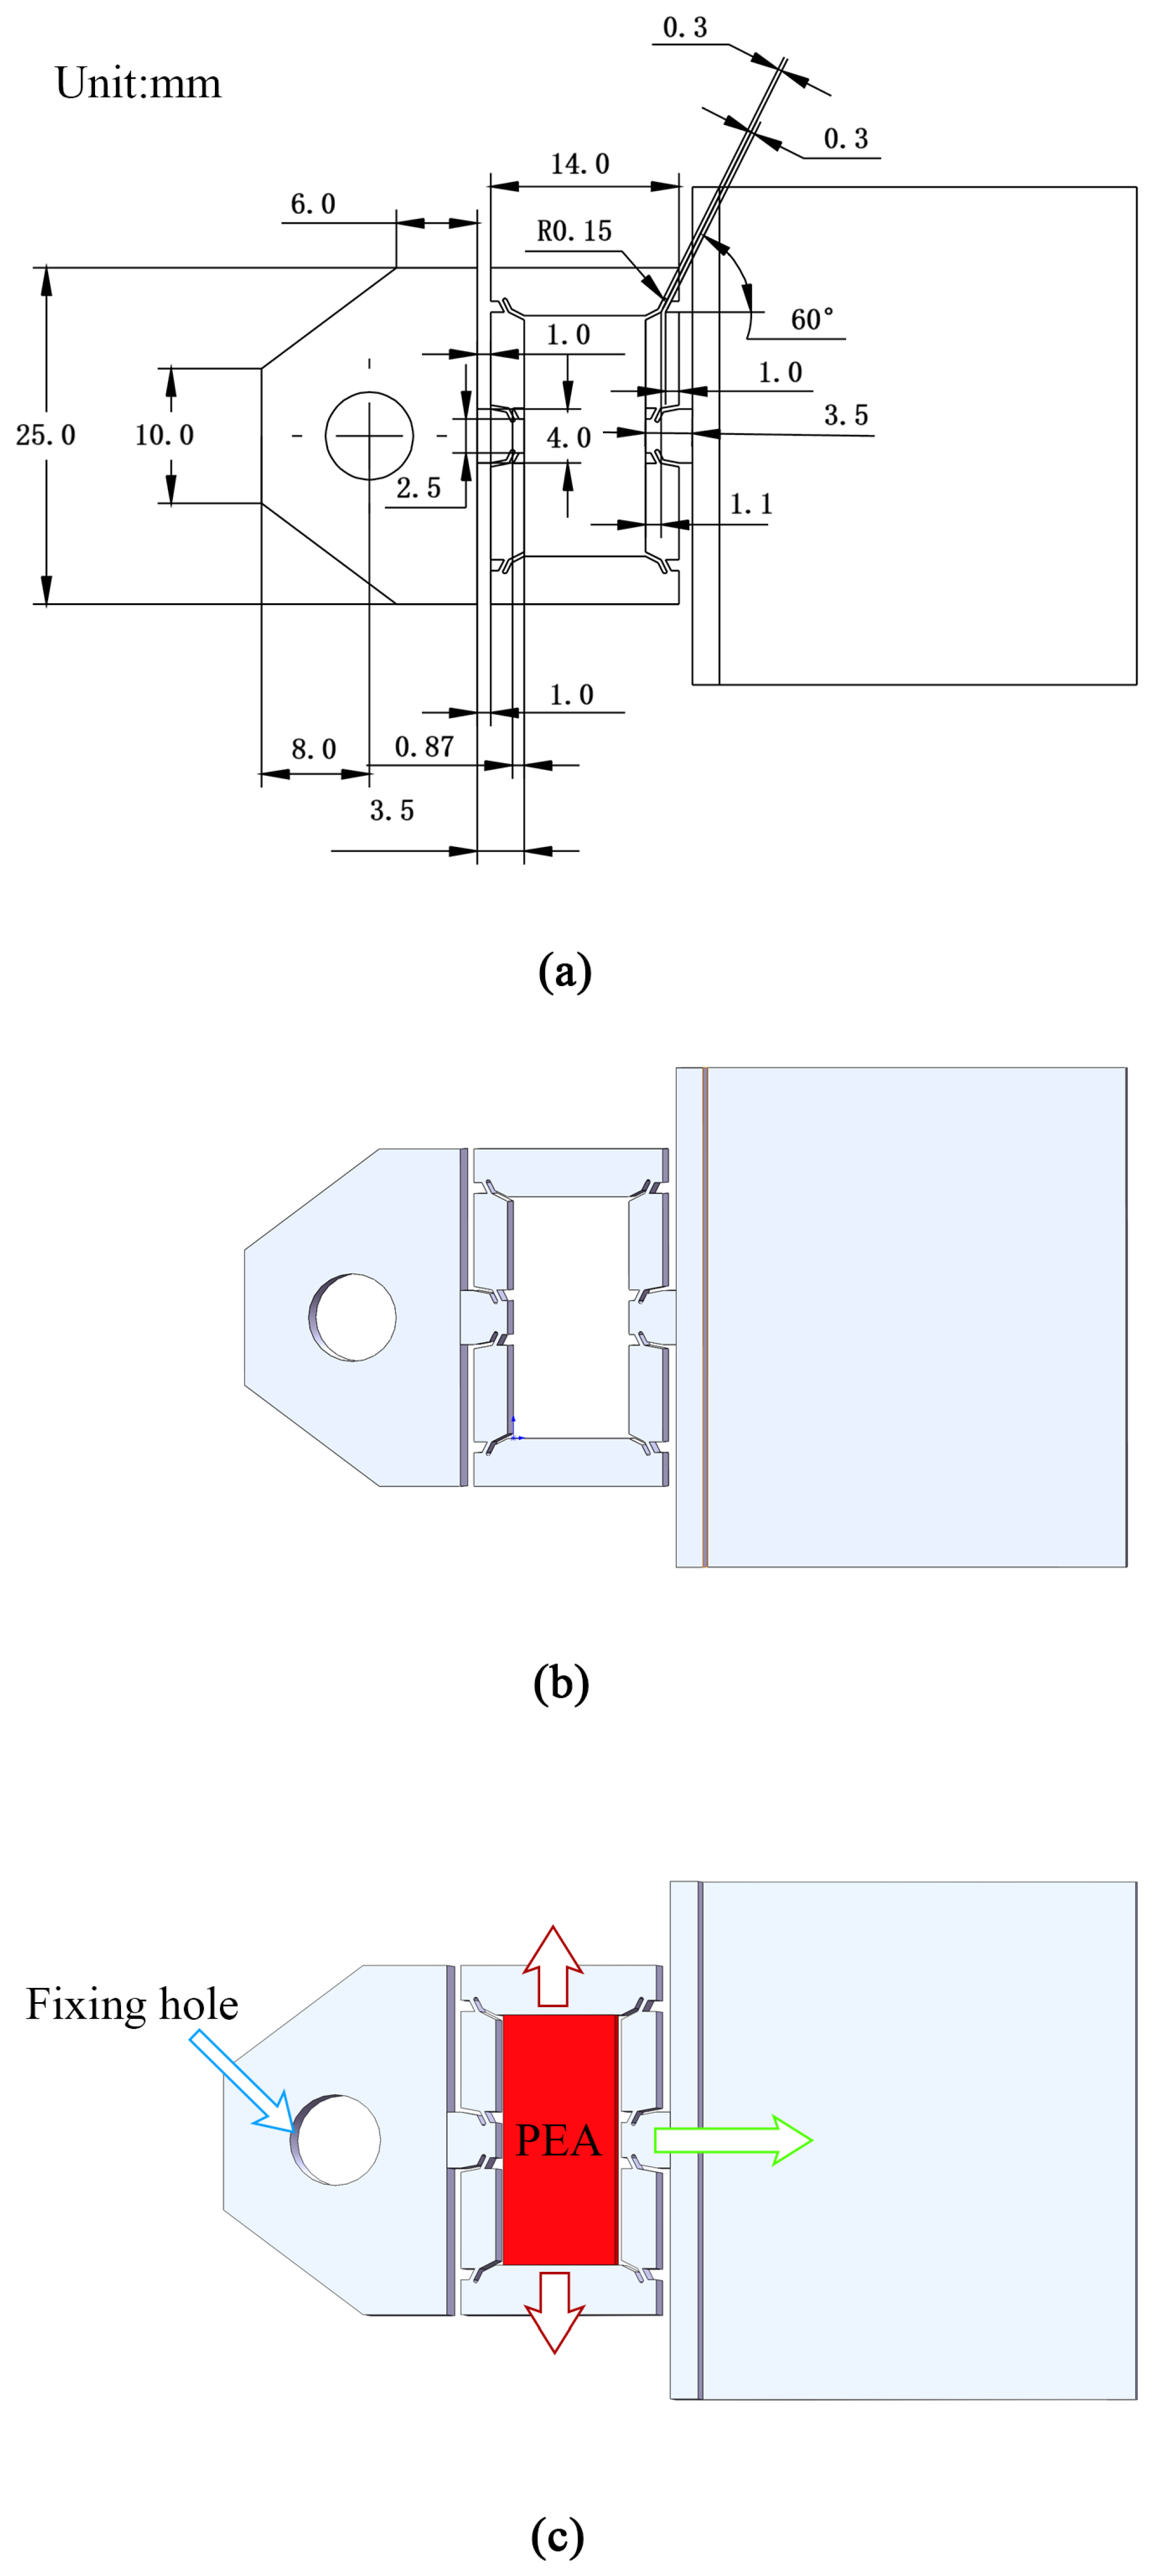
To validate the complete FPI-FFEM method, a FHPS was designed and fabricated (Figure 9). The device’s operating principle is illustrated in Figure 9c: a central PEA (red) generates an initial displacement (red arrow), which is subsequently amplified by a flexure hinge mechanism to produce a larger output motion (green arrow). For operational stability and precision, the entire apparatus is mounted to a calibration stage through a fixing hole (blue arrow), effectively minimizing movement-induced vibrations and misalignments.
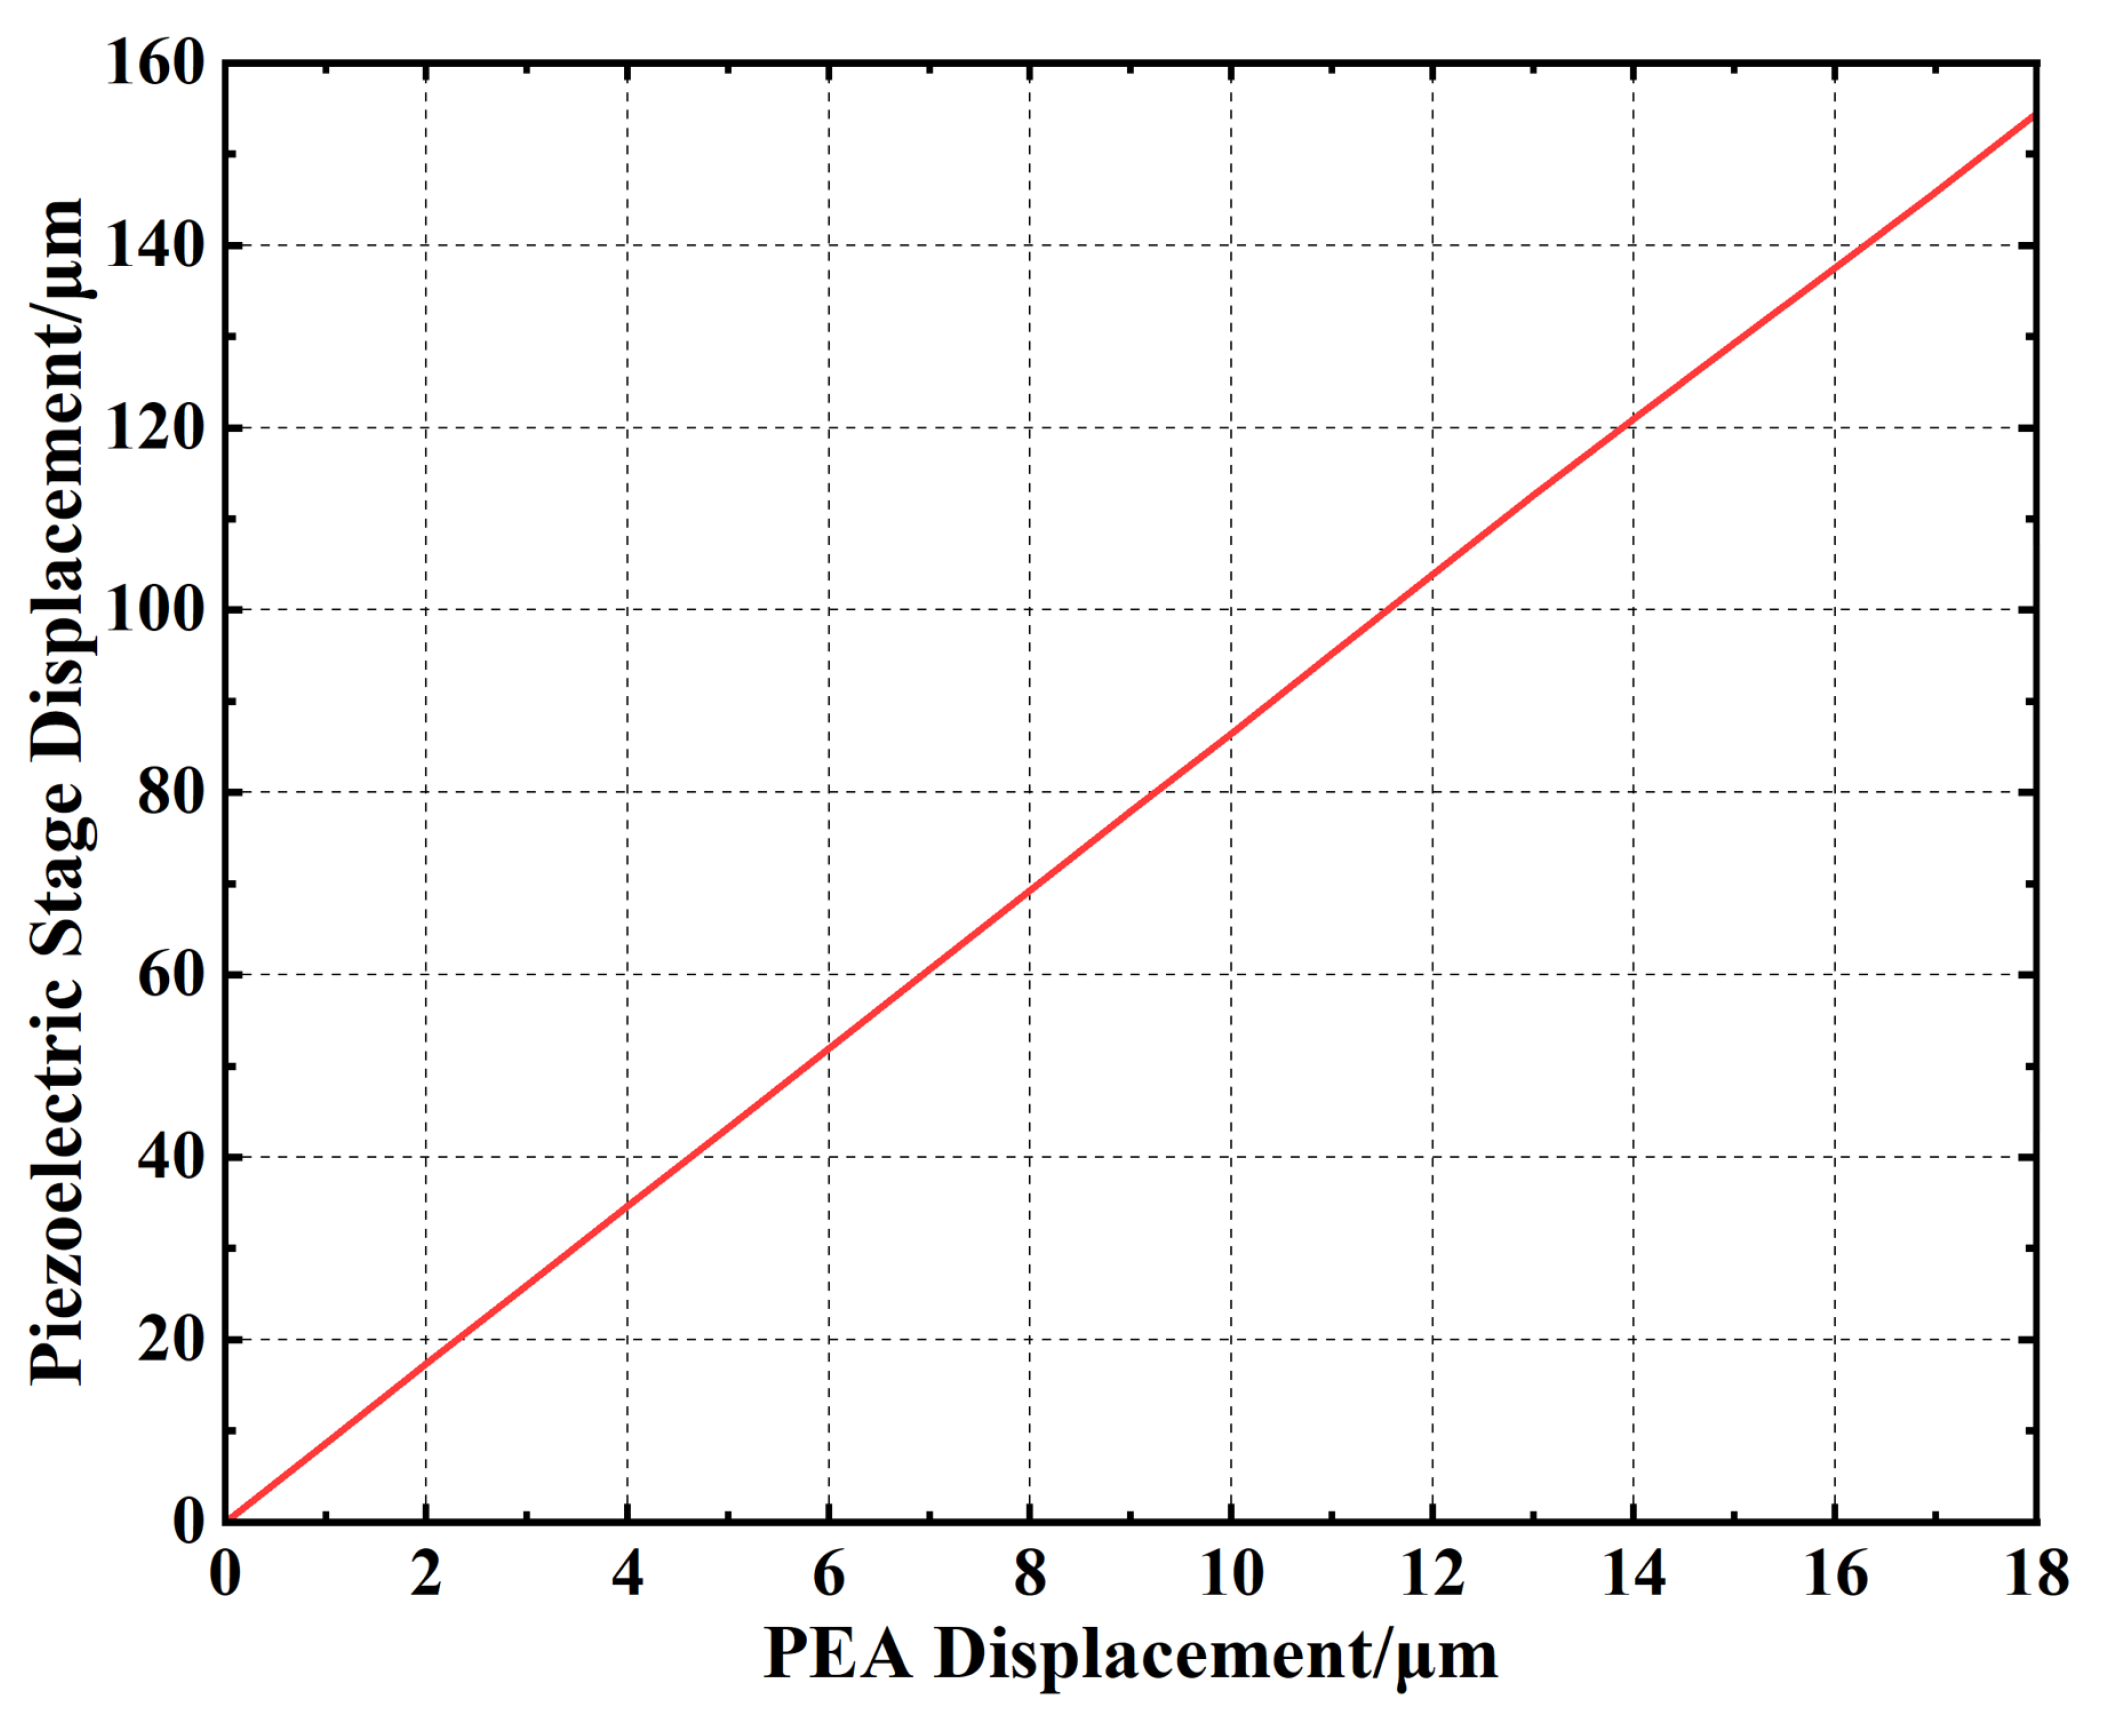
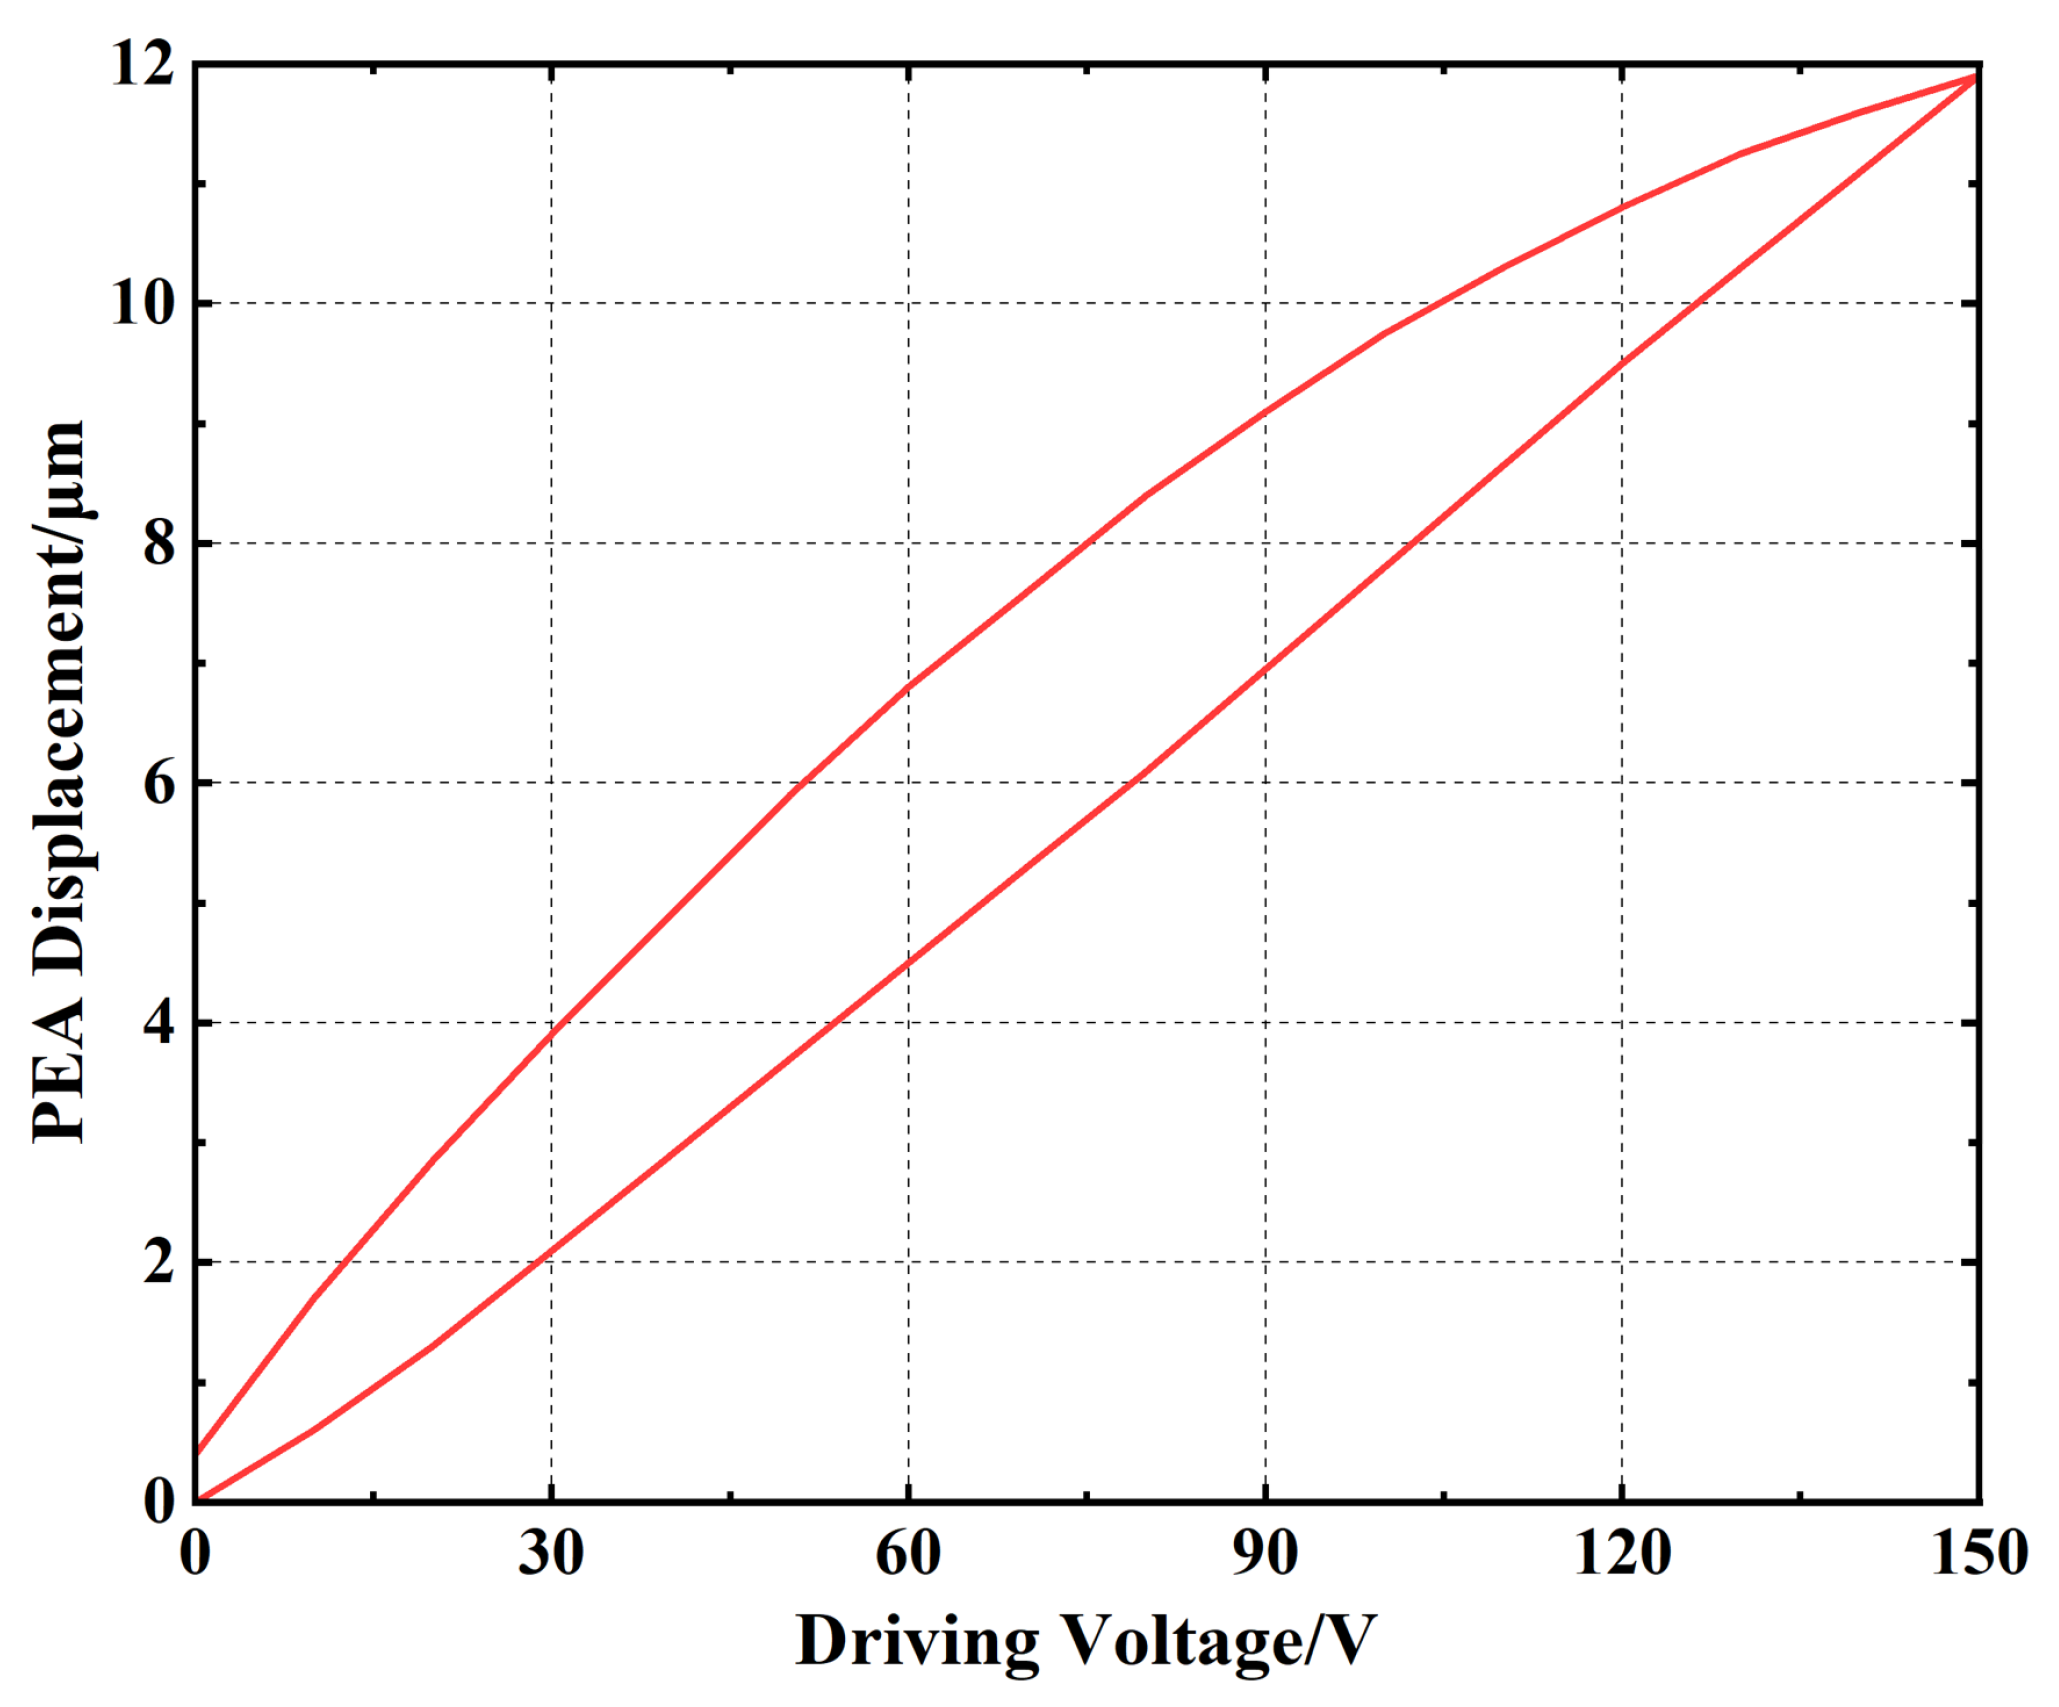
The first step in the validation was to characterize this mechanical system using the FFEM procedure detailed in Section 2.3. A simulation in ANSYS was performed to obtain two critical system mappings, which serve as necessary inputs for the prediction model: the preload–displacement relationship ( F p vs. x PEA , Figure 10) and the kinematic amplification ( x FHPS vs. x PEA , Figure 11).
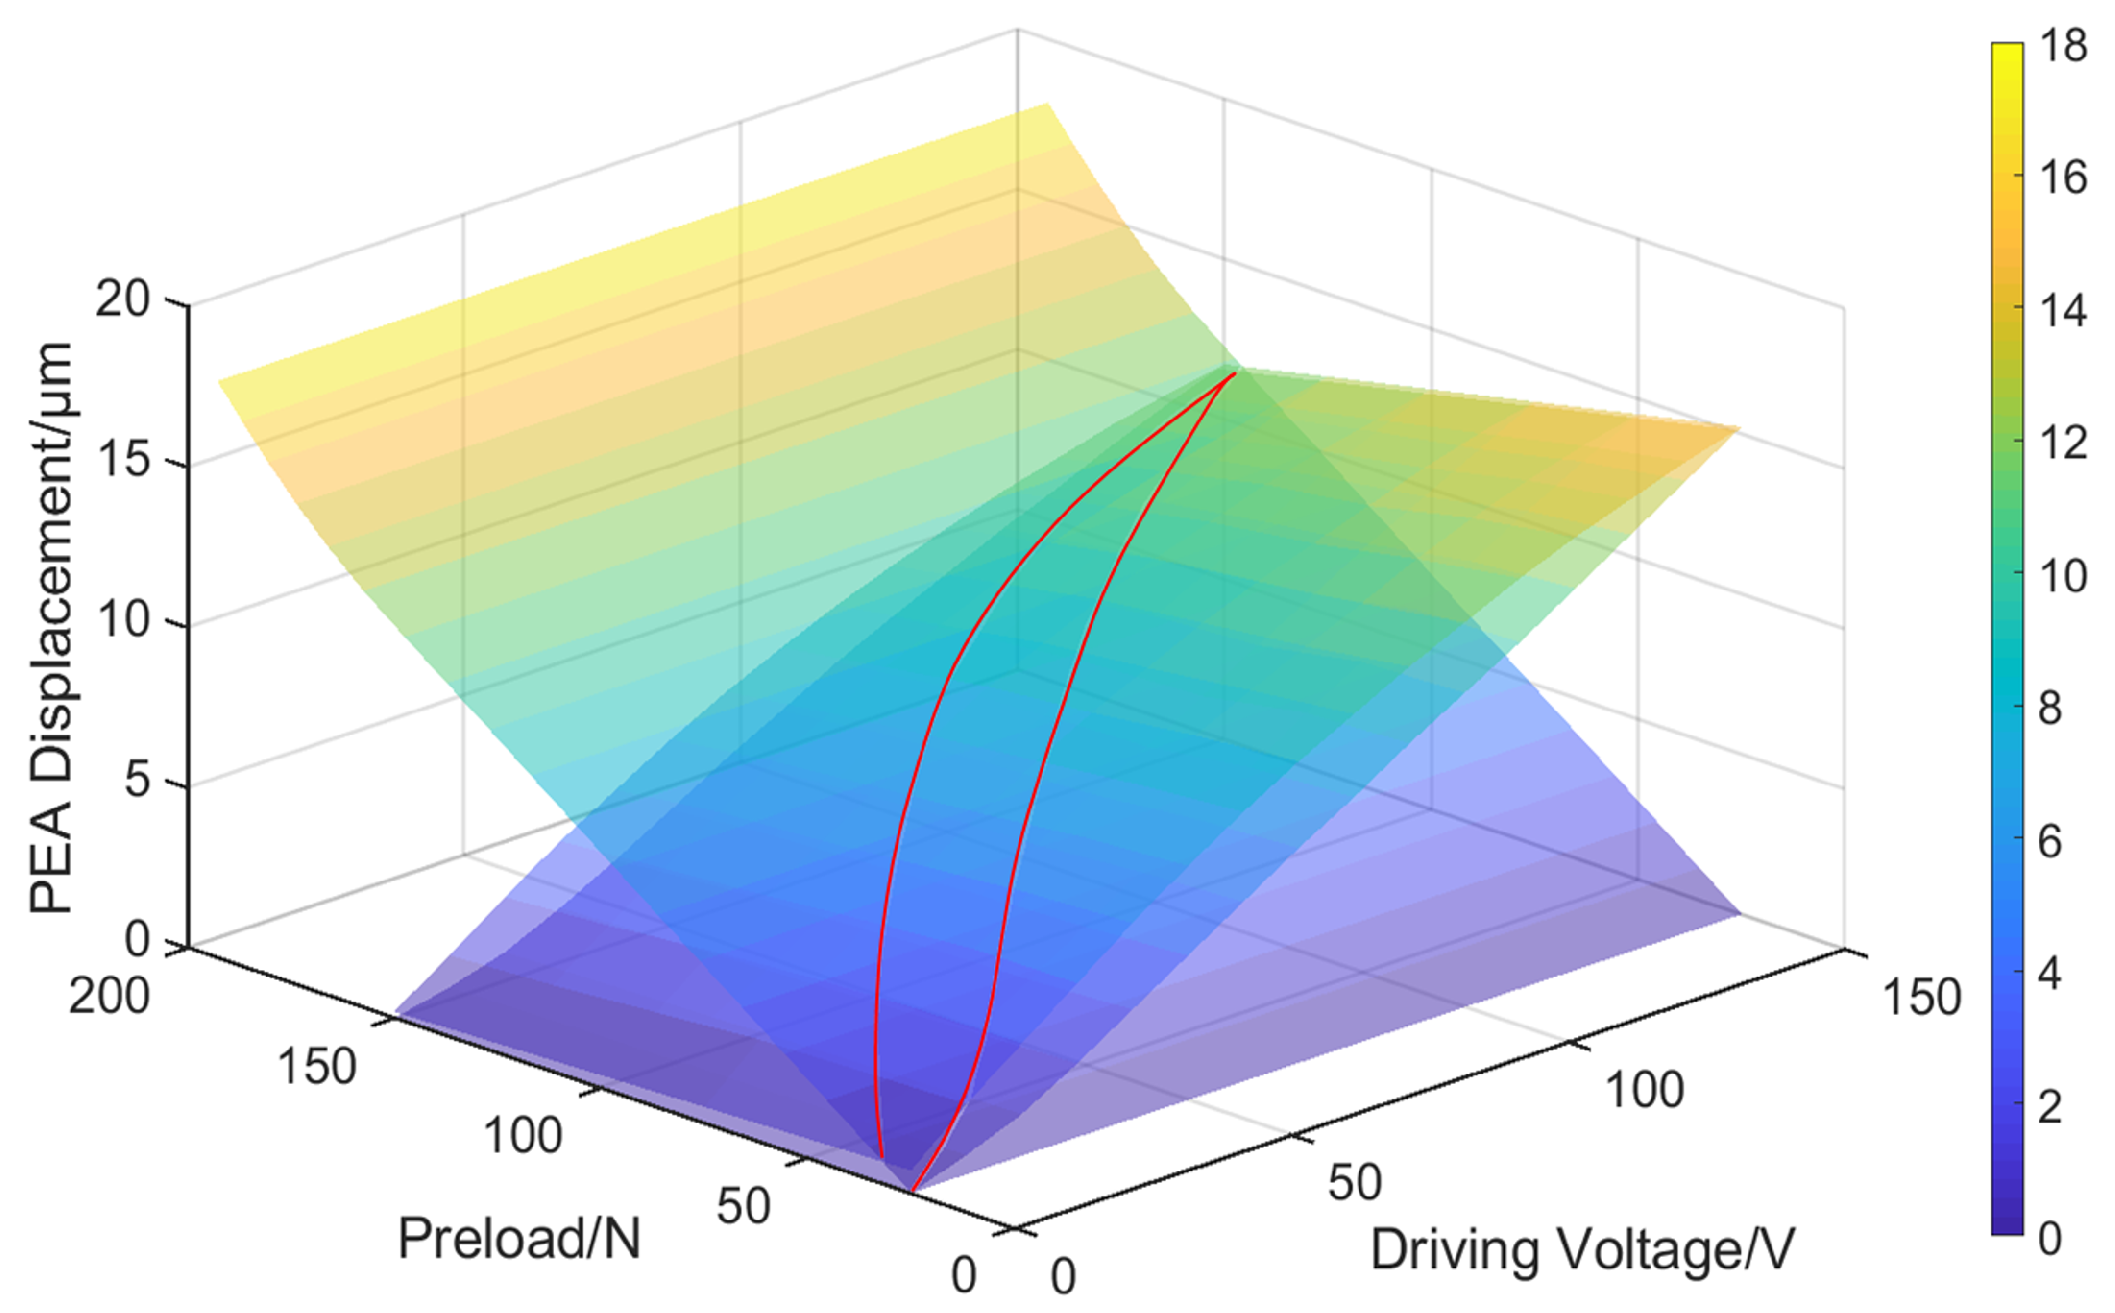
The FPI-FFEM prediction process then proceeded by implementing the algorithm detailed in Table 1. For each point in the driving voltage cycle, the PEA’s output displacement under the dynamic preload was found by numerically solving the coupled equation described in Step 4a of the algorithm. This equation, x PEA ( t k ) = Y [ u target ( t k ) k f · f F ( x PEA ( t k ) ) ] , links the FPI model’s output with the FFEM-derived force map ( F p = f F ( x PEA ) ). This process yields the predicted PEA hysteresis loop under the actual operating conditions within the FHPS (Figure 12 and Figure 13).
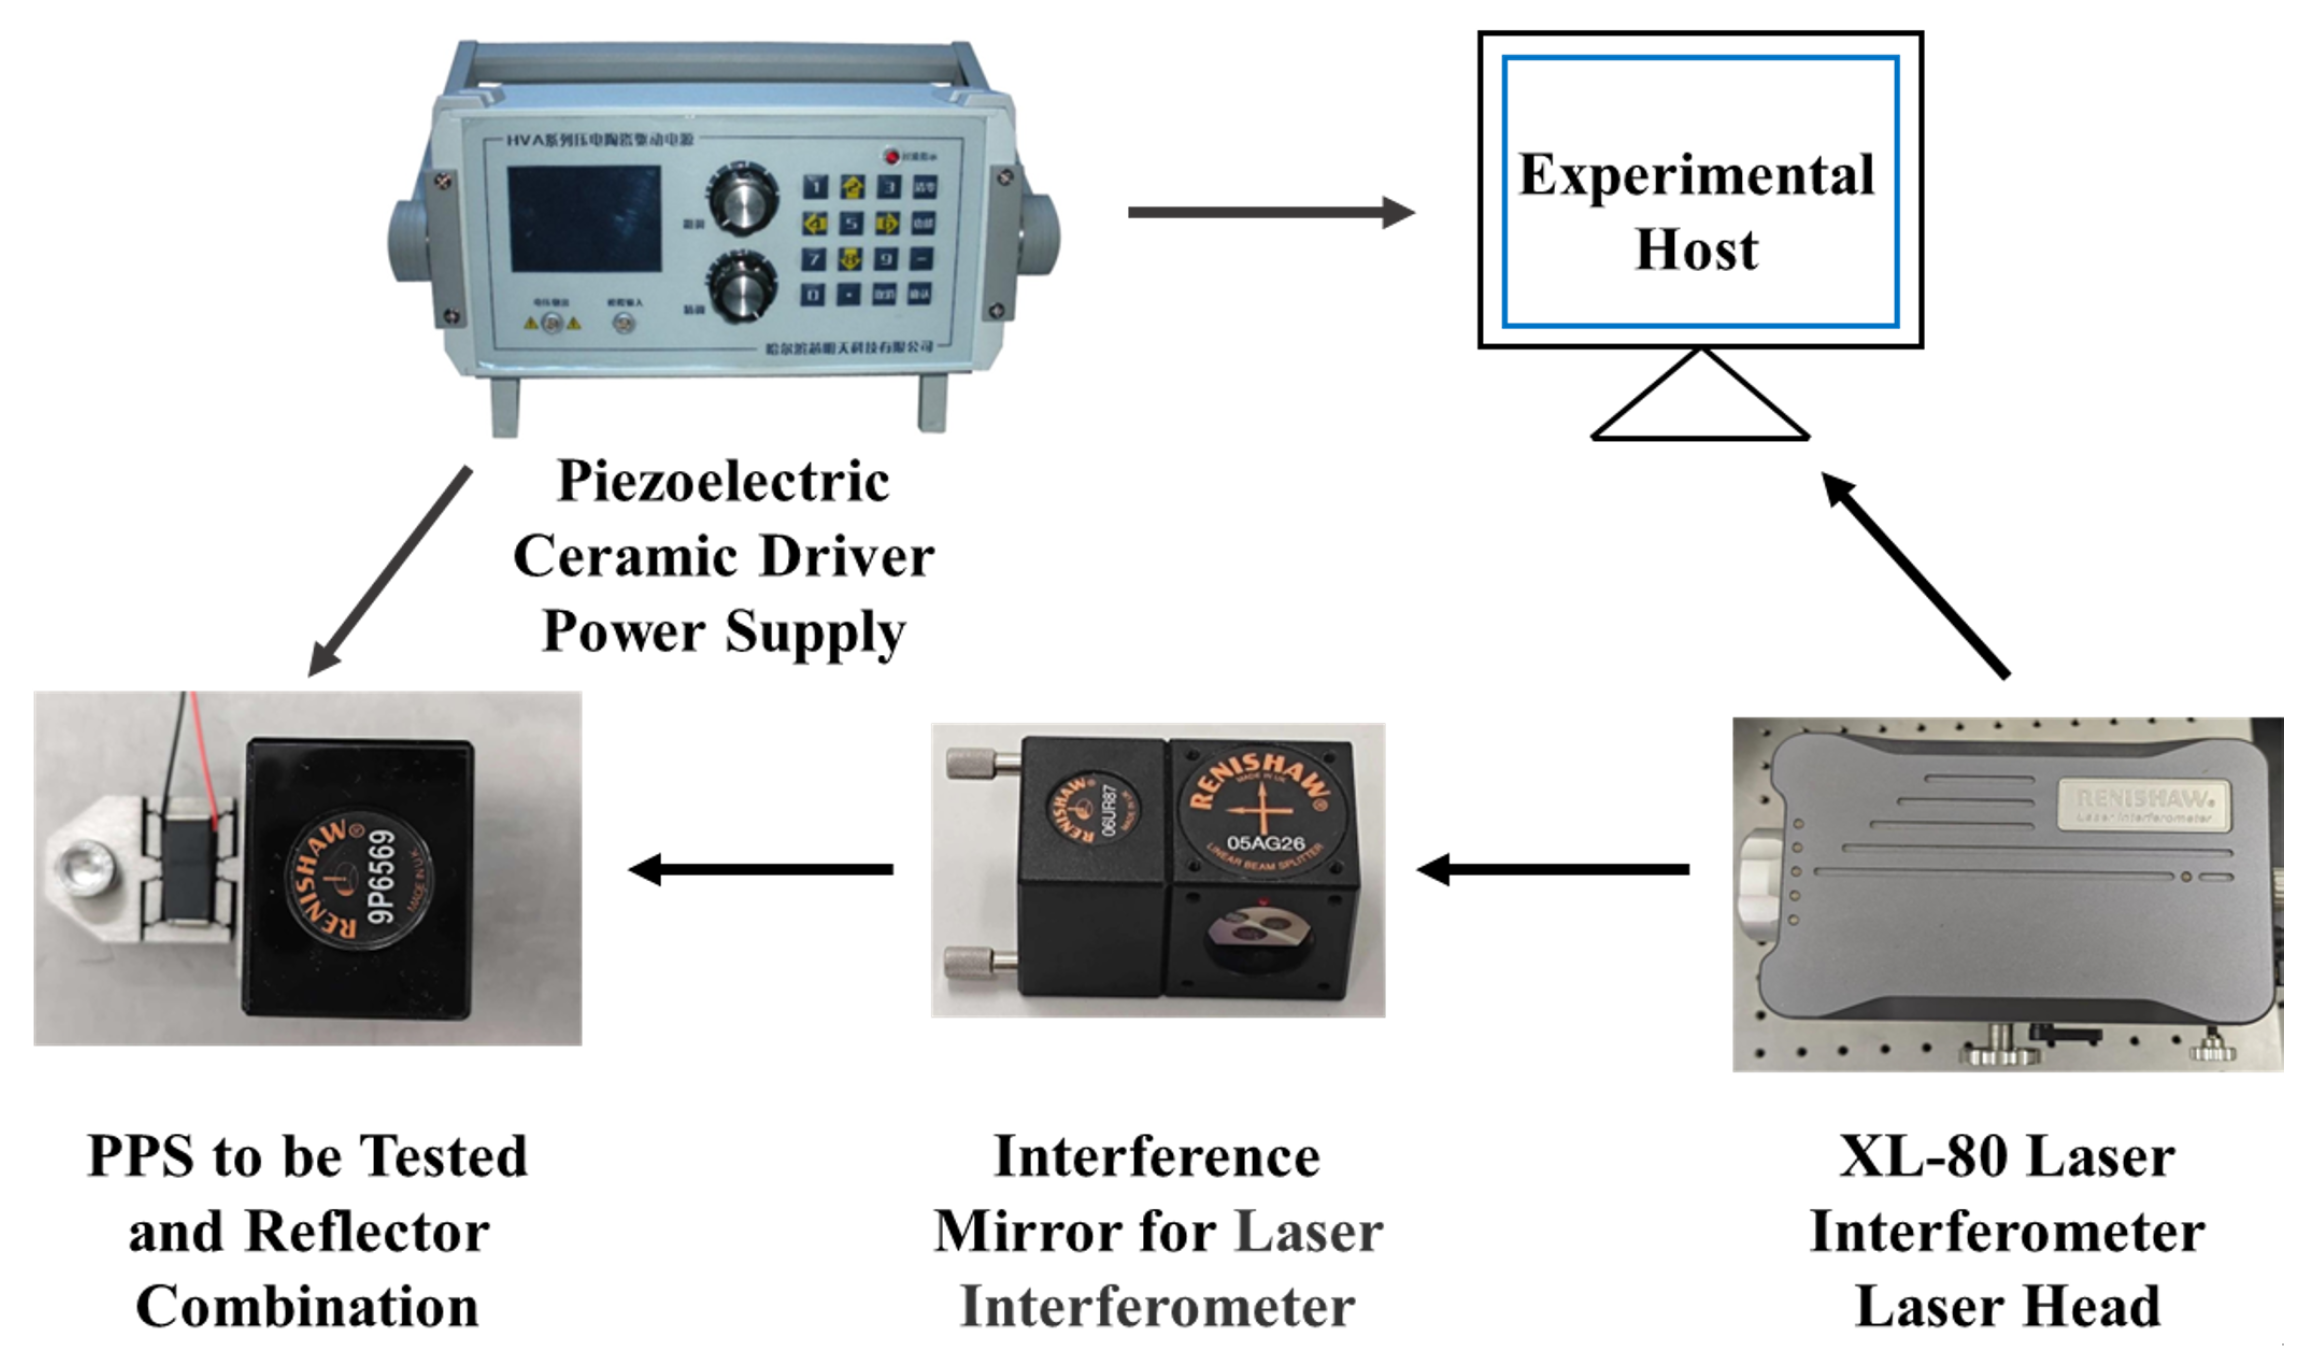
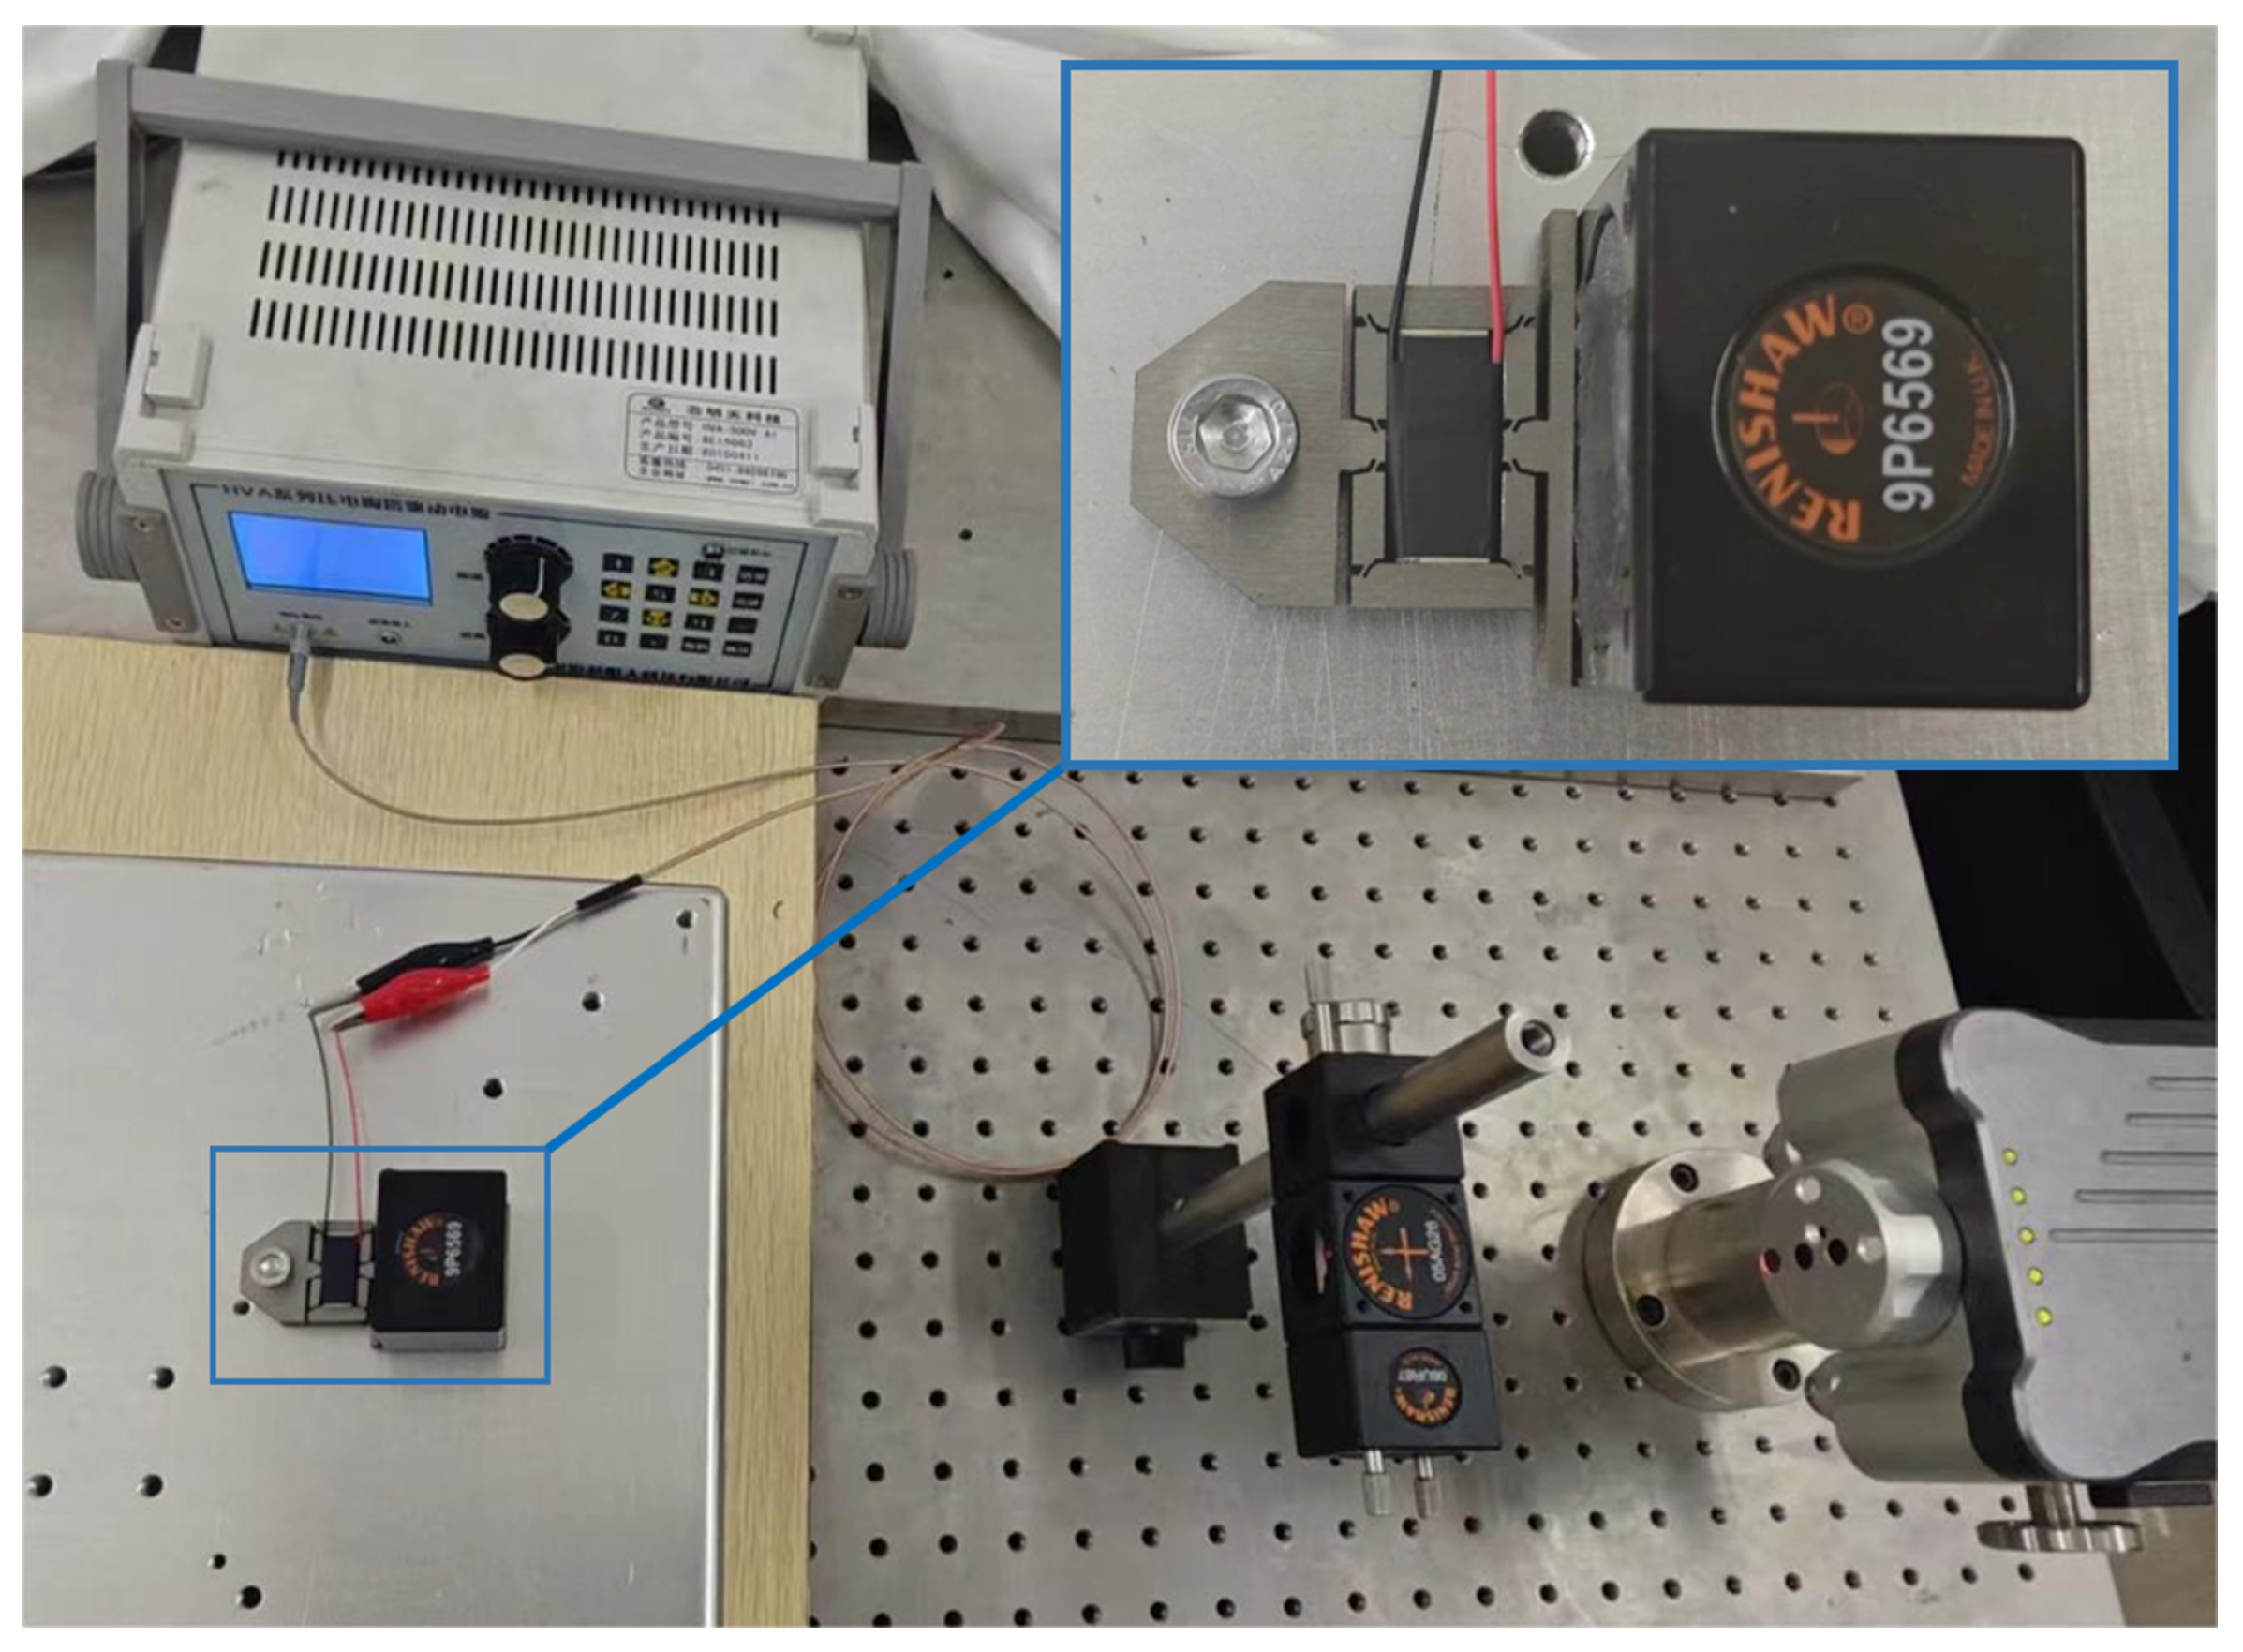
This predicted PEA behavior was then transformed into the final FHPS output displacement using the FFEM-derived kinematic amplification map from Figure 11. The resulting predicted nonlinear characteristic curve from the FPI-FFEM method was then ready for comparison against the actual measured hysteresis curve of the physical FHPS (Figure 14 and Figure 15). For comprehensive benchmarking, a prediction was also made using a conventional PI-FEM approach. The comparative results are shown and discussed in the subsequent analysis.
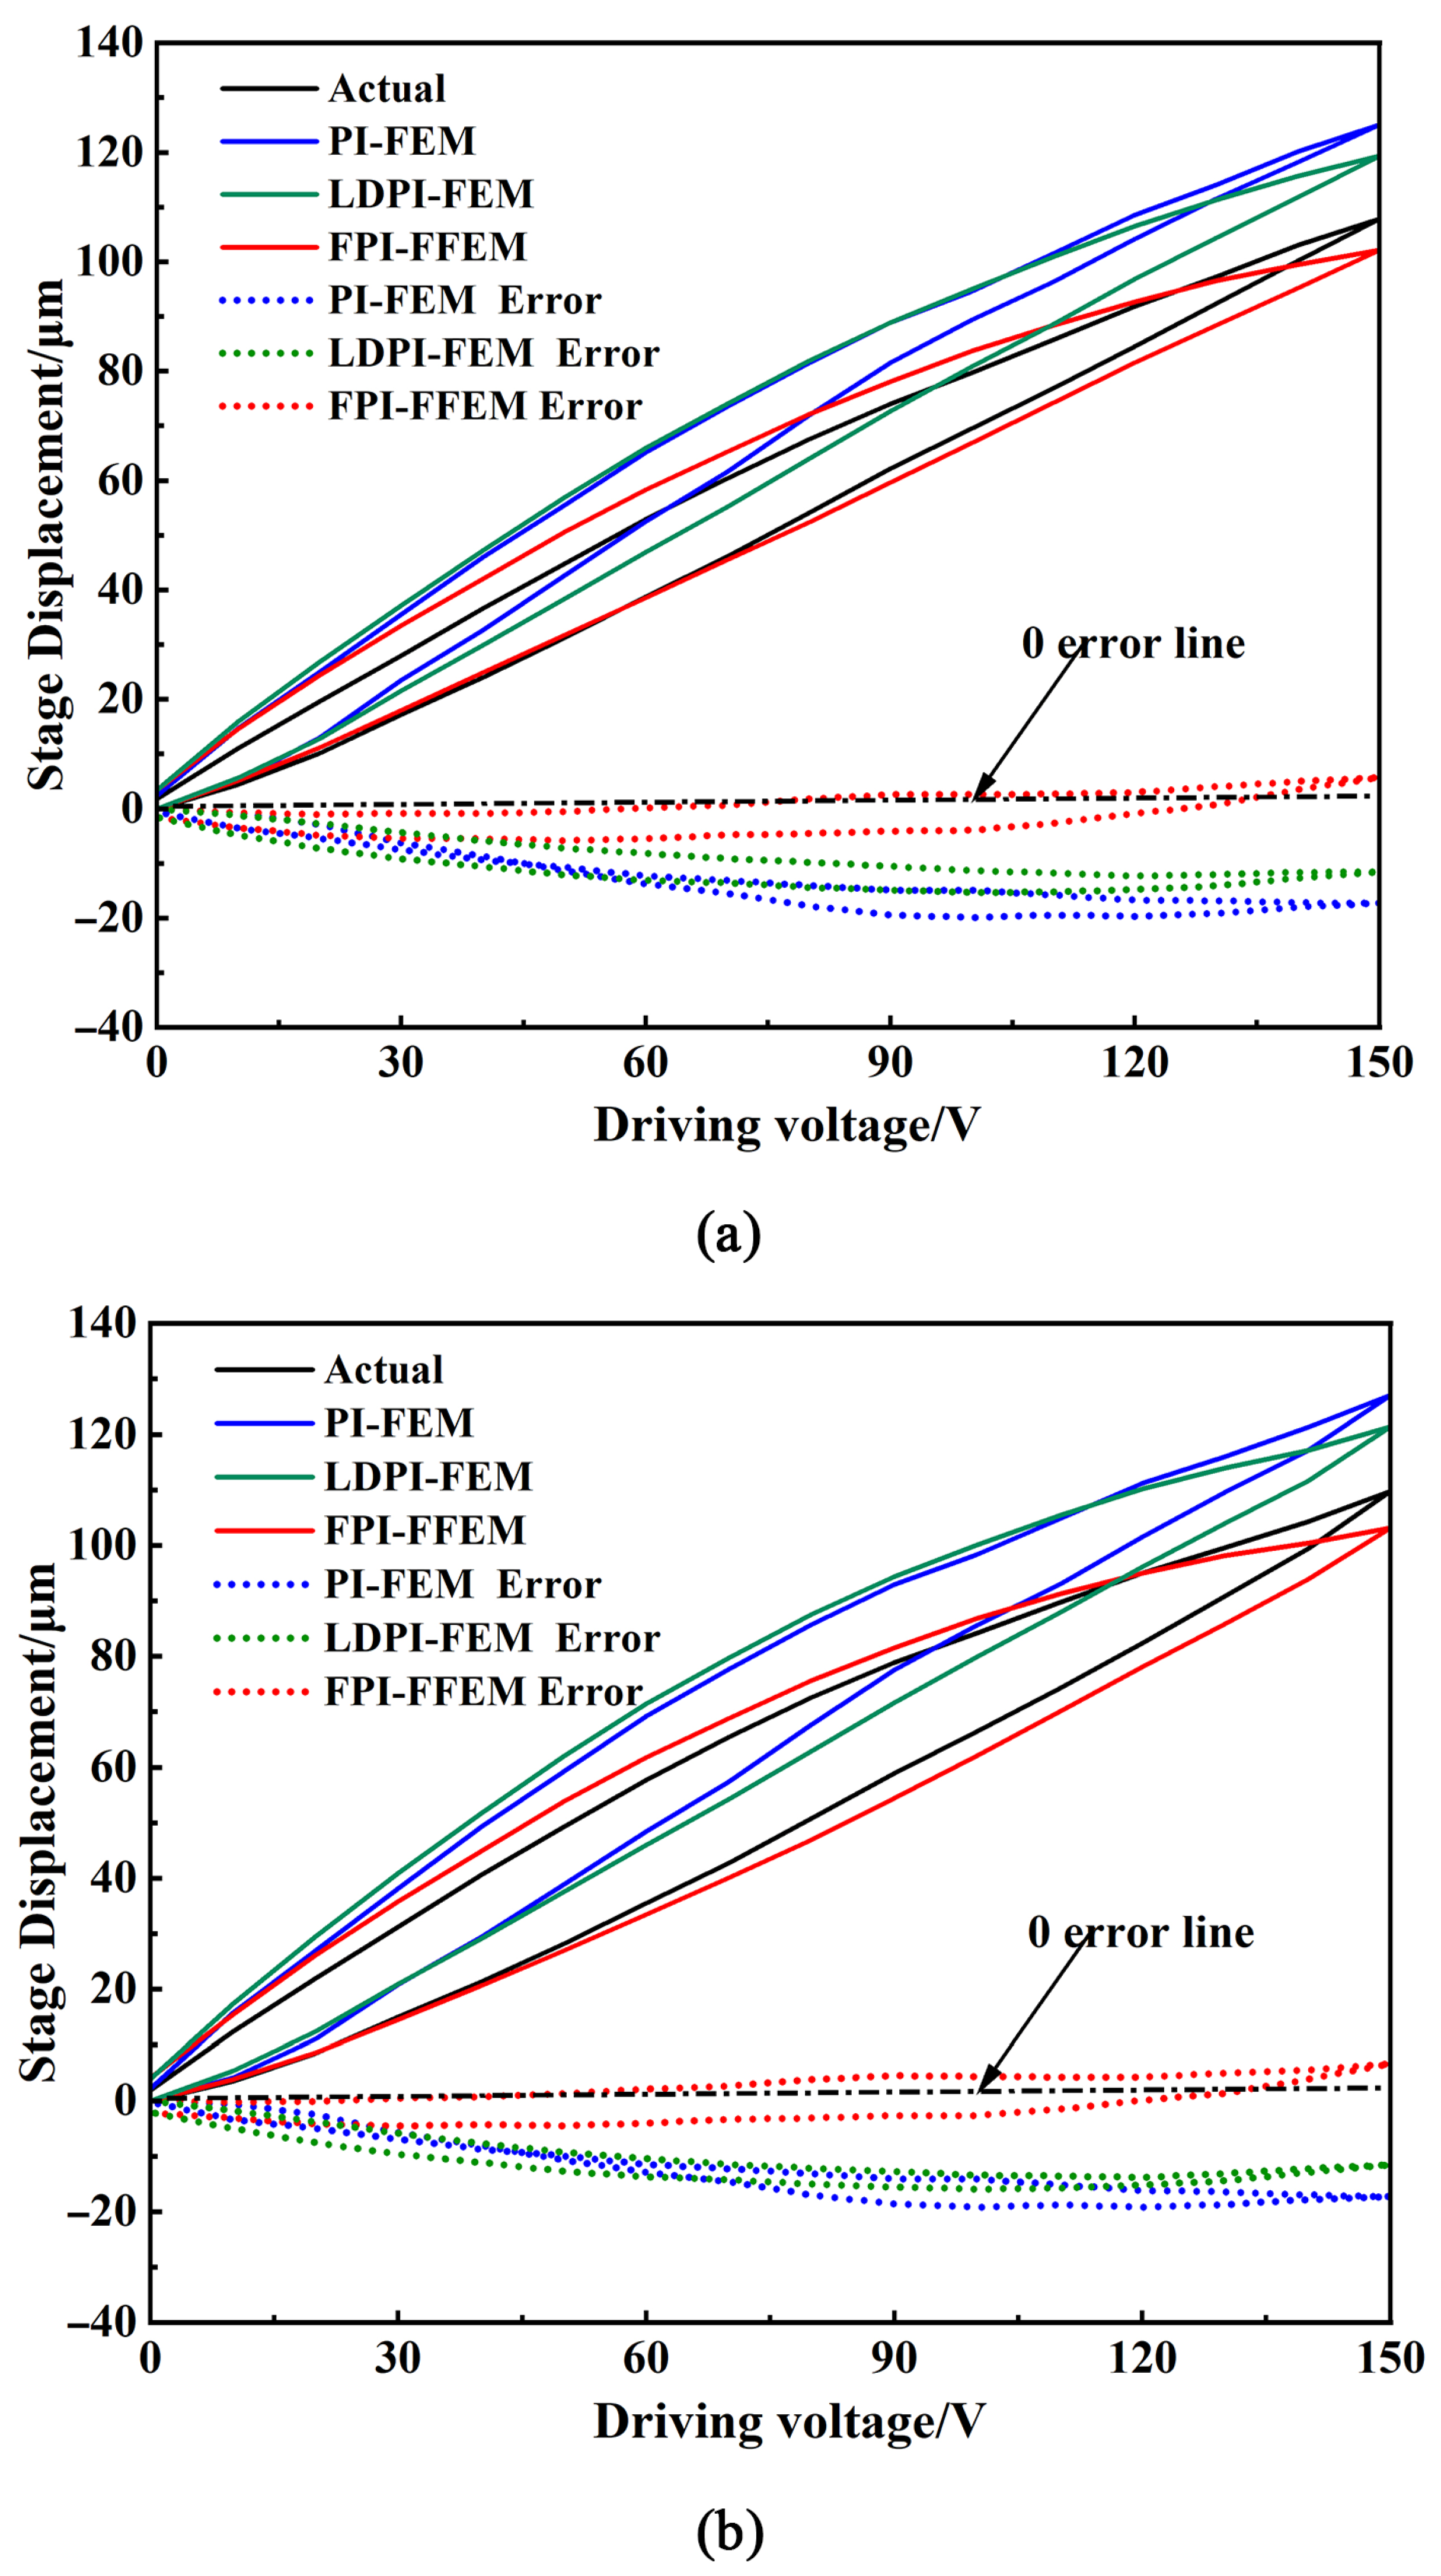
The results clearly demonstrate the superior accuracy of the proposed FPI-FFEM method. A visual comparison is presented in Figure 16, which plots the predicted nonlinear characteristic curves from all three methods against the experimental results. Specifically, Figure 16a shows the comparison under a 5 Hz frequency, while Figure 16b shows the results under 15 Hz. In both subfigures, it is evident that the FPI-FFEM predictions most closely align with the experimental measurements.
For a quantitative analysis, and to better validate the effectiveness of the proposed method, the LDPI (load-dependent Prandtl–Ishlinskii)-FEM method [21] was introduced for a final comparison. The Mean Absolute Error (MAE), defined as e ¯ M A E = 1 n k = 1 n | e k | , was calculated for all methods, with the results summarized in Table 4. Under the 5 Hz test condition, the MAE for the FPI-FFEM method was merely 2.882 μm. This represents a remarkable error reduction of approximately 76.7% compared to the conventional PI-FEM (12.343 μm) and 70.5% compared to the LDPI-FEM (9.772 μm). A similar trend of superior performance was observed under the 15 Hz condition, where the FPI-FFEM method’s MAE of 2.949 μm was also substantially lower, achieving an error reduction of 75.0% and 72.6% against PI-FEM and LDPI-FEM, respectively.
This significant and consistent reduction in prediction error across different frequencies confirms that the FPI-FFEM nonlinearity characterization method is both effective and feasible for accurately predicting the performance of a FHPS during its design phase.

4. Conclusions

This paper proposes a FPI model for PEA, along with an FPI-FFEM nonlinear characterization method for FHPS. Notably, the FPI model incorporates additional considerations under varying preload conditions, thereby better reflecting the operational realities of FHPS. In contrast to conventional FEM that solely correlates PEA’s output with FHPS deformation, the FFEM additionally captures force information of PEA from a flexible hinge at different actuation positions, making it a more suitable tool for integration with the FPI model. Experimental validation demonstrates that the FPI model outperforms the traditional PI model in tracking nonlinear characteristics induced by preload variations. Furthermore, final comparisons against both the conventional PI-FEM and the LDPI-FEM methods validate that the FPI-FFEM achieves significantly enhanced prediction accuracy, reducing the MAE by up to 76.7%.
The proposed FPI model incorporates more detailed application preload features of PEA than conventional voltage-displacement characteristic datasets. The FPI-FFEM nonlinearity characterization method addresses the coupled preload–displacement problem in PEA-actuation, and is applicable to all piezoelectric stages whose structures can be analyzed via FFEM. However, the computational workload may increase when the method applied to multi-degree-of-freedom stages, and the frequency-dependent hysteresis variations also need to be included in modeling. Future research should aim to remove these limitations.

Author Contributions

Conceptualization, X.W. and C.W.; methodology, Y.Y.; software, Z.Q.; validation, X.W., C.W. and Y.L.; formal analysis, X.W.; investigation, D.A.; resources, D.A.; data curation, C.W.; writing—original draft preparation, X.W. and C.W.; writing—review and editing, Y.Y. and Z.Q.; visualization, D.A.; supervision, Y.L.; project administration, Y.Y.; funding acquisition, Y.L. All authors have read and agreed to the published version of the manuscript.

Funding

This research was supported by the existing instruments in two Centers and received no funding.

Acknowledgments

The authors are grateful to the support from Ultra-Precision Motion Control and Measurement Engineering and Research Center of Fudan University, and Test and Analysis Center of Shenyang Jianzhu University.

Conflicts of Interest

The authors declare no conflicts of interest.

References

  1. Li, L.; Li, C.; Gu, G.; Zhu, L. Modified Repetitive Control Based Cross-Coupling Compensation Approach for the Piezoelectric Tube Scanner of Atomic Force Microscopes. IEEE/ASME Trans. Mechatronics 2019, 24, 666–676. [Google Scholar] [CrossRef]
  2. Meng, Y.; Li, L.; Wang, X.; Zhang, X.; Zhu, L. Data-driven based cross-coupling compensation method for the piezoelectric tube scanner of atomic force microscopes. Measurement 2023, 219, 113260. [Google Scholar] [CrossRef]
  3. Zheng, Z.; Zhao, Y.; Wang, G. Research on Piezoelectric Driving Microminiature Three-Legged Crawling Robot. J. Bionic Eng. 2023, 20, 1481–1492. [Google Scholar] [CrossRef]
  4. Wang, N.; Zhang, Z.; Zhang, X.; Liang, X. Performance comparison and analysis of three two-degree-of-freedom compliant precision positioning platforms. J. Mech. Eng. 2018, 54, 102–109. [Google Scholar] [CrossRef]
  5. Li, L.; Yao, J.; Guo, F.; Wang, Y.; Wang, L. Hybrid flexible hinge configuration design and flexibility modeling. J. Mech. Eng. 2022, 58, 78–91. [Google Scholar]
  6. Xie, X.; Cui, Y.; Yu, Y.; Chen, P. Modeling and identification of nonlinear hysteresis behavior of piezoelectric actuators using a computationally efficient phenomenological model and modified cuckoo search algorithm. Smart Mater. Struct. 2023, 32, 15013. [Google Scholar] [CrossRef]
  7. Mohammad, J.; Mohammad, S.; Tan, X. The Prandtl–Ishlinskii Hysteresis Model: Fundamentals of the Model and Its Inverse Compensator. IEEE Control Syst. Mag. 2023, 43, 66–84. [Google Scholar]
  8. Arockiarajan, A.; Delibas, B.; Menzel, A.; Seemann, W. Studies on rate-dependent switching effects of piezoelectric materials using a finite element model. Comput. Mater. Sci. 2006, 37, 306–317. [Google Scholar] [CrossRef]
  9. Dong, R.; Tan, Y.; Chen, H.; Xie, Y. A neural networks based model for rate-dependent hysteresis for piezoceramic actuators. Sens. Actuators A Phys. 2008, 143, 370–376. [Google Scholar] [CrossRef]
  10. Wang, W.; Wang, J.; Wang, R.; Chen, Z.; Han, F.; Lu, K.; Wang, C.; Xu, Z.; Ju, B. Modeling and Compensation of Dynamic Hysteresis with Force-Voltage Coupling for Piezoelectric Actuators. Micromachines 2021, 12, 1366. [Google Scholar] [CrossRef] [PubMed]
  11. Feng, Y.; Hu, Z.; Liang, M. Modelling of piezoelectric actuating systems subjected to variable loads and frequencies and applications to prescribed performance control. Int. J. Control 2023, 96, 2356–2373. [Google Scholar] [CrossRef]
  12. Cai, K.; Tian, Y.; Wang, F.; Zhang, D.; Shirinzadeh, B. Development of a piezo-driven 3-DOF stage with T-shape flexible hinge mechanism. Robot. Comput.-Integr. Manuf. 2016, 37, 125–138. [Google Scholar] [CrossRef]
  13. Yuan, L.; Wang, L.; Qi, R.; Zhao, Z.; Jin, J.; Zhao, C. A novel hollow-type XY piezoelectric positioning platform. Int. J. Mech. Sci. 2023, 255, 108496. [Google Scholar] [CrossRef]
  14. Yang, Z.; Li, X.; Tang, J.; Huang, H.; Zhao, H.; Cheng, Y.; Liu, S.; Li, C.; Xiong, M. A Bionic Stick–Slip Piezo-Driven Positioning Platform Designed by Imitating the Structure and Movement of the Crab. J. Bionic Eng. 2023, 20, 2590–2600. [Google Scholar] [CrossRef]
  15. Mishr, M.; Samantaray, A.; Chakraborty, G. Fractional-order Bouc-wen hysteresis model for pneumatically actuated continuum manipulator. Mech. Mach. Theory 2022, 173, 104841. [Google Scholar] [CrossRef]
  16. Fang, J.; Wang, J.; Li, C.; Zhong, W.; Long, Z. A Compound Control Based on the Piezo-Actuated Stage with Bouc–Wen Model. Micromachines 2019, 10, 861. [Google Scholar] [CrossRef]
  17. Zhang, M.; Cui, X.; Xiu, Q.; Zhuang, J.; Yang, X. Dynamic Modeling and Controlling of Piezoelectric Actuator Using a Modified Preisach Operator Based Hammerstein Model. Int. J. Precis. Eng. Manuf. 2023, 24, 537–546. [Google Scholar] [CrossRef]
  18. Lin, W.; Wing, H. Classical Preisach Model Based on Polynomial Approximation and Applied to Micro-Piezoelectric Actuators. Symmetry 2022, 14, 1008. [Google Scholar] [CrossRef]
  19. Zhang, C.; Zhou, M.; Nie, L.; Zhang, X.; Su, C.Y. Prandtl–Ishlinskii model based event-triggered prescribed control: Design and application to piezoelectric-driven micropositioning stage. Mech. Syst. Signal Process. 2023, 200, 110562. [Google Scholar] [CrossRef]
  20. Zhang, C.; Yu, Y.; Zhou, M.; Zhang, X. Event-triggered adaptive trajectory tracking control for hysteretic nonlinear systems with fixed-time performance. IEEE Trans. Syst. Man Cybern. Syst. 2024, 54, 5327–5338. [Google Scholar] [CrossRef]
  21. Feng, Y.; Li, Z.; Rakheja, S.; Jiang, H. A modified Prandtl-Ishlinskii hysteresis modeling method with load-dependent delay for characterizing magnetostrictive actuated systems. Mech. Sci. 2018, 9, 177–188. [Google Scholar] [CrossRef]
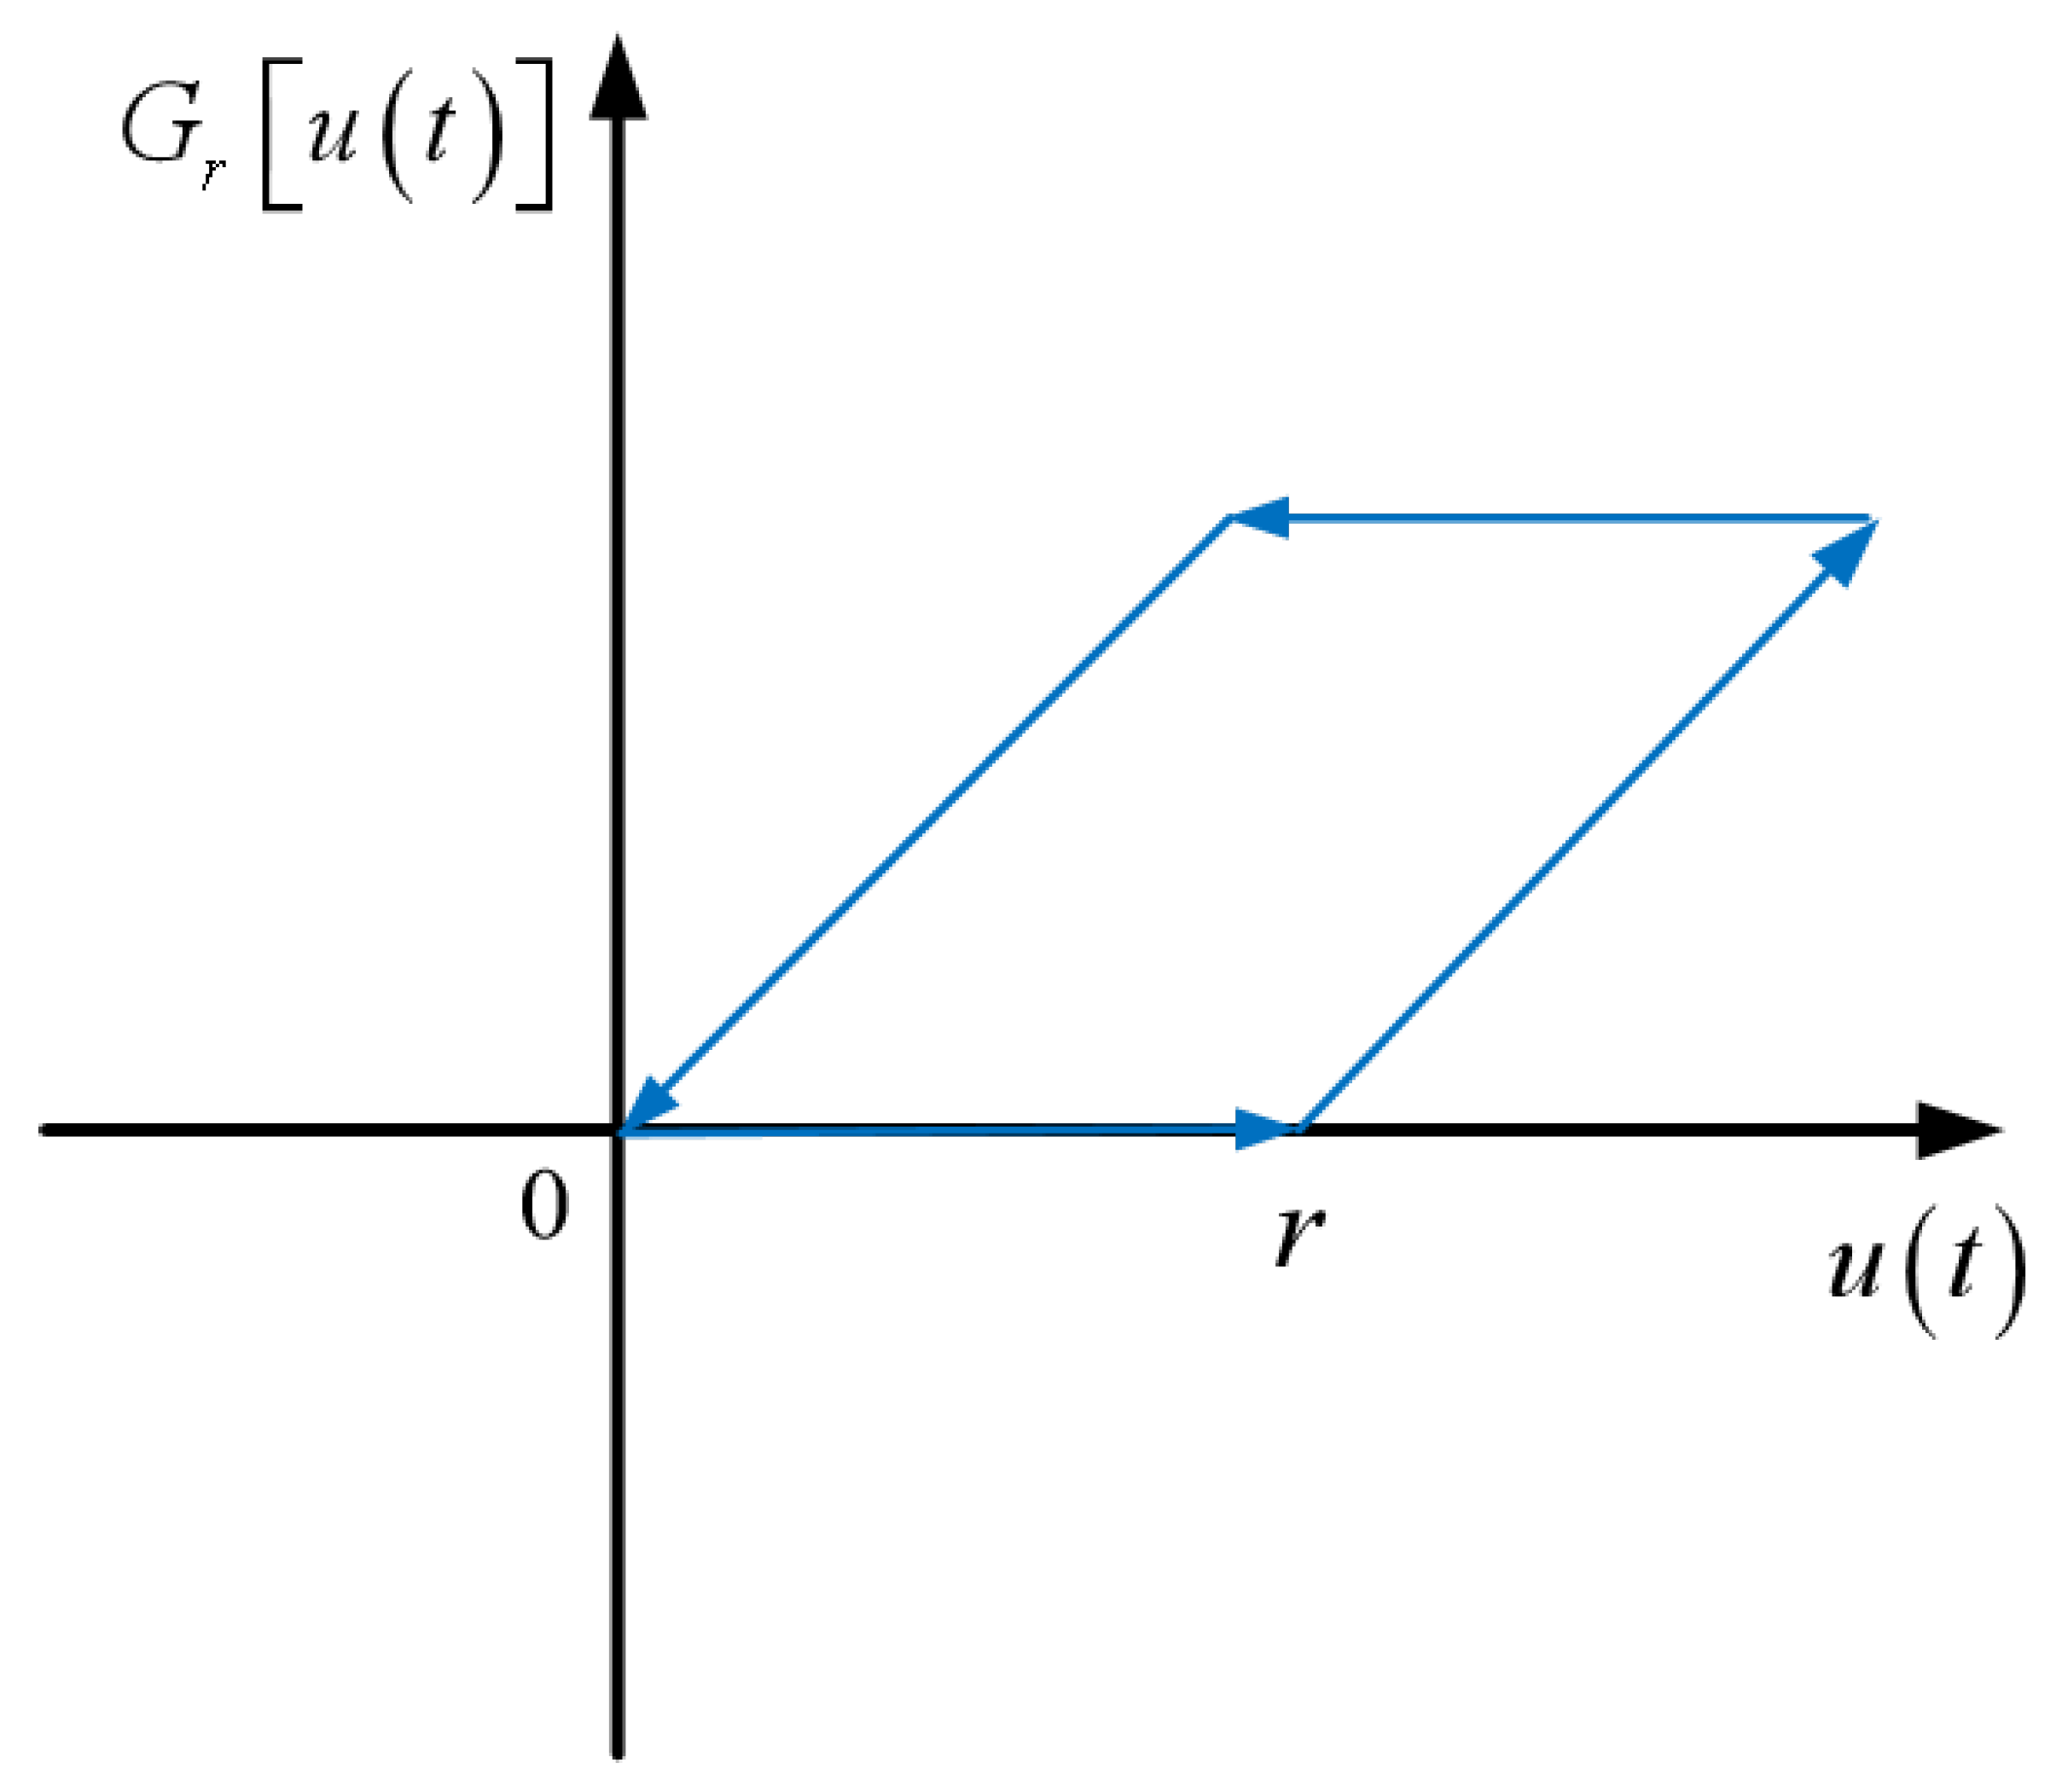
Figure 1. Input–output relationship of the one-sided play (OSP) operator.
Actuators 14 00411 g001
Figure 2. Schematic diagram of the relationship of U and t.
Actuators 14 00411 g002
Figure 3. Model of the experimental setup for measuring preload.
Actuators 14 00411 g003
Figure 4. Composition of the experimental system.
Actuators 14 00411 g004
Figure 5. Hysteresis characteristics. (a) Hysteresis curves at five different initial preloads. (b) Hysteresis surface formed by different hysteresis curves.
Actuators 14 00411 g005
Figure 6. Comparison of modeling curves for two models under different preloads: (a) 25 N; (b) 50 N; (c) 75 N; (d) 100 N; (e) 125 N; (f) 150 N.
Actuators 14 00411 g006
Figure 7. Comparison of modeling error curves for two models under different preloads: (a) 25 N; (b) 50 N; (c) 75 N; (d) 100 N; (e) 125 N; (f) 150 N.
Actuators 14 00411 g007
Figure 8. MTE and RMSE comparison of the two models under different preloads: (a) MTE. (b) RMSE.
Actuators 14 00411 g008
Figure 9. Dimensions of the FHPS for verification experiment. (a) Detailed dimensions. (b) 3D model. (c) 3D schematic model.
Actuators 14 00411 g009
Figure 10. Relationship between preload and displacement of the PEA from FFEM.
Actuators 14 00411 g010
Figure 11. Relationship between the displacement of the PEA and the displacement of the FHPS from FFEM.
Actuators 14 00411 g011
Figure 12. Hysteresis curve obtained from the intersection of the FFEM preload curve and the FPI hysteresis surface.
Actuators 14 00411 g012
Figure 13. Predicted PEA hysteresis curve projected onto the X-Z plane of Figure 12.
Actuators 14 00411 g013
Figure 14. Experimental system for measuring the nonlinear characteristic curve of the FHPS.
Actuators 14 00411 g014
Figure 15. Photograph of the actual measurement device for the FHPS.
Actuators 14 00411 g015
Figure 16. Comparison of predicted nonlinear characteristic curves from three methods with experimental results under tow frequencies: (a) 5 Hz. (b) 15 Hz.
Actuators 14 00411 g016
Table 1. Algorithm for the FPI-FFEM Nonlinearity Characterization Method.
Input:
   1. Experimental PEA Dataset (Voltage–Force–Displacement).
   2. Geometric and material properties of the FHPS.
   3. Target driving voltage cycle, u target ( t ) .
Output:
   The predicted nonlinear hysteresis curve of the FHPS, x FHPS ( t ) .
Part I: Model Calibration
Step 1Calibrate FPI Model Parameters:
Using the experimental Voltage–Force–Displacement dataset, perform a system identification procedure on the FPI model. This optimization process simultaneously determines the classical PI parameters (weighting coefficients w i and thresholds r i ) and the crucial force–voltage coupling coefficient, k f .
Output: A calibrated FPI model defined by the identified parameter set { w i , r i , k f } , which describes the PEA’s intrinsic electromechanical behavior.
Part II: FFEM System Characterization
Step 2Develop FEM Model:
Construct a high-fidelity 3D FEM model of the FHPS based on its geometry and material properties.
Output: A virtual stage that accurately reflects the system’s mechanics.
Step 3Characterize System Dynamics via FFEM:
For a range of prescribed PEA displacements, x PEA , j , applied to the model’s interface:
   a. Compute the reaction force, F p , j , via static structural analysis.
   b. Measure the corresponding FHPS output displacement, x FHPS , j .
Output: Two key mappings: the dynamic preload map F p = f F ( x PEA ) and the kinematic amplification map x FHPS = f K ( x PEA ) .
Part III: Prediction and Integration
Step 4Predict System Response:
For each time step t k in the target voltage cycle u target ( t k ) :
   a. Solve for PEA Displacement: Find the PEA displacement x PEA ( t k ) that satisfies the coupled FPI equation, using the identified coefficient k f from Step 1:
x PEA ( t k ) = Y [ u ^ ( t k ) ] ,   where   u ^ ( t k ) = u target ( t k ) k f · f F ( x PEA ( t k ) )
   b. Predict Stage Output: Use the kinematic map to find the final output:
x FHPS ( t k ) = f K ( x PEA ( t k ) )
Step 5Construct Hysteresis Curve:
Repeat Step 4 for the entire voltage cycle. Assemble all calculated points ( u target ( t k ) , x FHPS ( t k ) ) to construct the complete predicted nonlinear characteristic curve of the FHPS.
Output: The final predicted hysteresis curve for experimental comparison.
Table 2. Feature comparison of FPI-FFEM and PI-FEM methods.
Core FeaturePI-FEMFPI-FFEM
Considers Displacement Relationship
Considers Changing Preload×
PEA to FHPS’s Deformation Analysis
PEA’s Force–Displacement Coupling Analysis×
Table 3. Parameter identification results of the PI and FPI models.
PIFPI
i r i w i w i 1 w i 2
10 8.51 × 10 2 6.02 × 10 2 5.01 × 10 2
210 3.05 × 10 11 1.03 × 10 2 9.98 × 10 3
320 1.08 × 10 12 3.59 × 10 2 7.78 × 10 6
430 3.57 × 10 3 6.04 × 10 4 9.95 × 10 3
540 4.75 × 10 3 8.18 × 10 14 1.01 × 10 2
650 5.66 × 10 12 6.42 × 10 15 2.65 × 10 3
760 1.30 × 10 12 3.34 × 10 15 5.70 × 10 3
870 2.10 × 10 11 1.94 × 10 15 1.11 × 10 11
980 4.87 × 10 12 2.29 × 10 15 4.68 × 10 12
1090 7.26 × 10 14 3.18 × 10 15 3.17 × 10 12
Table 4. Comparison of error results between the methods.
MethodMAE Under 5 Hz (μm)MAE Under 15 Hz (μm)
PI-FEM12.34311.792
LDPI-FEM9.77210.765
FPI-FFEM2.8822.949
Disclaimer/Publisher’s Note: The statements, opinions and data contained in all publications are solely those of the individual author(s) and contributor(s) and not of MDPI and/or the editor(s). MDPI and/or the editor(s) disclaim responsibility for any injury to people or property resulting from any ideas, methods, instructions or products referred to in the content.