As shown in
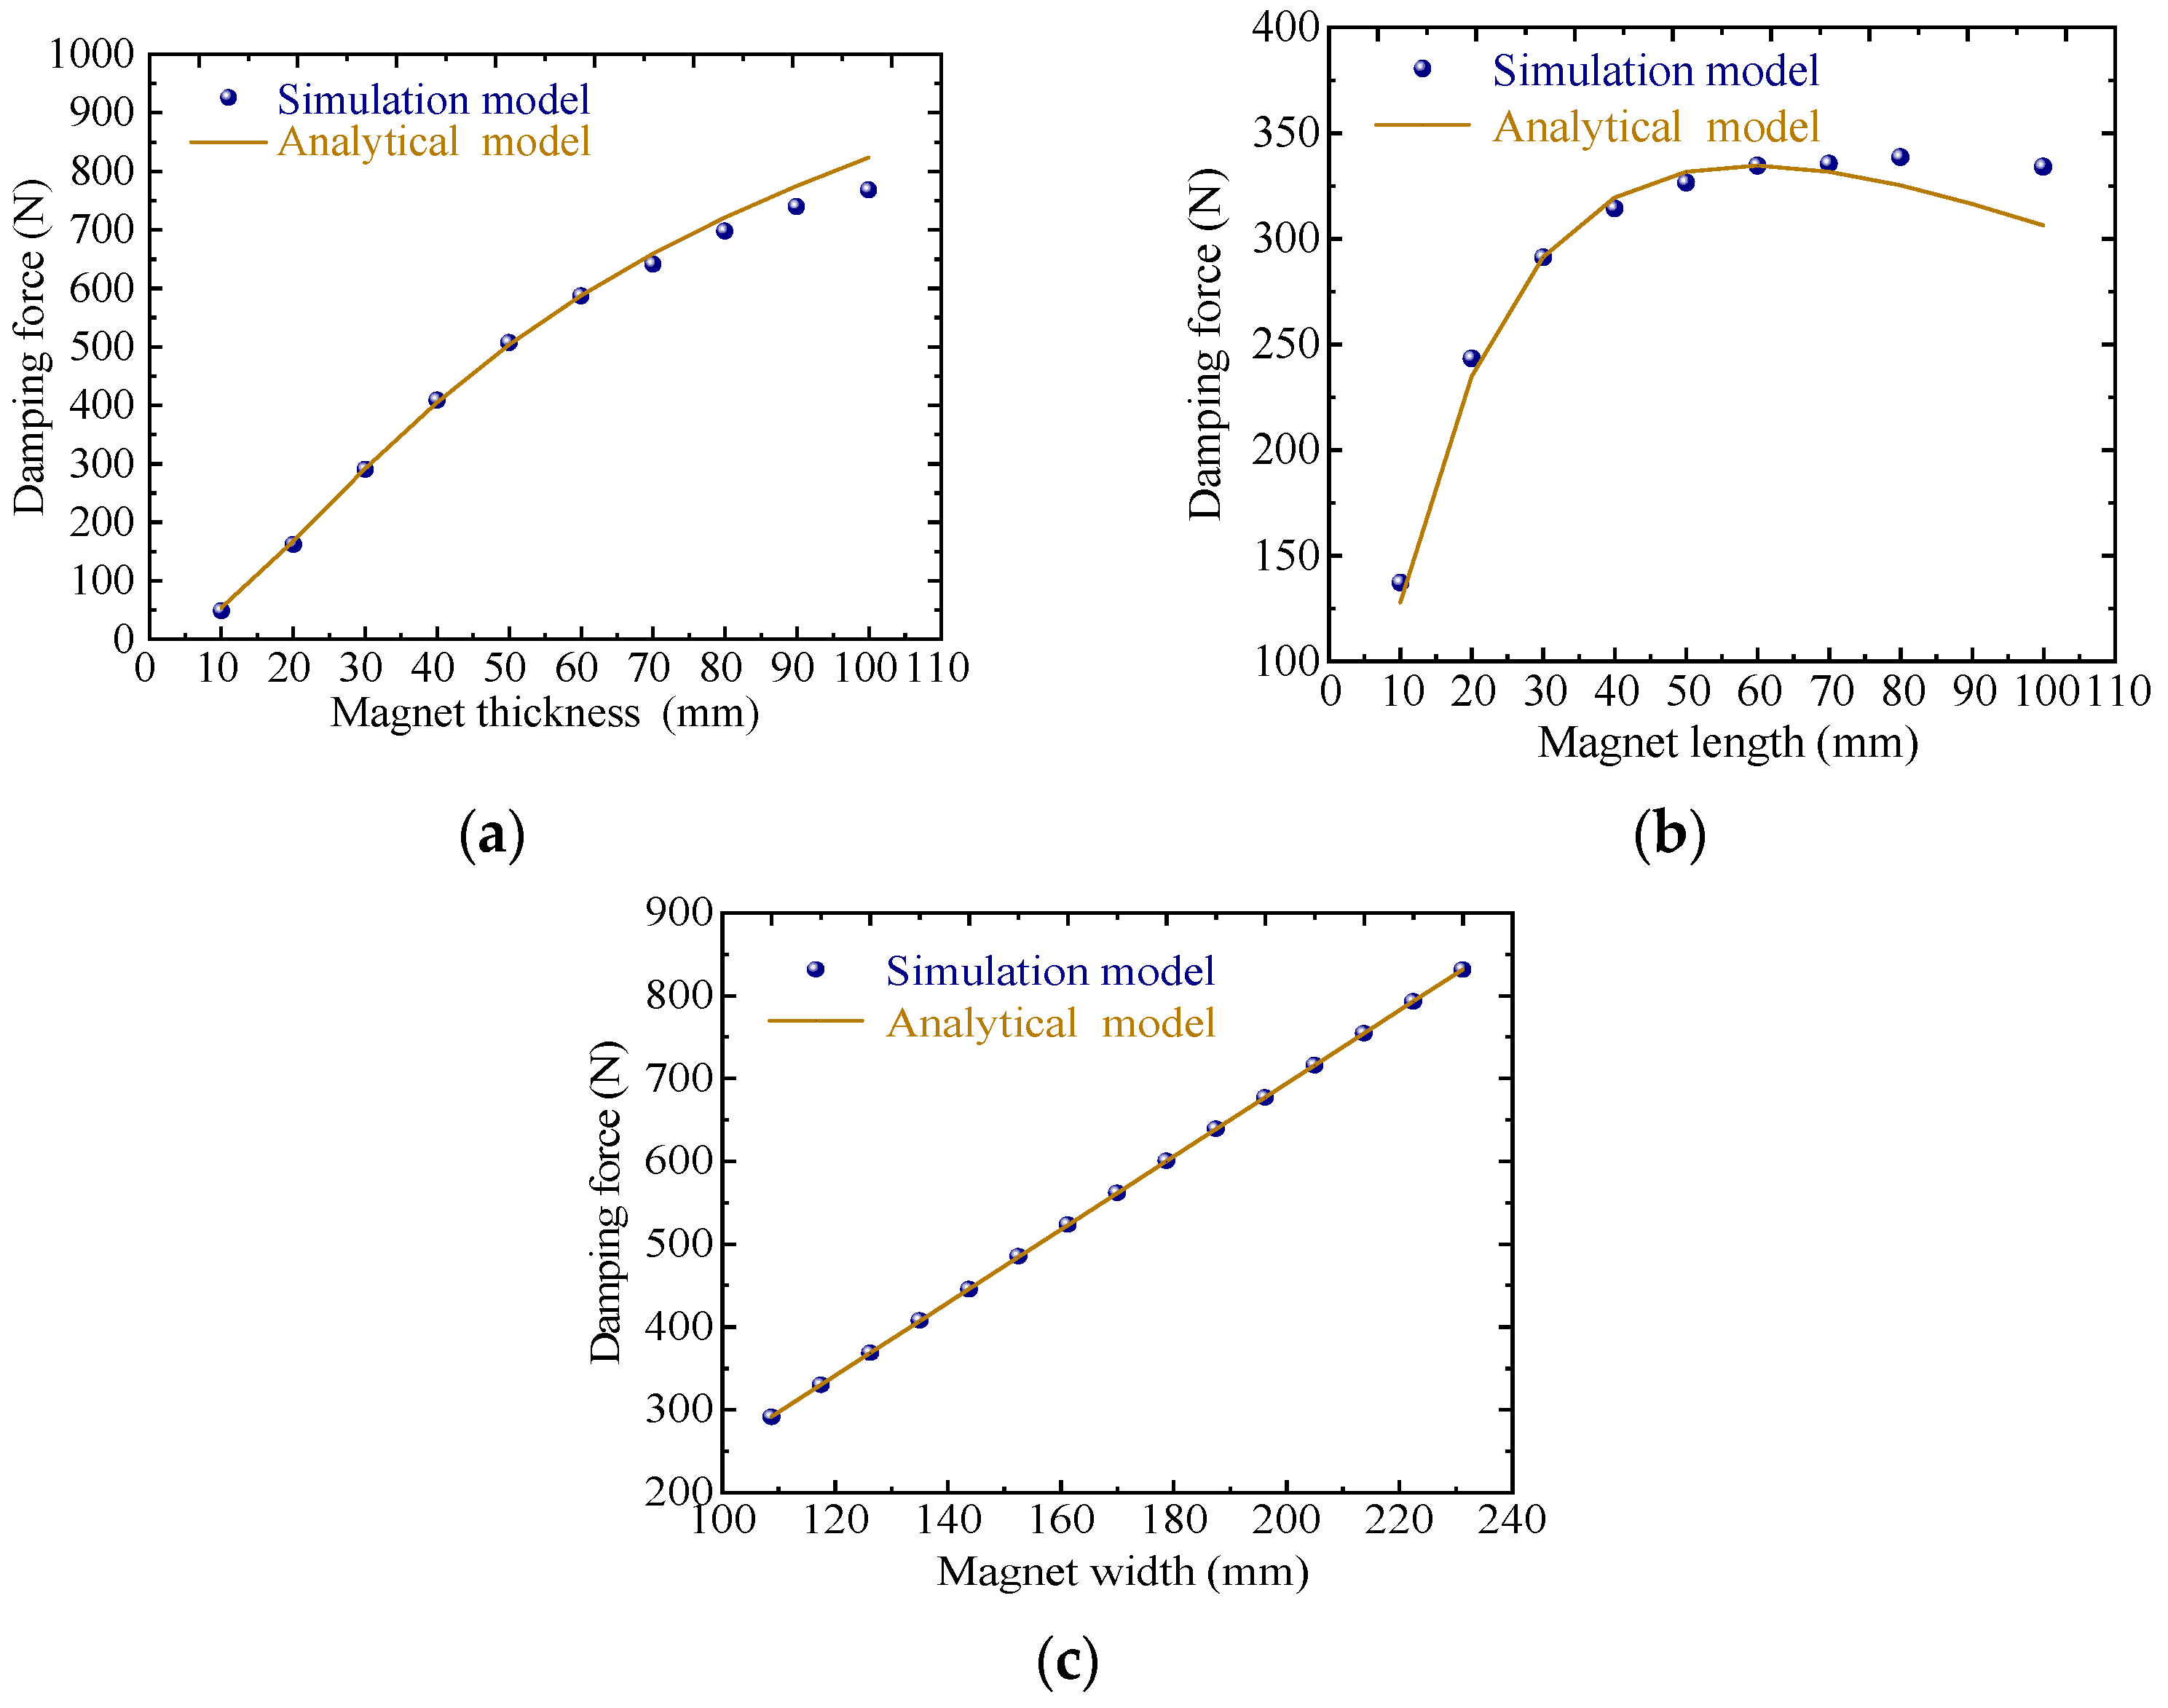
Figure 3a, the simulation results align well with the analytical predictions, confirming that the damping force exhibits a strong positive correlation with magnet thickness. Across the tested range, the damping force increases sharply with thicker magnets. As observed in
Figure 3b, the damping force along the magnet length initially increases and then decreases, with the peak shifting toward greater lengths as thickness increases. As illustrated in
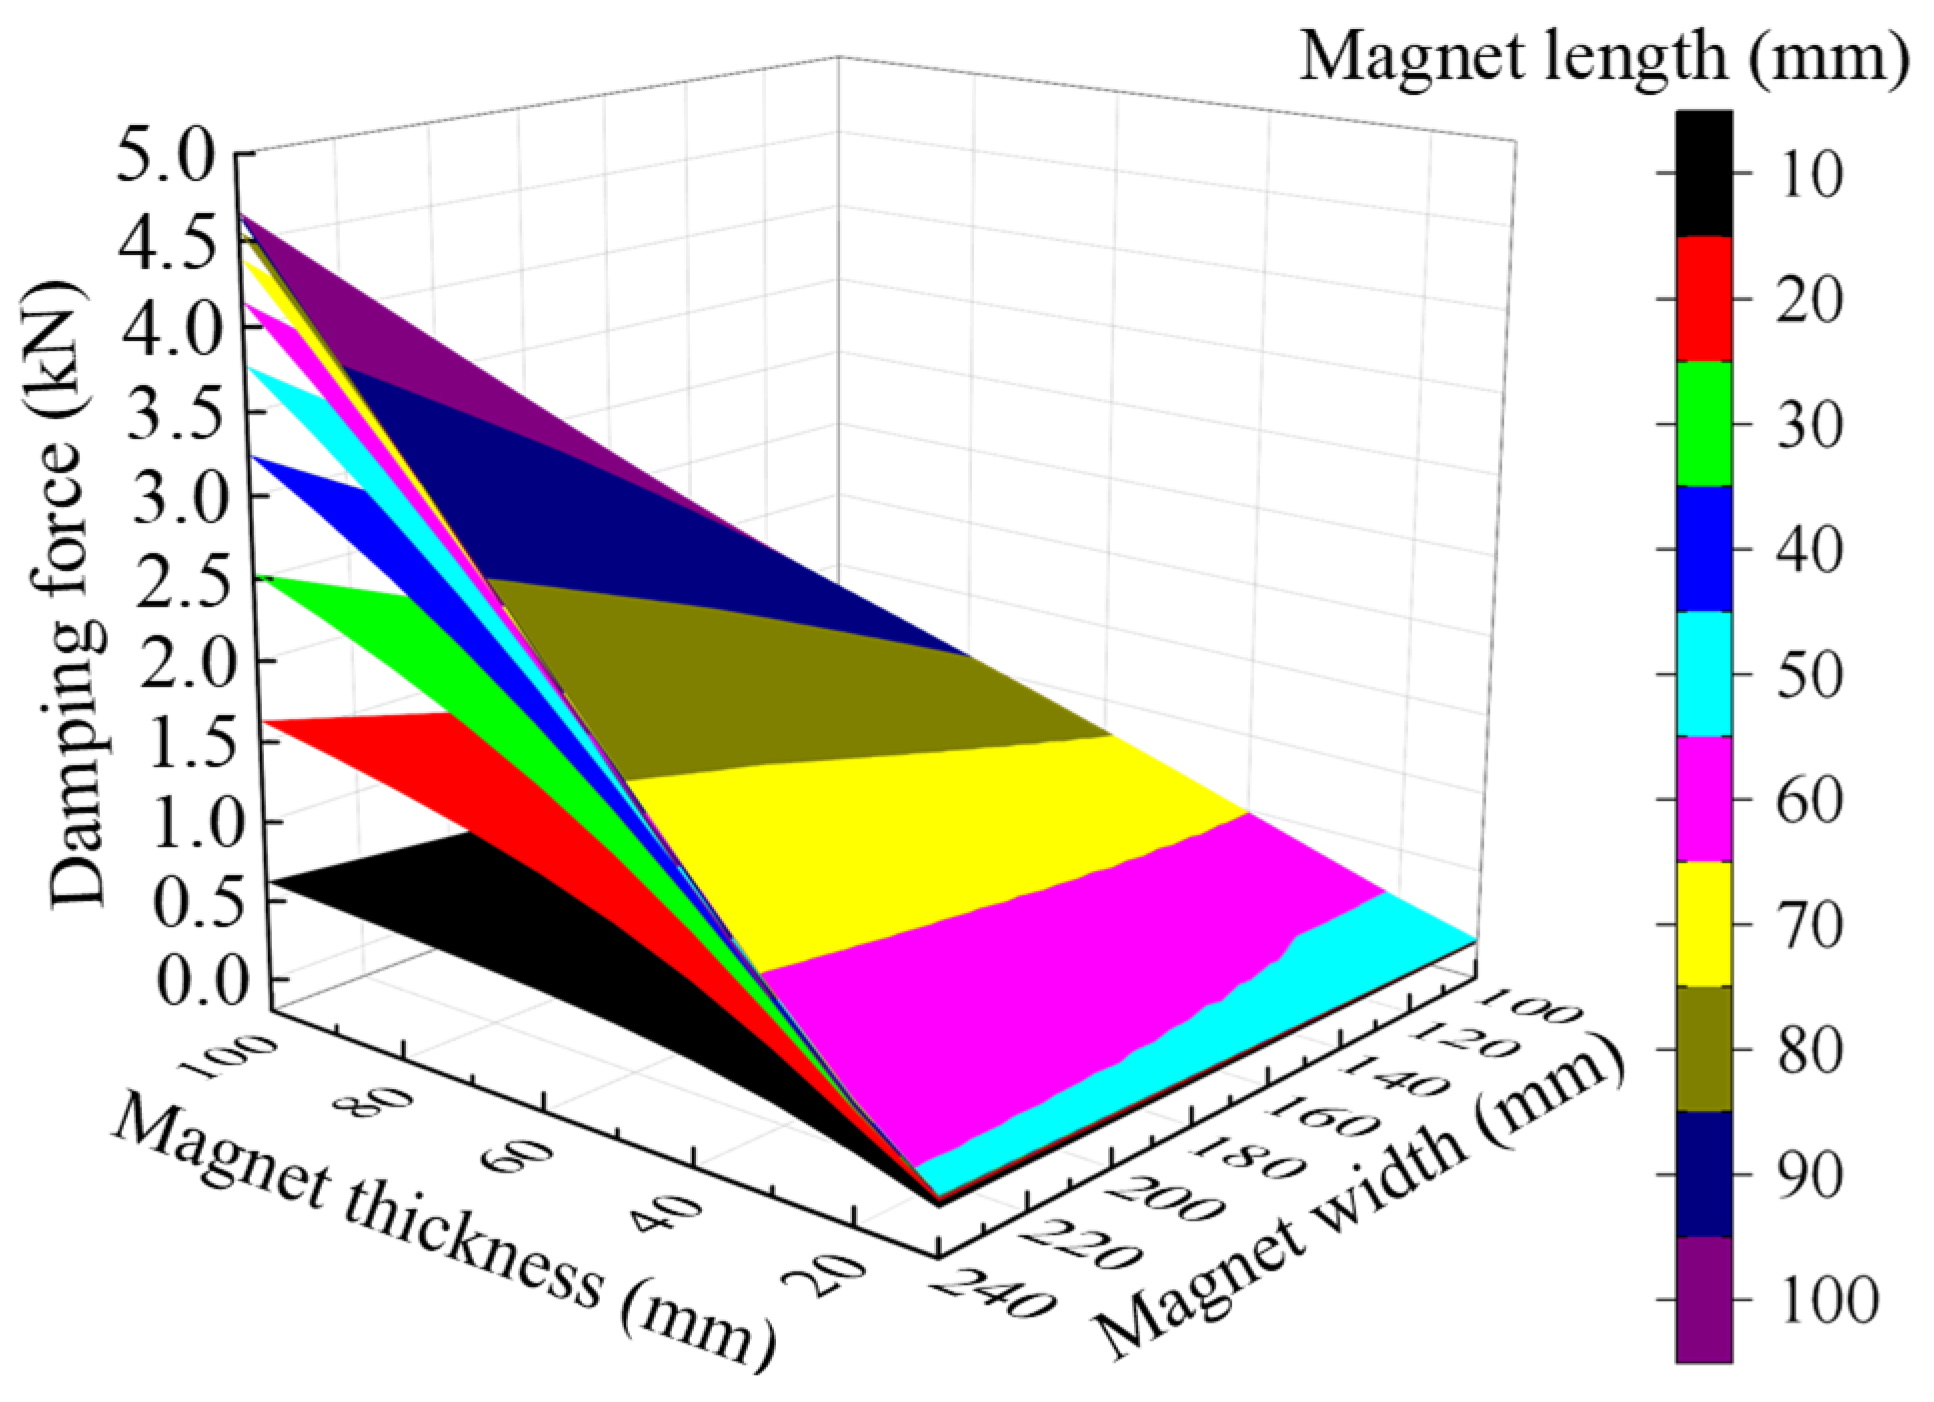
Figure 3c, the damping force rises steadily with magnet width, though at a slower rate compared to the thickness dependence. These trends remain consistent under coupled variations of magnet length, thickness, and width.
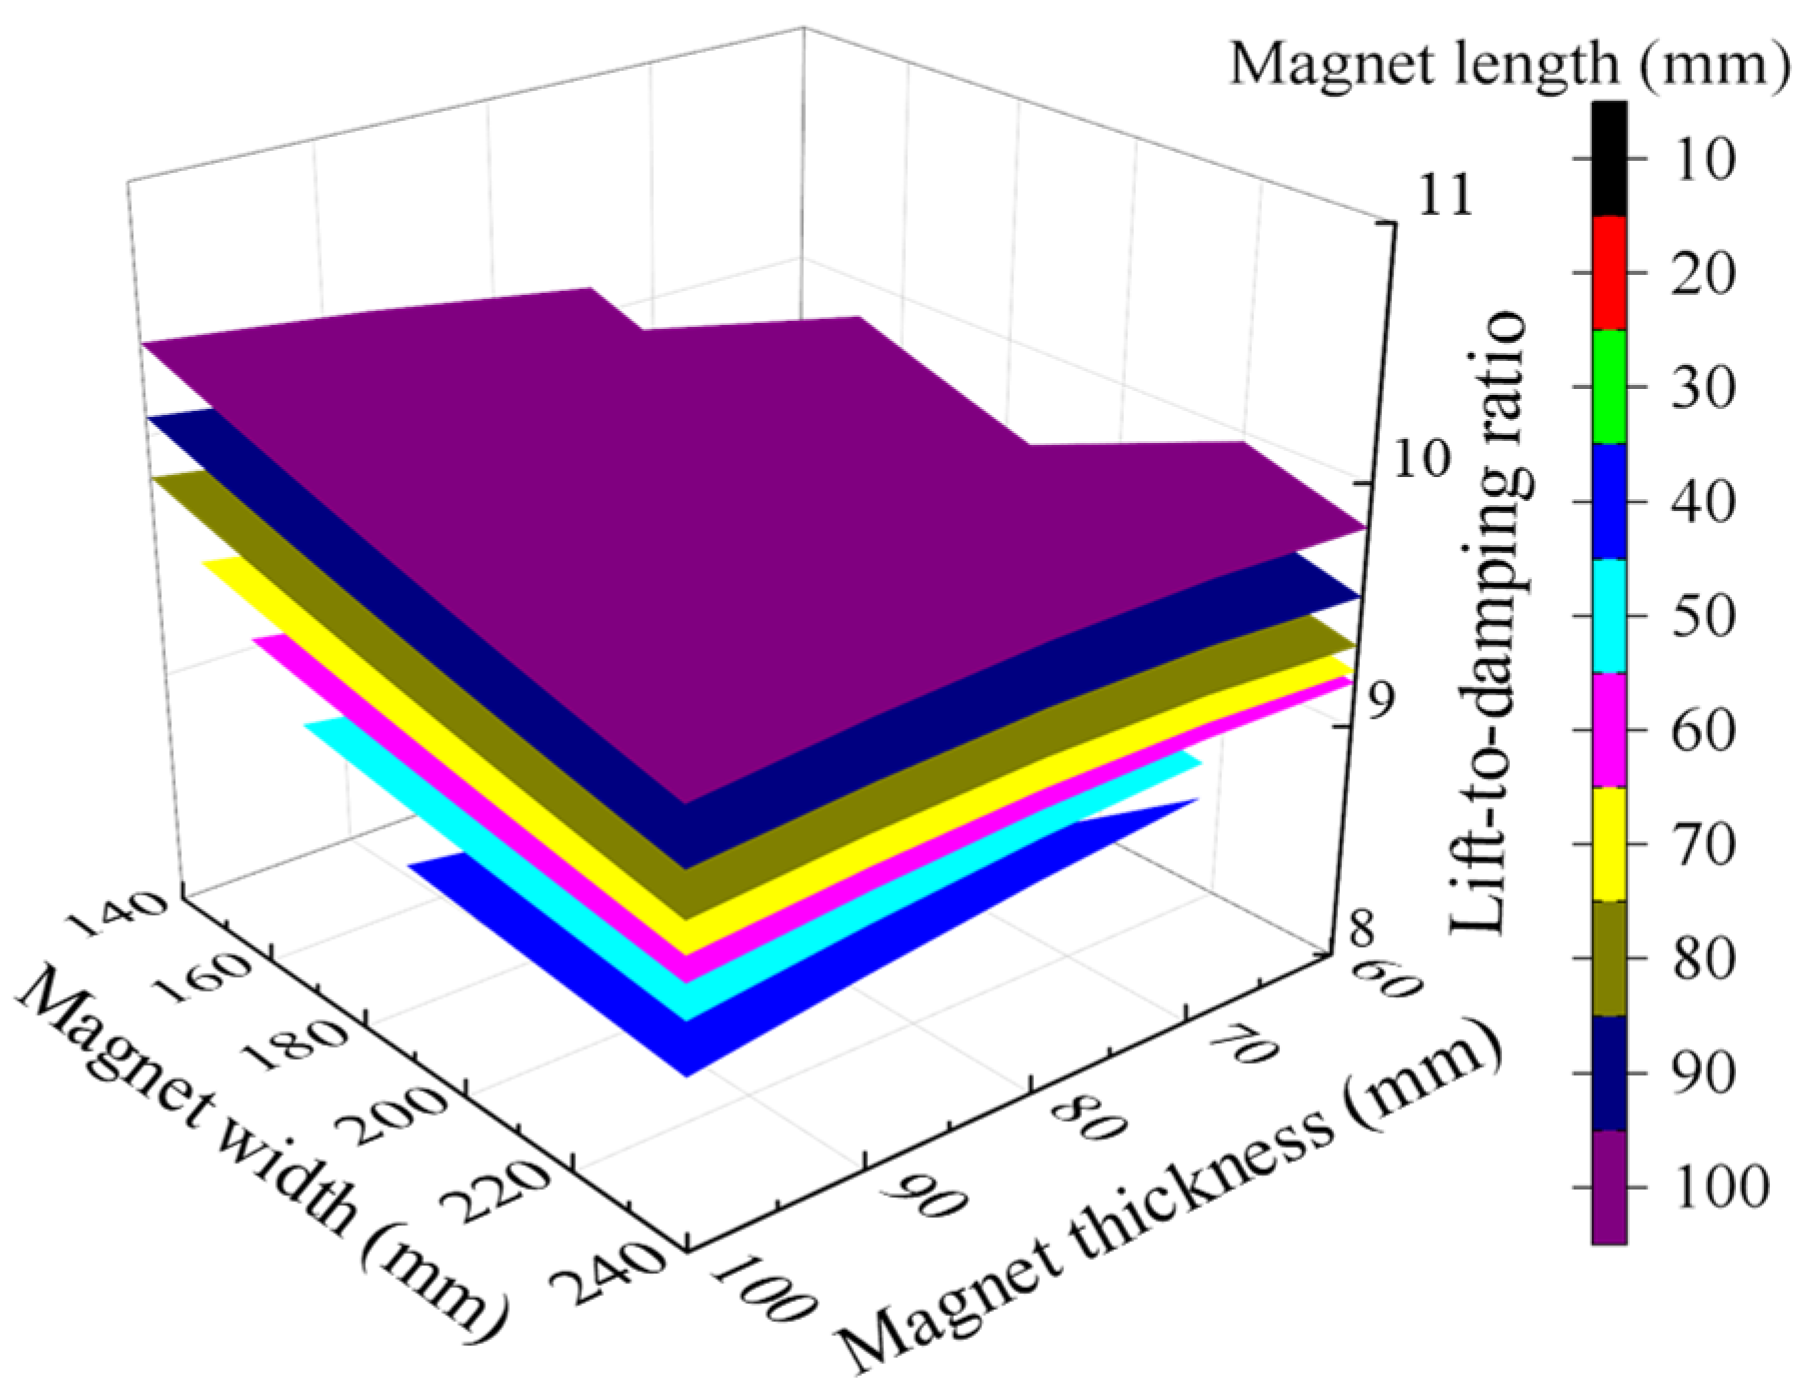
Figure 3 presents the three-dimensional parameter space, revealing how synergistic geometric interactions influence damping force generation.
To achieve optimal magnet design that satisfies both levitation and damping requirements, the levitation-to-damping force ratio
Rc is considered as the primary optimization criterion, as defined in Equation (2). This defines
Fl as the levitation force,
Fc as the damping force, and
Rc as the levitation-to-damping force ratio. The optimization objective focuses on maximizing the eddy-current-induced damping forces, where lower values of the characteristic ratio
Rc indicate superior damping performance.
For the levitation magnets that require both minimized levitation-to-damping force ratio
Rc and satisfied suspension performance, an optimization objective function is established, as shown in Equation (3), considering the critical influence of magnet dimensions on electromagnetic forces. Based on this objective function and the preceding damping force analysis in
Figure 3,
Figure 4 and
Figure 5, which demonstrates the influences of the magnet dimensions on the levitation-to-damping force ratio. This integrated approach enables the comprehensive evaluation of the geometric dependencies while ensuring optimal suspension performance. In Equation (3), the parameters
w0 and
d0 denote the width and thickness of the magnet, respectively.
Optimal Design of Damping Plate
The damping force is generated through electromagnetic interactions between the end fields of PMs and the conductive damping plate, with its magnitude being highly sensitive to the damping plate. Building upon the optimized PMs dimensions, this subsection evaluates primary damping plate parameters, including vertical vibration speed, thickness, conductivity, temperature rise, and operation gap. The optimal damping plate provides essential input parameters for subsequent vehicle dynamic analysis.
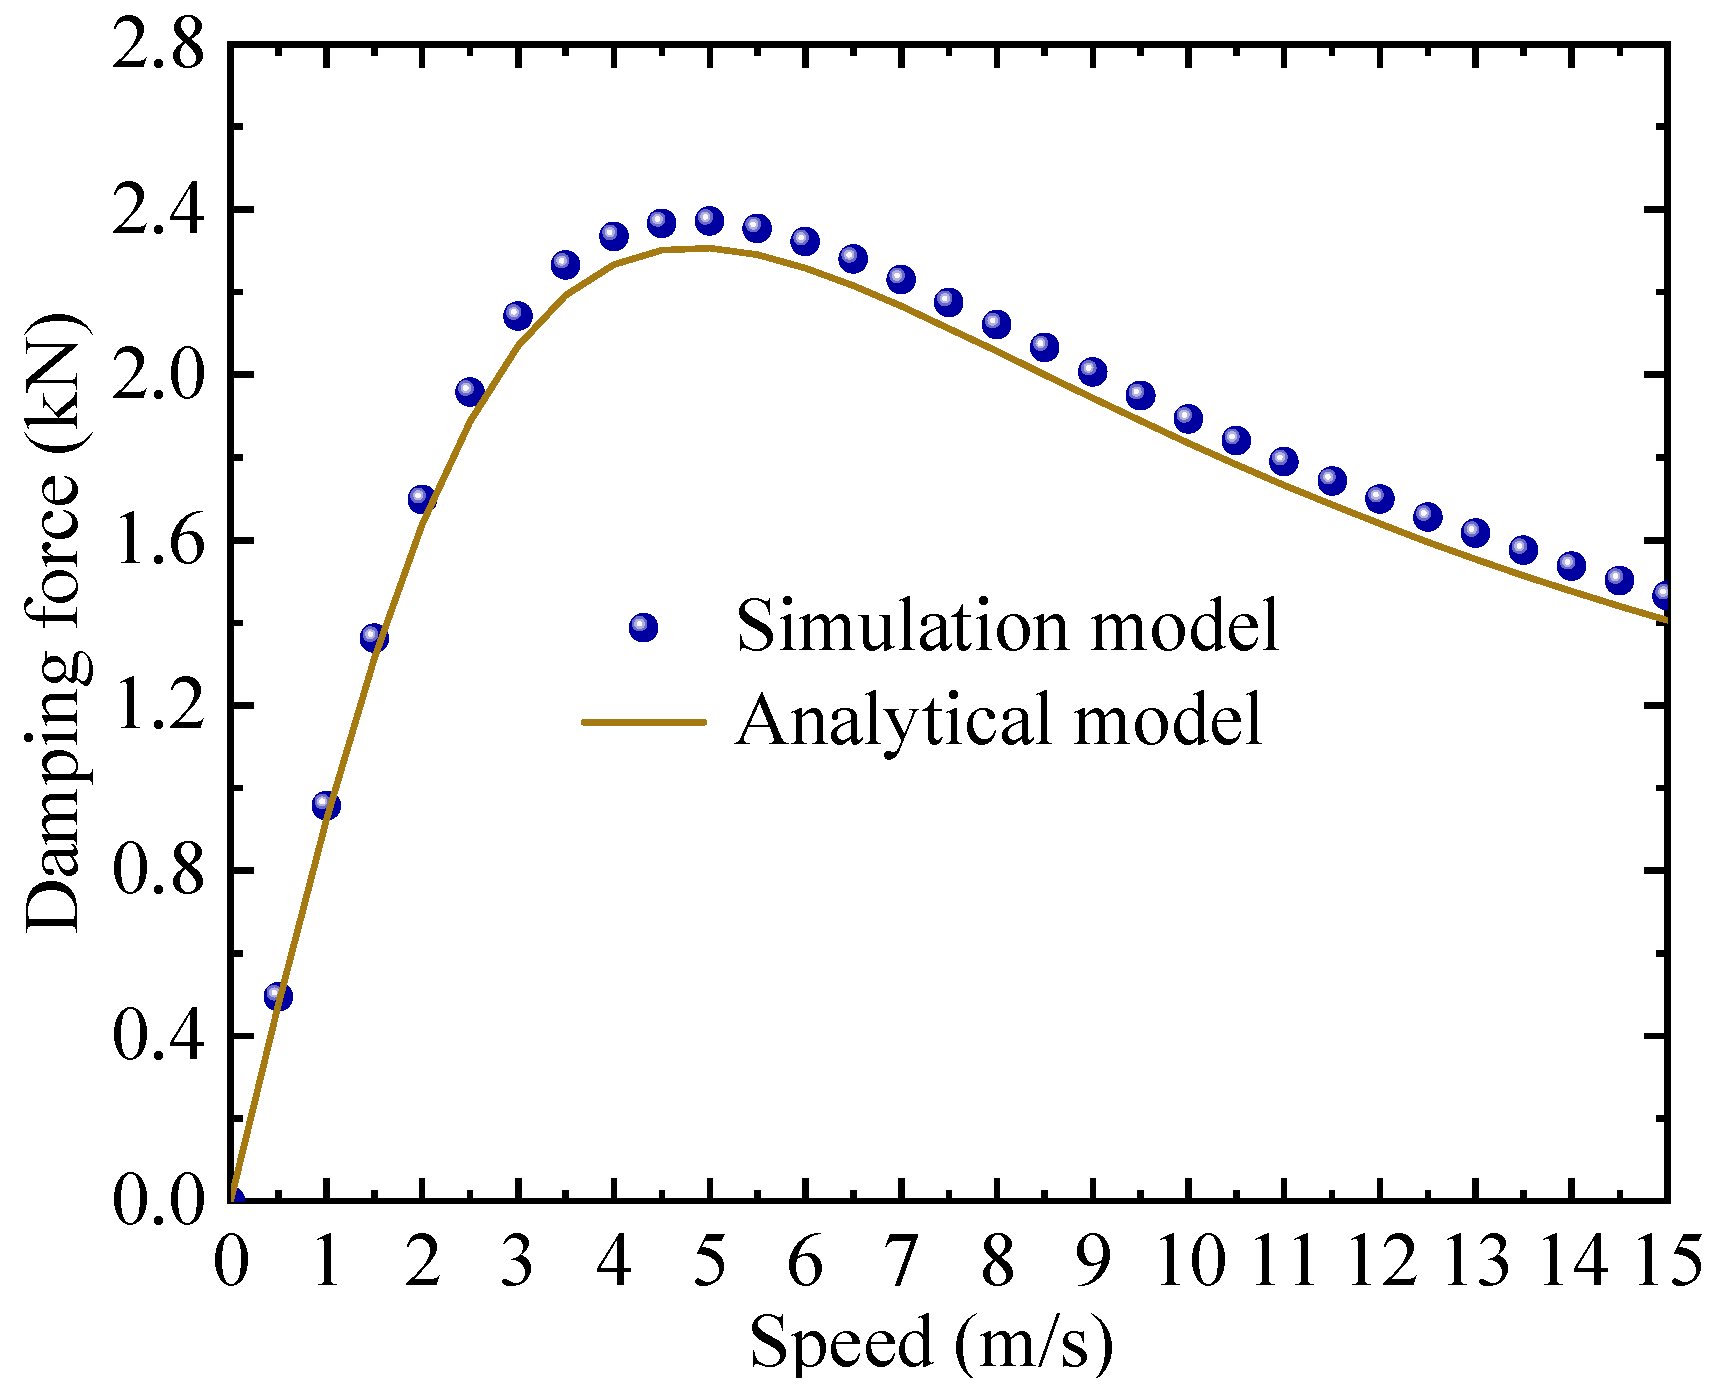
(1) Vertical vibration speed: vertical vibration speed plays a crucial role in damping force generation owing to its speed-dependent constitutive characteristics.
Figure 6 demonstrates that for a damping plate configuration with thickness of 10 mm, conductivity of 3.8 × 10
7 S/m, and air gap of 5 mm, simulation and analytical results consistently show the damping force initially increases then decreases with rising vibration speed. This characteristic evolution resembles the typical drag force–speed relationship.
(2) Damping plate thickness: before discussing the thickness of the damping plate, it is necessary to address the skin effect, a prevalent phenomenon in PMEDS vehicles. The skin effect causes an exponential attenuation of induced eddy current density along the thickness of the conductive plate, with maximum current density occurring at the surface [
19]. This phenomenon stems from the surface-biased distribution characteristics of eddy currents induced by impedance gradients [
20]. The skin depth
δd is expressed by Equation (4), where
μr represents the relative permeability of the conductive plate,
μ0 denotes the vacuum permeability,
τ corresponds to the pole pitch of PMs, and
σ indicates the conductivity of the conductive plate.
Based on the structural parameters in
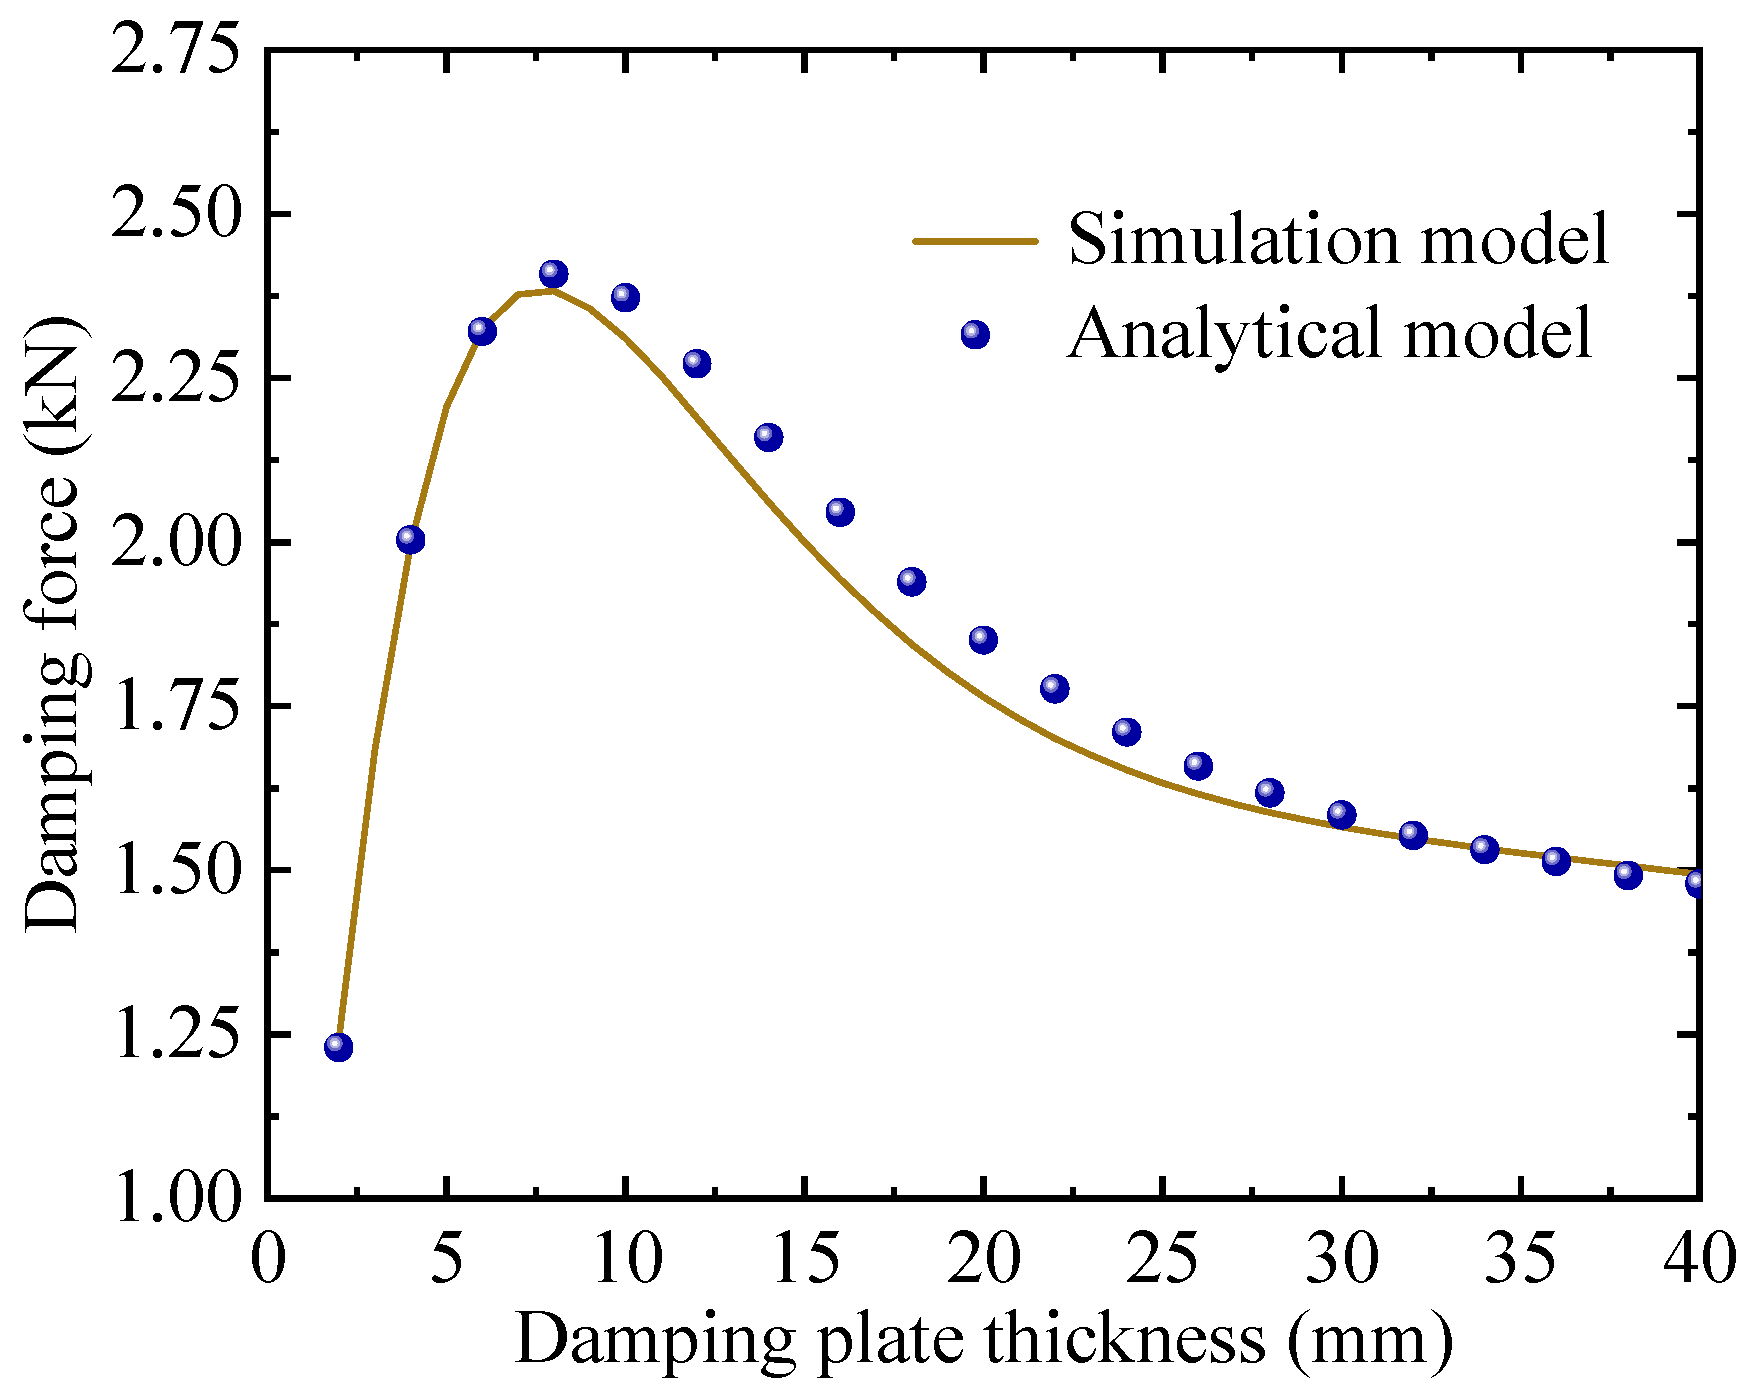
Table 3, a computational model to analyze how damping plate thickness regulates damping force and investigate their relationship.
Numerical and simulation analysis presented in
Figure 7 reveals a non-monotonic relationship between damping force and plate thickness at vertical speed of 5 m/s. Specifically, the damping force demonstrates an initial ascending trend followed by a subsequent decreasing as plate thickness varies, peaking at an optimal thickness of 8 mm before diminishing returns occur.
Furthermore, during vibration, the relative speed between PMs and the damping plate exhibits time-varying characteristics, necessitating comprehensive analysis of thickness effects on damping force across different speed ranges.
To determine the optimal damping force under coupled speed-thickness conditions, the objective function is established as shown in Equation (5). The approach employs a comprehensive two-stage optimization methodology. First, parametric numerical simulations analyze damping forces across the full operation parameter space. This space includes speeds from 0 to 15 m/s with increments of 1 m/s and thicknesses ranging from 2 to 40 mm with increments of 2 mm. Subsequently, a systematic evaluation using the objective function determines the global optimum. This ensures thorough optimization of damping performance throughout the defined design domain.
In Equation (5), denotes speed and dt stands for damping plate thickness.
As illustrated in
Figure 8, the damping force demonstrates strong coupled dependence on both thickness and vibration speed, with distinct thickness-dependent trends emerging at different speed ranges. At lower speed of 1 m/s, the damping force exhibits monotonic growth with increasing thickness, attributable to larger skin depths and relatively weaker induced current densities. However, at greater speed such as above 3 m/s, the optimal thickness decreases due to reduced skin depths and intensified eddy current concentration effects. Considering the dynamic vertical speed variations in practical applications, a thickness of 6 mm is recommended to achieve robust damping performance across operation speed ranges.
(3) Temperature rise: damping plates and PMs undergo prolonged reciprocating vibrations, generating induced eddy currents that lead to power loss. This phenomenon heats the damping plate, subsequently altering the conductivity and damping force. Common non-magnetic conductive materials include copper and aluminum, with conductivities of 5.8 × 10
7 S/m and 3.8 × 10
7 S/m under ambient temperature, respectively. The temperature-dependent conductivity follows Equation (6). Therein,
σ represents material conductivity,
T denotes the time-varying temperature, and
α is the temperature coefficient. The temperature coefficients for copper and aluminum are 0.0039 and 0.0043, respectively.
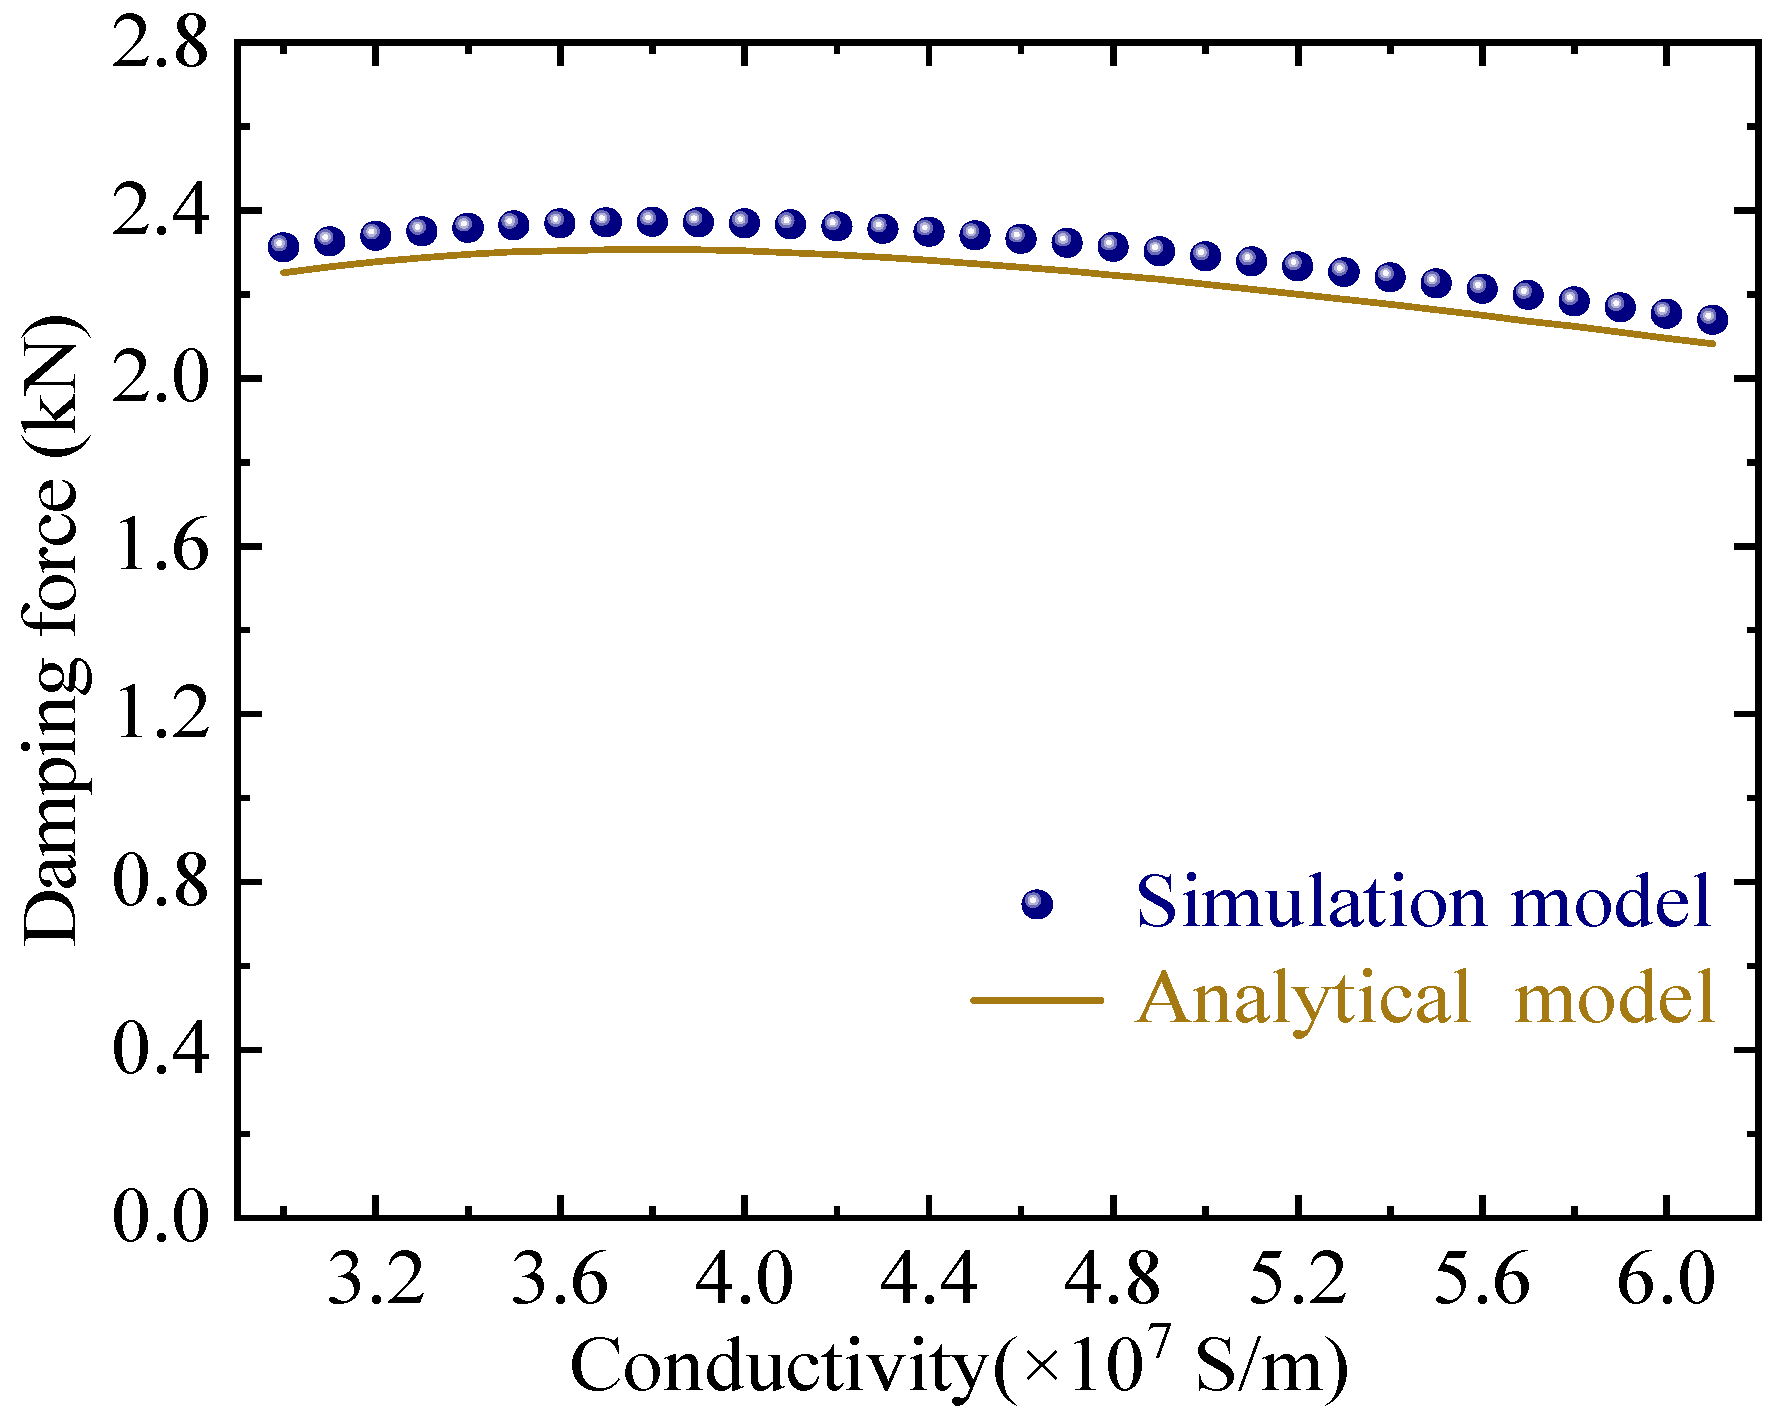
As indicated by Equation (6), the conductivity of the damping plate decreases with increasing temperature.
Figure 9 illustrates the relationship between damping force and conductivity at a constant relative speed of 5 m/s. The damping force initially rises with conductivity before reaching a peak and subsequently declining, with all observed variations remaining below 300 N across the tested conductivity ranges.
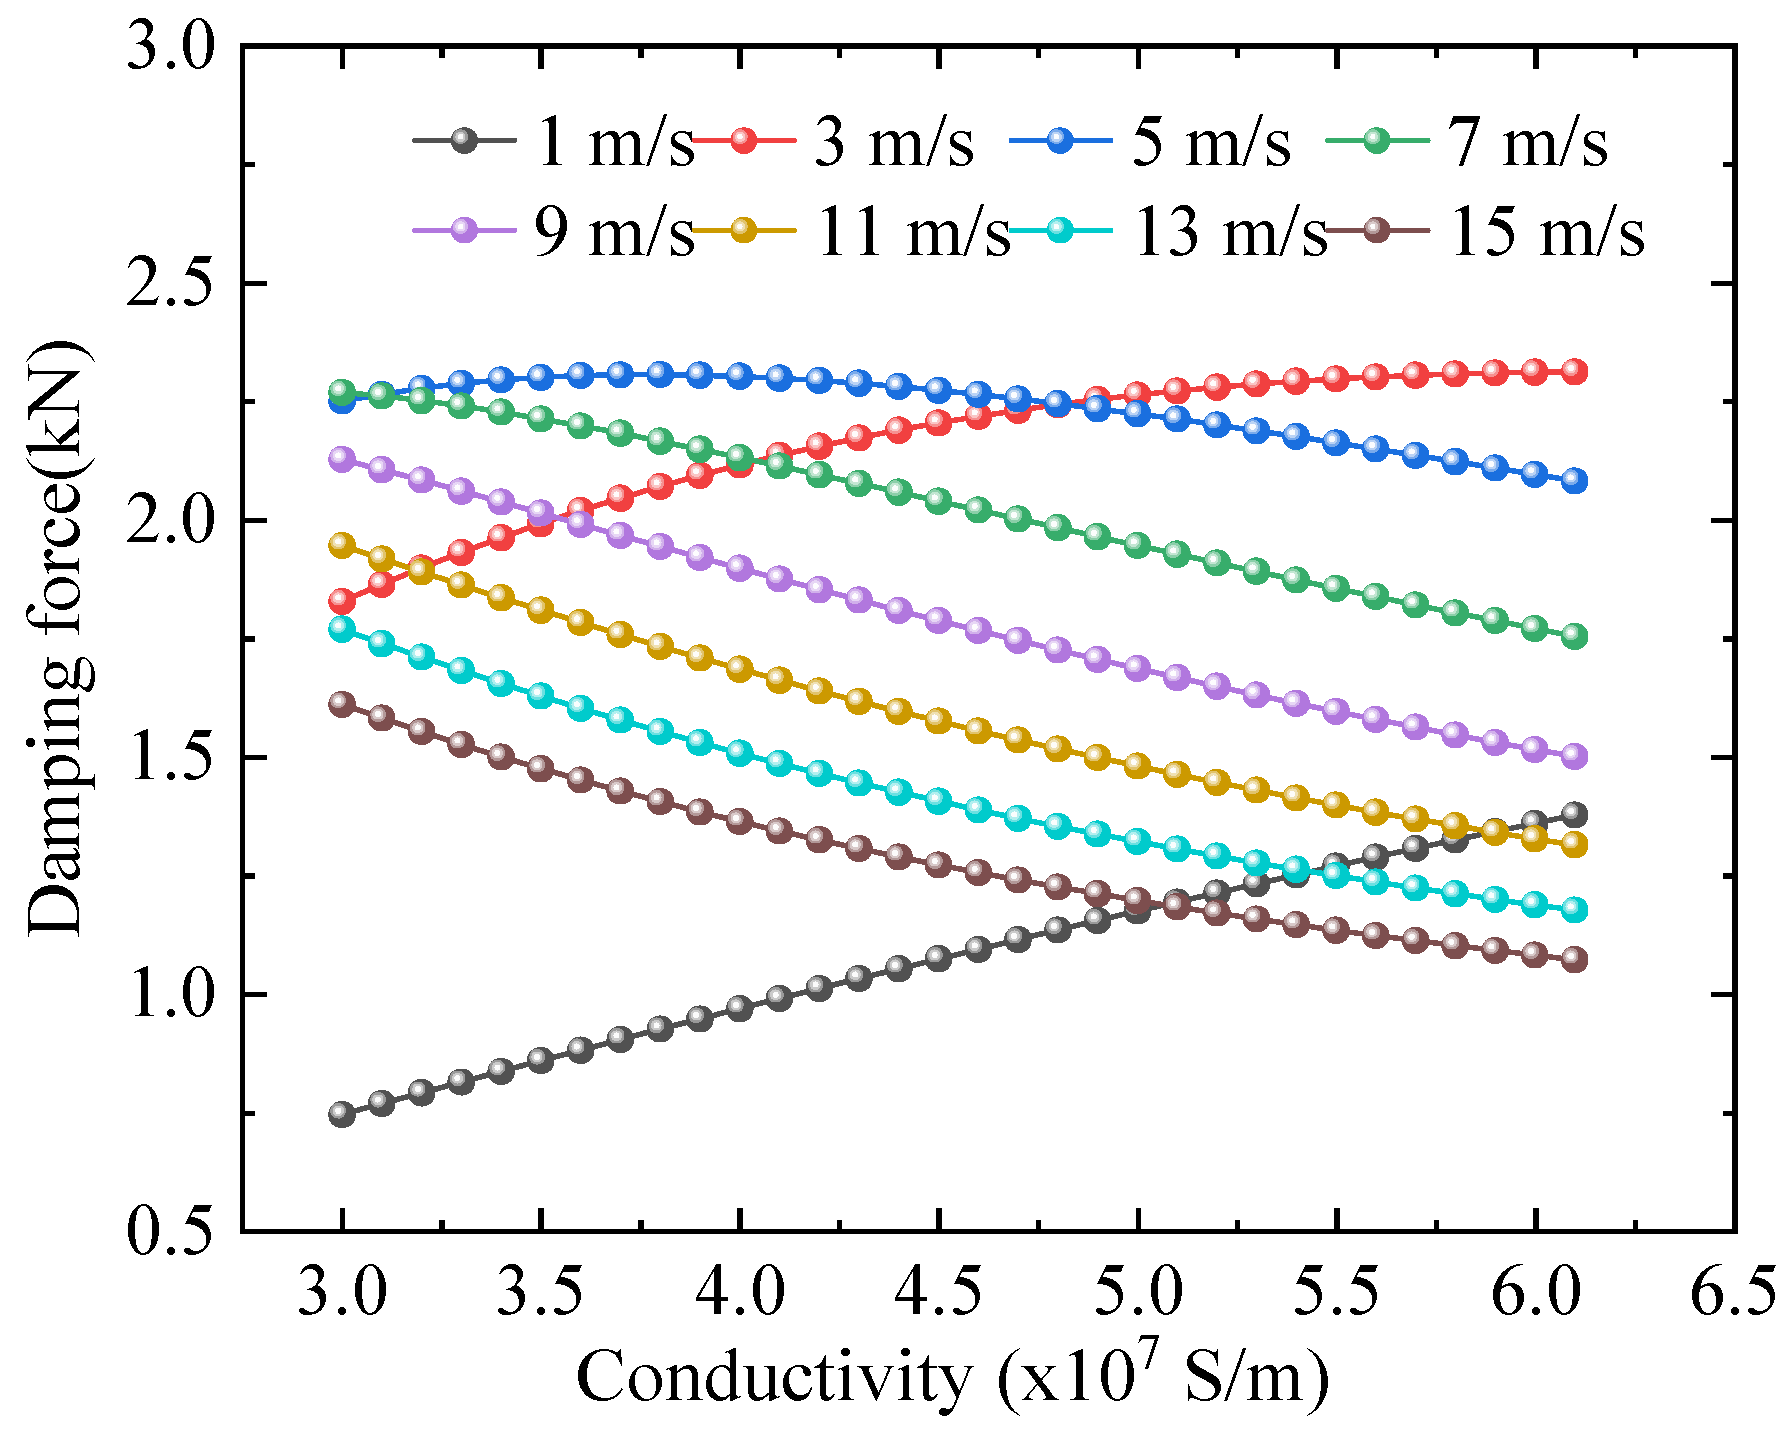
Further analysis is conducted on the damping force under the combined influence of conductivity and speed. The computational results are presented in
Figure 10, which reveals that in the low-conductivity region, the damping force exhibits a gradual decline with increasing speed, showing better damping performance. In the high-conductivity range, the attenuation rate increases significantly due to an enhanced skin effect, leading to a more rapid reduction in damping force.
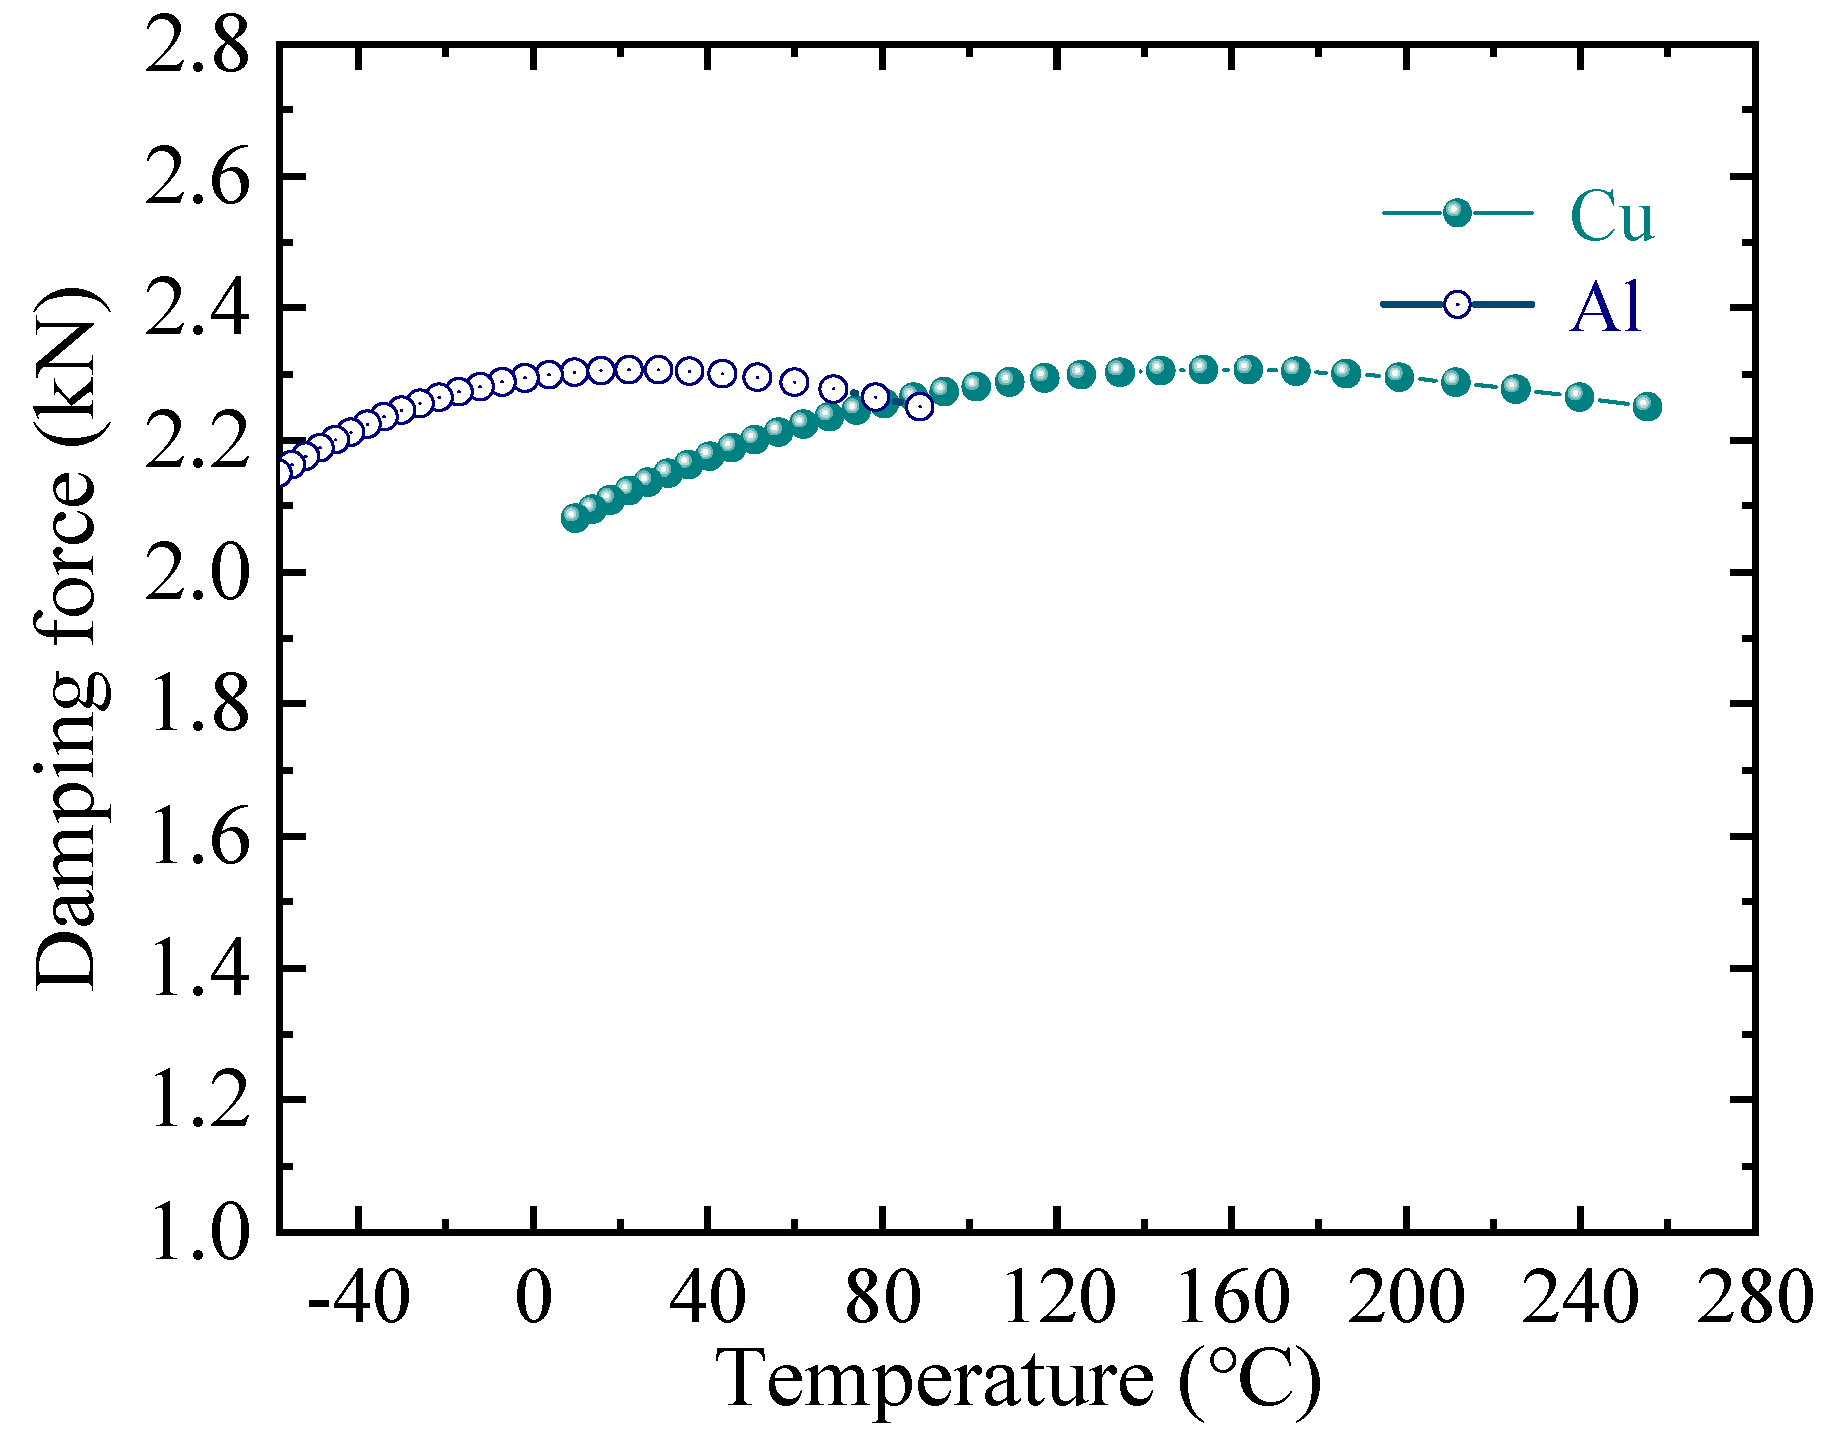
An analysis of the conductivity calculation results in
Figure 11 reveals that the copper damping plate demonstrates comparable damping performance across both ambient temperature and elevated-temperature conditions, while the aluminum plate proves more suitable for low-temperature or room-temperature applications. The variation in damping force with temperature remains relatively small within 250 N, while the damping plate exhibits a limited temperature rise. Thus, aluminum emerges as the preferred material choice when damping performance requirements are moderate owing to lower cost.
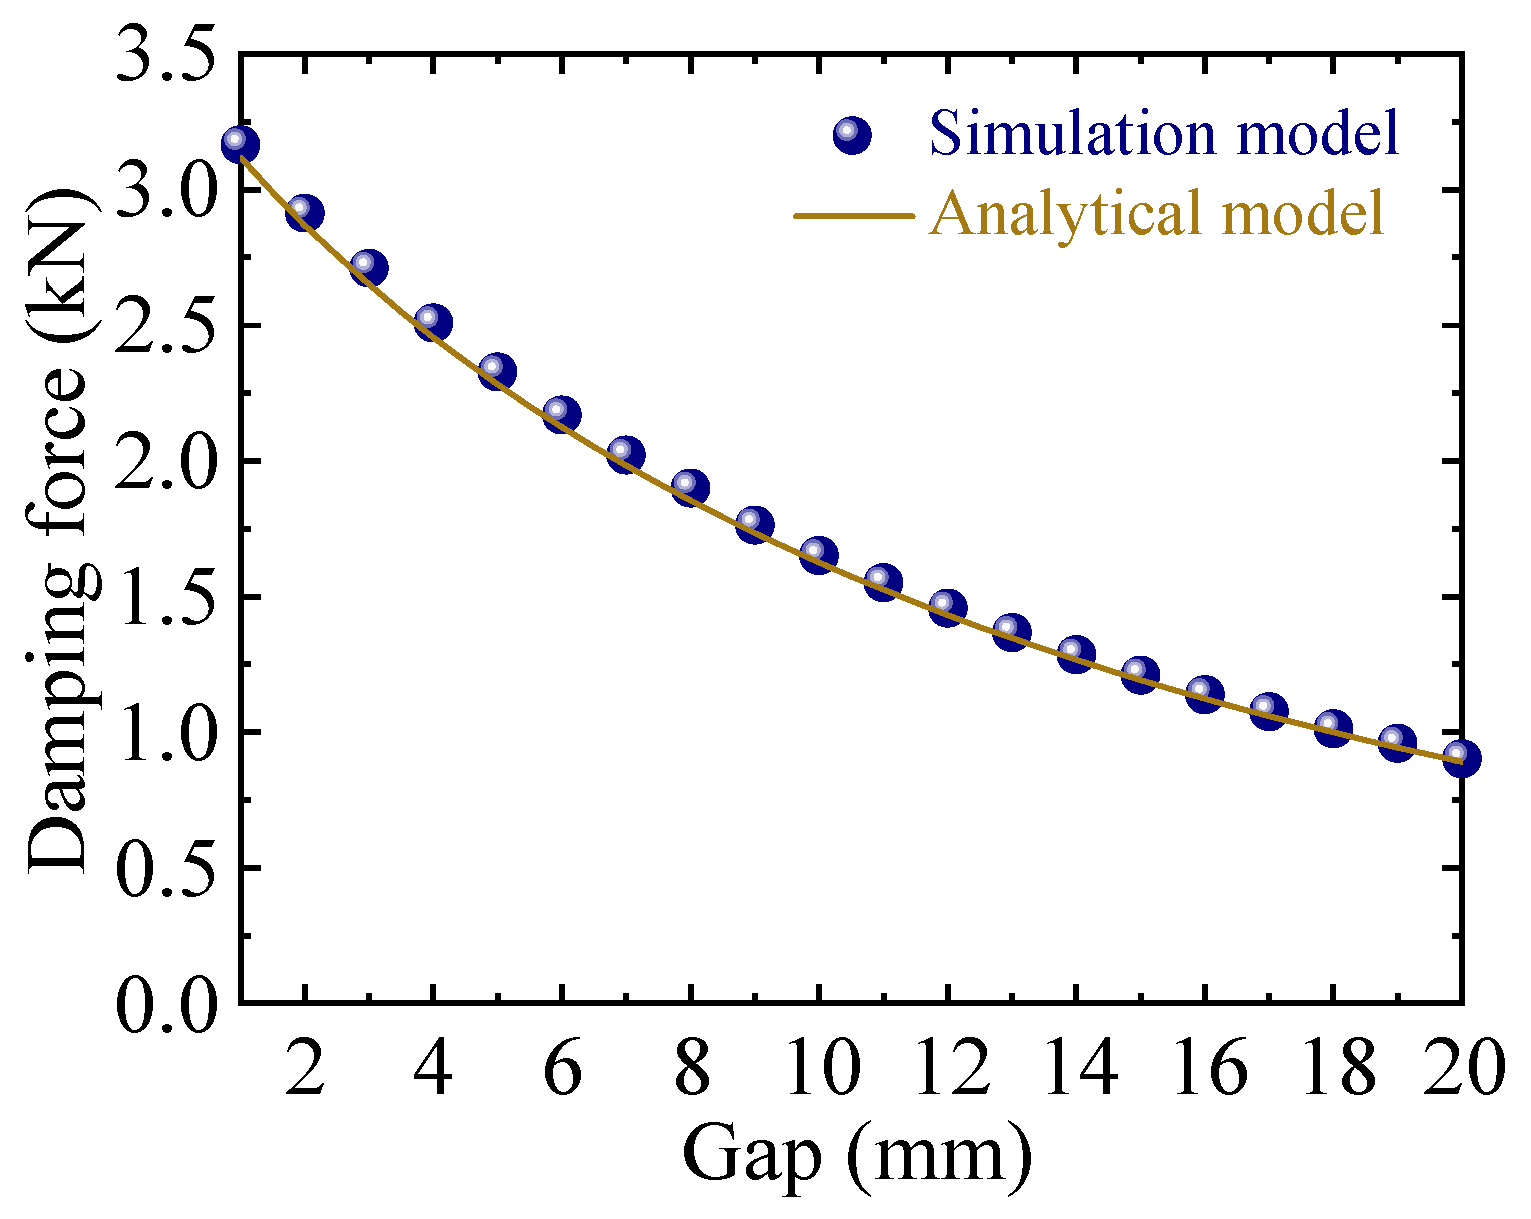
Gap: End field exhibits a gradual decrease with increasing gap, defining the distance of the PMs and damping plate. Consequently, the gap can influence the damping performance. Using the optimized magnet and damping plate,
Figure 12 demonstrates the nonlinear decreasing relationship between damping force and increasing gap at a constant speed of 5 m/s. Notably, the damping force progressively diminishes with larger air gaps. For practical applications in which effective damping force needs to be maintained, the working air gap typically varies within a limited range. Under such constrained conditions, the force variation can be reasonably approximated as a linear process.
To determine the optimal gap, a dual-variable damping force objective function is established considering both speed and gap as expressed in Equation (7). Through parametric simulation analysis, the damping force characteristics under various operating speeds and gaps are evaluated, and the optimal gap that satisfies the damping performance requirements is determined.
In Equation (7), represents the optimization objective function for damping force under coupled speed and gap conditions. and denote speed and gap.
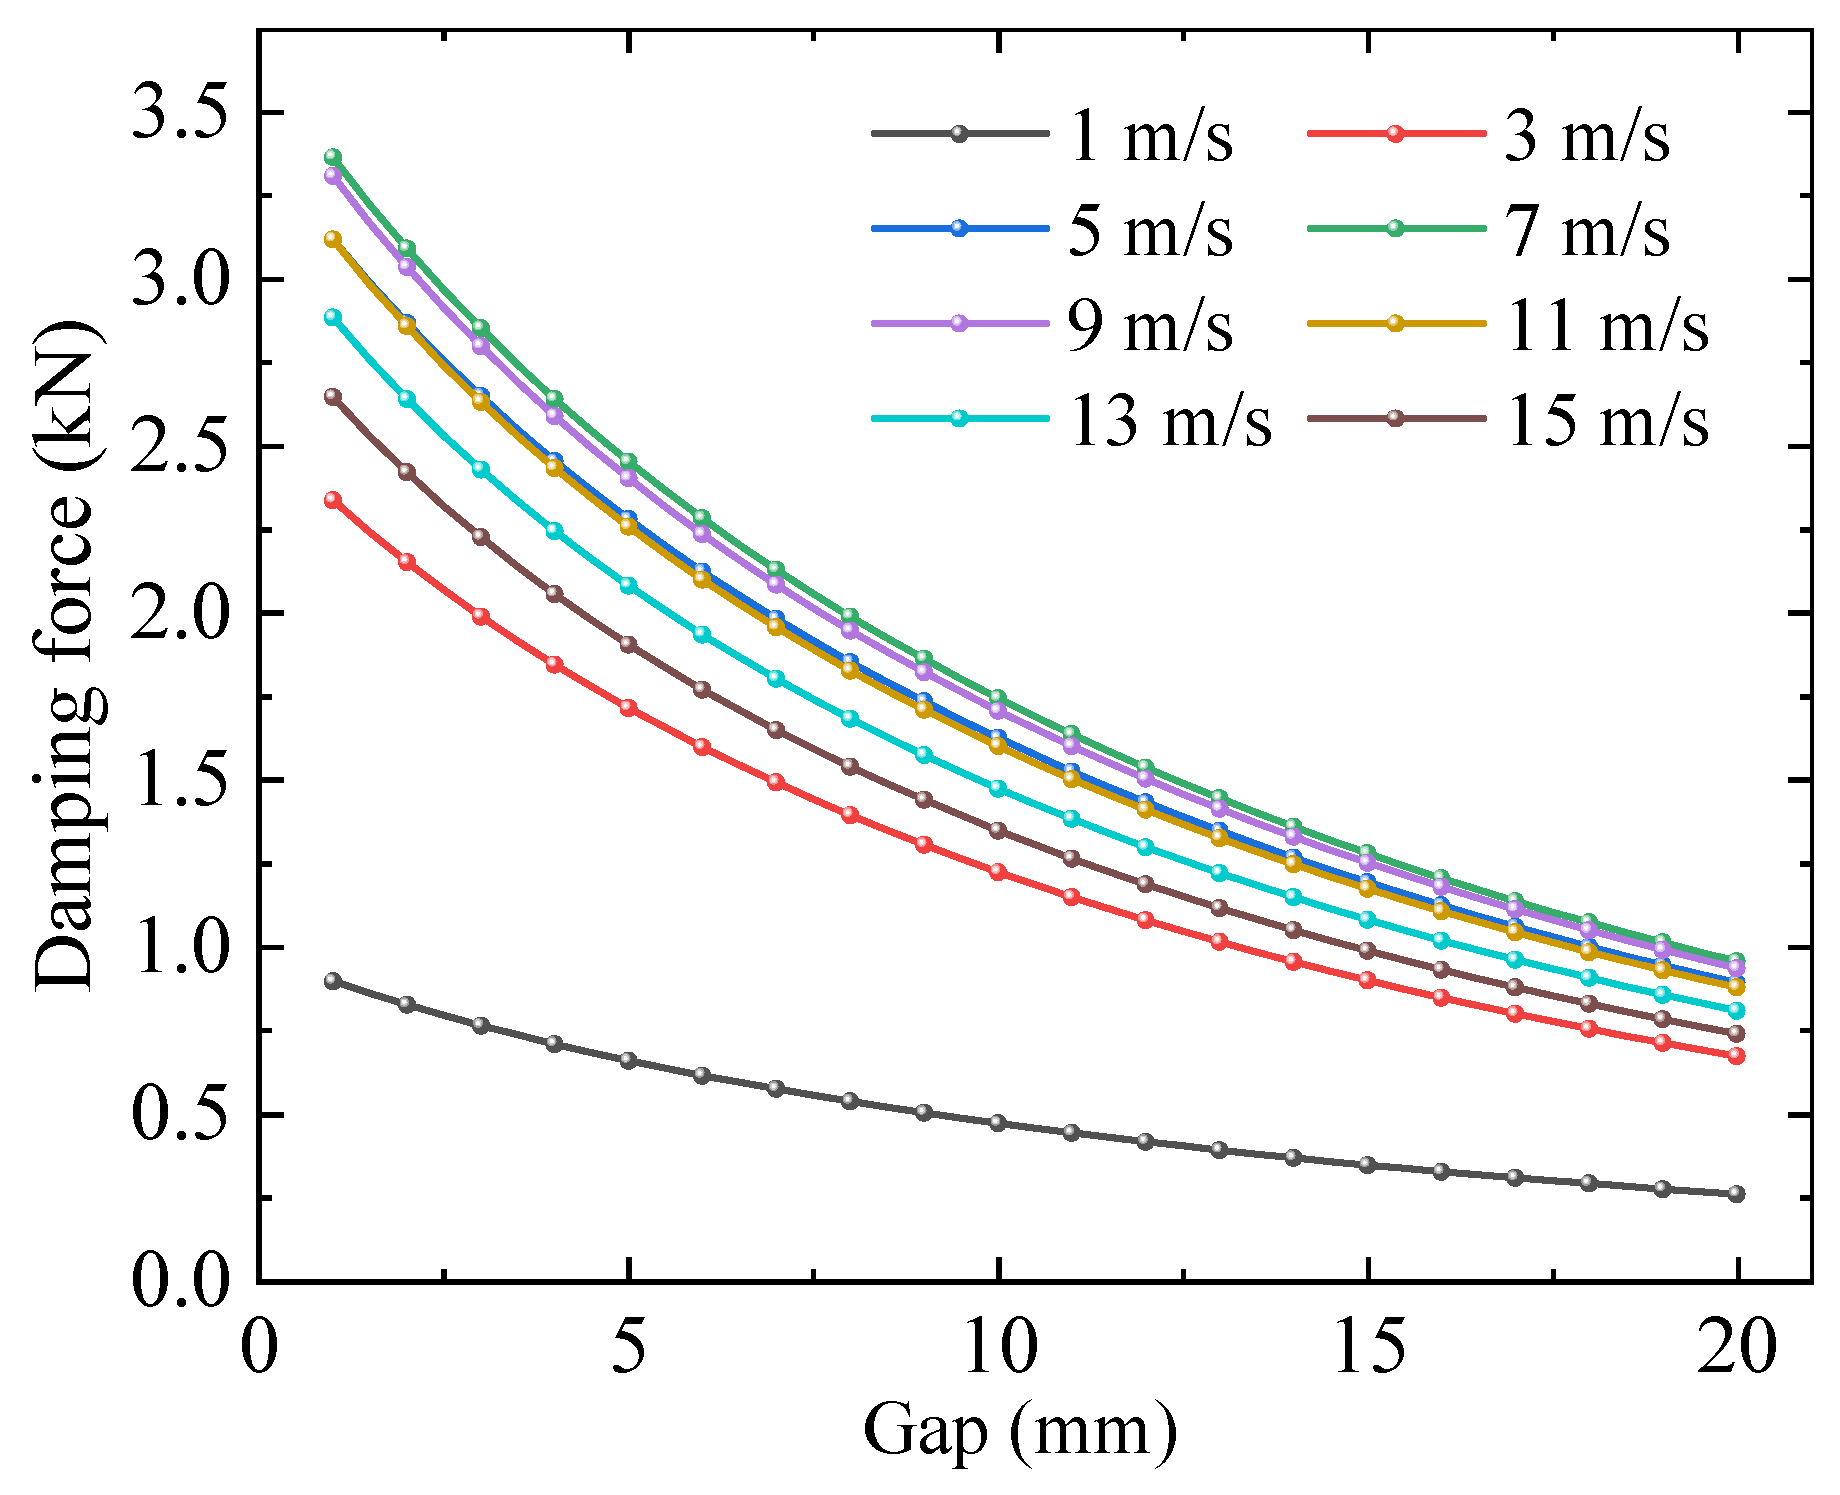
Figure 13 presents the damping force versus working gap relationship across various operating speeds. The results demonstrate that the damping force exhibits a consistent decreasing trend with increasing gap. The attenuation rate of damping force is speed-dependent, showing significant variation across the tested speed range. These findings indicate that reduced working gaps generally yield enhanced damping performance. For practical implementation, the optimal gap should be determined through careful consideration of guideway operation conditions, structural precision constraints, and required damping performance specifications.


 ,
, 


