Article

Mechanism Analysis and Optimal Design of Return Impact of a Certain Aircraft Canopy Actuator

1
School of Mechanical Engineering, Yanshan University, Qinhuangdao 066004, China
2
Hebei Provincial Key Laboratory of Heavy Machinery Fluid Power Transmission and Control, Yanshan University, Qinhuangdao 066004, China
*
Author to whom correspondence should be addressed.
Actuators 2025, 14(7), 306; https://doi.org/10.3390/act14070306
Submission received: 12 May 2025 / Revised: 14 June 2025 / Accepted: 20 June 2025 / Published: 22 June 2025
(This article belongs to the Special Issue Aerospace Mechanisms and Actuation—Second Edition)

Abstract

:
During the closure of a specific aircraft canopy, oil leakage occurs from the pressure tank’s overflow port in the gas–liquid control system. This issue often occurs during closure, potentially leading to reduced system oil and impacting the normal operation of the canopy. Firstly, we analyzed canopy actuation principles to identify the return stroke pressure impact transmission path and derive its mathematical model. Secondly, the gas–liquid control system simulation model was constructed to replicate the oil overflow fault in the pressure tank digitally. Finally, specific improvement measures were developed based on fault mechanism analysis and simulation results to optimize the system’s design. After optimization, the peak pressure in the pressure tank’s oil chamber was reduced by 91.58%, eliminating overflow. This solution was validated by the manufacturer and implemented in production.

1. Introduction

The canopy is a transparent shell commonly used in military, training, and leisure aircraft cockpits and is one of the key components of the aircraft [1,2]. The control system controls the canopy, and the actuator is a key functional component used for emergency deployment of the canopy [3,4]. However, pressure transients during actuator retraction can damage system components (e.g., seals, pipelines), undermining control system stability and reliability [5]. Therefore, this paper analyzes the failure of an aircraft canopy actuator to minimize the risk and support maintenance and optimization effectively.
Hydraulic impact essentially involves the instantaneous transformation of kinetic energy into pressure energy due to the sudden cessation of flow in the pipelines [6,7,8]. Current research on pressure impact mechanisms in hydraulic systems primarily relies on mathematical modeling at the system level for theoretical analysis and dynamic simulations using tools, such as AMESim [9,10,11,12]. For instance, Li et al. [13] introduced a one-dimensional water hammer model for pump–pipeline systems, identifying rotational inertia, flow velocity, and valve closure time as dominant parameters affecting transient pressures. Hjelmervik [6,14] considered the impact of fluid bodies with different sections and derived analytical solutions for the Fourier series or Fourier–Bessel series. Yang [15] established a simulation model of the hydraulic impact system based on the simulation platform AMESim and determined the key features of the impact system. Ren et al. [16] established a system model that considered the pipeline effect for the hydraulic shock phenomenon and verified its effectiveness experimentally. Abebe et al. [17] proposed adding thermal energy to the flow to assist water hammer pressure. Incorporate insights from progress in water hammer analytical modeling [18] and Navier–Stokes solutions for accelerating pipe flows [19], which underpin the fundamental mechanisms of pressure transients in our system.
Pressure impact greatly endangers the system, seriously affecting work efficiency and safety, and its protection mechanism has been a hotspot for research. Reliable pressure shock suppression methods need to be based on an analytical model of the water hammer phenomenon [20,21,22,23]. Based on the analysis of the transient in long-distance pipelines, Miao et al. [24] proposed combining air vessels with downstream valves to keep the system pressure within the limit. In a nuclear power plant experimental circuit, Yang et al. [25] optimized contra-motion check valves to leverage inherent damping principles, reducing transient pressures by 30–40%. Lee et al. [26] proposed that damping holes can reduce the impact, and their effect depends on the type, size, opening pressure, and flow rate. Han et al. [27] studied the change in impact pressure caused by the ball valve and found that extending the valve closing time can effectively reduce the maximum pressure. Wang [28] developed an active adjustment of variable damping to suppress hydraulic impact, achieving 82% pressure fluctuation reduction with minimal energy loss. The results show that the method has the advantages of fast response speed, effective suppression of hydraulic impact and low energy consumption. For aerospace applications, Zhang et al. [29] optimized L-shaped pipeline hoop layouts via genetic algorithms, reducing resonance amplitudes by 30%.
This paper focuses on the gas–liquid control system of a specific type of aircraft canopy actuator, establishes a mathematical model of its return pressure impact transmission path, and analyzes its impact generation mechanism. A digital reproduction model of the gas–liquid control system is developed, and optimization schemes for pressure impact are proposed based on the study of the return pressure impact mechanism and simulation analysis results from the AMESim system.

2. Analysis of the Failure Mechanism

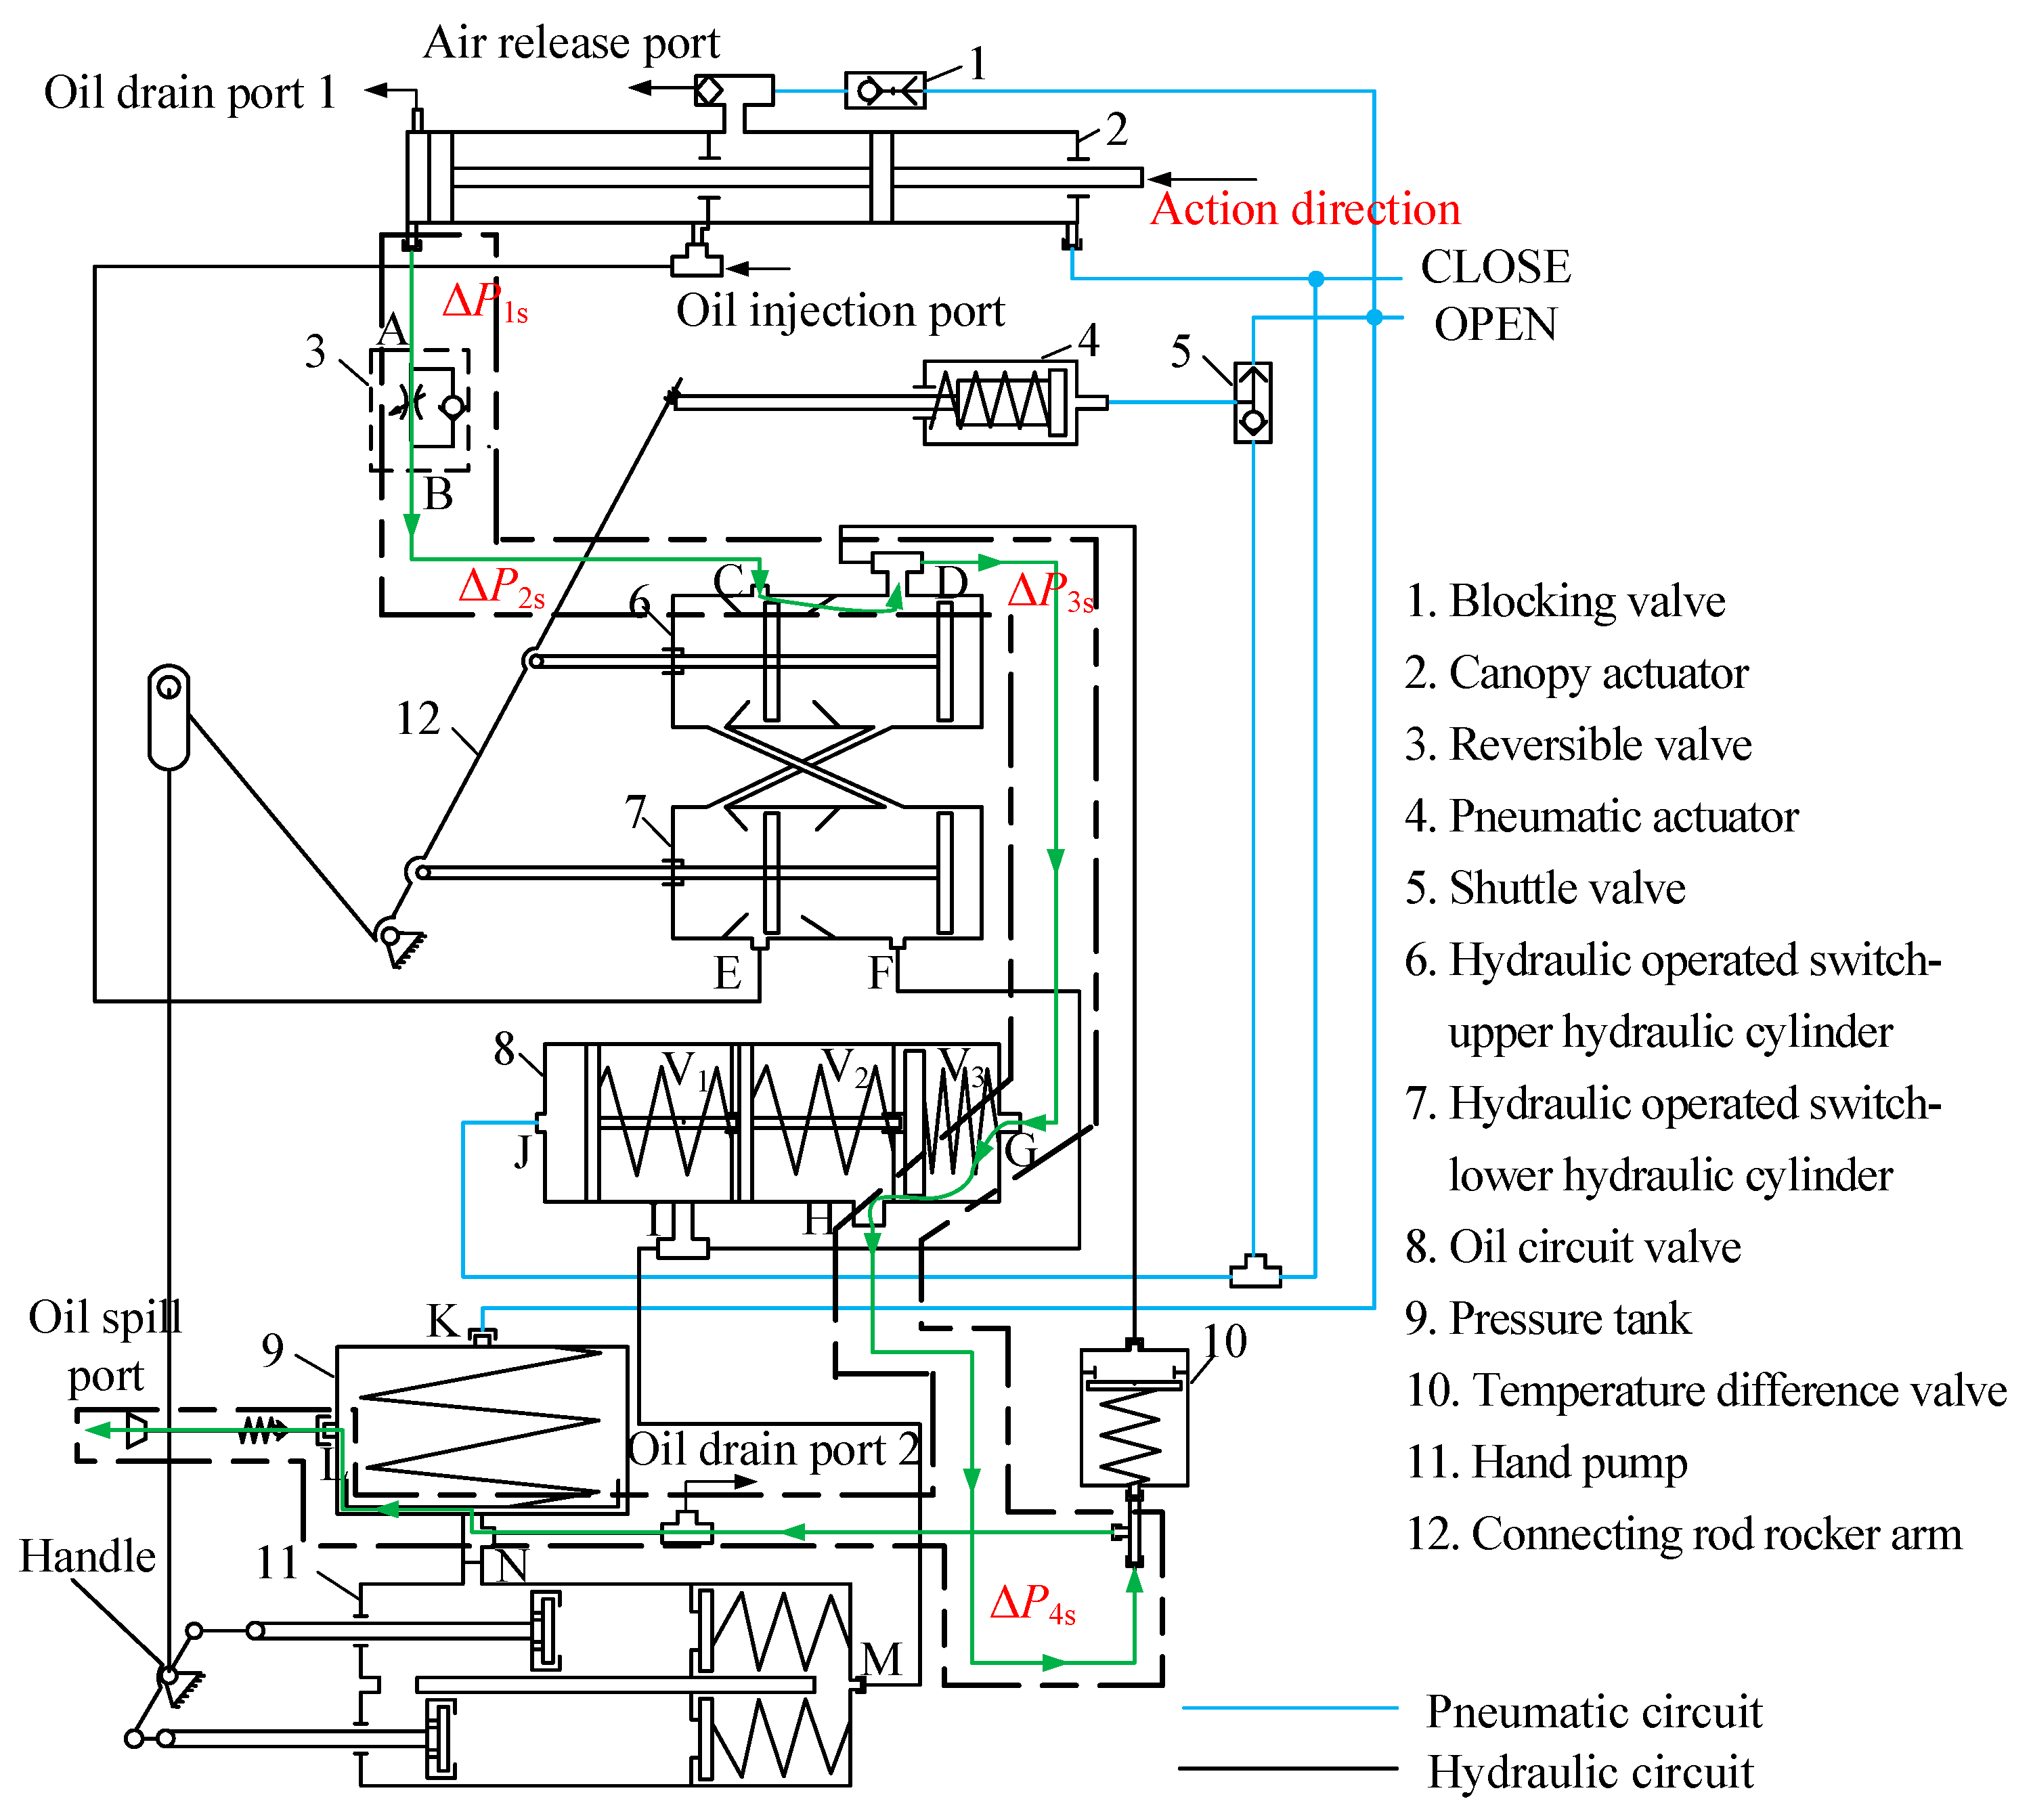
2.1. Working Principle of the Gas–Liquid Control System of the Canopy Cover Actuator

The canopy control system of a certain aircraft has two sets of power systems: pneumatic and hydraulic. It consists of an oil–gas transmission system, an actuating cylinder actuator, and the oil and gas pipelines. Figure 1 shows the schematic diagram of the canopy control system. During normal operation, the pneumatic and hydraulic systems simultaneously complete the three actions: opening the pneumatic valve to release pressure on the sealing strip, sliding the canopy backward, and flipping the canopy. When the pneumatic system malfunctions, the hydraulic system completes three actions independently, and the hydraulic hand pump provides the power.

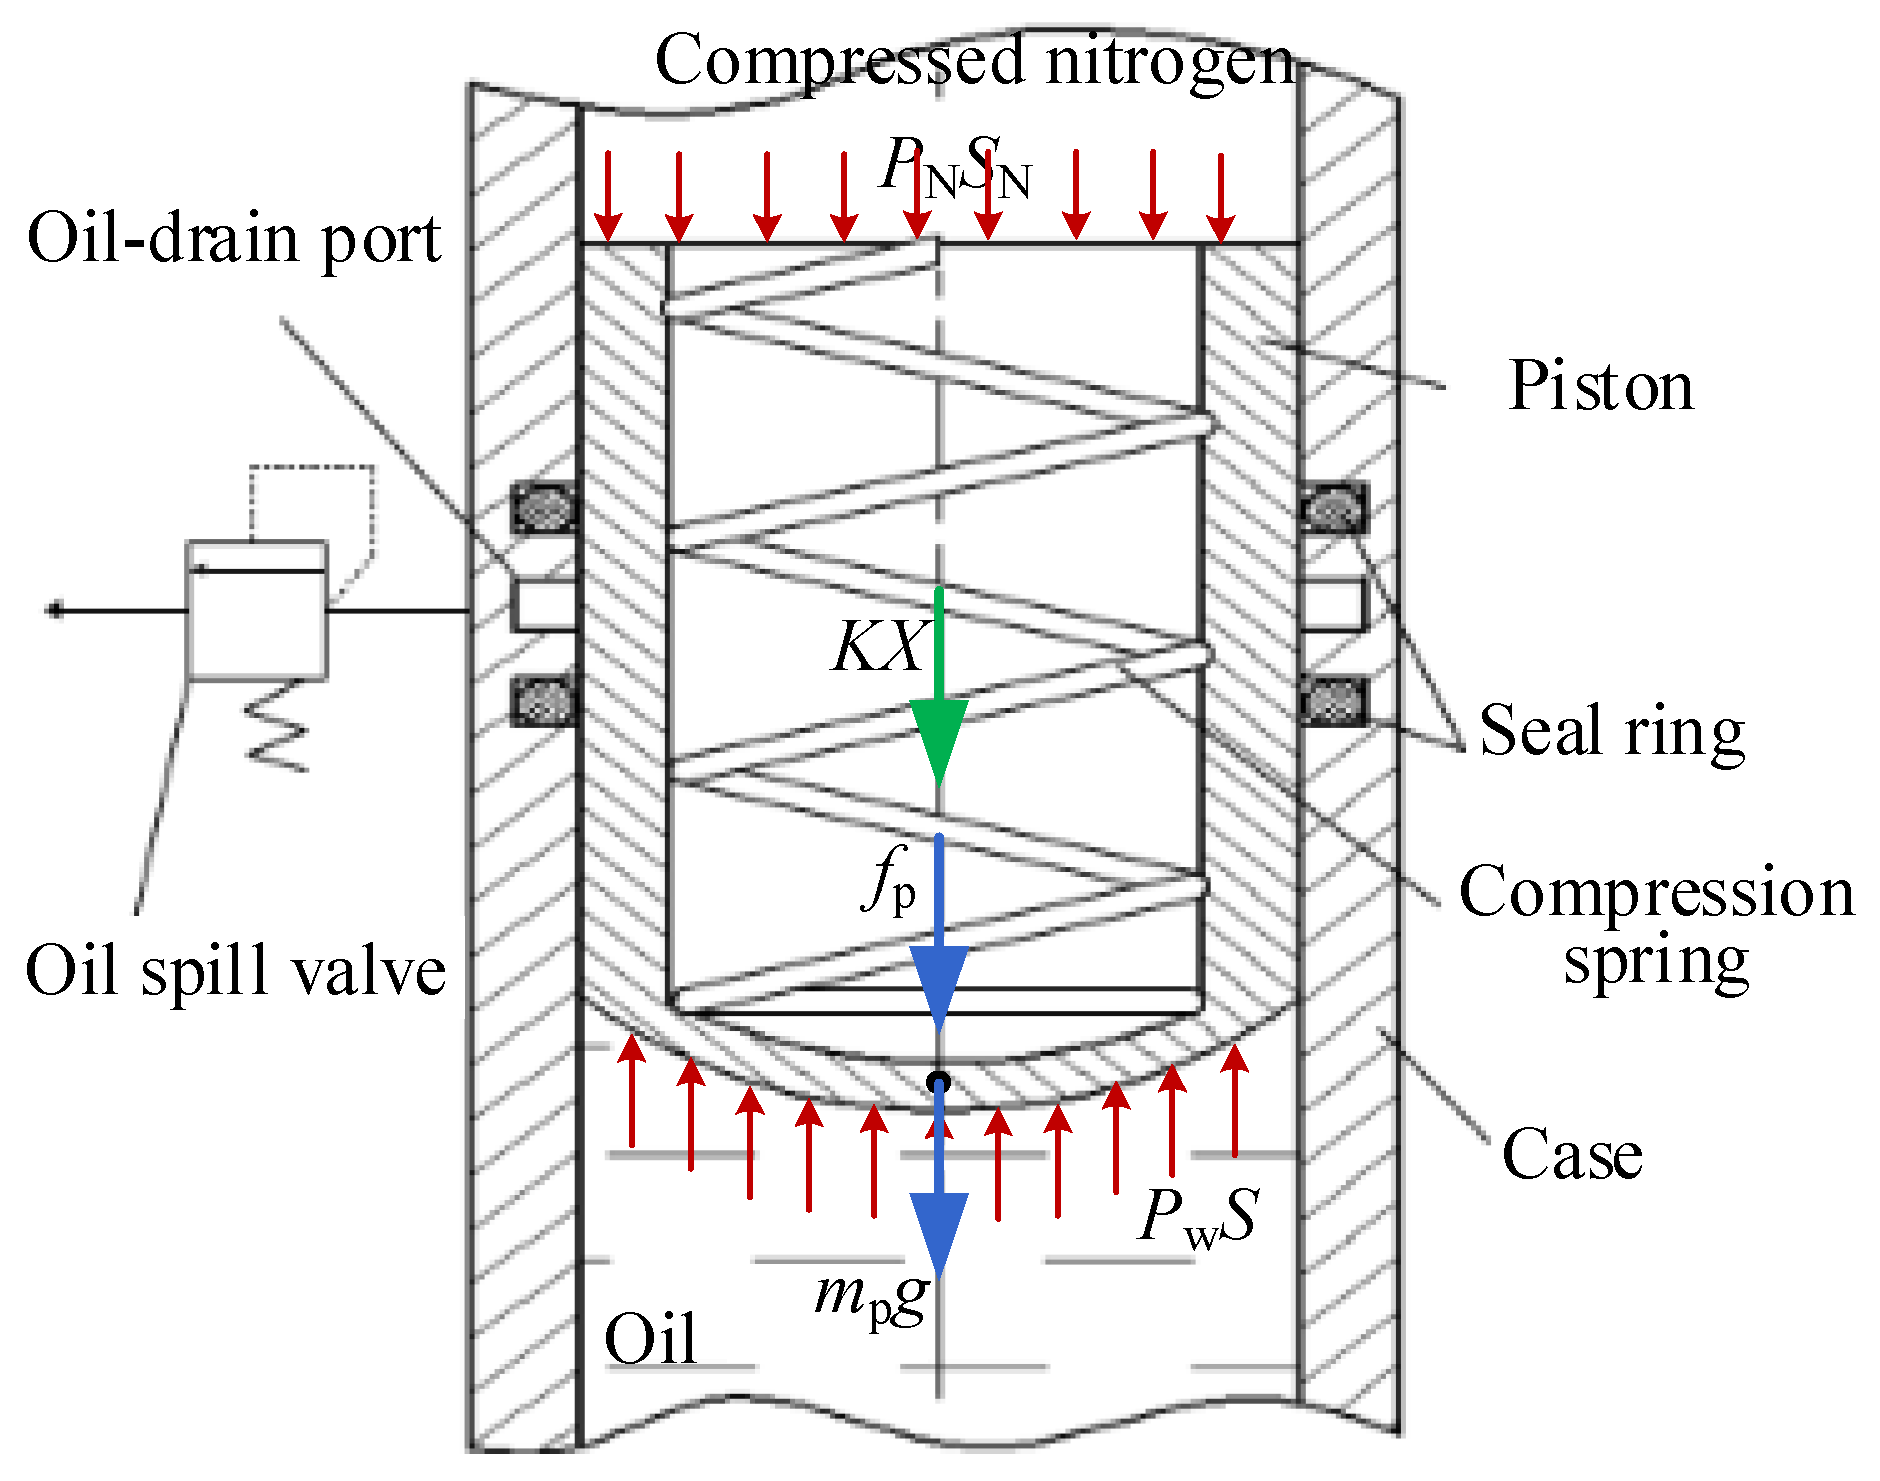
2.2. The Transmission Path and Mathematical Model Construction of the Return Pressure Impact of the Canopy Actuator

The transmission path of the return stroke pressure impact, indicated by the green arrow in Figure 1, is transmitted from the actuator’s lower hydraulic chamber, through a reversible valve and port D, then through an oil circuit valve, and finally into the pressure tank. The return stroke impact involves the piston dynamics and the flow and pressure characteristics of the hydraulic components.
Figure 2 shows that the forces on the actuator’s piston rod include external loads, pressures from pneumatic and hydraulic chambers, the gravity of the piston, and friction. Its dynamic behavior is described by a dynamic equation.
m a d 2 x d t 2 = P u A u + P s A s f a + m a g cos α + F a P x A x P d A d B a d x d t
where ma is the mass of the piston; Ba is the damping coefficient; Ps and Px are the pressures of the upper and lower hydraulic chambers, respectively; As and Ax are the action areas of the upper and lower hydraulic chambers, respectively; Pu and Pd are the working pressures of the upper and lower pneumatic chambers, respectively; Au and Ad are the action areas of the upper and lower pneumatic chambers, respectively; fa is the friction force; Fa is the external load force; α is the angle between the piston rod and the vertical direction; x is the axial displacement of the piston during its return motion; t is the time variable describing the motion’s temporal evolution; and g is the acceleration of gravity.
The pressure of the lower hydraulic chamber of the canopy actuator is
P x = 1 A x ( P u A u + P s A s + m a g cos α + F a ) 1 A x ( m a d 2 x d t 2 + B a d x d t + f a + P d A d )
Similar to an air bleed booster oil tank, its internal structure is shown in Figure 3. The internal piston divides the tank into two chambers. One chamber is filled with oil, the other chamber is filled with compressed nitrogen, and the air chamber is equipped with compression springs. The oil pressure in the pressure tank is affected by piston friction, spring force, and air chamber pressure. The pressure of the oil chamber is
P w = P N S N + K X + f p + m p g S
where Pw is the pressure of the oil chamber; S is cross-sectional area of the piston (i.e., the area over which the oil pressure is exerted); PN is the pressure of the gas chamber; SN is the area over which the gas pressure is distributed; K is the spring stiffness; X is the compression amount of the spring; fp is the friction force; and mp is the mass of the piston.
The reversible valve is a one-way throttle valve. The length–diameter ratio of its internal throttle is 2.67, which can be regarded as a short hole. The flow pressure characteristic equation is [30,31]
q r = π d r 4 Δ P r 128 μ l r
where qr is the flow rate; dr is the diameter of the orifice; ΔPr is the pressure drop; μ is the dynamic viscosity of the oil; and lr is the length of the orifice.
The pressure loss of pipeline systems includes pressure loss along the pipeline, local pressure loss, and inertial pressure drop caused by fluid acceleration. The pressure loss equation of the pipeline is
Δ P i s = λ i L i ρ u i m 2 2 D i + ξ j ρ u j m 2 2 + ρ L i d u i m d t
where i is (1, 2, 3, 4), λi is the friction factor of the corresponding pipeline; ξ is the local resistance coefficient, and its magnitude is related to the structural form of the local obstacle; Di is the diameter; Li is the length; ρ is the oil density; uim is the average velocity in the i-th pipe segment; and ujm is the velocity at the j-th local loss element (e.g., valve, bend).
In conclusion, the pressure in the oil chamber of the pressure tank is derived from the lower hydraulic chamber of the canopy actuator. Simultaneously, as the oil tank continues to fill, the piston ascends and gradually increases the spring force, resulting in elevated oil pressure. The lower hydraulic chamber of the canopy actuator is the source of the pressure impact. Piston speed, the chamber’s pressurized area, and initial oil pressure of the lower hydraulic chamber all directly affect the peak value of the pressure impact. The reversible valve, hydraulic control switch, and oil circuit valve affect the return oil resistance through the throttle hole. The pressure tank is the end of the pressure impact, and the pressure in the oil chamber is affected by the combined action of piston friction, spring stiffness, and the pressure in the air chamber. Over time, prolonged use can damage hydraulic components, like worn/aged seals, eroded orifices, and weakened springs [32].

3. Simulation Analysis of Return Pressure Impact of Canopy Actuator

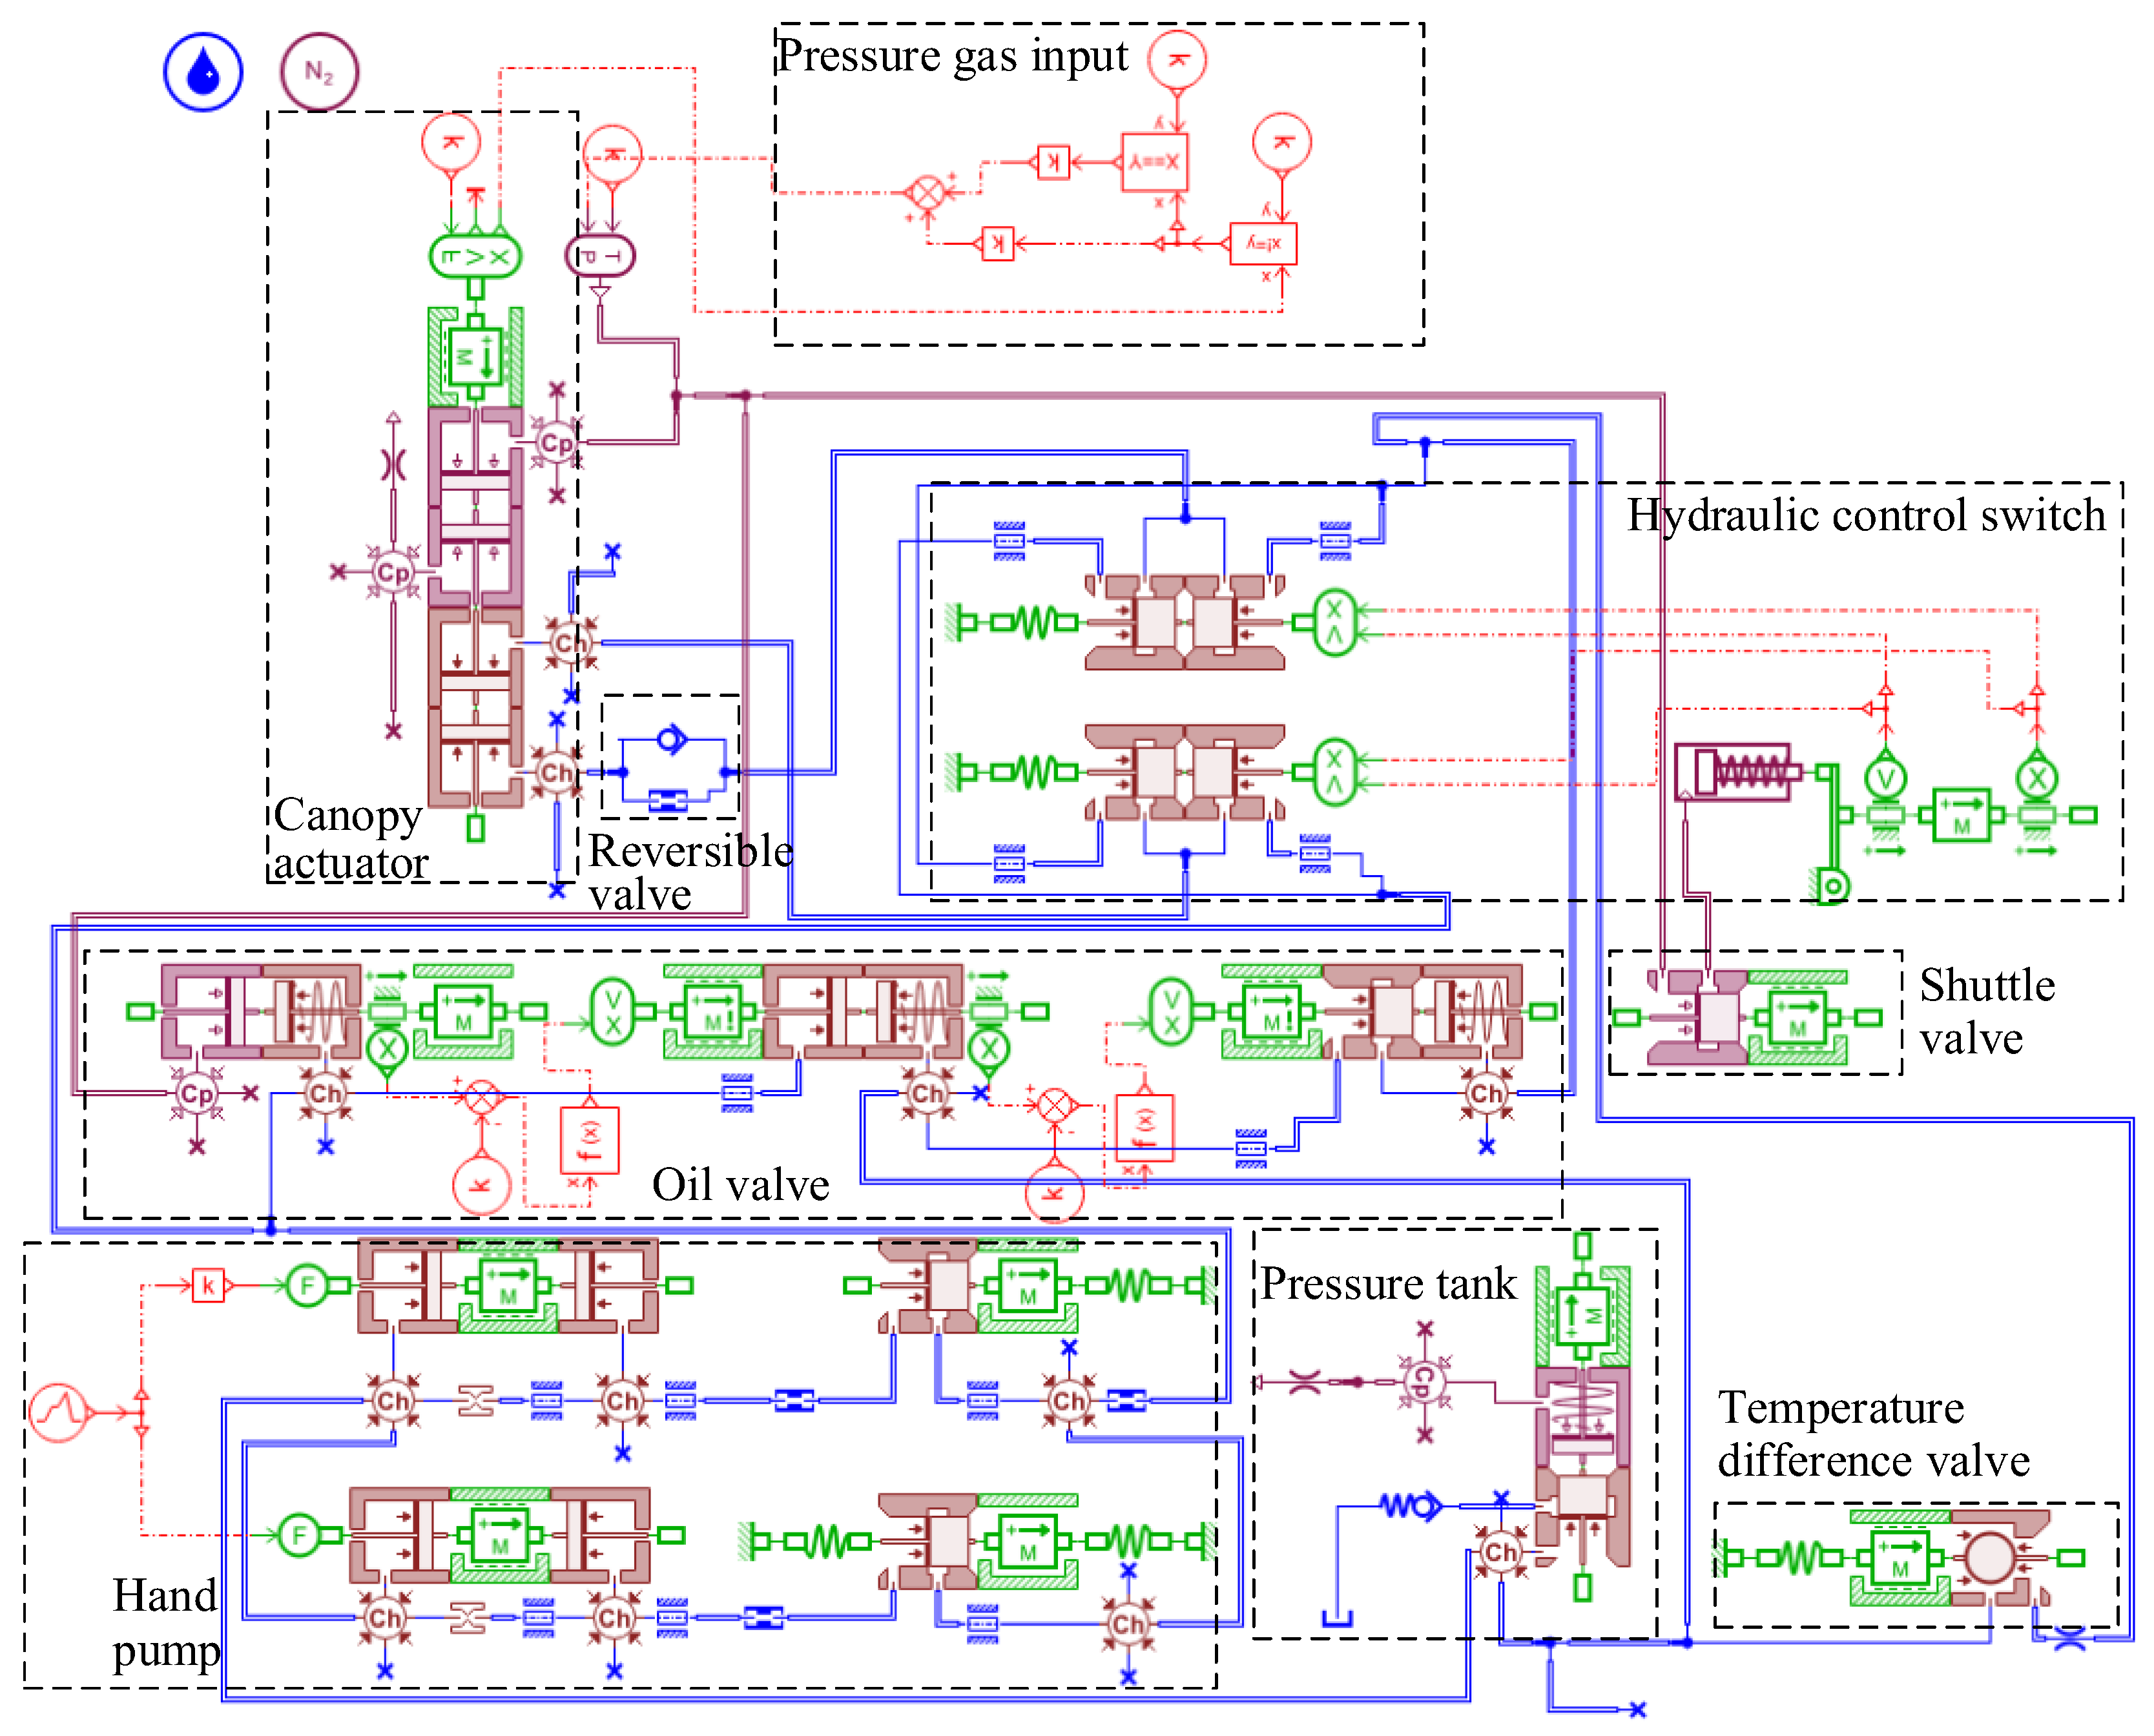
3.1. Construction of Simulation Model of Gas–Liquid Control System

The canopy actuator is a cylinder with a gas–liquid two-phase medium operating simultaneously; its structural form and parameter variables are quite diverse. The model of the gas–liquid control system built on the AMESim platform is shown in Figure 4.
In the sketch, the blue solid lines represent the hydraulic pipelines, and the red solid lines represent the pneumatic pipelines. The thick solid lines represent the consideration of the length, diameter, and complex flow characteristics of hydraulic and pneumatic pipelines, while the red dotted lines represent the connection relationship between signals.

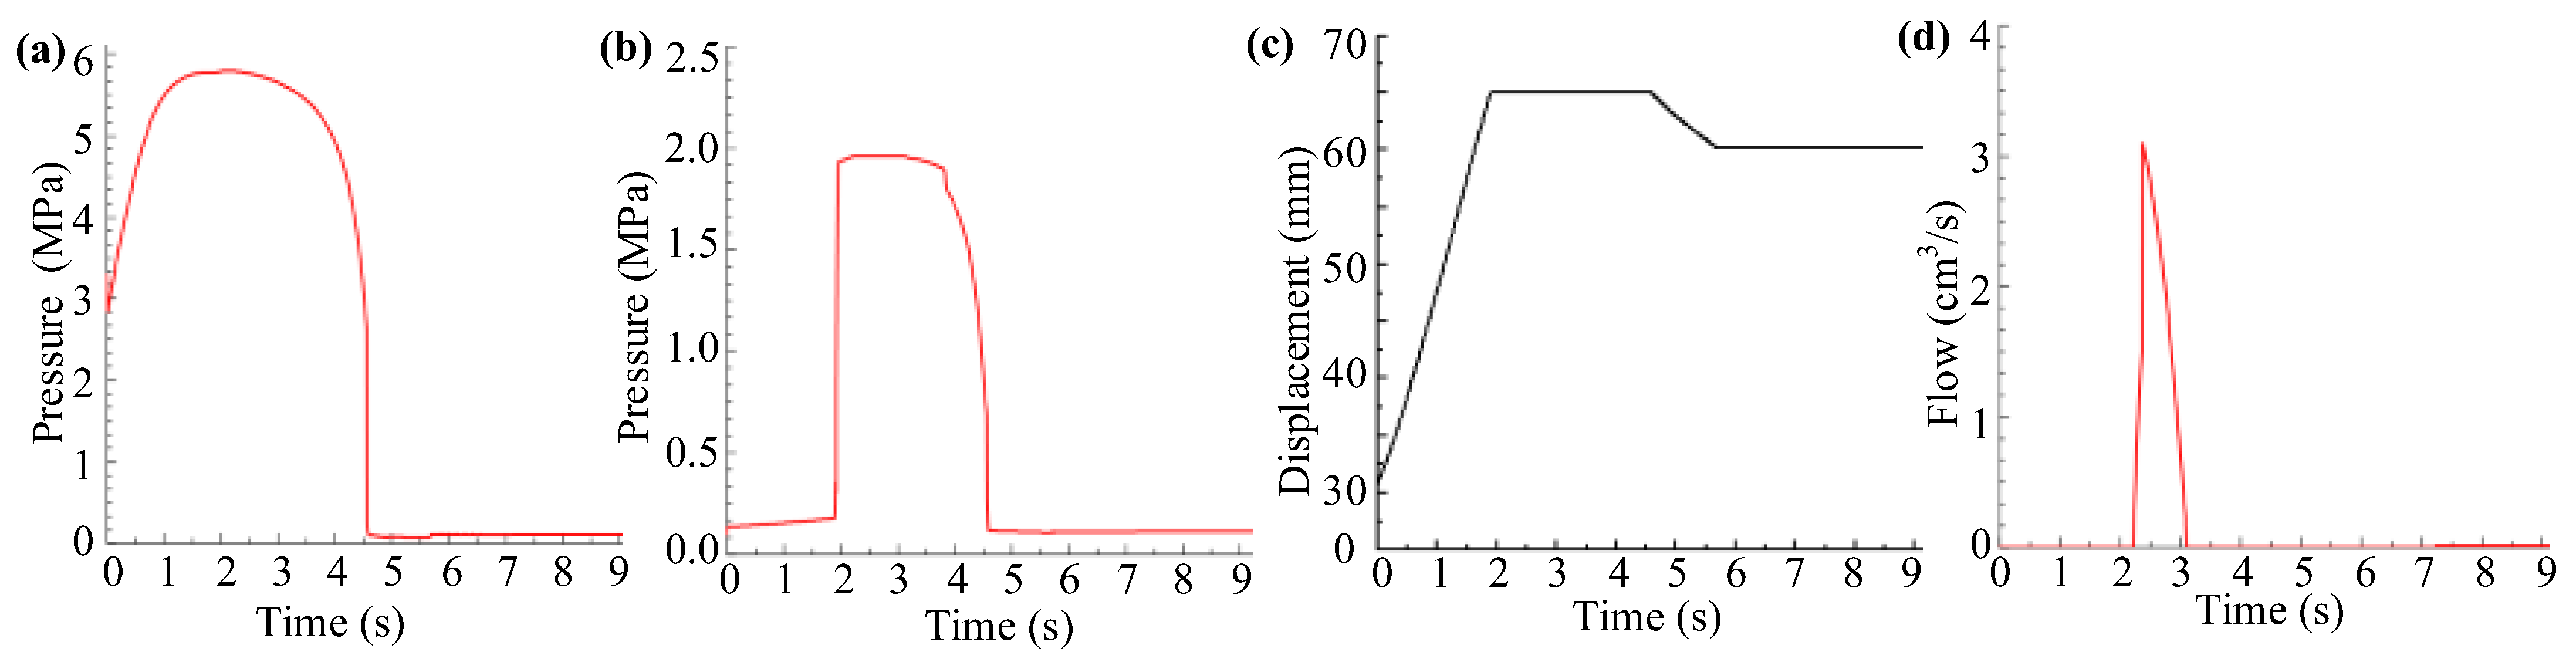
3.2. Simulation Analysis of Return Pressure Impact of Actuator

The pneumatic chamber supplies compressed nitrogen at 2.156 MPa. The initial settlement of the actuator piston is 10% of the total stroke. Figure 5a illustrates the pressure curve in the lower hydraulic chamber of the canopy actuator. After full opening, the actuator experiences some sinking, establishing a pressure of 3.3 MPa in the lower hydraulic chamber. Upon retraction, the pressure peaks at 5.79 MPa before settling at 0.11 MPa. At 4.58 s, the piston completes retraction, and the pneumatic system shuts off, locking the oil circuit. The pressure in the oil tank and piston displacement should be analyzed together. Initially, the piston’s upward movement causes minor pressure changes due to the oil chamber’s volume change. However, after 1.93 s, the pressure linearly rises above 1.96 MPa, causing the overflow valve to activate and spill oil, as seen in Figure 5b. The oil begins to spill at 2.06 s, aligning with the peak pressure time and confirming an overflow due to excessive tank pressure.
The simulation results are slightly deviated from the experimental data provided by the factory. The specific comparison items are shown in Table 1.
The lower hydraulic chamber shows similar peak pressure changes in both the simulation and experiment, matching return times and overall pressure trends. This similarity confirms the simulation model’s accuracy in replicating impact phenomena observed in the actual system. Further, this validated model can be used to assess optimization strategies by adjusting specific component parameters and analyzing their effects on the system’s behavior.

3.3. Analysis of Parameters Affecting the Return Pressure Impact

The fundamental cause of the overflow phenomenon in the pressure tank is the excessive speed of the canopy actuator, resulting in the pressure peak of the lower hydraulic chamber being too high. The working medium of the actuator includes both compressed nitrogen and aviation hydraulic oil. The aging and failure of the seal inevitably allow high-pressure gas to enter the hydraulic chamber, which will cause changes in the gas content of the oil. Variations in the gas content of the oil will affect its elastic modulus, thus affecting the system. In addition, the sinking of the canopy will also affect the peak pressure of the lower hydraulic chamber. Different sinking amounts mean that the stroke of the actuator during return is different, resulting in different return speeds and times. We will sequentially discuss the impact of the parameters above on the system’s operational characteristics.
The gas in the system mostly exists in two forms: dissolved and free [33,34,35,36]. The presence of dissolved gas does not significantly impact oil’s bulk elastic modulus, whereas bubbles have a notable effect on it. As the gas content increases, oil compressibility increases, leading to a reduction in the bulk modulus. Simulations at various gas levels (6% to 12%) show these effects, as illustrated in Figure 6.
The curves in Figure 6 basically coincide, and the peak pressure of the lower hydraulic chamber decreases slightly with the increase in gas content. The oil tank does not spill oil when the gas content is above 9%, indicating that a certain amount of dissolved gas in the oil is not the cause of oil overflow.
According to the working principle, the gas–liquid control system introduces compressed nitrogen into the pneumatic chamber to control the canopy’s closure, with rated pressures between 2.058 MPa and 2.352 MPa. Different gas pressures will affect the speed of the actuator. Therefore, simulations at 2.1 MPa, 2.2 MPa, and 2.3 MPa were conducted to evaluate the impact of gas pressure on the actuator’s performance, with results in Figure 7.
Figure 7 indicates that increasing the gas pressure raises the peak pressure in the lower hydraulic chamber. The pressure of the oil chamber exceeds the safety value, causing oil overflow in the oil tank. When the canopy is closed, the higher the pressure in the upper pneumatic chamber, the greater the acceleration of the piston retraction, and the faster the movement speed, resulting in a greater impact on the lower hydraulic chamber of the actuator. Theoretical and simulation results align, suggesting that to reduce the peak pressure, the pressure reducer’s outlet pressure should be near the technical requirements minimum.
According to the previous theoretical analysis, it can be concluded that the resistance loss along the pipeline increases with the length of the pipeline. The pipeline connected to the upper hydraulic chamber of the actuator is a long pipeline with a length of 3.483 m. Based on the original size, simulations of varying lengths in Figure 8 show how they impact the lower hydraulic chamber’s pressure.
From the curves, it is evident that while the pipeline’s length has minimal influence on the peak pressure of the lower hydraulic chamber of the actuator, it significantly affects the return time of the actuator. The return time becomes longer as the length of the pipeline increases. Shortening the length of the upper hydraulic chamber pipeline, the peak pressure of the oil tank decreases, and the actuator’s return time is reduced, resulting in a delay in the peak pressure of the oil tank’s oil chamber.
We extract and analyze the peak values in the pressure curves, summarize the peak values of the lower hydraulic chamber pressure of the canopy actuator, and determine the peak pressure of the pressure tank’s oil chamber and whether the oil tank overflows. The summary is shown in Table 2.

3.4. Analysis of the Influence of the Sinking Amount of the Actuator on the Impact of the Return Pressure

According to the measured data, the sinking amount of the actuator on the test bench ranges from 10% to 30% of the total stroke. In simulation analysis, the sinking amount is taken as 10% of the total stroke for comparison purposes, contrasted with a scenario of no sinking. As a result of the actuator’s sinking, a portion of the oil returns to the pressure tank, requiring adjustments to the positions of both the actuator piston and the pressure tank piston within the model. The simulation analysis results are shown in Figure 9.
According to the analysis of Figure 9, the pressure of the actuator without initial subsidence is higher than that with subsidence, but the trend of the two is similar, with a return time difference of less than 1 s. When there is a certain amount of subsidence, the pressure of the oil tank reaches the peak pressure first. The pressure of the pressure tank exceeds the opening pressure of the oil spill valve, resulting in oil overflow.

4. Optimization Design and Analysis of the Return Pressure Impact of the Actuator

Combined with the main parameters affecting the pressure of the oil chamber of the pressure tank and the causes of the hydraulic impact of the canopy actuator and taking into account the many limitations of modifications on the aircraft, the optimization scheme mainly focuses on optimizing structural parameters of the reversible valve (internal orifice diameter), increasing the flow cross-section of the pipeline to reduce the oil flow rate and other practical engineering optimizations.

4.1. Optimize the Diameter of the Reversible Valve Orifice

According to the relationship between the orifice diameter of the throttling element and its pressure difference, the high pressure generated by the return stroke of the canopy actuator can be absorbed by reducing the inner orifice diameter of the reversible valve. The diameter of the orifice is set to 1.48, 1.46, 1.44, 1.42, and 1.40 mm according to a gradient of 0.02 mm. The results are shown in Figure 10.
As shown in Figure 10, a smaller orifice diameter enhances the throttling ability of the reversible valve, which correspondingly raises the peak pressure in the lower hydraulic chamber. Additionally, the return time also increases, but both exceed the specified time by 14 s, which is a threshold verified by factory. The peak pressure in the oil chamber of the pressure tank gradually decreases. When the diameter of the throttle orifice is 1.5 mm, the outlet flow rate of the oil spill valve reaches 3.1 cm3/s. However, when the orifice diameter is reduced to 1.48 mm or less, the flow curve remains zero, indicating that the tank no longer spills oil. The peak pressure values for the lower hydraulic chamber and the pressure tank across these five orifice diameters are tabulated in Table 3.
It can be seen that reducing the diameter of the reversible valve orifice has a significant absorption effect on the pressure impact of the pressure tank, and this effect becomes more obvious as the diameter of the orifice decreases. The oil spill valve on the tank belongs to the direct relief valve, with an adjusted pressure between 1.96 MPa and 2.45 MPa. The adjustment pressure of the direct acting relief valve is 1.1 to 1.15 times the maximum working pressure of the system, which means that the maximum pressure of the tank is below 1.70 MPa. With a 1.40 mm diameter for the reversible valve orifice, the peak pressure of the pressure tank is 1.652 MPa, meeting both the safety threshold and the required return time for the canopy actuator.

4.2. Optimize the Inner Diameter of the Pipeline Connected to the Upper Hydraulic Chamber

The canopy actuator is a differential connection. Optimizing the inner diameter of the pipeline between the hydraulic control switch and the upper hydraulic chamber can timely supplement the oil to the upper hydraulic chamber to avoid the formation of a local vacuum and slow the flow of excess oil to the pressure tank. The pipeline’s total length between the hydraulic control switch and the upper hydraulic chamber is 3483 mm. Its inner diameter is 4 mm. Simulations were conducted with inner diameters of 3 mm, 4 mm, 5 mm, 6 mm, and 7 mm to compare the effects of different inner diameters on the impact of return pressure impact. The simulation results are shown in Figure 11.
From Figure 11, it can be seen that the diameter of the upper hydraulic chamber has a significant impact on the return time of the canopy actuator. As the diameter increases, the return time of the piston decreases. When the inner diameter of the pipeline increases by 1 mm to 5 mm, the peak pressure decreases to 0.57 MPa, less than 1.70 MPa. The flow rate of the oil spill valve is always 0, which means that the pressure tank does not spill oil. When the inner diameter of the pipeline increases to 6 mm and 7 mm, the pressure of the oil tank almost has no fluctuation, and the pressure impact is avoided to the greatest extent. In addition, the return time of the canopy actuator corresponding to the five different inner diameters also meets the requirements. The peak pressure values of the lower hydraulic chamber and pressure tank are shown in Table 4.

4.3. Optimize the Inner Diameter of the Pipeline Connected to the Lower Hydraulic Chamber

The lower hydraulic chamber and the reversible valve are connected by a long pipeline with a total length of 1105 mm, an inner diameter of 6 mm. There are many bends in this section of the pipeline. The inner diameter of the pipeline directly affects the oil flow rate and the movement speed of the piston, thus affecting the magnitude of the return pressure impact. According to the equation of pressure loss along the pipeline, the inner diameter is inversely proportional to the pressure loss along the pipeline. Therefore, it is considered to reduce the inner diameter of the pipeline connected to the lower hydraulic chamber of the actuator and increase the pressure drop in the pipeline, so as to reduce the pressure peak at the pressure tank and avoid oil spill failure.
The inner diameter of the pipeline between the lower hydraulic chamber and the reversible valve is set to 3.5, 4, 4.5, 5, and 5.5 mm for analysis. The simulation results are presented in Figure 12. The pressure peak values of the lower hydraulic chamber and pressure oil tank under different pipe diameters are shown in Table 5.
It can be seen that the pressure peak of the lower hydraulic chamber increases with the decrease of the inner diameter of the pipeline. When the inner diameter is reduced to 4.5 mm, the pressure peak of the oil chamber in the pressure tank is 1.911 MPa. The pressure is lower than the opening pressure of the oil spill valve, and the oil spill valve no longer spills oil. With the continuous decrease of the inner diameter of the pipeline, the time to reach the peak pressure is delayed and the peak pressure is continuously reduced. The return time of the actuator under different pipe inner diameters meets the specified requirements. When the inner diameter of the pipeline is 3.5 mm, the peak pressure of the pressure tank is 1.651 MPa, which is lower than 1.70 MPa. Within the safety adjustment range of the oil spill valve, it meets the optimization design requirements, but the maximum reduction rate of the peak pressure of the pressure tank is only 15.77%, and the optimization effect is general.

5. The Influence of the Optimization Scheme on the Extension Time of the Canopy Actuator

In addition to considering whether the pressure tank overflows, the optimization scheme also needs to ensure that the extension and retraction time of the actuator cannot be significantly changed, and both must meet the specified requirements. Therefore, this section conducts a simulation analysis on the extension time of the actuator for the improvement scheme, further clarifying the optimization parameters.
The extension and retraction of the canopy actuator are two relative working states. When the pressure gas enters the upper pneumatic chamber of the actuator, the piston is retracted. Conversely, when the pressure gas enters the lower pneumatic chamber, the piston extends. Compared with the return motion of the canopy, the positions of the piston of the actuator and the pressure tank change at the initial state of the simulation. The piston is at the bottom, the pressure tank is filled with oil, and the piston of the oil tank is located at the oil spill port. The simulation model of the canopy actuator extension is shown in Figure 13. When the actuator’s piston extends, pressure gas shifts from the upper to the lower pneumatic chamber, and the upper pneumatic chamber is connected to the atmosphere. The primary difference lies in varied input conditions, and the model of each component is unchanged.

5.1. Simulation Results and Analysis of the Extension of the Canopy Actuator

The displacement curve of the piston of the canopy actuator is shown in Figure 14. It can be seen that the piston begins to extend at 0 s and fully extends at 10.18 s. The overall movement process is relatively stable and then remains static.
The measured extension time of the actuator piston in the experiment is 11 s. This measurement aligns closely with the simulation results, which can verify the accuracy of the constructed simulation model. Furthermore, this model serves to evaluate the impact of any optimization scheme on the extension speed of the actuator.

5.2. Comparison of Optimization Schemes

The optimization scheme of the canopy control system determined earlier is to set the reversible valve orifice diameter to 1.40 mm, change the diameter of the upper hydraulic chamber to 6 mm, and change the diameter of the low hydraulic chamber to 3.5 mm. From the results, all three schemes can prevent the pressure tank from overflowing and have an anti-impact effect. In this part, the three optimization schemes are simulated and analyzed by the system simulation model when the canopy actuator extends. The simulation results of the three optimization schemes are summarized in Table 6. The optimal scheme is selected by comprehensively comparing the opening speed of the canopy and the peak pressure of the oil tank.
According to regulations, the opening time of the canopy must not exceed 14 s. All three schemes meet this extension time requirement. Table 6 reveals that optimizing the inner diameter of the upper hydraulic chamber pipeline has the shortest extension time, which is 9.31 s. Concurrently, this modification leads to the most significant reduction in the pressure tank’s oil chamber, decreasing by 91.58% without substantial pressure fluctuations. In summary, optimizing the inner diameter of the upper hydraulic chamber pipeline from the original 4 mm to 6 mm has the most significant effect. The adjustment of the pipe diameter is also realized, and this scheme is optimal. The energy absorption is uniform and the buffering effect is good, which has practical guiding significance. After discussion with the factory and experimental validation, the scheme proved viable and has been adopted.

6. Conclusions

This paper analyzed the return pressure impact mechanism of the canopy actuator, proposed optimization design schemes, and validated their effectiveness through digital simulation. The main conclusions are as follows:
(1) Based on the working principle of canopy closure, the transmission path of the pressure impact was determined, and factors affecting the inlet pressure of the pressure tank were analyzed by establishing flow–pressure characteristic equations for each hydraulic component.
(2) Using the AMESim system simulation model, the influence of various factors on the return pressure impact of the system was analyzed, providing a theoretical basis for the subsequent optimization design of the canopy system.
(3) To address the system’s return pressure impact issues, two improvement measures—controlling oil flow velocity and improving the structure of some hydraulic accessories were proposed. Based on this, three optimization schemes were proposed: increasing the inner diameter of the pipeline connected to the upper hydraulic chamber, reducing the inner diameter of the pipeline connected to the lower hydraulic chamber, and reducing the diameter of the reversible valve orifice. Through simulation, the scheme of increasing the inner diameter of the upper hydraulic chamber pipeline to 6 mm was found to be the most effective, reducing the peak pressure in the oil chamber of the pressure tank by 91.58% while meeting the system response time requirements. This scheme has been verified by the factory and successfully applied.
The research presented in this paper provides theoretical support and practical guidance for the optimal design of canopy systems, demonstrating significant engineering application value.

Author Contributions

Conceptualization, J.G. and C.G.; methodology, J.G.; software, J.G.; validation, L.H.; formal analysis, L.H.; investigation, J.G.; resources, L.Q.; data curation, C.F. and L.H.; writing—original draft preparation, J.G.; writing—review and editing, J.G. and C.F.; visualization, L.H.; supervision, C.G. and L.Q.; project administration, C.G. and L.Q.; funding acquisition, L.Q. All authors have read and agreed to the published version of the manuscript.

Funding

This research was funded by the National Natural Science Foundation of China, grant numbers 51775477.

Data Availability Statement

The data presented in this study are available on request from the corresponding author.

Acknowledgments

The authors gratefully acknowledge the financial support by the National Natural Science Foundation of China.

Conflicts of Interest

The authors declare no conflicts of interest.

References

  1. Barimani-Varandi, A.; Nasrabadi, M.K.; Ravan, B.A.; Javadi, M. Rapid prototyping of aircraft canopy based on the incremental forming process. J. Braz. Soc. Mech. Sci. Eng. 2021, 43, 59. [Google Scholar] [CrossRef]
  2. Wang, X.K.; Wei, S.C.; Xu, B.S.; Chen, Y.; Yan, X.; Xia, H.H. Transparent organic materials of aircraft cockpit canopies: Research status and development trends. Mater. Res. Innov. 2015, 19, S10–S199. [Google Scholar] [CrossRef]
  3. Jamisola, R.S.; Oetomo, D.N.; Ang, M.H.; Khatib, O.; Lim, T.M.; Lim, S.Y. Compliant motion using a mobile manipulator: An operational space formulation approach to aircraft canopy polishing. Adv. Robot. 2005, 19, 613–634. [Google Scholar] [CrossRef]
  4. Lanciotti, A.; Mantelli, R. New configurations for the windshield and the canopy for a two-seater trainer military aircraft. Aircr. Eng. Aerosp. Technol. 2003, 75, 156–163. [Google Scholar] [CrossRef]
  5. Wang, Y.G.; Qi, T.; Li, H.F. Fault Analysis of Excessive Sinking for a Certain Air-craft Canopy. Aviat. Maint. Eng. 2023, 110–112. [Google Scholar] [CrossRef]
  6. Tyvand, P.A.; Solbakken, K.M.; Hjelmervik, K.B. Incompressible impulsive wall impact of liquid bodies. Eur. J. Mech. B/Fluids 2014, 47, 202–210. [Google Scholar] [CrossRef]
  7. Meirmanov, A.; Nekrasova, I. Mathematical models of a hydraulic shock. J. Math. Anal. Appl. 2013, 408, 76–90. [Google Scholar] [CrossRef]
  8. Cooker, M.J.; Peregrine, D.H. Pressure-impulse theory for liquid impact problems. J. Fluid Mech. 1995, 297, 193–214. [Google Scholar] [CrossRef]
  9. Garg, R.K.; Kumar, A. Experimental and numerical investigations of water hammer analysis in pipeline with two different materials and their combined configuration. Int. J. Press. Vessel. Pip. 2020, 188, 104219. [Google Scholar] [CrossRef]
  10. Chang, S.; Ye, M.; Zhang, D.; Ma, Y.; Zhang, J. Impact performance optimization for hydraulic rock drill based on stroke and flow compensation factors. Adv. Mech. Eng. 2024, 16, 1689672763. [Google Scholar] [CrossRef]
  11. Meng, X.; Zhang, Z.; Sheng, K.; Yu, C.; Huang, H.; Chen, S.; Li, Y. Modeling and experimental evaluation of vibration reduction of hydraulic-driven joint with a MRF damper. J. Intell. Mater. Syst. Struct. 2022, 34, 251–260. [Google Scholar] [CrossRef]
  12. Maia Neto, M.; Góes, L.C.S. Use of LMS Amesim® model and a bond graph support to predict behavior impacts of typical failures in an aircraft hydraulic brake system. J. Braz. Soc. Mech. Sci. Eng. 2018, 40, 414. [Google Scholar] [CrossRef]
  13. Li, C.; Zhang, Z.; Lin, J.; Wang, W. Sensitivity analysis of one-dimensional water hammer model in pump-pipeline systems. J. Braz. Soc. Mech. Sci. Eng. 2024, 46, 504. [Google Scholar] [CrossRef]
  14. Hjelmervik, K.B.; Tyvand, P.A. Incompressible impulsive wall impact of liquid cylinders. J. Eng. Math. 2017, 103, 159–171. [Google Scholar] [CrossRef]
  15. Yang, S.; Ou, Y.; Guo, Y.; Wu, X. Analysis and optimization of the working parameters of the impact mechanism of hydraulic rock drill based on a numerical simulation. Int. J. Precis. Eng. Manuf. 2017, 18, 971–977. [Google Scholar] [CrossRef]
  16. Ren, Q.; Kou, Z.; Wu, J.; Li, T.; Yahya, W. Development and parametric analysis of vibration system controlled by hydraulic shock rotary vibrator. Shock Vib. 2021, 2021, 1082963. [Google Scholar] [CrossRef]
  17. Abebe, A.; Tadesse, Y.; Beyene, A. Conversion of Thermally Amplified Hydraulic Shock for Power Generation: Modeling and Experimental Analyses. J. Energy Resour. Technol. 2023, 145, 22103. [Google Scholar] [CrossRef]
  18. Urbanowicz, K.; Jing, H.; Bergant, A.; Stosiak, M.; Lubecki, M. Progress in Analytical Modeling of Water Hammer. J. Fluids Eng. 2023, 145, 081203. [Google Scholar] [CrossRef]
  19. Urbanowicz, K.; Bergant, A.; Stosiak, M.; Deptuła, A.; Karpenko, M. Navier-Stokes Solutions for Accelerating Pipe Flow—A Review of Analytical Models. Energies 2023, 16, 1407. [Google Scholar] [CrossRef]
  20. Brühl, M. Analytical Solution for Laminar Water Hammer With Frequency-Dependent Friction. J. Fluids Eng. 2022, 144, 111302. [Google Scholar] [CrossRef]
  21. Urbanowicz, K.; Bergant, A.; Stosiak, M.; Karpenko, M.; Bogdevičius, M. Developments in analytical wall shear stress modelling for water hammer phenomena. J. Sound Vibr. 2023, 562, 117848. [Google Scholar] [CrossRef]
  22. García-García, F.J.; Fariñas-Alvariño, P. On the analytical solution of transient friction in channel flows. Appl. Math. Mech. 2024, 45, 1447–1466. [Google Scholar] [CrossRef]
  23. Plouraboué, F. Review on water-hammer waves mechanical and theoretical foundations. Eur. J. Mech. B/Fluids 2024, 108, 237–271. [Google Scholar] [CrossRef]
  24. Miao, D.; Zhang, J.; Chen, S.; Yu, X. Water hammer suppression for long distance water supply systems by combining the air vessel and valve. J. Water Supply Res. Technol. Aqua 2017, 66, 319–326. [Google Scholar] [CrossRef]
  25. Yang, Z.; Zhou, L.; Dou, H.; Lu, C.; Luan, X. Water hammer analysis when switching of parallel pumps based on contra-motion check valve. Ann. Nucl. Energy 2020, 139, 107275. [Google Scholar] [CrossRef]
  26. Lee, J.S.; Lee, K.B.; Lee, C.G. An experimental study on the control of pressure transients using an orifice. Int. J. Press. Vessel. Pip. 2001, 78, 337–341. [Google Scholar] [CrossRef]
  27. Han, Y.; Shi, W.; Xu, H.; Wang, J.; Zhou, L. Effects of Closing Times and Laws on Water Hammer in a Ball Valve Pipeline. Water 2022, 14, 1497. [Google Scholar] [CrossRef]
  28. Wang, C.; Quan, L.; Ou, H. The method of restraining hydraulic impact with active adjusting variable damping. Proc. Inst. Mech. Eng. Part C J. Mech. Eng. Sci. 2018, 233, 3785–3794. [Google Scholar] [CrossRef]
  29. Zhang, Y.; Sun, W.; Ji, W.; Wang, B. Hoop layouts optimization for vibration reduction of L-shaped pipeline based on substructure-analytical model and genetic algorithm. J. Braz. Soc. Mech. Sci. Eng. 2023, 45, 243. [Google Scholar] [CrossRef]
  30. Silva, P.A.S.F.; Shabab, A.A.S.A.; Tsoutsanis, P.; Skote, M. Study of Orifice Design on Oleo-Pneumatic Shock Absorber. Fluids 2024, 9, 108. [Google Scholar] [CrossRef]
  31. Zeng, G.; Chen, W.; Li, J.; Wu, P.; Huang, B.; Wu, D. Numerical study on transient hydraulic excitation force characteristics of a water jet mixed-flow pump during rapid startup period. J. Mech. Sci. Technol. 2023, 37, 5117–5132. [Google Scholar] [CrossRef]
  32. Li, H.F.; Qi, T.; Zhao, Y. Common fault analysis and maintenance suggestion of canopy system for a certain type of aircraft. Aviat. Maint. Eng. 2023, 110–112. [Google Scholar] [CrossRef]
  33. Borges Da Silva, A.; Bastos De Freitas Rachid, F. Modeling of release and absorption of gas in liquid–gas flows within a consistent thermodynamic framework. Int. J. Eng. Sci. 2013, 66–67, 21–43. [Google Scholar] [CrossRef]
  34. Oskouei, S.J.P.; Zadeh, A.B.; Gates, I.D. A new kinetic model for non-equilibrium dissolved gas ex-solution from static heavy oil. Fuel 2017, 204, 12–22. [Google Scholar] [CrossRef]
  35. Chang, K.A.; Lindquist, W.B. The dynamics of gas-bubble formation at saturated conditions in porous media flow. Sci. Rep. 2020, 10, 13175. [Google Scholar] [CrossRef]
  36. Guo, Q.; Zhang, C.; Zhang, H.; Zhang, T.; Meng, D. Study on the Dissolution Mechanism of Aviation Hydraulic Oil–Nitrogen Gas Based on Molecular Dynamics. Processes 2025, 13, 1564. [Google Scholar] [CrossRef]
Figure 1. Schematic diagram of the gas–liquid control system for the canopy actuator.
Actuators 14 00306 g001
Figure 2. The force diagram of the piston rod of the canopy actuator.
Actuators 14 00306 g002
Figure 3. Schematic diagram of the internal structure and force balance of the pressure tank.
Actuators 14 00306 g003
Figure 4. Simulation model of gas–liquid control system for canopy actuator.
Actuators 14 00306 g004
Figure 5. The return impact simulation results: (a) Pressure curve of the lower hydraulic chamber of the actuator; (b) Pressure curve of the oil chamber of the pressure tank; (c) The displacement curve of pressure tank piston; (d) Flow curve at the outlet of the oil overflow valve.
Actuators 14 00306 g005
Figure 6. The simulation results of the return impact under the condition of 6~12% oil gas content: (a) Pressure curve of the lower hydraulic chamber of the actuator; (b) Pressure curve of the oil chamber of the pressure tank.
Actuators 14 00306 g006
Figure 7. The simulation results of return impact under different gas pressure: (a) Pressure curve of the lower hydraulic chamber; (b) Pressure curve of the oil chamber of the pressure tank.
Actuators 14 00306 g007
Figure 8. Simulation results of the return impact under different pipeline lengths: (a) Pressure curve of the lower hydraulic chamber; (b) Pressure curve of the oil chamber of the pressure tank.
Actuators 14 00306 g008
Figure 9. The simulation results of the return impact under the condition of the actuator with or without subsidence: (a) Pressure curve of the lower hydraulic chamber of the actuator; (b) Pressure curve of the oil chamber of the pressure tank.
Actuators 14 00306 g009
Figure 10. The simulation results after optimizing the diameter of the reversible valve orifice: (a) Pressure curve of the lower hydraulic chamber; (b) Pressure curve of the pressure tank’s oil chamber; (c) Flow curve of the oil overflow valve.
Actuators 14 00306 g010
Figure 11. The simulation results of optimizing the inner diameter of the pipeline connected to the upper hydraulic chamber: (a) Pressure curve of the lower hydraulic chamber of the actuator; (b) Pressure curve of the oil chamber of the pressure tank; (c) Flow curve at the outlet of the oil overflow valve.
Actuators 14 00306 g011
Figure 12. The simulation results of optimizing the inner diameter of the pipeline connected to the lower hydraulic chamber: (a) Pressure curve of the lower hydraulic chamber of the actuator; (b) Pressure curve of the oil chamber of the pressure tank; (c) Flow curve at the outlet of the oil overflow valve.
Actuators 14 00306 g012
Figure 13. System simulation model when the canopy actuator extends.
Actuators 14 00306 g013
Figure 14. The extension displacement curve of the actuator piston rod.
Actuators 14 00306 g014
Table 1. Comparison of simulation and experimental data.
Parameter ItemsValue
ExperimentSimulation
Return time of piston4.8 s4.58 s
Peak pressure of lower hydraulic chamber5.6 MPa5.79 MPa
Stable pressure of lower hydraulic chamber0.11 MPa0.11 MPa
Table 2. The pressure peak corresponding to different lengths of pipelines.
Pipeline Length (m)Peak Pressure of Lower Hydraulic Chamber (MPa)Peak Pressure of Pressure Tank’s Oil Chamber (MPa)Whether Oil Overflows
2.4835.7561.566No
2.9835.7721.808No
3.4835.7911.960Yes
3.9835.8021.960Yes
4.4835.8081.960Yes
Table 3. The pressure peak after optimizing the diameter of the orifice of the reversible valve.
Diameter (mm)Pressure Peak of Lower Hydraulic Chamber (MPa)Pressure Peak of Pressure Tank’s Oil Chamber (MPa)Reduction Rate of Peak Pressure in Oil TankWhether Oil Overflows
1.485.7931.9221.94%No
1.465.8101.8704.59%No
1.445.8271.8018.11%No
1.425.8441.73011.73%No
1.405.8601.65215.71%No
Table 4. The pressure peak after optimizing the diameter of the pipe connected to the upper hydraulic chamber.
Pipe Diameter (mm)Pressure Peak of Lower Hydraulic Chamber (MPa)Pressure Peak of Pressure Tank’s Oil Chamber (MPa)Reduction Rate of Peak Pressure in Oil TankWhether Oil Overflows
35.8301.960Yes
45.7911.960Yes
55.7590.5770.92%No
65.8330.16591.58%No
75.8830.16591.58%No
Table 5. The pressure peak after optimizing the diameter of the pipe connected to the lower hydraulic chamber.
Pipe Diameter (mm)Pressure Peak of Lower Hydraulic Chamber (MPa)Pressure Peak of Pressure Tank’s Oil Chamber (MPa)Reduction Rate of Peak Pressure in Oil TankWhether Oil Overflows
3.55.8591.65115.77%No
45.8201.8207.14%No
4.55.8051.9112.5%No
55.7981.9600Yes
5.55.7941.9600Yes
Table 6. Comparison table of simulation results for three optimization solutions.
Optimization SchemesExtension Time of Actuator (s)Pressure Peak of Lower Hydraulic Chamber (MPa)Pressure Peak of Pressure Tank’s Oil Chamber (MPa)Reduction Rate of Peak Pressure in Oil Tank
Reversible valve10.225.8601.65215.71%
Pipeline connected to upper hydraulic chamber9.315.8330.16591.58%
Pipeline connected to lower hydraulic chamber11.605.8591.65115.77%
Disclaimer/Publisher’s Note: The statements, opinions and data contained in all publications are solely those of the individual author(s) and contributor(s) and not of MDPI and/or the editor(s). MDPI and/or the editor(s) disclaim responsibility for any injury to people or property resulting from any ideas, methods, instructions or products referred to in the content.

