1. Introduction
The rail network in the United States is a crucial infrastructure that supports national logistics and transit, often out of the public’s eyes. With an extensive freight rail network covering approximately 225,000 km of track across the continental U.S., this industry is critical for moving and delivering goods [
1]. In addition to freight rail, passenger trains in the U.S. operate alongside freight trains. In the 2024 fiscal year, Amtrak reported an all-time ridership record of more than 32.8 million passengers [
2]. Inspections and maintenance of the existing infrastructure are essential to meet the demands of this ever-growing industry upon which millions rely yearly. In recent years, Class 1 railroads in the U.S. have focused on improving safety, upgrading rail networks, and increasing reliability. In 2023, they collectively reinvested USD 26.8 billion toward these goals and have made many technological improvements to the network [
3].
With such a complex system of railways, track crossings, and signaling equipment, railroad workers must spend significant time, manpower, and resources properly inspecting everything by hand. As such, railroad companies have been pursuing ways to add routine automated inspection technology to their maintenance procedures. In many cases, automated systems can find defects and problems earlier, allowing workers to respond to the issue before it impacts safety or performance. Early detection and prevention are fundamental to lowering the number of derailments and accidents that occur each year.
Some recent equipment that has been successfully implemented into existing railways include train inspection portals (TIPs), autonomous track inspection (ATI) systems, and wayside train monitoring systems (WTMS) [
4]. TIPs implement a system of high-speed cameras, machine vision, and artificial intelligence to inspect railcars as they pass through a tunnel at speed [
5]. Similarly, many ATI systems use comparable camera, sensor, and machine learning technologies, but these typically operate mounted to a railcar or Hyrail truck [
6]. WTMS are stationary systems that are mounted alongside a track bed to monitor train health, such as wheel integrity, as it passes by the monitoring location [
4].
Many of the newer inspection technologies focus on keeping trains moving and reducing idle time, which benefits consumers, companies, and the environment. These advantages include decreased fuel consumption, fewer delays, extended locomotive life, and lower emissions, all of which improve operational efficiency and environmental sustainability [
7]. Prioritizing the ratio of track time for trains over crews of workers to keep freight and passengers moving makes sense economically but can lead to problems when inspections must be completed on a schedule. If some of the sensors and equipment normally operated by crews of workers could be integrated into existing trains, this would allow data collection to occur without slowing down the rail network.
As train-mounted data collection systems have become more widespread, challenges have arisen from the harsh and unpredictable environments in which trains operate. Some sensors, cameras, and other systems are not made to operate in such places. Thus, there is an occasional need to detach or cover the equipment to prevent damage to sensitive components. However, requiring manual setup and takedown of this equipment can diminish the advantages of train-mounted automated systems over Hyrail trucks. Manual intervention can also become problematic in emergency scenarios. For example, suppose a train traveling at high speeds encounters sudden inclement weather. In that case, it may not be able to stop in time for personnel to safely retract or secure vulnerable equipment.
This study aims to design, test, and validate an automated and retractable platform capable of deploying track inspection sensors during train motion and stowing them in a protected storage space to protect sensitive components when not in use.
2. System Requirements and Design Considerations
In this section, the system requirements and design considerations are outlined based on the integration, environmental, and functional constraints.
2.1. Railcar Integration
In recent years, a common trend in the railroad industry has been to convert old passenger coach cars into towable cars equipped with ATI systems [
8]. Using this concept as a guide, the system in this study was designed considering the structural geometry and space limitations of a passenger railcar. To achieve a full field of view of the environment around a track, the railroads often select the rear of a test platform as the place to deploy scanning equipment such as Lidars. Since the coaches used for testing (geometry or metrology cars) are often towed at the end of a train, this ensures that other railcars will not interfere with or block the field of view of mounted sensors. Given that many coach cars include a rear platform, this is the guiding geometry used for the specification and constraints of the assembly designed, tested, and validated in this work.
2.2. Environmental Constraints and Assumptions
To meet the design objective of environmental protection, it was necessary to determine where in the railcar the system could be safely and effectively housed. First, the system must be fully enclosed, eliminating the possibility of directly mounting an assembly to the open rear platform. This location would be easy for operators to access but offers little protection. Second, mounting equipment underneath the train introduces a greater risk of damage due to increased exposure to debris and railbed impact. This area also experiences higher vibrations and less damping than the suspended passenger section, making it less ideal for sensitive components. Considering these assumptions, we determined that the safest and most protected area towards the rear of a coach car is the ceiling space above the platform. This space is already built to be weather-protected and has few systems critical to the railcar’s function. The low-vibration environment and minimal functional interference also make the rear ceiling space ideal for integrating additional equipment. The prototype developed in this study was not designed to meet a specific ingress protection (IP) rating, given that environmental impacts could not be studied in laboratory tests. However, future iterations of the system intended for field deployment will require proper sealing and protection.
2.3. Project Specifications
With a design space selected for the system, there are several design constraints that affect how the retraction and stowing can be accomplished.
Table 1 summarizes the essential space constraints and vibration requirements. The size of the system needs to be kept as small as possible while maintaining strength to allow it to be installed into the tight areas of a railcar. For this study, the maximum height and width were selected as 558.8 (22 inches) and 685.8 (27 inches) millimeters, respectively. These dimensions keep the overall system compact while leaving a reasonable space for mounting sensors and accompanying electronics. Since one of the overall goals of this project is to quickly deploy and retract sensors for data collection, the ideal actuation time was set to 30 s, which is a reasonable time for rapid deployment without risking damage to the mounted sensors due to uncontrollable or sudden movements.
Positional accuracy is essential for calibrating sensors when deployed to collect data. If the system does not return to the same position behind the railcar, it causes errors between data collected at different times. Applying this constraint, the system needs to be able to actuate repeatably within a 3.175 mm (0.125-inch) tolerance. Another important factor to consider in the design is how the operator will interact with the equipment. At a minimum, the operator must be able to monitor the positional status of the actuated platform passively. Hence, the interface should indicate whether the system is extended or retracted, without the need to provide an intermediate location between the two ends of travel.
The final three design specifications outline the types of forces that a train-mounted assembly could experience while traveling down the railway. Using the Federal Railroad Association (FRA) regulations for passenger cars, the lateral and vertical accelerations experienced must not exceed 0.15 g [
9]. Using a higher limit of 0.25 g for this design guarantees that the system can withstand all forces generated in high-speed turns. The longitudinal force or the force in line with the rail could be higher if the railcar is hit hard during coupling. To account for such an impact, a conservative acceleration of 2.5 g was selected to account for forces in the longitudinal direction [
10]. This value ensures that large acceleration spikes and impulses that can be applied to a passenger car during coupling are accounted for in calculations.
3. Actuation Mechanism and Control System
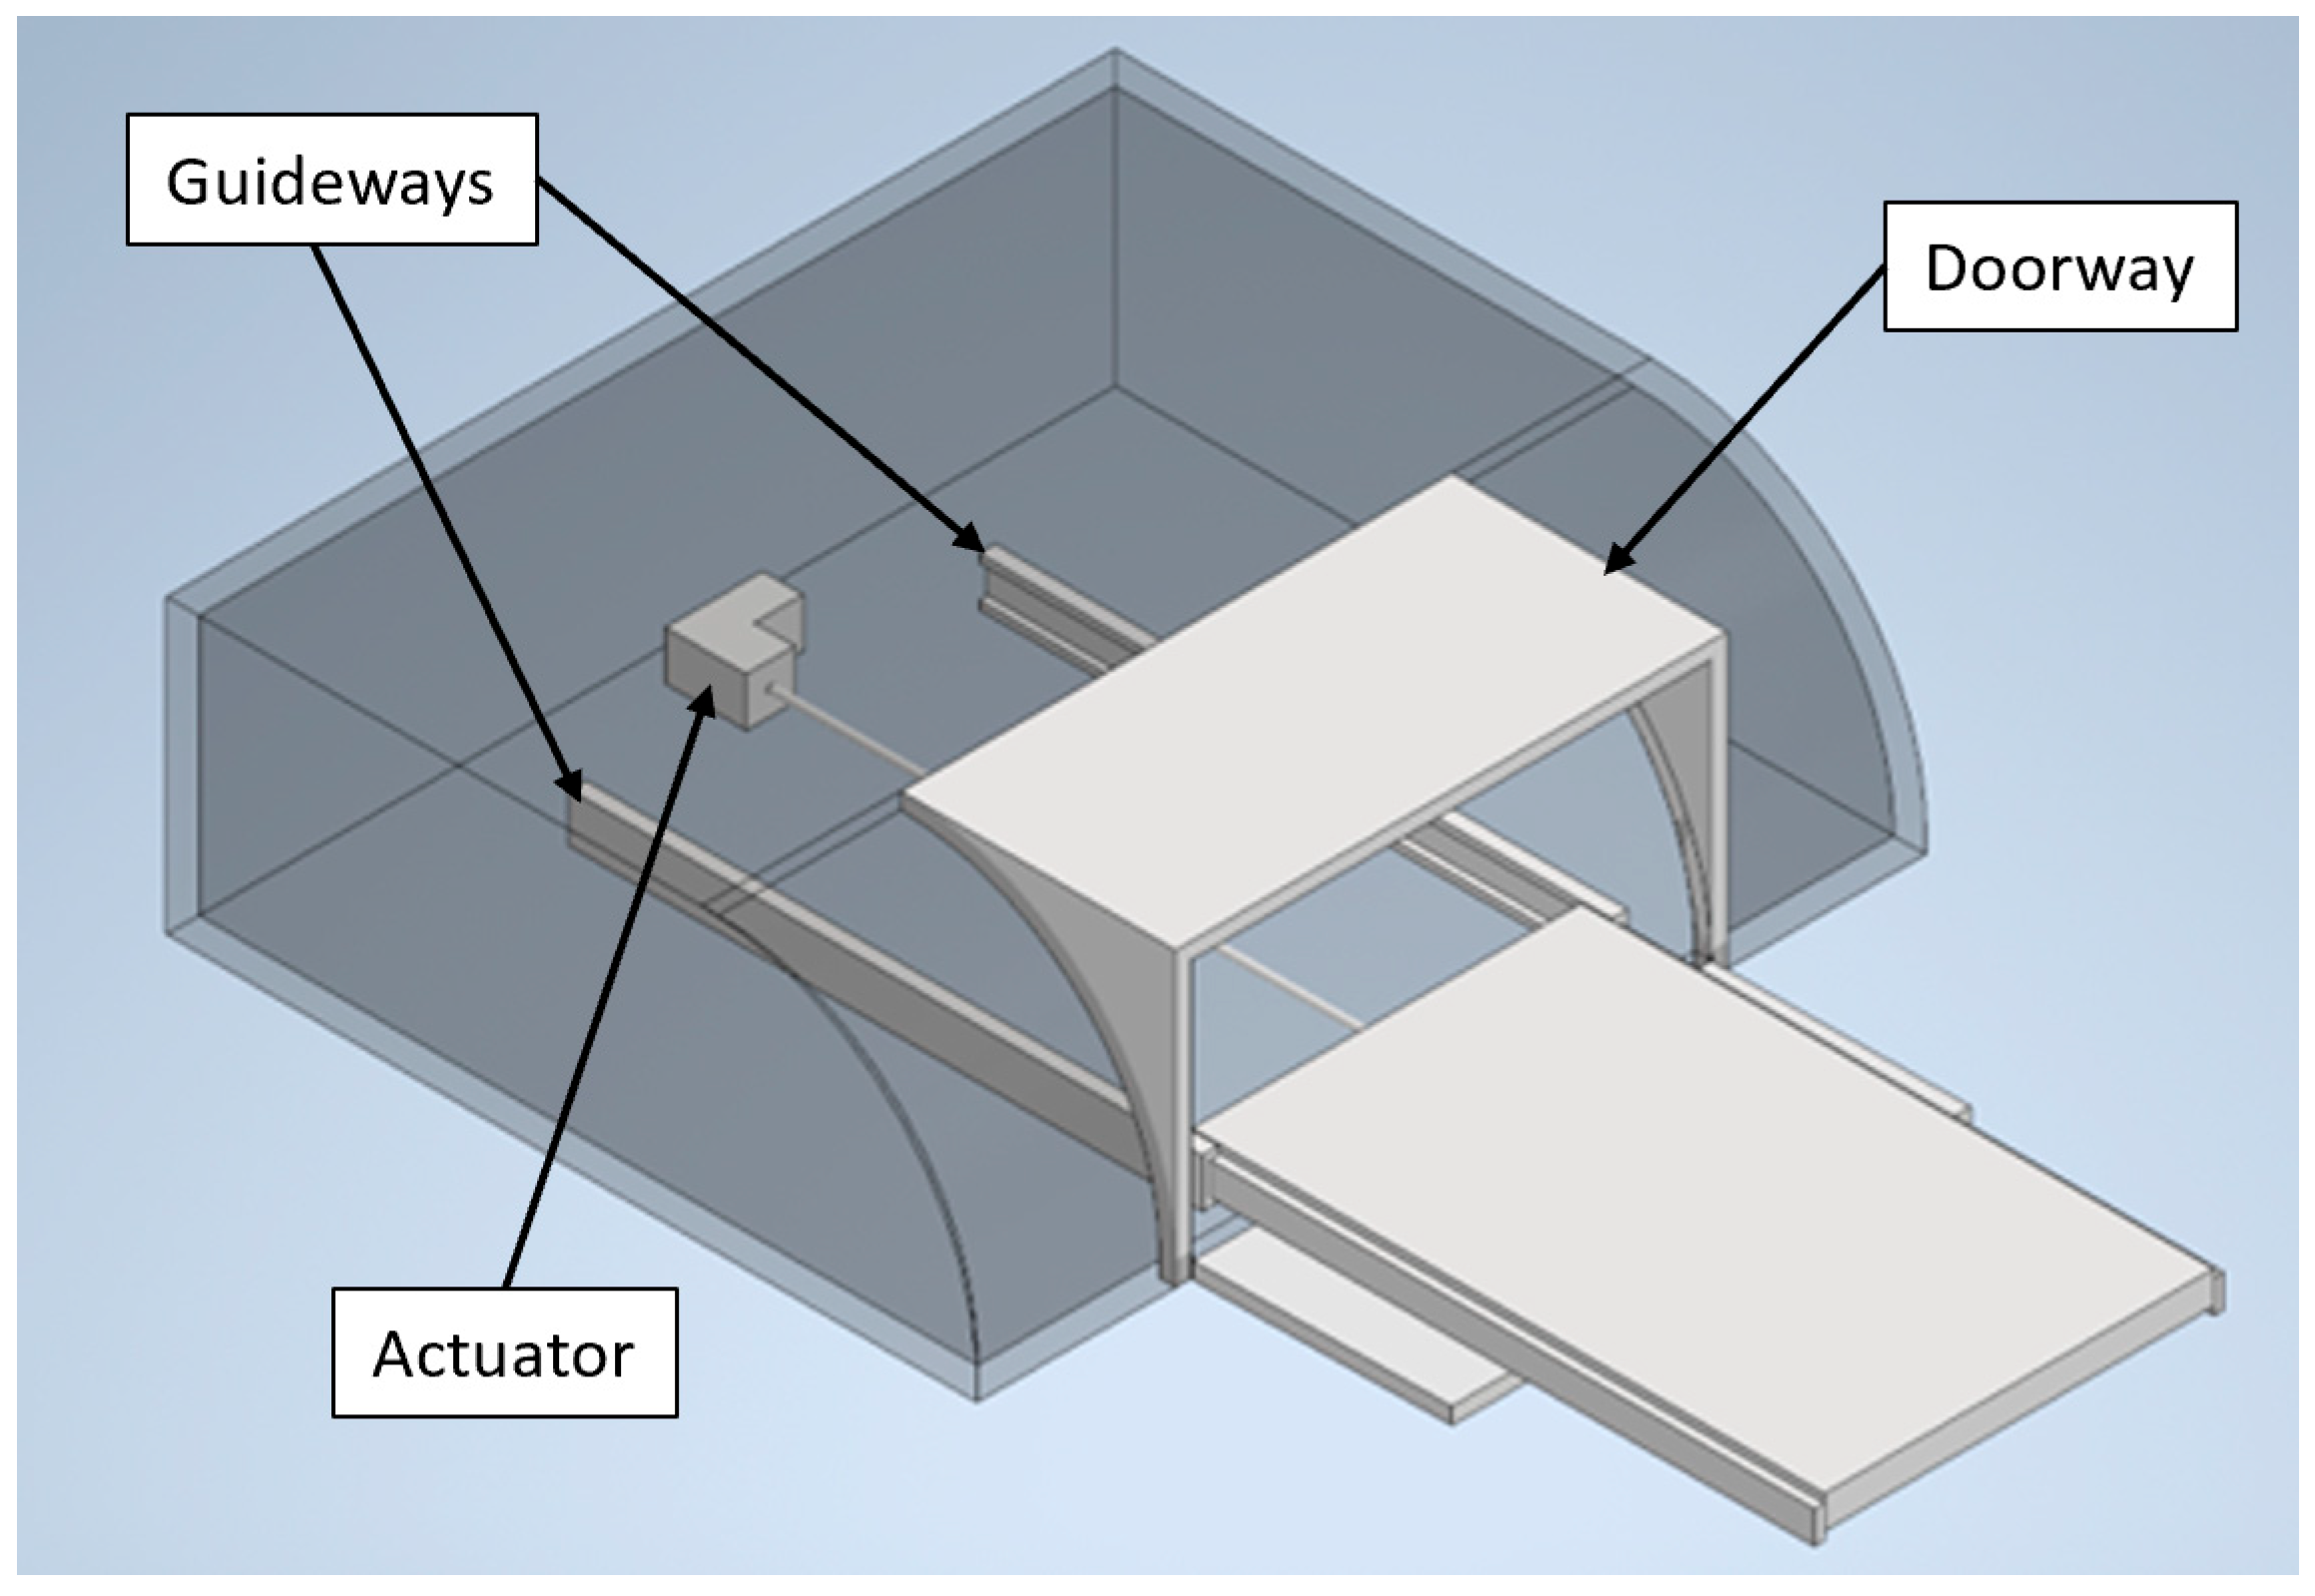
A reliable, precise, and durable actuation subsystem must be implemented into the assembly to meet the project specifications outlined in the previous section. Given that the overall shape of the system needs to be shelf-like to accommodate sensor mounting, the actuation subsystem must consist of a guideway and drive system, as shown in the preliminary system layout in
Figure 1. It is also important to note that a door or hatch subsystem is also required to protect the equipment from environmental conditions but depends highly on the specific geometry and constraints when installed in a passenger car, which is beyond the scope of this study.
3.1. Drive System Concepts
There are several different driving methods that can be applied to this type of assembly, each with unique advantages and disadvantages. The five versions applicable for this type of assembly include the following:
Electric cylinders;
Pneumatic cylinders;
Hydraulic cylinders;
Belt-driven motors;
Motorized lead screws.
After evaluating the five concepts, the one that was determined to best meet the overall system requirements is the motorized lead screw. This drive mechanism can be designed to be integrated into a more compact area and provides adequate stability and rigidity. In comparison, the belt-driven motor concept lacks rigidity depending on the tensioning of the belt and could experience more wear in service than a lead screw. The three-cylinder actuators were not selected mainly because of their higher costs and potentially more complex control requirements. Hydraulic and pneumatic cylinders require pumps and compressors to actuate them, which would occupy valuable space when integrating them into the ceiling of a passenger railcar.
3.2. Linear Guideway Concepts
Five different guideway concepts were also considered during the design phase to fully stabilize and actuate the system. The possibilities included the following:
T-slot extrusion linear bearings;
Linear rails with blocks;
Ball-bearing drawer slides;
Linear rods;
Dovetail slides.
While each has certain advantages, based on cost, versatility, and strength in the load directions, we determined that the best option was the t-slot extrusion linear bearings. Dovetail slides are highly precise and strong but often expensive to manufacture and implement. The drawer slides and linear rods may not be best suited to the cantilever and compression load scenarios. These concepts could also be prone to buckling or bending under the stresses caused during operation. Ultimately, the decision was made to proceed using the t-slot extrusion linear bearings for the prototype assembly manufactured in this study with the understanding that upgrading to a stronger linear bearing and rail could be accomplished if there is a need for even more strength in the future.
3.3. Structural Design
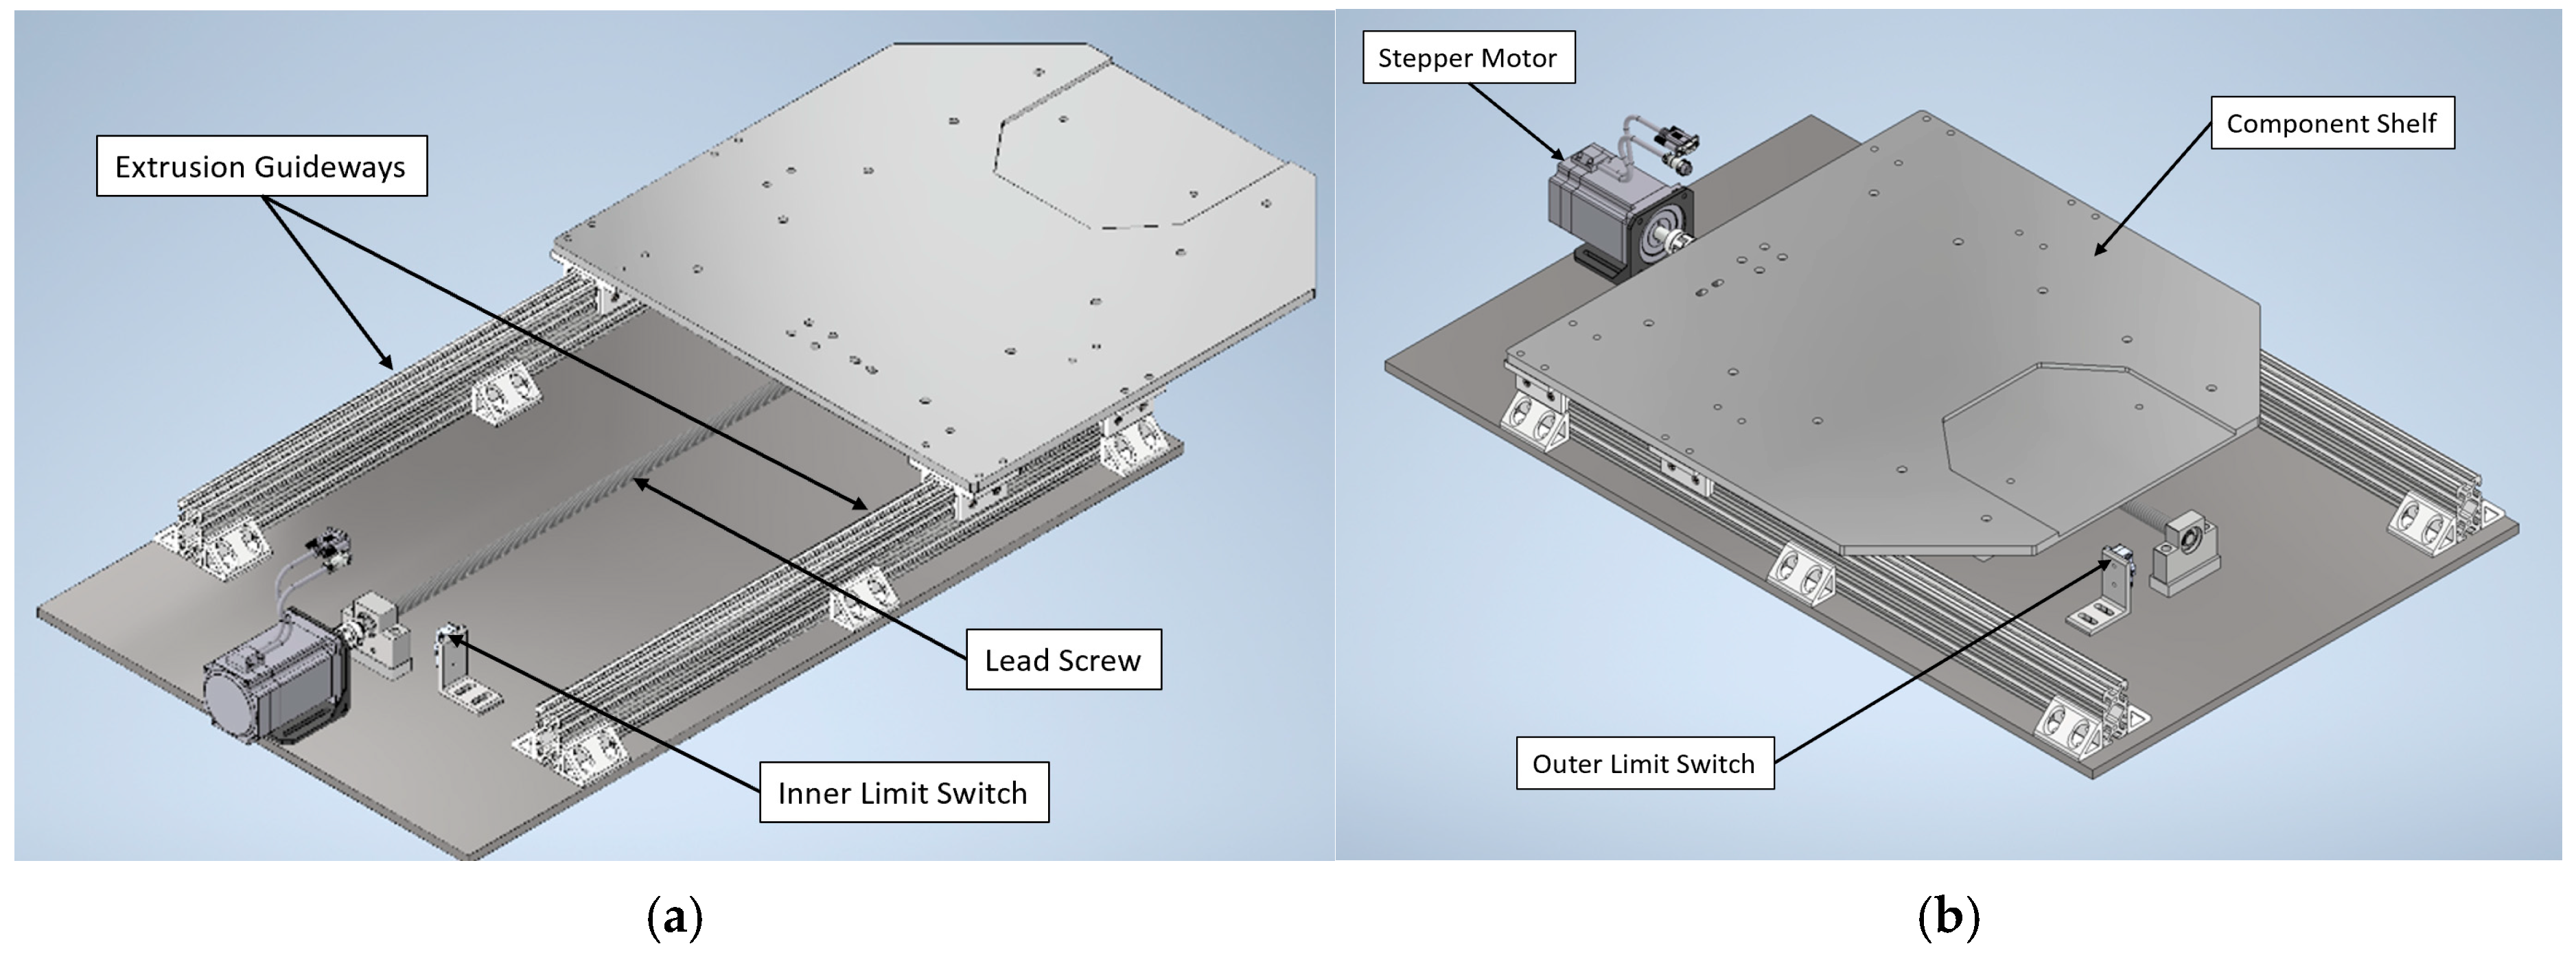
With the drive and guideway subsystem selected, the deployable shelf was designed using 6061 aluminum for a high strength-to-weight ratio, as shown in
Figure 2. This setup is designed to have a versatile and customizable top to allow different types of equipment and sensors to be installed. The linear bearings are 3-slotted slides moving along a 1-inch by 3-inch extruded aluminum beam with T-slots to guide the bearings [
11]. The bearings have t-shaped pads made of ultra-high-molecular-weight polyethylene (UHMW) seated in the guideways. UHMW is a tough, wear-resistant plastic that is ideal for this application. Using the material data, we determined a static coefficient of friction of 0.20, which we used for the load calculations and sizing of the electric drive motor [
12]. This assembly offers 609.6 mm (24 inches) of travel for the shelf while moving from fully stowed to fully extended, with a total mass of 24.78 kg, including an added margin for sensor equipment. The structural design also accounted for the anticipated lateral and vertical force resistances of 0.25 g, as detailed earlier.
3.4. Lead Screw Sizing and Load Calculations
Sizing the lead screw acting in a horizontal configuration with an uncentered CG (center of gravity) from the lead screw nut required calculating the bending stress acting on the screw and comparing it with the material’s yield strength. Using a 20 mm lead screw with a 4 mm pitch made from 1045 carbon steel, the yield strength is approximately 310 MPa [
13]. Applying the known load from the mass, 243.1 N, at a known offset of approximately 500 mm gives an applied moment of 121.5 Nm, which can be used in Equation (1) for calculating the bending stress.
The above represents the worst-case static moment when the platform is fully extended. Comparing the bending stress against the material’s known yield strength gives a factor of safety (FOS) of approximately 2.0 against yielding.
3.5. Motor Selection and Torque Requirements
The lead screw and applied loading can be used to calculate the required torque needed to actuate the system. To account for the worst-case scenario, the longitudinal acceleration will be applied to the total forces acting on the lead screw. The total applied force is the sum of the frictional force and coupling acceleration force [
14]:
From the lead screw used earlier, the efficiency is approximately 0.20 according to industry standards [
15]. To determine an acceptable torque range for the motor, two FOS values of 2.0 and 4.0 are applied to Equation (3) [
15].
A NEMA 34 stepper motor was selected to actuate the system using this range of required torque values. This motor has a holding torque of 8.5 Nm, which falls in the upper range of the torque values for a high FOS on the motor [
16]. A stepper motor is a reliable, strong, and implementable driver for this application. The required RPMs for the actuation to occur within the time constraints defined earlier can be found using Equation (4) with a travel speed of 20.3 mm/s from the 609.6 mm (24 inches) of travel divided by the actuation time of 30 s.
The NEMA 34 stepper motor can achieve the 304.8 RPMs needed to move the platform within the required distance and time. This RPM is one of the key parameters used to develop the controller.
3.6. Control System Architecture
Among various options considered, we selected an Arduino Uno board as the controller due to its relatively low cost, ease of use, intuitive interface, and effectiveness in the prototyping phase of design. As shown in the control block diagram in
Figure 3, two different voltages are required for the assembly. The Arduino and control signals are controlled by 5 volts, and the stepper motor and driver need 24 volts. Given that the system only needs to be in retracted or fully extended modes for sensor deployment, limit switches can detect these positions. The limit switches ensure the positioning is sufficiently accurate and the 0.125-inch positional accuracy is met. Simultaneously, wiring LED lights to indicate to the operator that the system has finished traveling in one direction can fulfill the specification of passive monitoring. A rotary switch is implemented to control the starting and stopping of the motor and its direction rotation, which controls the platform’s direction of travel.
4. Prototype Development and Testing
Using the developed actuation and control system described earlier, this section presents a physical prototype assembly able to be built and tested in a controlled laboratory setting. This system provides validation of the performance of the actuation concepts before integrating into a railcar.
4.1. Mechanical Assembly
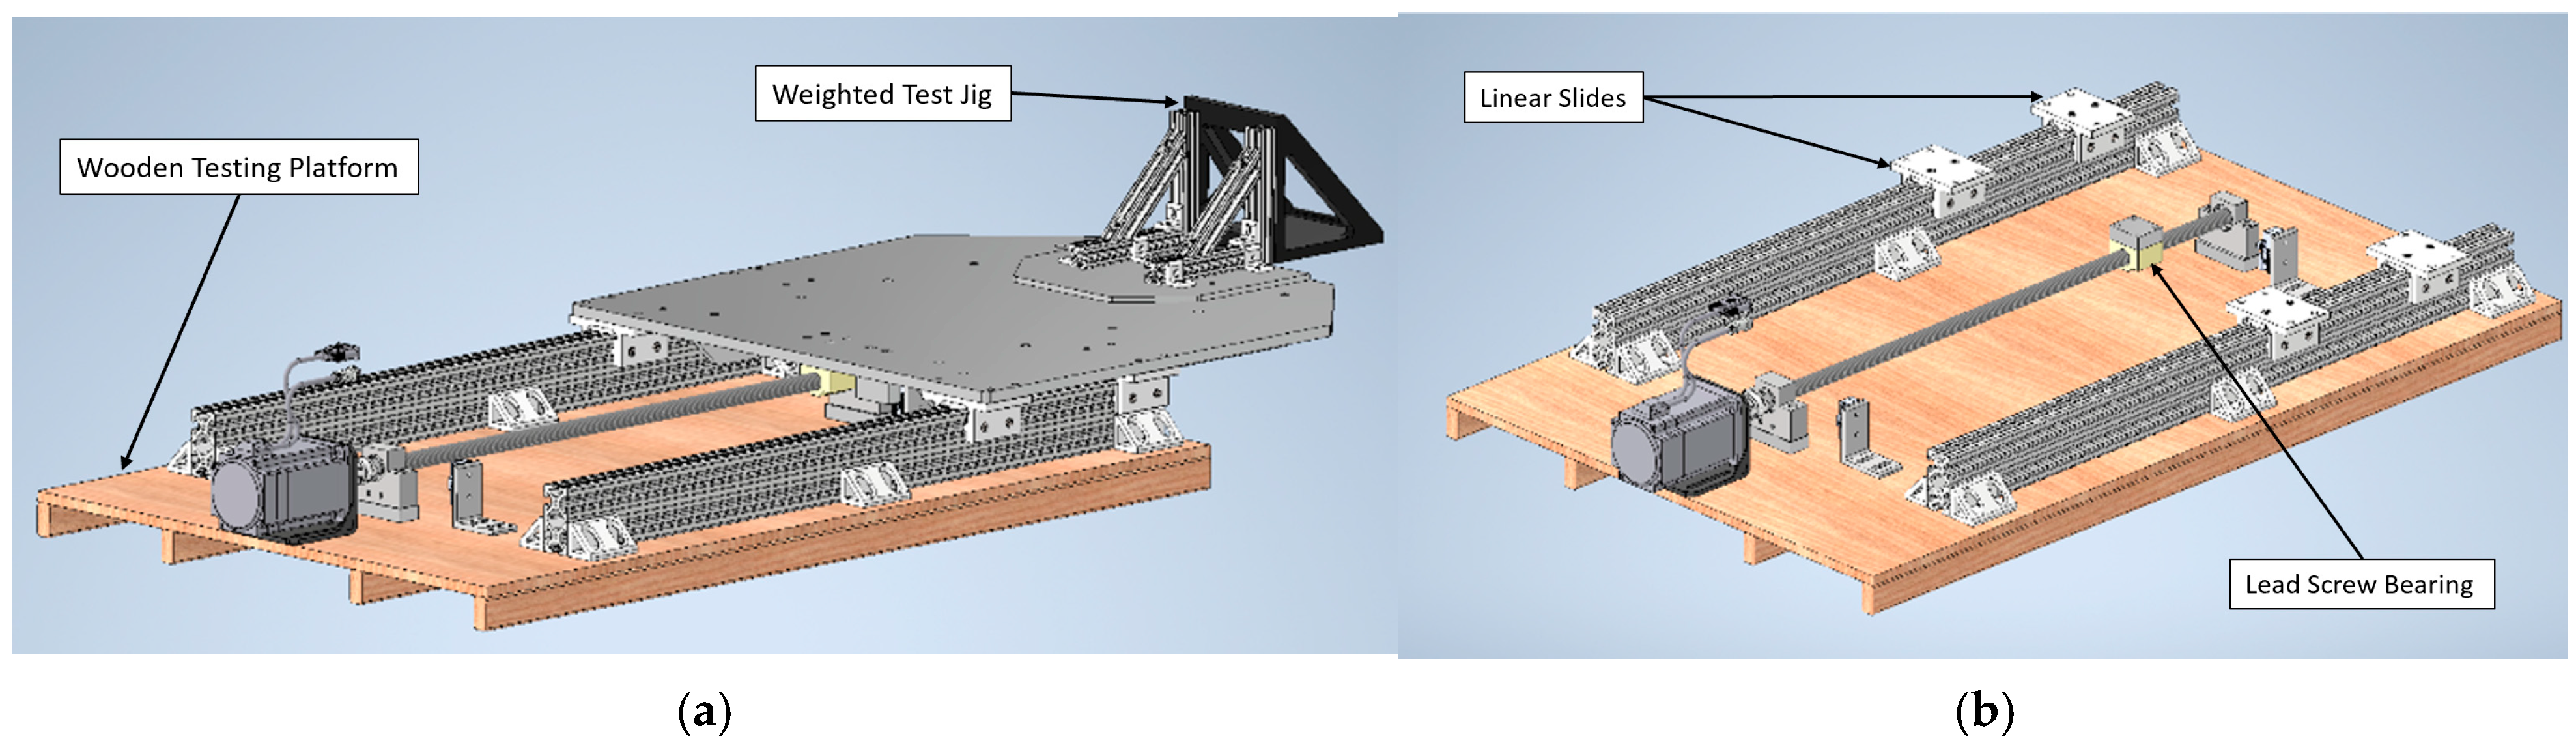
To fully test and validate the theoretical concepts presented by this study, a prototype assembly was designed and fabricated to conduct actuation tests on the control and actuation assemblies. A simple wooden platform, shown in
Figure 4, is used for the laboratory tests to emulate mounting to a railcar. The platform shelf, spacers, and alignment blocks were manufactured from 6061 aluminum. The alignment blocks are critical for ensuring that the stepper motor output shaft is in-line with the lead screw. When a stepper motor and lead screw are not properly aligned, this can lead to extra stress on components, premature wear on the threads, and lower efficiency while operating [
17]. In addition to making sure the axes of both the stepper motor output shaft and the lead screw are properly aligned, a flexible shaft coupling is used to connect them. A flexible coupling is used to compensate for shaft misalignment while still allowing effective torque transmission and accounting for slight axial movement by either shaft [
18].
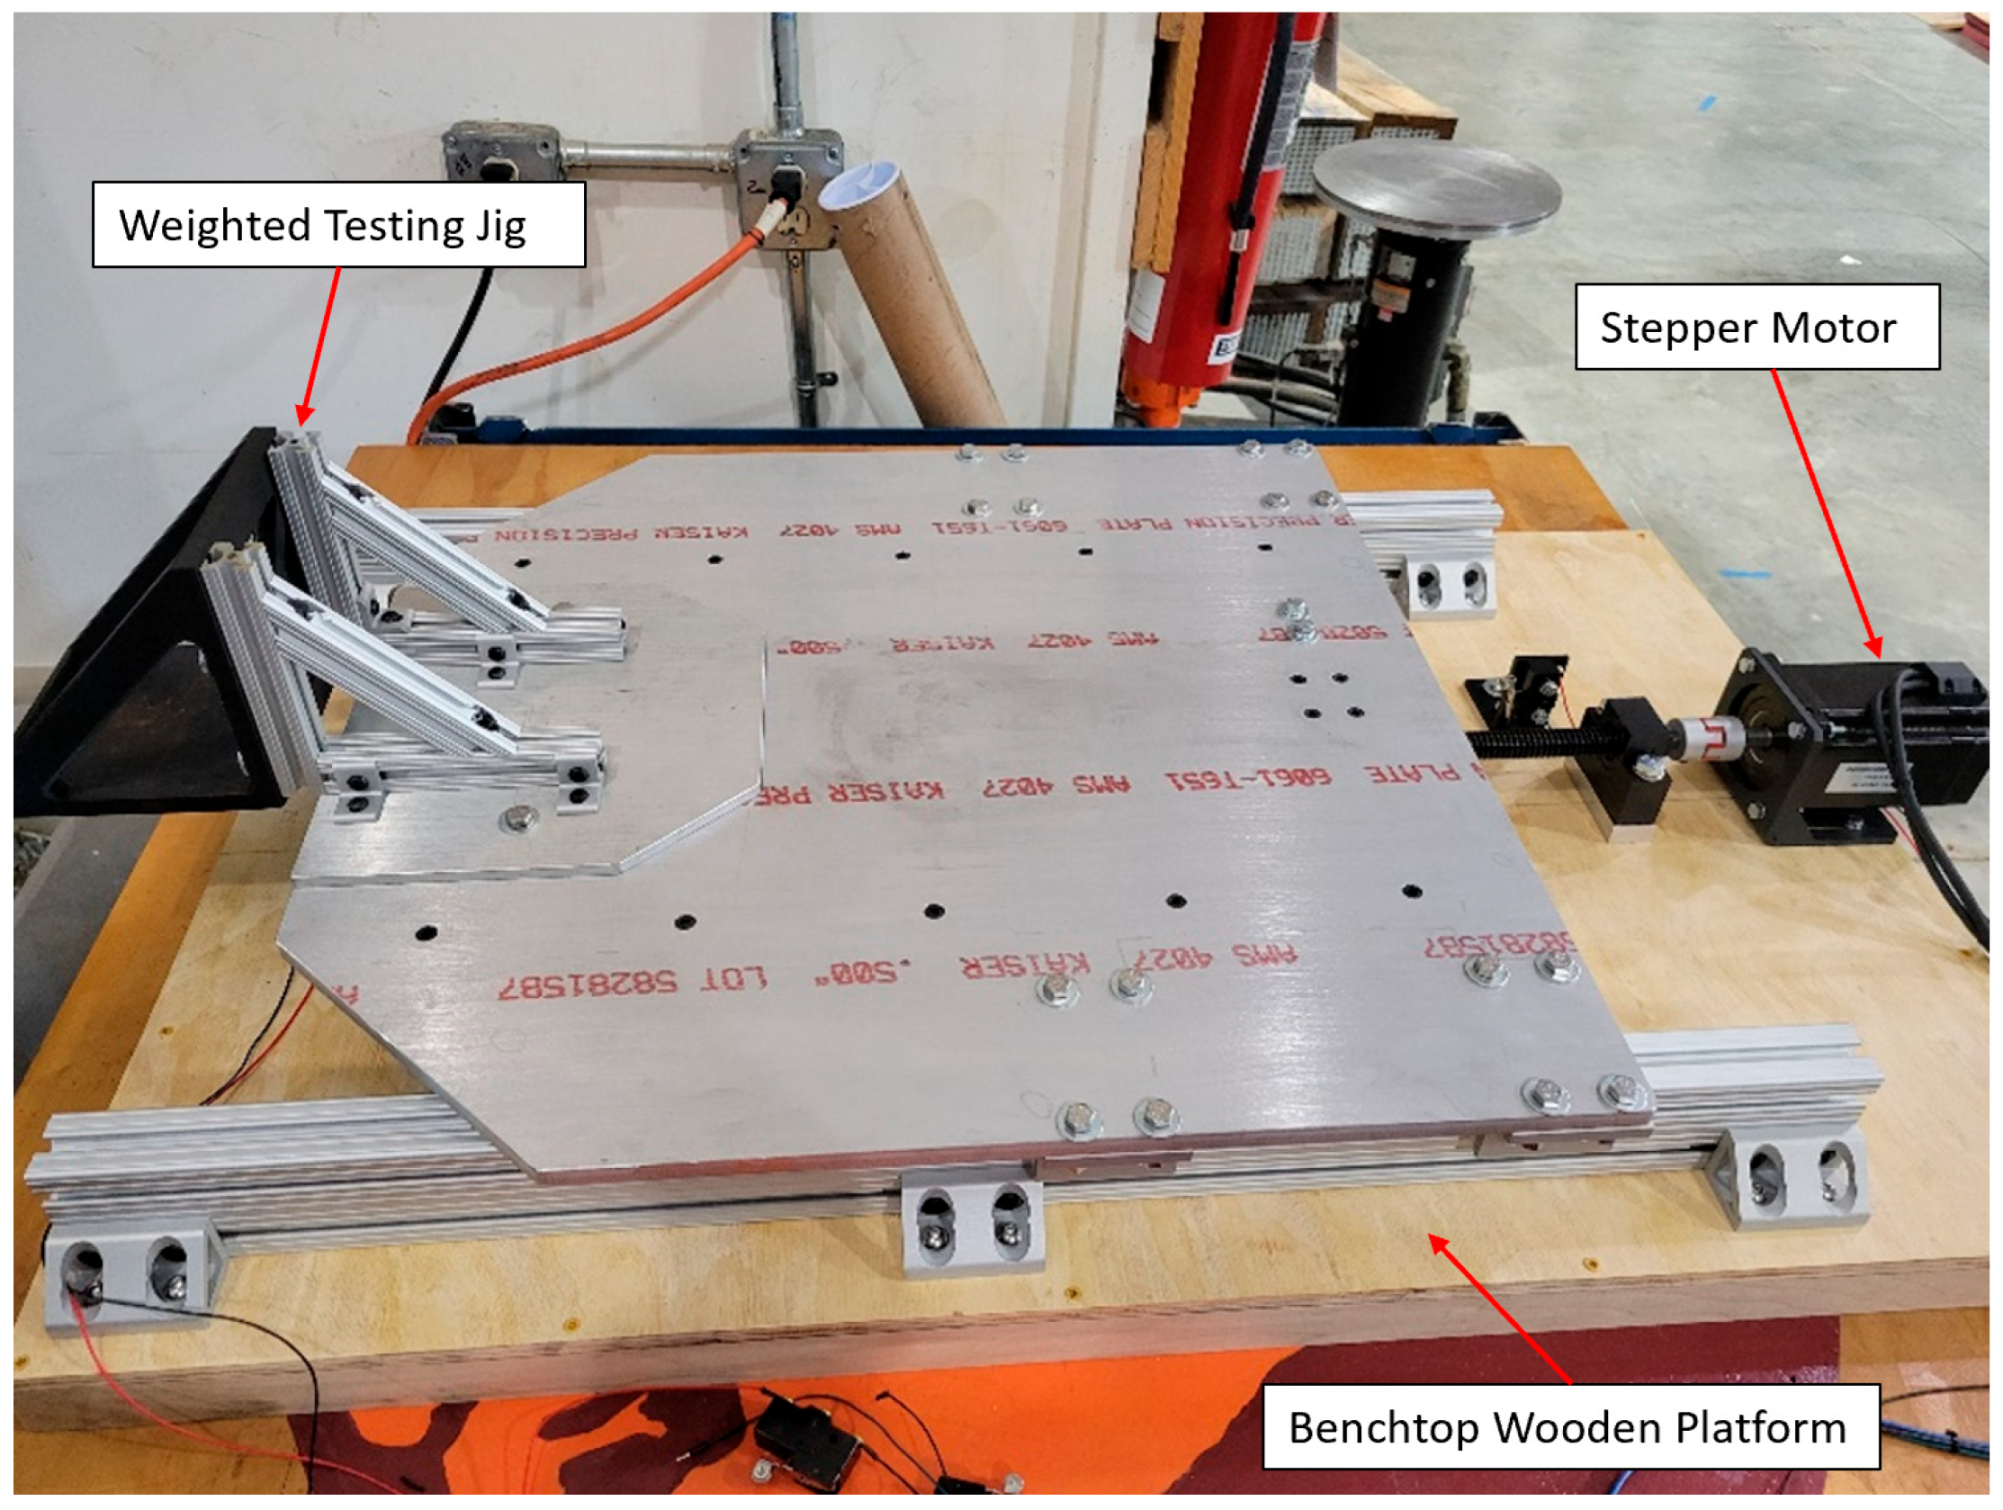
All components were mounted to a wooden test platform using accompanying brackets and hardware. The wooden platform was selected for assembly and laboratory testing. In practice, it will be replaced by the railcar base to which the actuation system is mounted. The fully assembled prototype assembly shown in
Figure 5 adequately represented the actual assembly on board a railcar while allowing the ease of adjustability needed for the laboratory tests. Microswitches were properly positioned at the limits of travel to prevent excessive motion in either direction. Once the platform contacts the limit switches, the motor’s power is disabled, and the actuation stops. The extrusion rails that allow the bearings to slide from the retracted to extended positions in the final assembly have a travel distance of 615.95 mm (24.25 inches), allowing for adequate testing and performance assessment.
4.2. Wiring and Electrical Integration
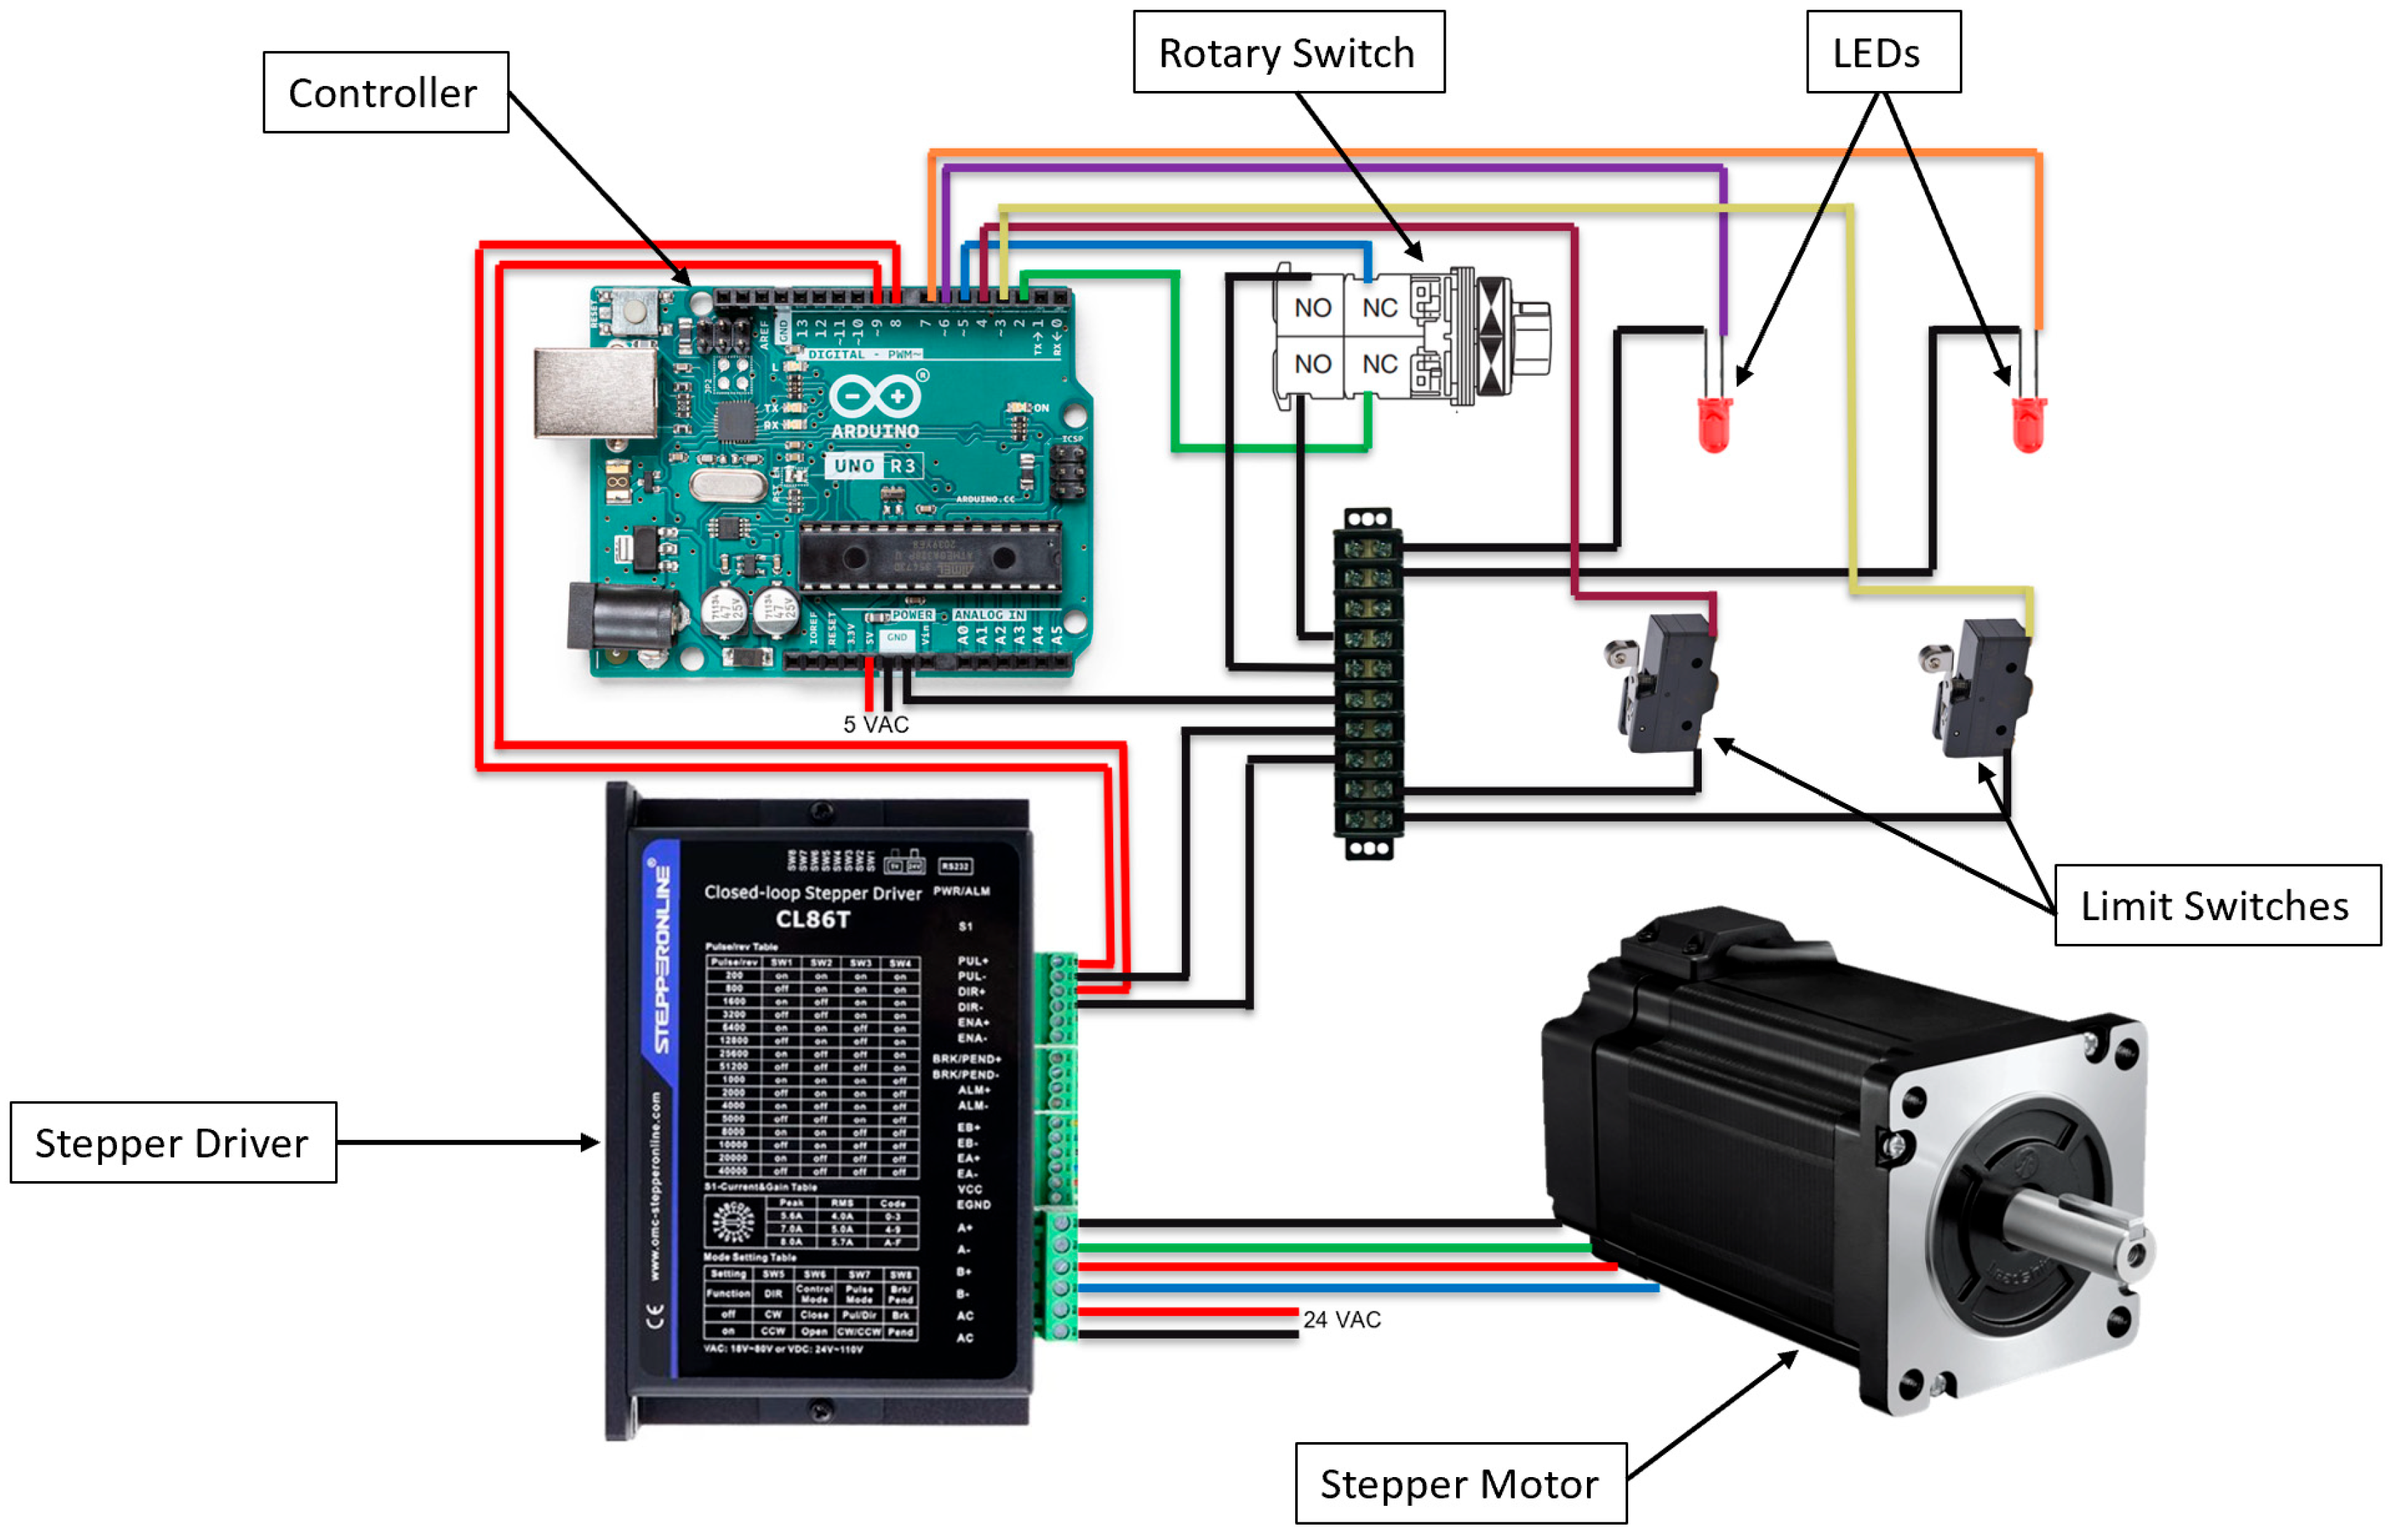
The controls and wiring system were implemented according to the wiring diagram in
Figure 6. An Arduino Uno board was used to send control signals to the stepper driver using 5 V power. The limit switches, rotary knob, and LED indicator lights were wired to the board using pins 2 through 9. The wiring was set up so the limit switches could read them as normally closed (NC). With this arrangement, the circuit through the switch is complete when the limit switch is unpressed. The circuit opens when the switch is pressed, and the Arduino reads no current flow through those pins, preventing any more motion in that direction. The advantage of wiring a limit switch in an NC configuration is that if a wire or switch breaks, the Arduino will cease any travel in that direction, acting as an additional safety measure. The rotary knob is a center spring return switch that allows motion in either direction based on how it is turned. When held, the Arduino reads the circuit and actuates the stepper motor clockwise or counterclockwise. Once the switch is released, it returns to the middle, disconnecting the circuit and ceasing movement. The LED indicator lights are each wired and programmed to turn on when a limit switch is pressed. The indicator light provides a visual alert to the operator that the system can no longer travel in that direction. A 24 V power supply unit (PSU) was connected to the driver through an emergency stop button to provide power to the stepper motor. It is worth noting that the NEMA 34 stepper motor used in this study is also equipped with an encoder, even though it was not used in our design. The simplified control approach we adopted, where only the platform position at the two limits is needed, did not require using the stepper motor’s embedded encoder.
5. Performance Evaluation and Results
Testing of the prototype assembly was completed in the laboratory using 24 V PSU and 5 V DC power supplies that emulate the onboard power of a railcar. Various actuation modes were evaluated to test the system responses to different controlled inputs. Significant testing was conducted to refine the Arduino code and stepper motor controller. After issues involving signal discrepancies were resolved, the prototype underwent a series of tests with weights to mimic the loaded configuration in practice. The tests included extending and retracting. The time to complete each movement was recorded and then used to calculate actual speeds.
5.1. Pulse Delay Analysis
The rotational speed of the stepper motor was calculated by using the timing delay of pulses sent from the Arduino to the stepper driver. These pulses trigger the motor to move one micro-step at a time, controlling the number of pulses per revolution. For the NEMA 34 stepper motor used in this study, the micro-step is adjustable from 1 through 256, which can be used to refine the pulses per revolution needed from 200 to 51,200. The number of pulses per revolution is calculated by multiplying the micro-step by the motor default setting of 200 steps per revolution. These pulses are sent from the Arduino by inputting a pulse delay in microseconds. A smaller delay sends faster pulses to the stepper motor, moving the platform faster. Several test runs were conducted on the system to determine the optimal delay and micro-step setting needed to meet the system requirements mentioned earlier.
Applying these values to Equation (5) allows for calculating the theoretical RPM of the motor [
19].
Combining the calculated RPM with the travel distance of 615.95 mm (24.25 inches) and the 4 mm pitch of the lead screw provides a predicted actuation time:
Conducting preliminary testing using a micro-step of 8 and various pulse delays, a discrepancy was found between the theoretical and observed actuation times. As shown in
Table 2, the observed time was consistently more than 2 times higher than the predicted time based on the input delay. Using the error, the actual speed of the motor and pulse delay received by the stepper motor could be calculated by reversing Equations (5) and (6).
As the motor’s speed increases, the error also increases. Other trials were performed by varying the micro-steps; however, the same error percentages were still observed. By eliminating potential factors such as this, it was concluded that the system’s error was related to the input delay. The signal being sent by the Arduino was two times slower than what the stepper motor was receiving.
5.2. Control Signal Optimization
Initially, the code sent pulses to the stepper motor and read the limit switches, rotary switch, and LED statuses using many digitalWrite() and digitalRead() commands in loops. While it takes the Arduino only microseconds to complete each function, it requires the loops to run thousands of times, causing processing delays. These extra operating delays in the Arduino code added an unacceptable amount of delay over time. To help mitigate this error, the code was converted to Direct Port Manipulation (DPM). This method directly sets and clears pins by using bits and is roughly 30 times faster than the digital commands [
20].
After implementing DPM into the code, the system response became much faster; however, this revealed a second flaw in the code. Since the Arduino was sending very fast signals, the stepper motor did not always correctly receive them at the start of an actuation, causing it to skip steps and not actuate properly. The implementation of DPM yielded an 87.19% decrease in error between the predicted and observed times, as included in
Table 3. However, the missed steps at the beginning of travel still contributed to a 35.37% error.
5.3. Acceleration Implementation
The best way to mitigate the misread signal problem at the start of actuation was to add a ramp-up acceleration into the signal pulse. The ramp-up allows the stepper motor to start motion at a slower speed to overcome the initial static friction’s slowing effect. Then, it can speed up to a faster RPM without missing steps. Keeping the same target RPM of 187.5 and an input pulse delay of 200 µs, a new predicted time for the total actuation can be estimated by accounting for the time for acceleration. The minimum pulse of 200 µs controls the speed for most of the actuation. The maximum pulse of 5000 µs is the starting speed, which is set to be much slower than the target speed. For every step that is completed, the pulse delay being sent to the motor is decreased by the acceleration rate of 10 µs/step. This acceleration rate was determined through preliminary testing to optimize the overall system response to prevent misread signals by the stepper motor during deployment. Equation (7) uses these values to solve the number of steps needed to accelerate to the maximum speed.
Since every step during the acceleration phase is faster than the step before, an acceleration time can be estimated using Equation (8). Assuming the acceleration is linear, the time to accelerate is found by multiplying the number of acceleration steps by the average acceleration pulse per step.
Factoring in the acceleration time with the remaining travel time at full speed, the new predicted time to complete one actuation is 50.52 s.
Table 4 compares the improved system code to the previous versions, showing the error decreased by 29.64% after the implementation of acceleration time.
The actuation speed testing was redone using the optimized code to compare the observed times to the predicted times. Additionally, to aid in the stepper motor’s ability to ready the signals, the micro-step setting was reduced to 4, equating to 800 pulses per revolution. Reducing the micro-step setting decreases the precision of the motor, but it can increase output torque and allow longer pulse delays to be used to achieve the same speeds as before [
21]. Since the motor was occasionally struggling with faster pulses, this change was able to help it process the signals it was receiving.
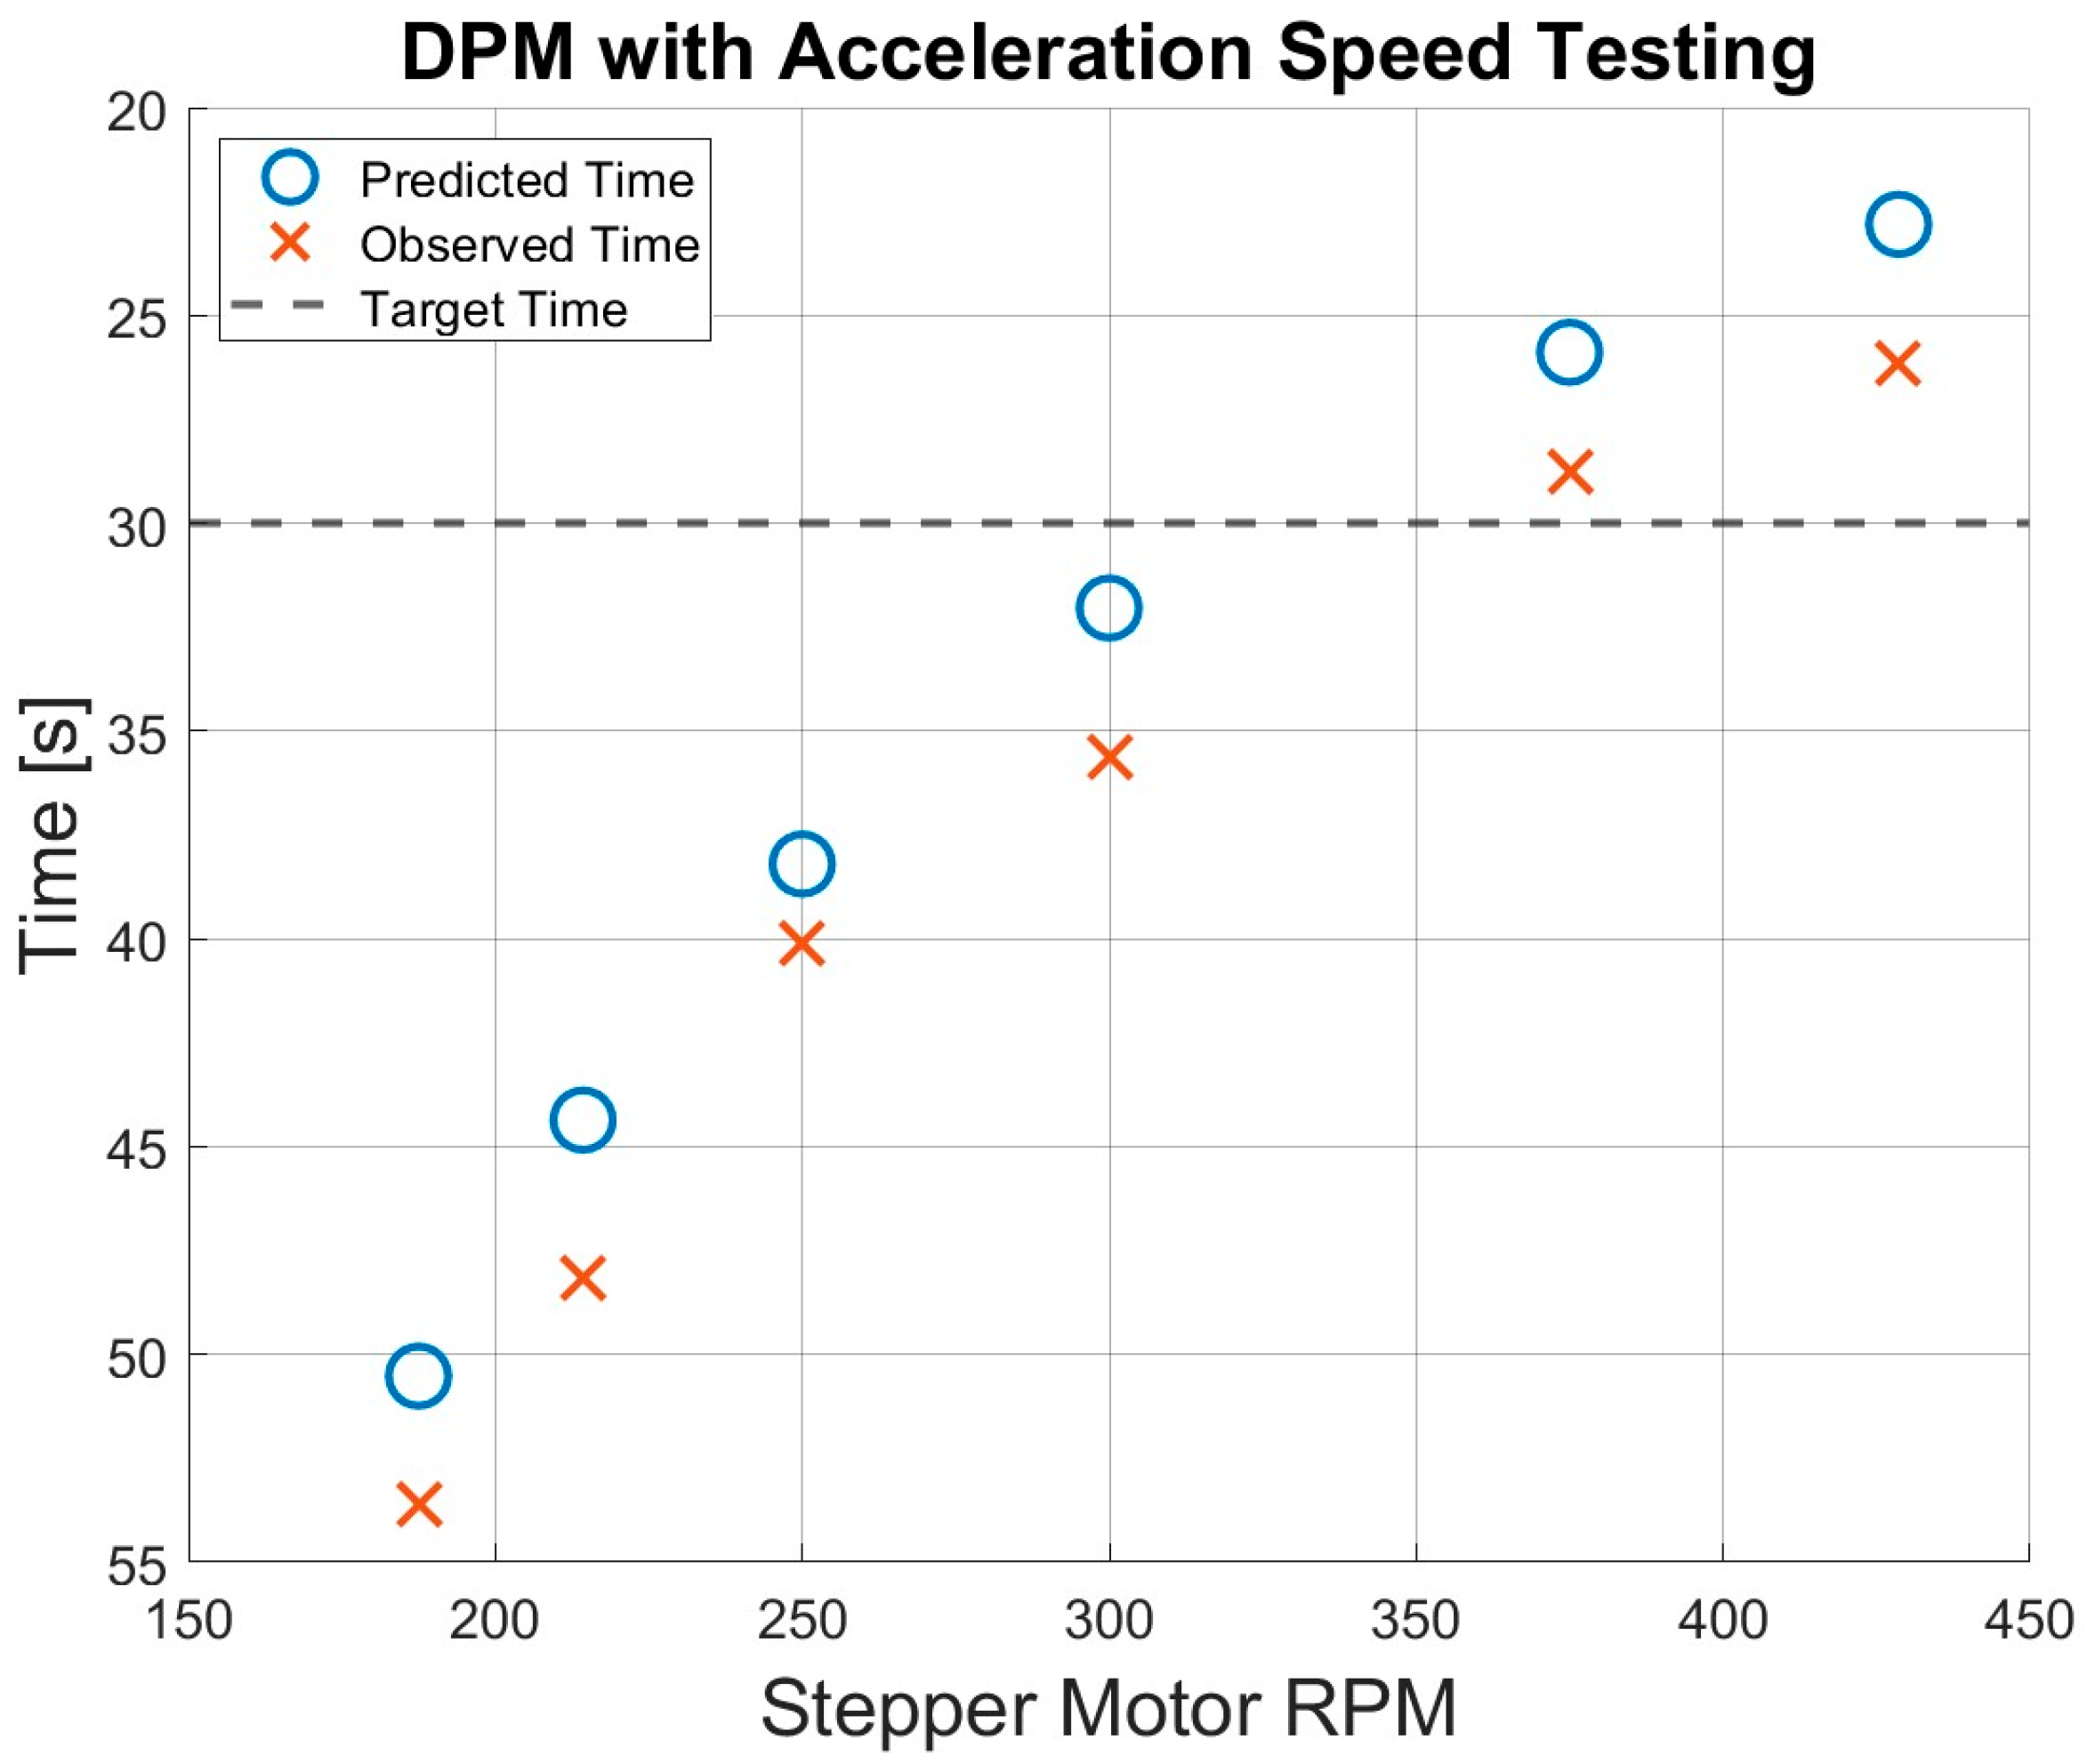
Figure 7 demonstrates the overall performance improvements after implementing acceleration into the code. As expected, the error between the predicted time and the observed time still increases as maximum speed increases; however, the target time of 30 s was met by running the stepper motor at 375 RPM and higher. It was observed that at RPMs higher than 428.6, the motor struggled to overcome the initial resistance again. One can reason that further adjustments of the acceleration time and micro-step settings may allow for even higher RPMs to be achieved. However, such adjustments were unnecessary because the target actuation time was already met.
5.4. Weighted Testing
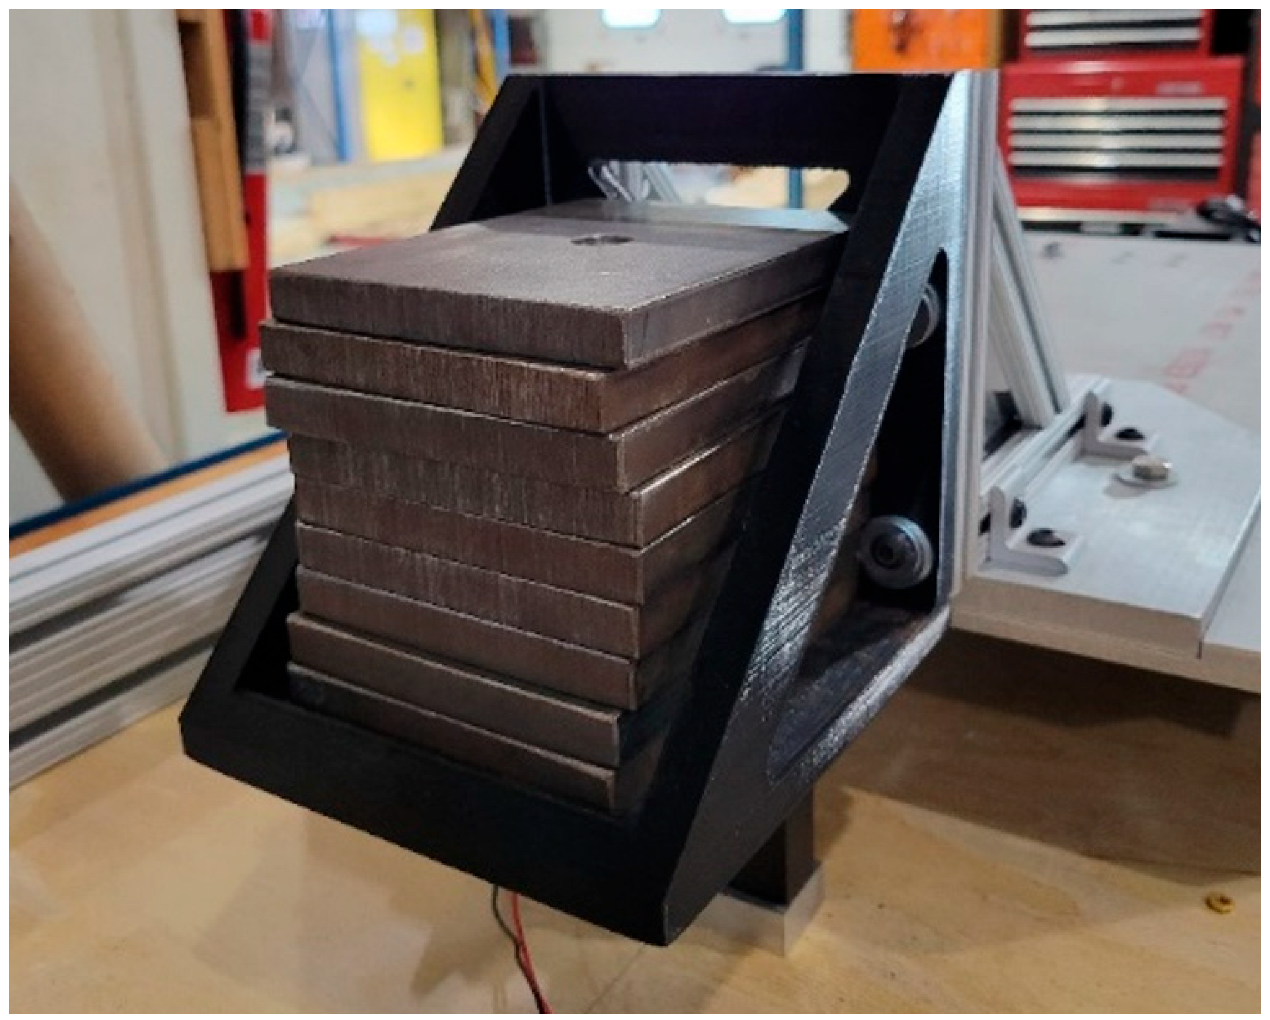
Additional testing was conducted by adding extra weight as an overhanging load to emulate the response of the actuation mechanism in maximum loading conditions. As shown in
Figure 8, various weighted plates were added to hang off the end of the shelf to simulate the worst case of loading that could be applied to the stepper motor and lead screw.
The same system inputs were given to the stepper motor as in the fastest unweighted test from before. A minimum pulse of 175 µs, a maximum pulse of 5000 µs, an acceleration rate of 10 µs/step, and a micro-step setting of 4. Actuations from 0 to 30.86 lb. shown in
Figure 9a revealed a consistent error percentage of around 14.94% between the observed time and the predicted time of 22.81 s until around 20 lbs. At this point, the stepper motor began to experience some issues when retracting from the fully extended position but still performed mostly well once it overcame the initial resistance. An iterative process with different pulse delays and accelerations was conducted to assess the system performance in various actuation and loading conditions. To counteract the retracting problems, the minimum pulse was increased to 200 µs, and the acceleration rate was decreased to 5 µs/step. In doing so, the predicted time of actuation was lowered to 27.13 s, which is closer to the target time of 30 s but allows the motor to output more torque in extreme conditions. Running the refined test, the system could fully actuate without issues, starting from the fully extended position, as shown in
Figure 9b. This more optimized version of step inputs reduced the error percentage between the predicted and observed time to drop from 14.94% to 8.70% while still meeting the actuation time requirement.
6. Results and Discussion
This section analyzes the performance results and key limitations of the prototype assembly that may affect the implementation of the system into a real-world environment.
6.1. Achieved Project Requirements
The prototype testing results validated the actuation and control concepts proposed in this study while highlighting opportunities for refinement in future studies. Through iterative design and testing, the prototype met the following project requirements:
Designed within overall width and height size constraints;
Achieved target actuation time of 30 s;
Met deployment tolerance of 3.175 mm (0.125 inches);
Facilitated passive monitoring with LED indicators;
Designed to withstand lateral and vertical accelerations of 0.25 g;
Designed to withstand longitudinal accelerations of 2.5 g.
Overall, the prototype performance demonstrated a successful design that met the requirements in the mechanical, structural, and control system areas. The final width of the prototype was 673.1 mm (26.5 inches), within the specified 685.8 mm (27 inches). The height was able to be minimized from the specified 558.8 mm (22 inches) to a low profile of 152.4 mm (6 inches), leaving adequate room on top of the shelf for mounting a variety of sensor equipment. Using the t-slot extrusion rails and bearings, the prototype achieved a travel distance of 615.95 mm (24.25 inches), mimicking a real-world deployment scenario. Using microswitches to define travel limits, the assembly could return to the same position each time it was actuated and trigger the indicator LED lights for the operator to passively monitor the system position with intuitive manual control. Testing the system with a high, overhanging load ensured that the torque capability of the lead screw and stepper motor was suitable for anticipated loading conditions. The Arduino control system allowed for quick and effective design iterations to be implemented, particularly the shift to DPM and the addition of a ramp acceleration to the system motion, which met the target actuation time of 30 s.
6.2. Current System Limitations
As a prototype control system, the Arduino performed as required for this study; however, there are areas that could be improved upon to give more control and feedback on the state of the system. The current setup of limit switches provides no feedback on the intermediate position of the platform. If such information is needed, one can use the motor’s encoder to provide the position of the platform at all states, not just to travel limits. The open-loop type control system limitations were highlighted during the assembly testing. When the motor struggled to move by misreading the control signals or having insufficient torque, there was no additional indication to the operator to release the rotary switch other than auditory and visual cues from the motor. Since the testing took place in a controlled lab, the environmental conditions in this study, such as vibrations, dirt, and temperature, are not comparable to those faced by a train in the field. These environmental factors were unable to be tested in this study but should be considered in the future to assess their influence on motor performance and system response. Another small limitation observed during testing was a slight kickback by the stepper motor during motion due to the more flexible mounting on the wooden surface. This motion could potentially cause unusual wear on the lead screw and stepper motor as well as cause small alignment issues. The effects of the kickback appeared negligible; however, they could become an issue as the assembly performs more actuation cycles. Long-term wear testing on the lead screw and bearings was not able to be performed in this study but would provide valuable estimations on the life of the system. With the current benchtop prototype, the lateral and vertical force resistances were not able to be validated experimentally; however, the system is designed to withstand the expected forces.
7. Summary and Future Work
The design and implementation of the actuation system for a railcar-mounted sensor platform were described in detail. The platform is intended for retracting and stowing sensitive inspection systems used onboard test cars for railroad inspection. The platform includes a lead screw mechanism operated by a stepper motor. The controller uses an Arduino Uno that allows ease of control and implementation.
The strength requirements for the drive mechanisms and structural components were calculated to achieve a design factor of two or higher. Once built, the actuation platform was tested under various conditions to ensure it could operate at the required retraction and stowing of onboard sensors. The tests were designed to emulate the actual use of the platform in practice, including in loaded configurations. The tests were valuable in highlighting deficiencies and implementing improvements to resolve them. One such deficiency proved to be the slower-than-expected actuation speed, which was caused by errors in generating the stepper motor pulse delay. Once corrected, the actuation system operated according to the design specifications.
The study identified a few areas for future improvements. Since the stepper motor is equipped with a built-in encoder, it can provide real-time position feedback to the operator, which could improve the platform’s operation. Another improvement that could be made to the control system is to experiment with PID control or a closed-loop feedback setup. Such control enhancements would strengthen the overall system architecture and performance.
The developed prototype system offers insight into how this can be implemented in practice. It provides a framework for enhancing onboard automated track inspection equipment. With further refinement, the platform could be deployed on existing trains to increase the data collection frequency, ultimately contributing to a safer rail network.
The next phase of testing can also be set up to emulate the dynamic impacts, vibrations, and environmental conditions experienced in a railcar. Such tests can be carried out onboard railroad test cars or Hyrail trucks, which we could not access during this study.


