4.1. Simulation Design Results
Figure 4 and
Figure 5 are the simulation results of the A-type transducer.
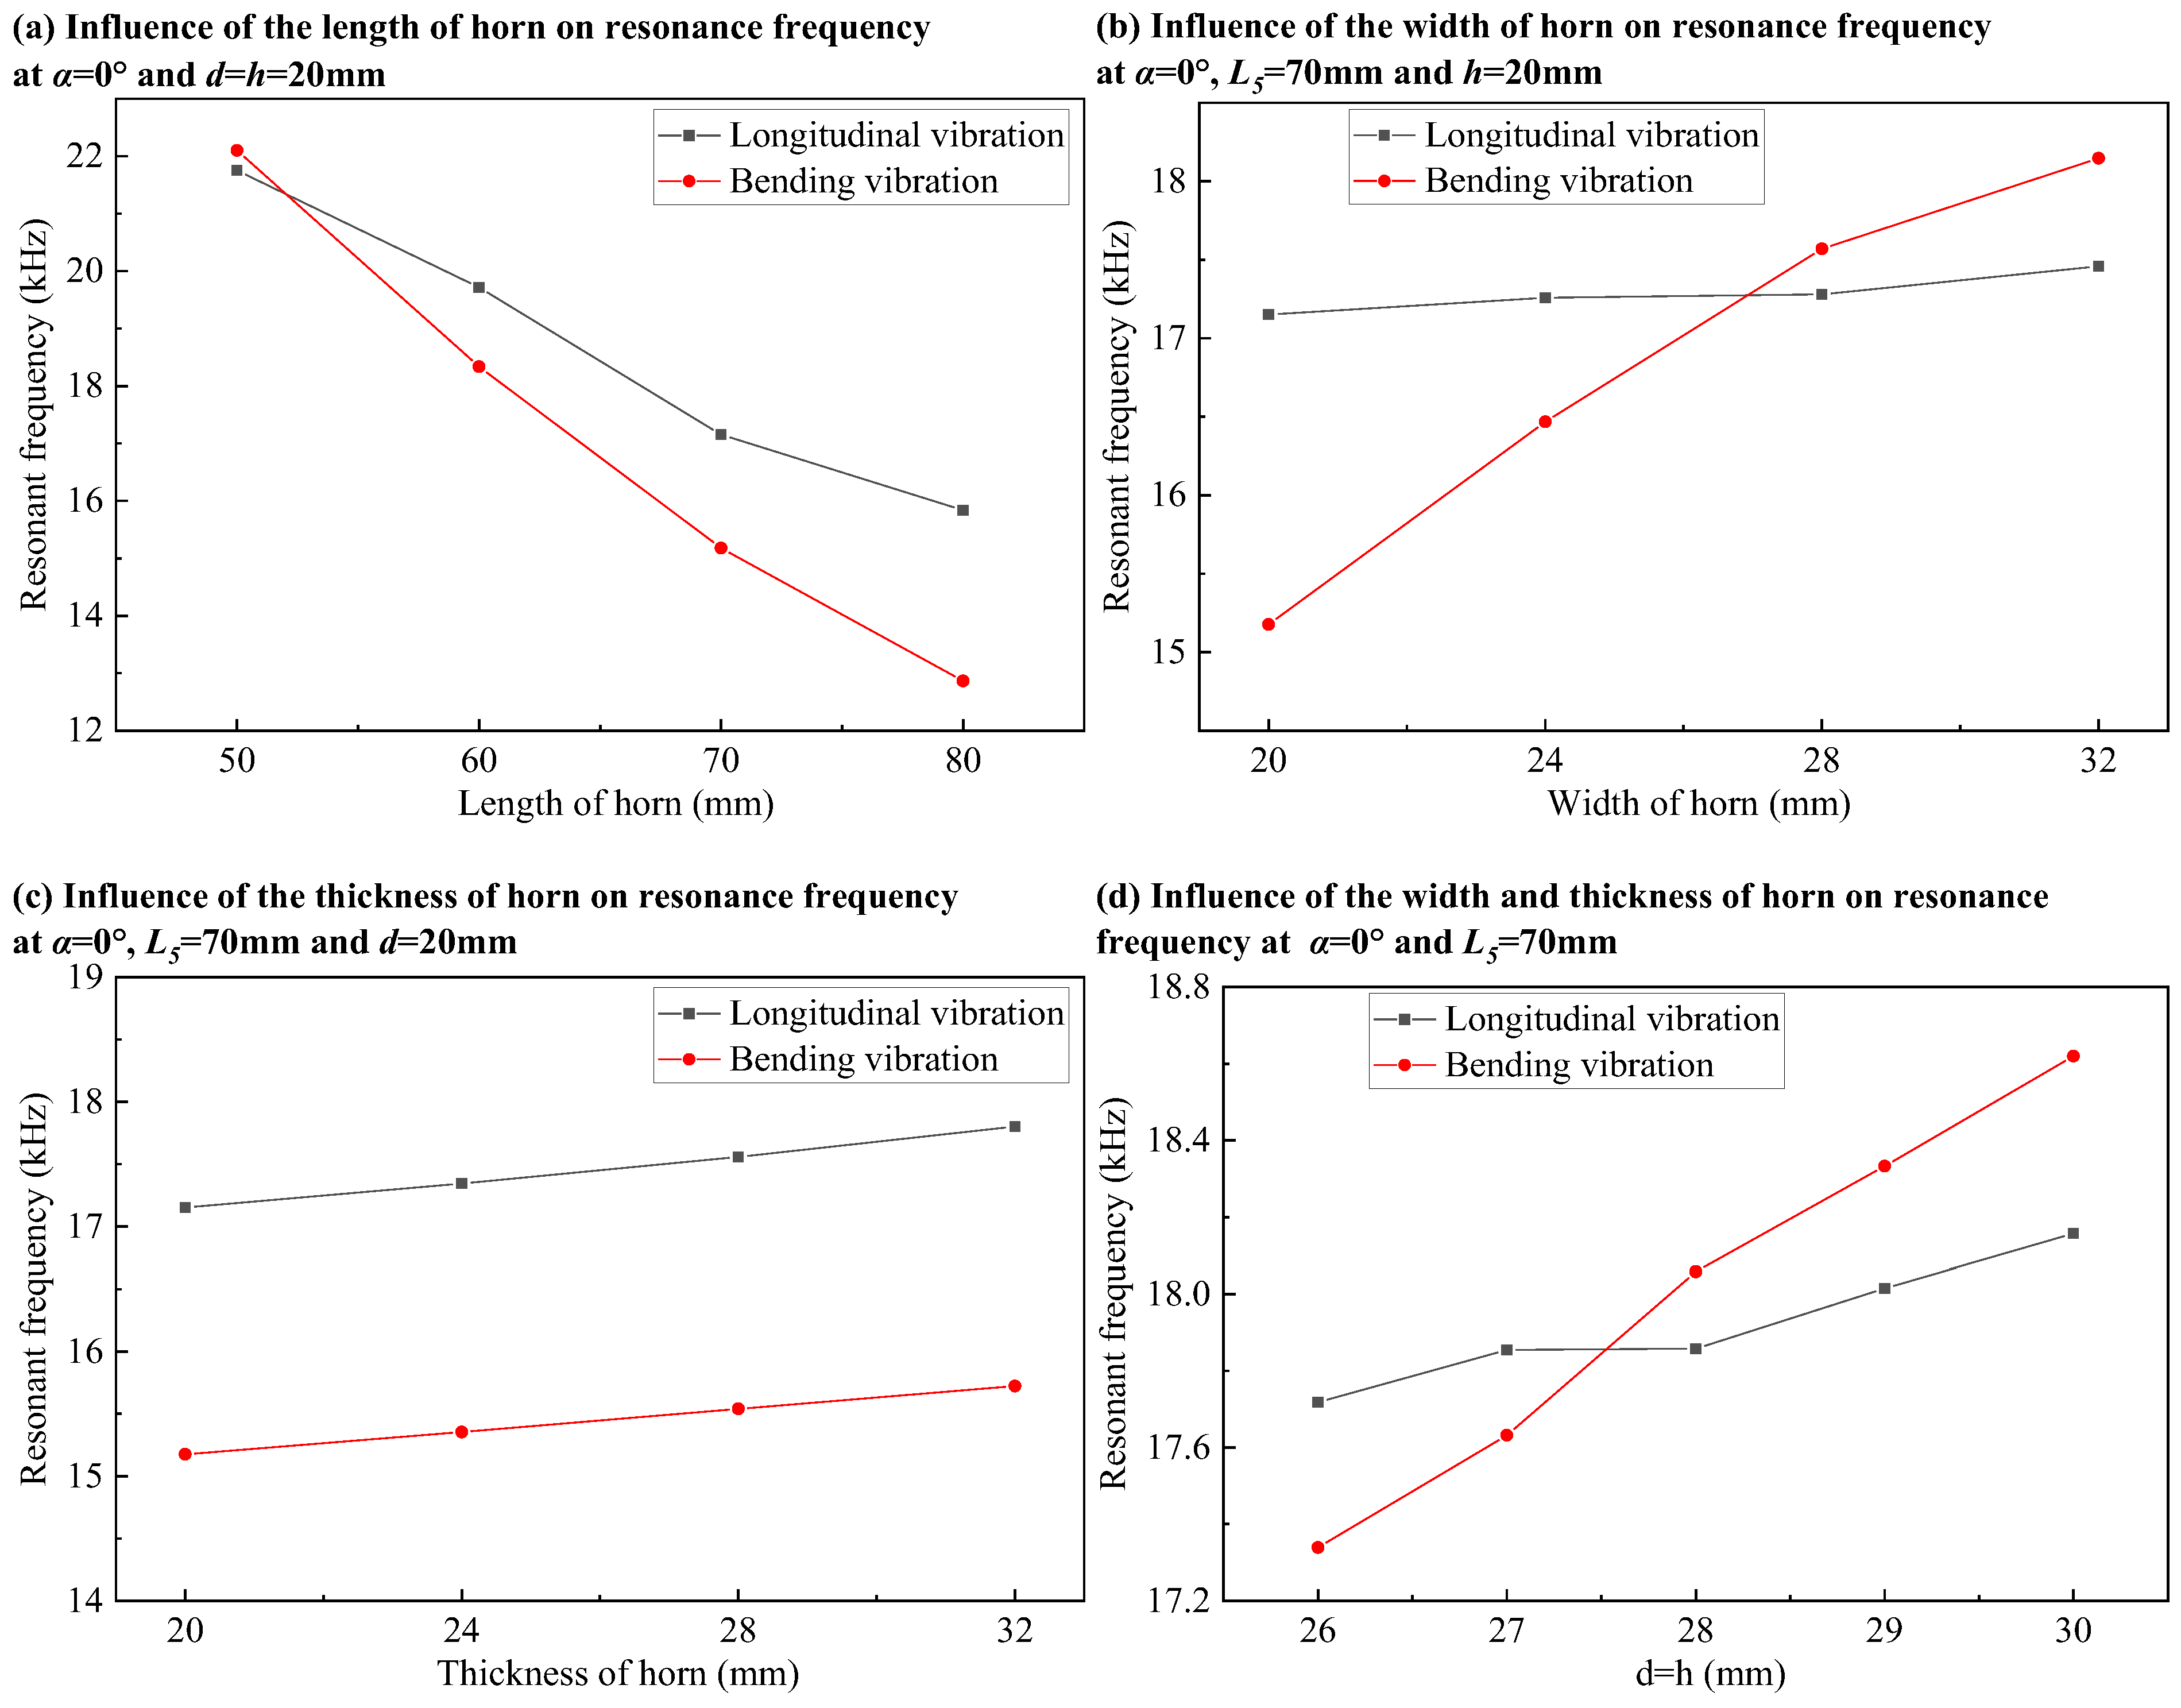
Figure 4 shows the influence of structural dimensions of the A-type transducer on the resonance frequency. The initial section size is estimated to be
according to the required stiffness and size requirements of the horn, and then the influence of the length of horn
on the resonance frequency of longitudinal vibration and bending vibration is analyzed. As can be seen from
Figure 4a, with the shortening of the length of horn, the resonant frequencies of the bending vibration and longitudinal vibration increase, and the frequency of the bending vibration increases faster so that the resonant frequencies of the bending vibration and longitudinal vibration can be equal. In order to ensure that the horn can extend out of the side of the transducer after bending, and at the same time consider the influence of the length of horn on the stiffness,
is determined.
Based on obtaining the length of the horn, the influence of the horn’s width d on the resonance frequencies of longitudinal and bending vibrations is investigated. As shown in
Figure 4b, as the horn’s width increases, the resonant frequency of the bending vibration rises significantly, whereas the resonant frequency of the longitudinal vibration increases only slightly. Consequently, by adjusting the horn’s width, the resonant frequencies of the bending and longitudinal vibrations can be brought closer together.
On the basis of obtaining the length of the horn, the influence of the thickness of horn h on the resonance frequency of longitudinal vibration and bending vibration is studied. It can be found from
Figure 4c that with the increase in thickness of the horn, the resonant frequencies of the bending vibration and longitudinal vibration have the same changing trend, so it is impossible to make the resonant frequencies of the bending vibration and longitudinal vibration close by changing the horn thickness. The horn thickness has little influence on the resonant frequency, but it has great influence on the stiffness of the horn, so that the thickness and width of the horn are equal in order to meet the requirements of frequency matching and stiffness at the same time. In
Figure 4d, with the increase in the section size d and h of the horn, the resonance frequencies of the bending vibration and longitudinal vibration increase, and the resonance frequencies of the bending vibration increase faster so that the resonance frequencies of the bending vibration and longitudinal vibration can be equal.
The influence of the length, width, and thickness of the horn in
Figure 4 on the resonant frequency of the bending vibration and longitudinal vibration corresponds to Equations (9) and (10). Equations (9) and (10) are obtained under the condition of a pure bending beam. From Equations (9) and (10), it can be seen that the angular frequency of longitudinal vibration is inversely proportional to the length of the horn, and the angular frequency of the bending vibration is inversely proportional to the square of the length of the horn. In
Figure 4a, as the length of the horn decreases, the resonant frequency of the bending vibration increases faster than that of the longitudinal vibration. Equation (9) is independent of the width of the horn, and the angular frequency of the bending vibration in Equation (10) is proportional to the width of the horn. In
Figure 4b, the resonant frequency of the longitudinal vibration does not change much with the increase in the width of the horn, while the resonant frequency of the bending vibration increases with the increase in the width of the horn. Equations (9) and (10) are independent of the thickness of the horn. In
Figure 4c, the resonant frequencies of the longitudinal vibration and bending vibration do not change much with the increase in the thickness of the horn.
The transducer with and is selected as an elliptical vibration ultrasonic transducer with a straight horn. The resonance frequencies of the longitudinal vibration and bending vibration are 17.858 kHz and 18.058 kHz, respectively. After bending the horn for a certain angle, an elliptical vibration ultrasonic transducer with a bending horn can be obtained. Considering that the difference between 17.858 kHz and 18.058 kHz is only 0.2 kHz, and the resonant frequency of the transducer will change after the horn is bent to a certain angle, it is only required that the resonant frequencies of the longitudinal vibration and bending vibration are close, but not equal.
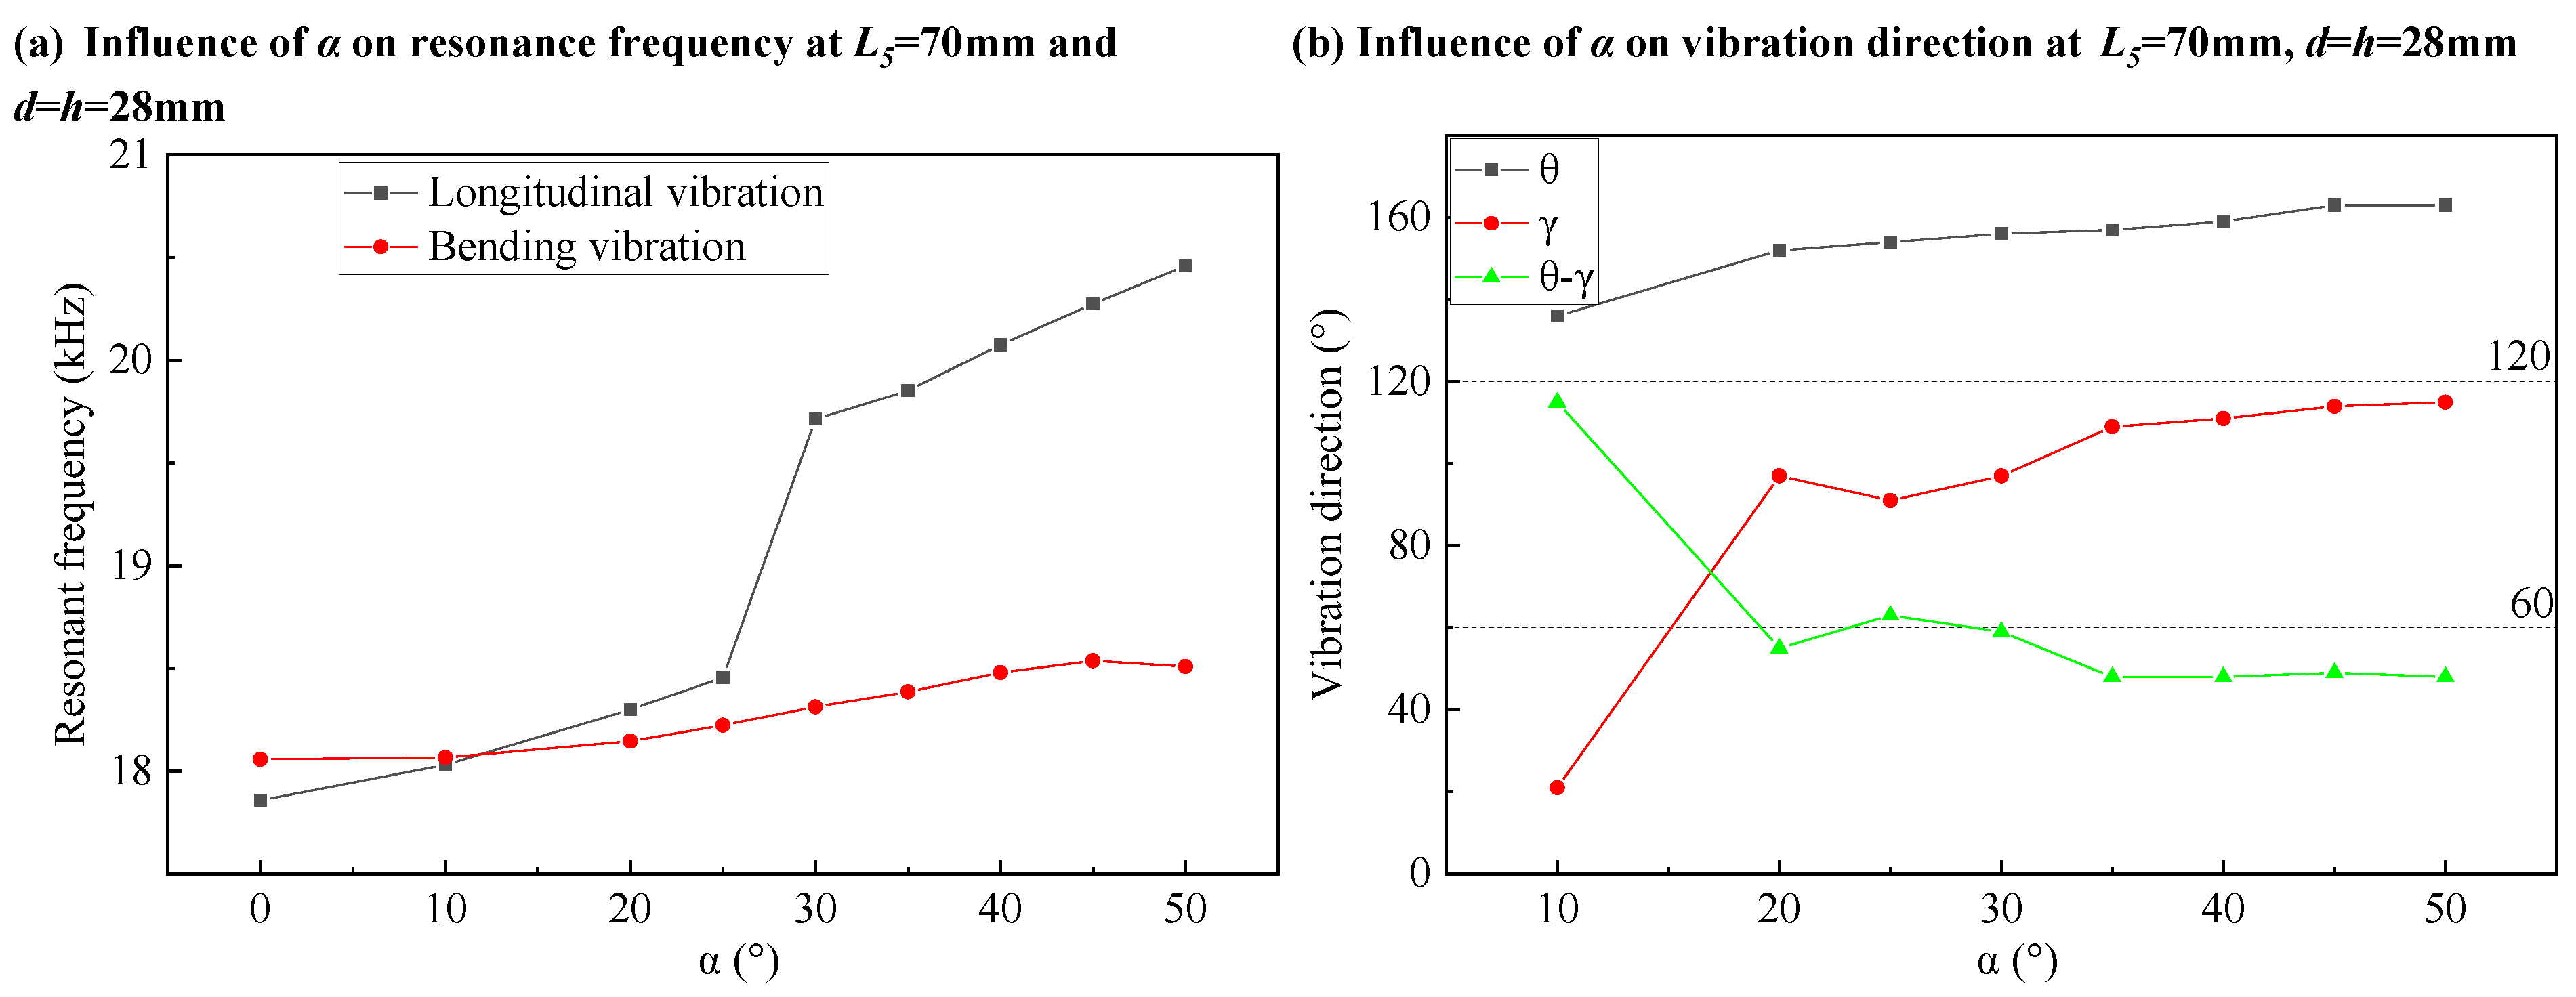
Figure 5 shows the influence of the bending angle α of the horn on the resonance characteristics of the transducer.
Figure 5a studies the influence of the bending angle α on the resonance frequency. In
Figure 5a, when α increases from 0° to 50°, the resonant frequency of the bending vibration increases slowly. The resonant frequency of the longitudinal vibration increases slowly with α increasing from 0° to 25°, and increases rapidly with α increasing from 25° to 50°. In the case of small α, the influence of the bending angle α of the horn on the frequency matching can be ignored, and in the case of large α, it is not conducive to the frequency matching.
Figure 5b studies the influence of the bending angle α on the vibration direction. In
Figure 5b, when α increases from 10° to 50°, the angle θ of the vibration direction of the bending vibration slowly increases. The angle γ of the vibration direction of the longitudinal vibration increases rapidly with α increasing from 10° to 20°, and slowly increases with α increasing from 20° to 50°.
The bending of the horn causes the asymmetry of the structure, which makes the vibration directions of the bending vibration and longitudinal vibration incline to the bending direction of the horn. Because of the different inclination degrees of the vibration directions of the bending vibration and longitudinal vibration, the vibration directions of the bending vibration and longitudinal vibration are not vertical. Considering the influence of the bending angle α of the horn on the resonant frequency and vibration direction of the transducer,
is determined as the appropriate bending angle of the horn. After the optimization design, the structural parameters of the A-type transducer satisfying
Figure 3a are shown in
Table 4.
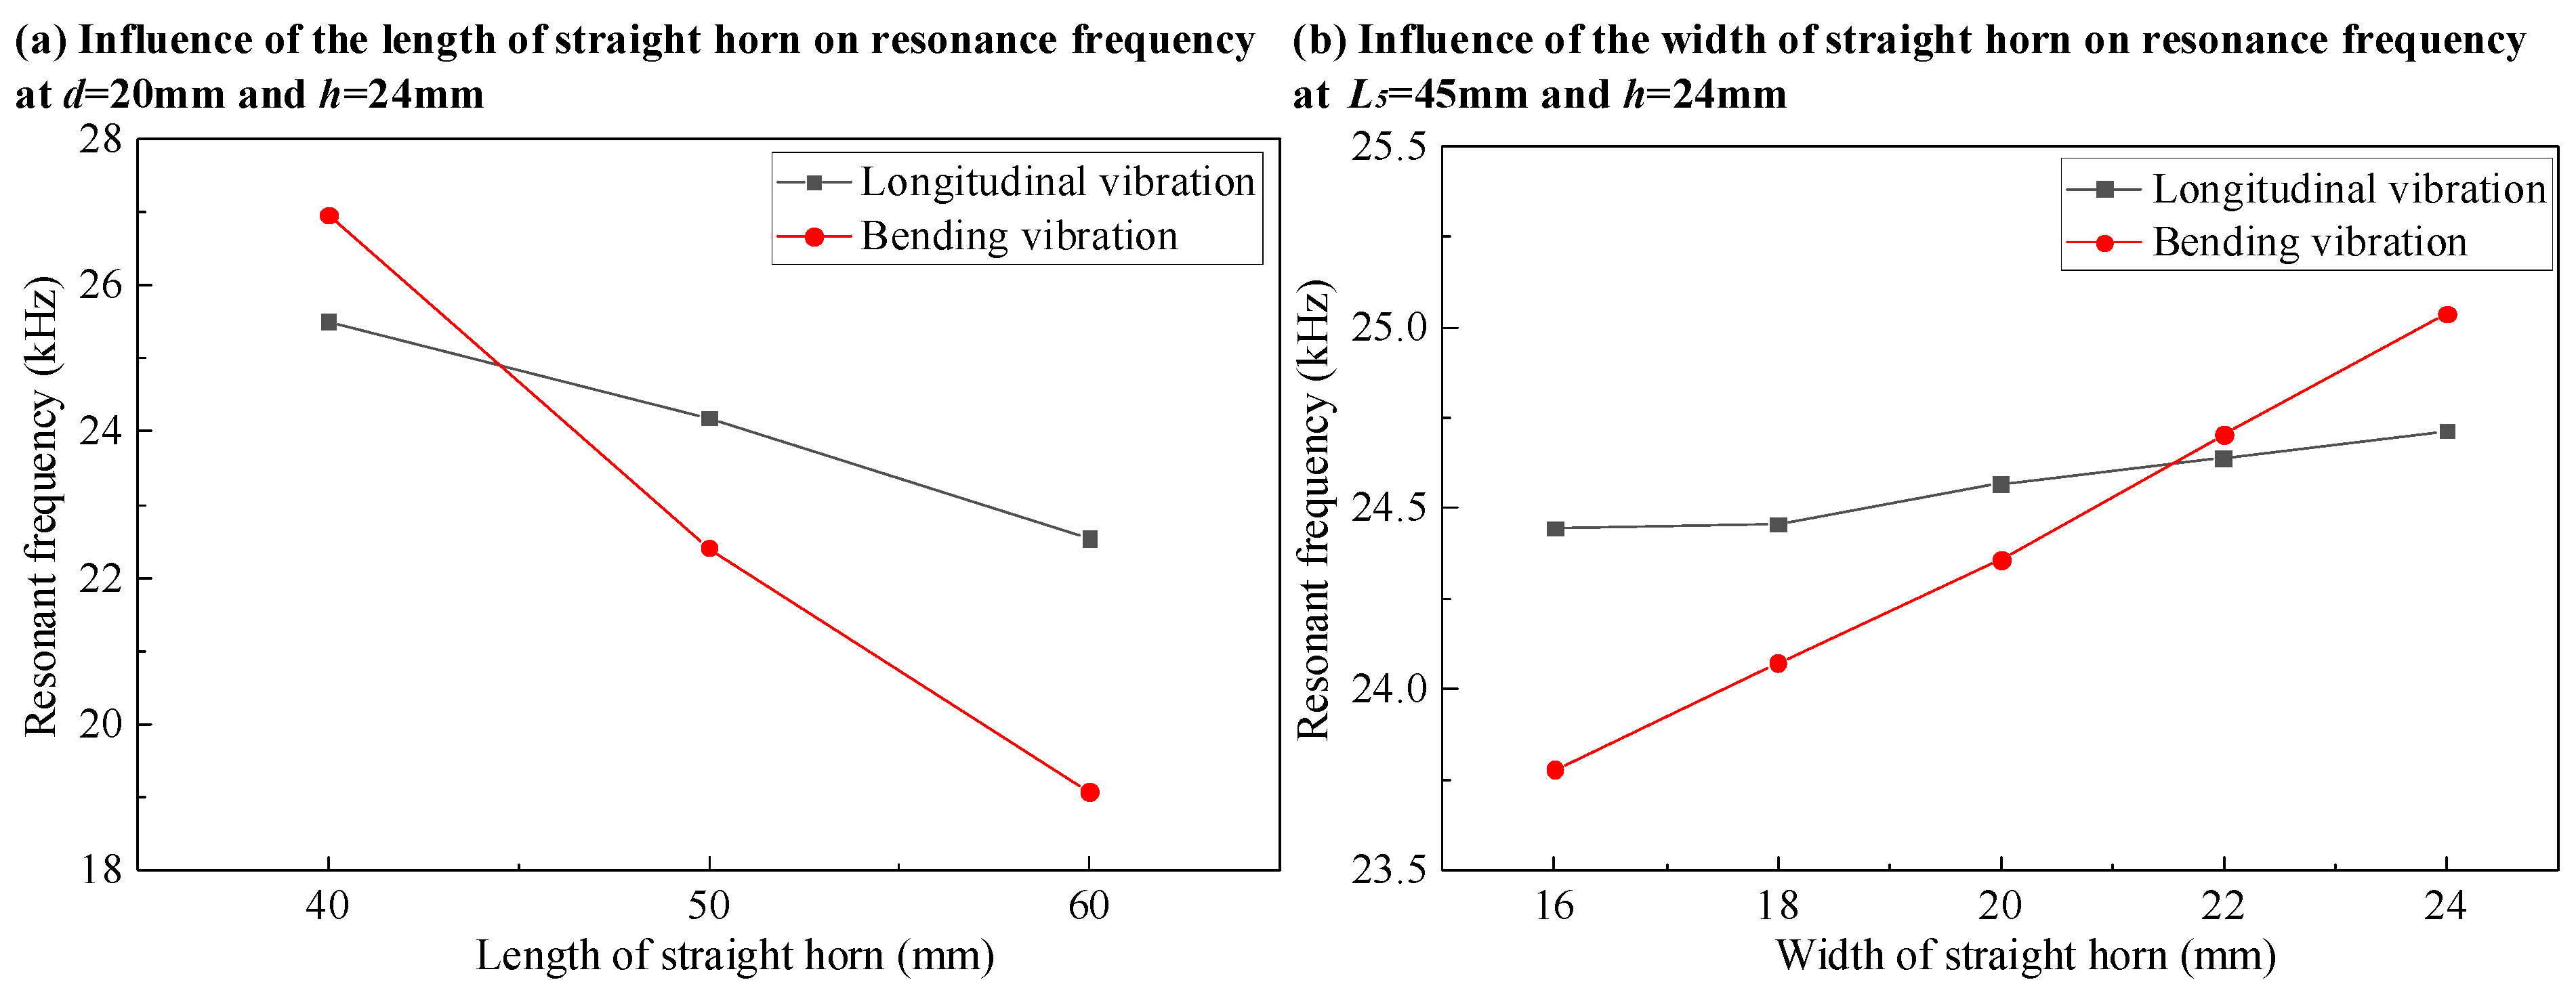
Figure 6 shows the simulation results of the B-type transducer.
Figure 6 shows the influence of the structural dimensions of the B-type transducer on the resonance frequency. The initial width of the straight horn is estimated to be
according to the required stiffness and size requirements of the horn, and then the influence of the length of the straight horn
on the resonance frequency of the longitudinal vibration and bending vibration is analyzed. As can be seen from
Figure 6a, with the shortening of the length of the straight horn, the resonant frequencies of the bending vibration and longitudinal vibration increase, and the frequency of bending vibration increases faster so that the resonant frequencies of the bending vibration and longitudinal vibration can be equal.
On the basis of obtaining the length of the horn, the influence of the width of horn d on the resonance frequency of the longitudinal vibration and bending vibration is studied. As can be seen from
Figure 6b, with the increase in the width of the horn, the resonant frequency of the bending vibration noticeably increases, while the resonant frequency of the longitudinal vibration increases slightly. Therefore, the resonant frequencies of the bending vibration and longitudinal vibration can be close by changing the width of the horn. The influence of the length and width of the straight horn in
Figure 6 on the resonant frequency of the bending vibration and longitudinal vibration corresponds to Equations (9) and (10). The front structure of the horn of the B-type transducer is too thin, which will amplify the local vibration, and it is difficult to judge the direction of the vibration, so the influence of the structural size of the horn on the direction of the vibration is not discussed here. Reducing the value of parameter e will reduce the stiffness of the transducer, while increasing the value of parameter e will cause structural interference between the horn and the workpiece. The value of e of the ultrasonic transducer is kept the same as that of the conventional tool holder, so the influence of parameter e on the resonant frequency and vibration mode is not discussed in this paper. After the optimization design, the structural parameters of the B-type transducer satisfying
Figure 3b are shown in
Table 5.
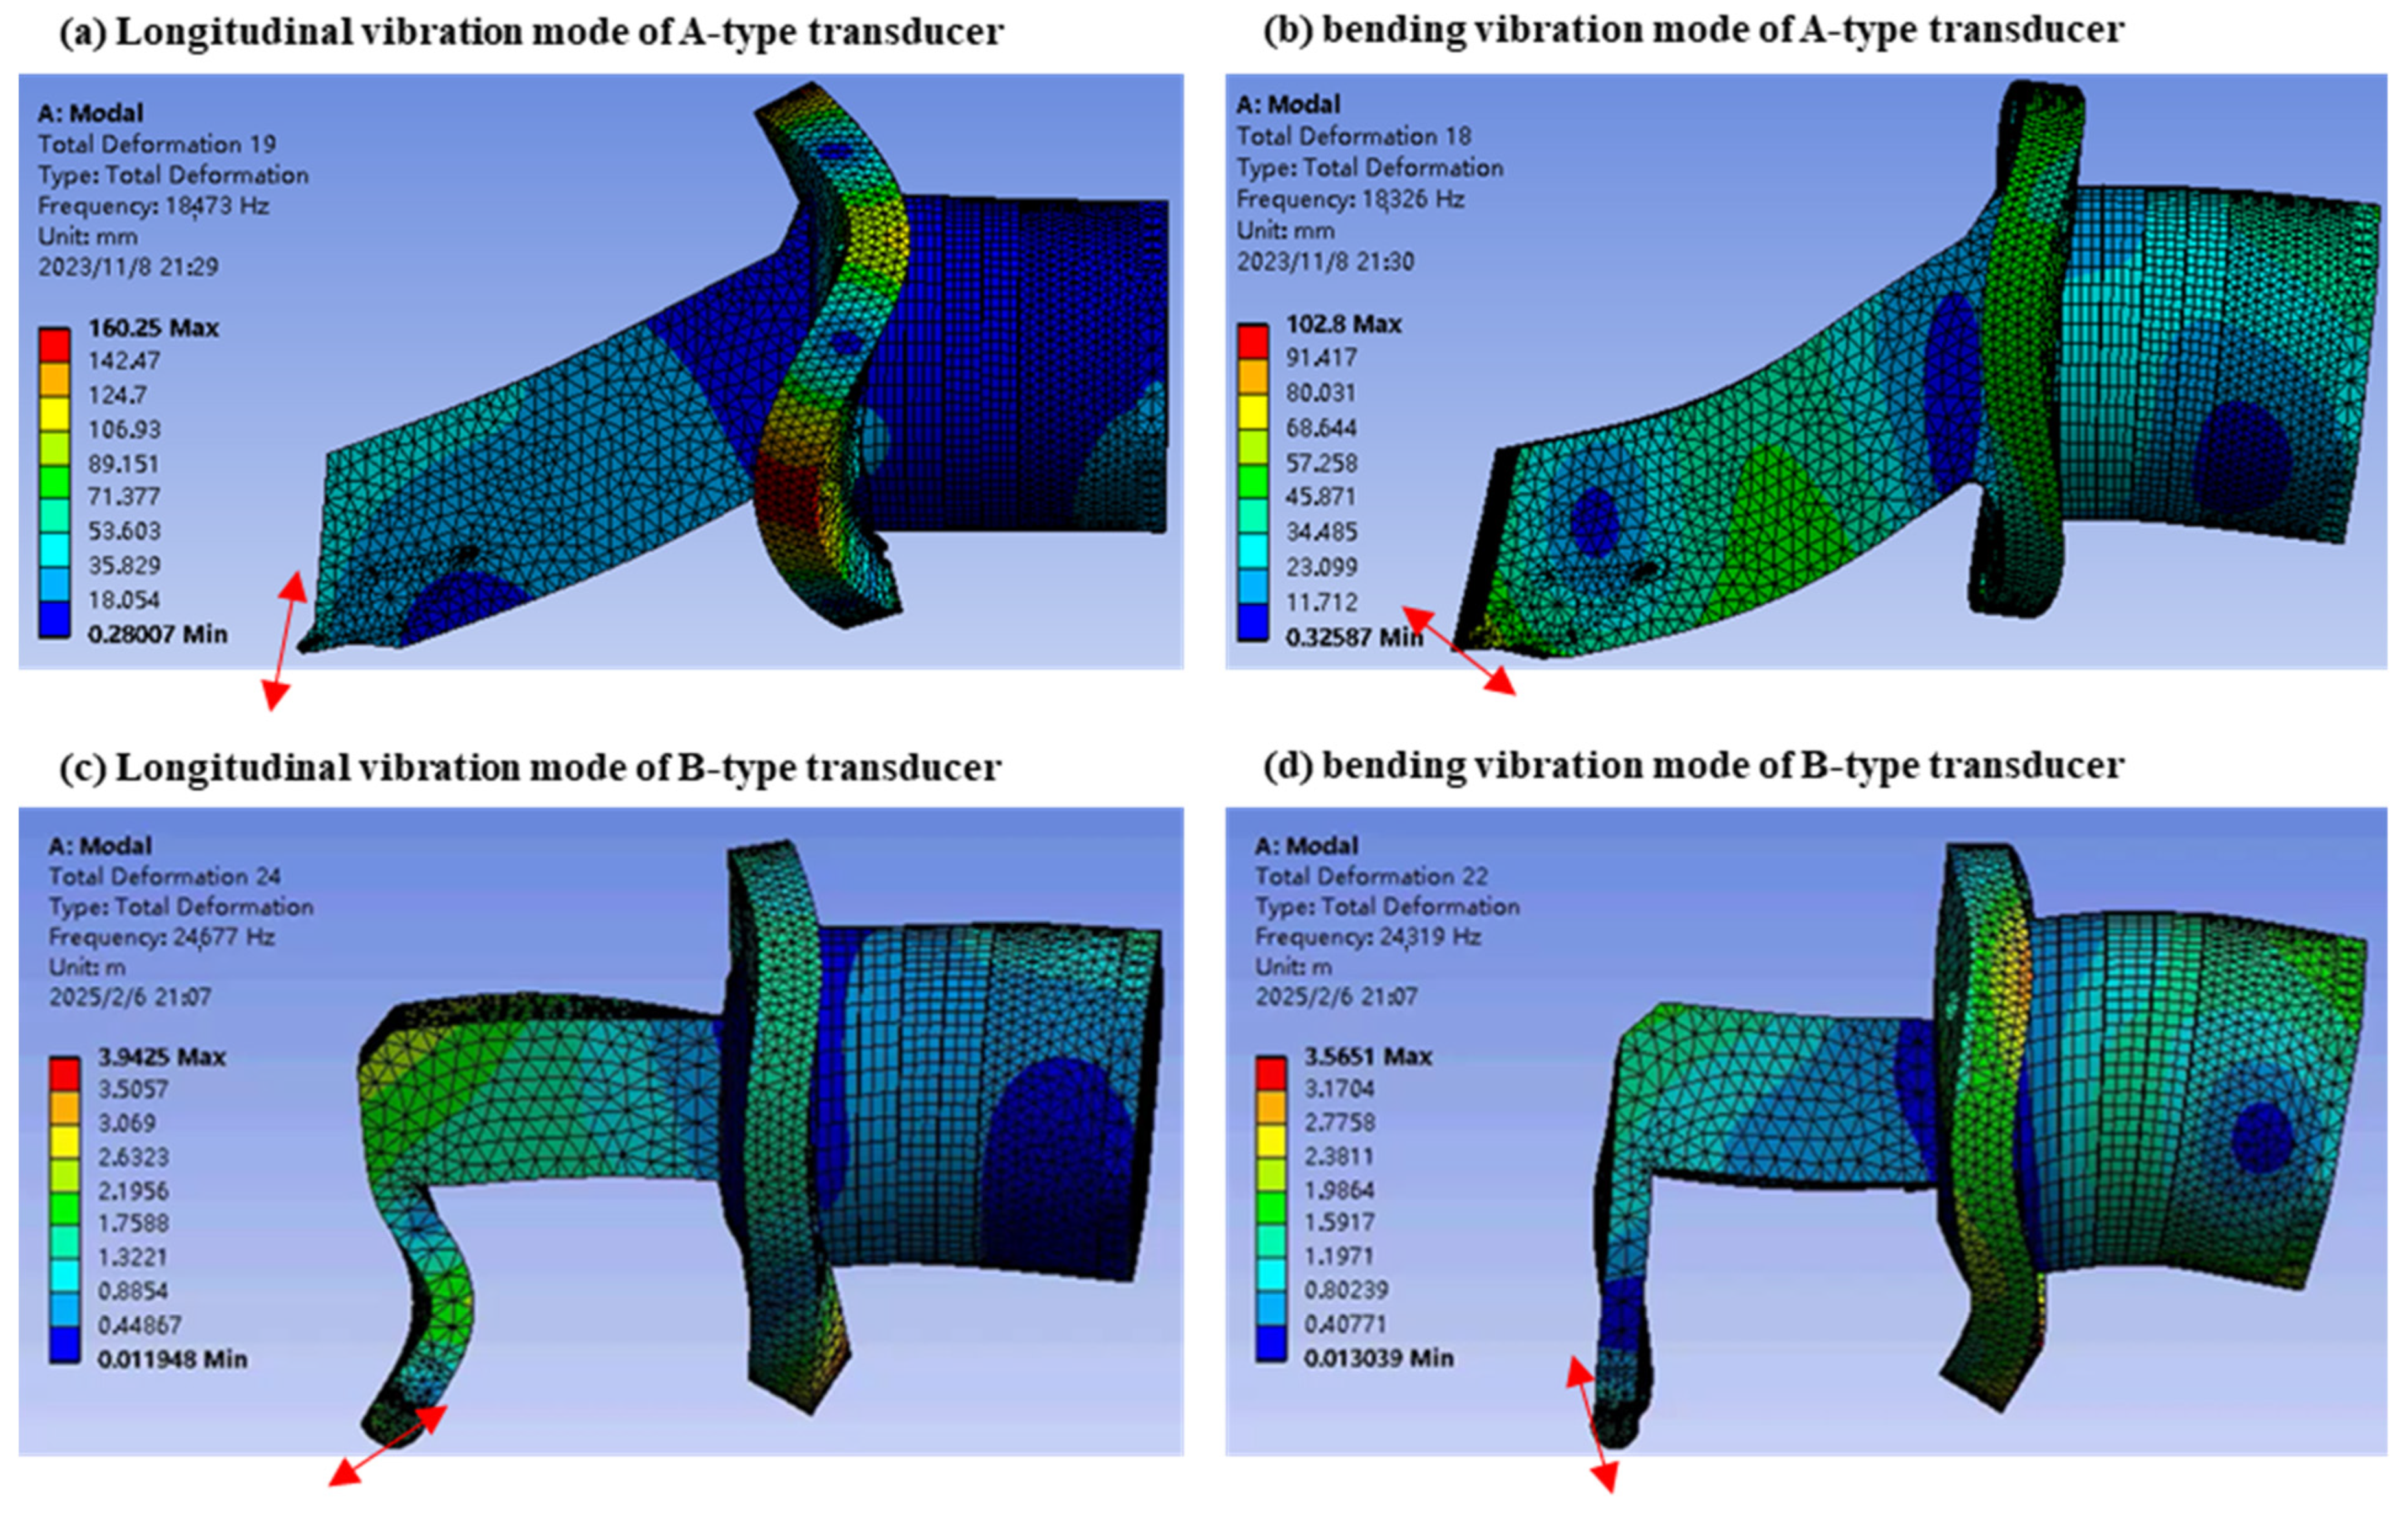
The modal analysis results of the optimized longitudinal-bending elliptical vibration ultrasonic transducer with a bending horn are shown in
Figure 7.
Figure 7a,c show the first longitudinal vibration mode, and the node is located in the flange. The mode shows that the vibration of the end cap is small, and it can also be used as a clamping point. In practice, clamping the end cap has little effect on the resonance characteristics.
Figure 7b,d show the second bending vibration mode, and the nodes are located in the flange and the end cap. Therefore, the transducer can be fixed by the flange and the end cap. The size of the transducer in the second-order bending vibration mode is close to that in the first-order longitudinal vibration mode, so the bending vibration mode adopts the higher-order mode. The modes of the longitudinal vibration and bending vibration can be excited in practical use, and the amplitude is twice the amplitude required for UVAC, so the vibration efficiency of the transducer can meet the needs of use. The direction of the modal vibration is indicated by a red arrow in
Figure 7. In
Figure 7a,c, it can be clearly seen that the transducer part is vibrating longitudinally, while the longitudinal vibration of the horn deflects in the bending direction of the horn, which is caused by structural asymmetry.
4.2. Vibration Test
The transducers corresponding to the structural parameters in
Table 4 and
Table 5 are manufactured and assembled together according to the assembly relationship in
Figure 2. The resonant frequency of the transducer is measured by PV520A impedance analyzer developed by Tsinghua University. The resonant frequencies of the longitudinal vibration and bending vibration of the A-type transducer are 18.332 kHz and 18.290 kHz, respectively, and the difference between the designed and measured resonant frequencies of the longitudinal vibration and bending vibration is 0.76% and 0.19%, respectively. The resonance frequencies of longitudinal vibration and bending vibration of the B-type transducer are 22.328 kHz and 22.678 kHz, respectively, and the difference between the designed and measured resonance frequencies of longitudinal vibration and bending vibration is 9.51% and 6.74%, respectively. According to the literature research on the modal simulation of transducers, the error between the designed frequency and the measured frequency needs to be within 10%, and the design error in this paper meets the requirements. When there is a design error, it will not adversely affect the frequency matching of the transducer, because the measured frequencies of the longitudinal vibration and bending vibration are all lower than the design frequency, and the decreased values are close.
Figure 8 shows the measuring device for the vibration amplitude and vibration direction. A Keyence LK-Navigator 2 laser micrometer is used to measure the amplitude and vibration direction of ultrasonic tool holders. The transducer is excited by applying voltage from an ultrasonic power supply, and the vibration amplitude is measured simultaneously in horizontal and vertical directions by a laser micrometer. When the vibration in a single direction is excited (exciting longitudinal vibration or bending vibration), the vibration amplitude and vibration direction can be obtained by synthesizing the amplitude measured in the horizontal and vertical directions. When the longitudinal vibration and bending vibration are excited at the same time, the elliptical vibration trajectory of the tool tip can be obtained by synthesizing the amplitudes measured in the horizontal and vertical directions.
For the A-type transducer, the direction angle of the longitudinal vibration is , the direction angle of the bending vibration is , and the included angle between the directions of longitudinal vibration and bending vibration is . The difference between the designed and the measured included angle between the directions of longitudinal vibration and bending vibration is 7.93%. For the B-type transducer, the direction angle of longitudinal vibration is , the direction angle of bending vibration is , and the included angle between the directions of the longitudinal vibration and bending vibration is . The difference between the designed and the measured included angle between the directions of the longitudinal vibration and bending vibration is 9.72%.
The transducer is capacitive, which requires matching the inductance to make the circuit resonate and thus increase the amplitude of the transducer. The appropriate matching inductance can be determined by debugging the transducer. When debugging, a sinusoidal voltage of 360 V is applied to the ultrasonic transducer, and the frequency of the output voltage can be changed by adjusting the output of the ultrasonic power supply.
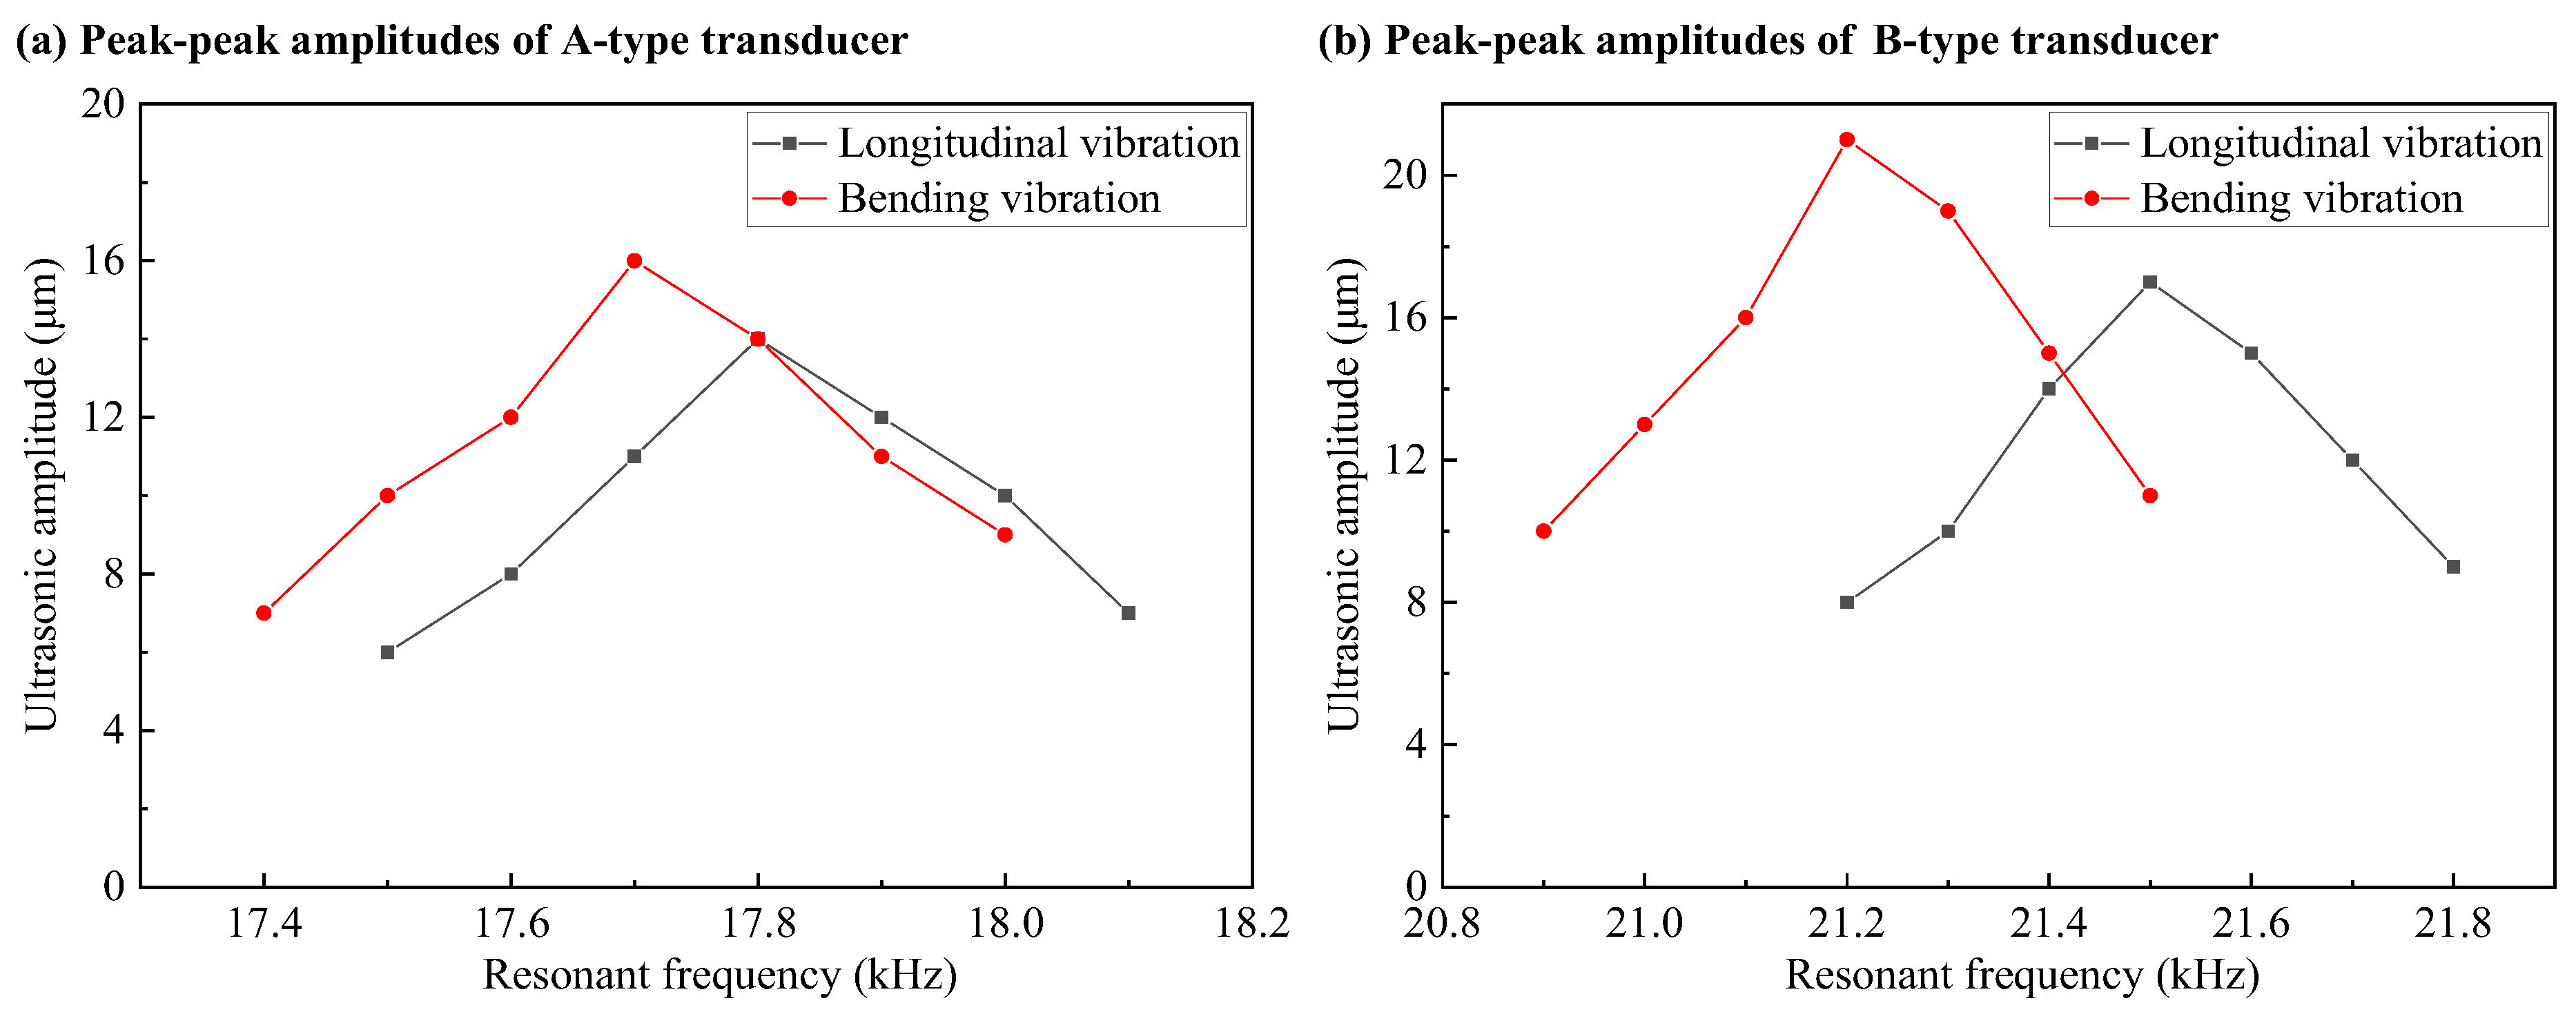
Figure 9 shows the peak–peak amplitudes of transducers at different resonant frequencies with inductance
. As can be seen from
Figure 9, there is a resonance frequency with the largest amplitude for both the longitudinal vibration and bending vibration, which is lower than the mechanical resonance frequency measured by the impedance analyzer. The maximum peak–peak amplitudes of longitudinal vibration and bending vibration for the A-type transducer are 14 μm and 16 μm, respectively. The maximum peak–peak amplitudes of the longitudinal vibration and bending vibration for the B-type transducer are 17 μm and 21 μm, respectively. In order to make the resonance frequencies of the longitudinal vibration and bending vibration equal and their amplitudes as large as possible, 17.8 kHz is selected as the resonance frequency of the elliptical vibration ultrasonic transducer for the A-type transducer and 21.4 kHz is selected as the resonance frequency of the elliptical vibration ultrasonic transducer for the B-type transducer.
Let the longitudinal vibration of the elliptical vibration ultrasonic transducer vibrate along the x axis, and its bending vibration vibrates in the xOy plane, so the vibration equation of the tool tip can be obtained as follows:
where
B is the amplitude of the longitudinal vibration, μm;
C is the amplitude of the bending vibration, μm;
F is the frequency of the longitudinal vibration and bending vibration, Hz;
t is time,
s;
is the phase difference of bending vibration compared with the longitudinal vibration.
Figure 9 shows the maximum amplitude of the transducer at resonance, and the amplitude commonly used in elliptical vibration ultrasonic machining is 6–8 μm from peak to peak. Therefore, the study in
Figure 10,
Figure 11 and
Figure 12 is carried out by adjusting the output of the ultrasonic power supply so that the amplitude of the transducer is 8 μm.
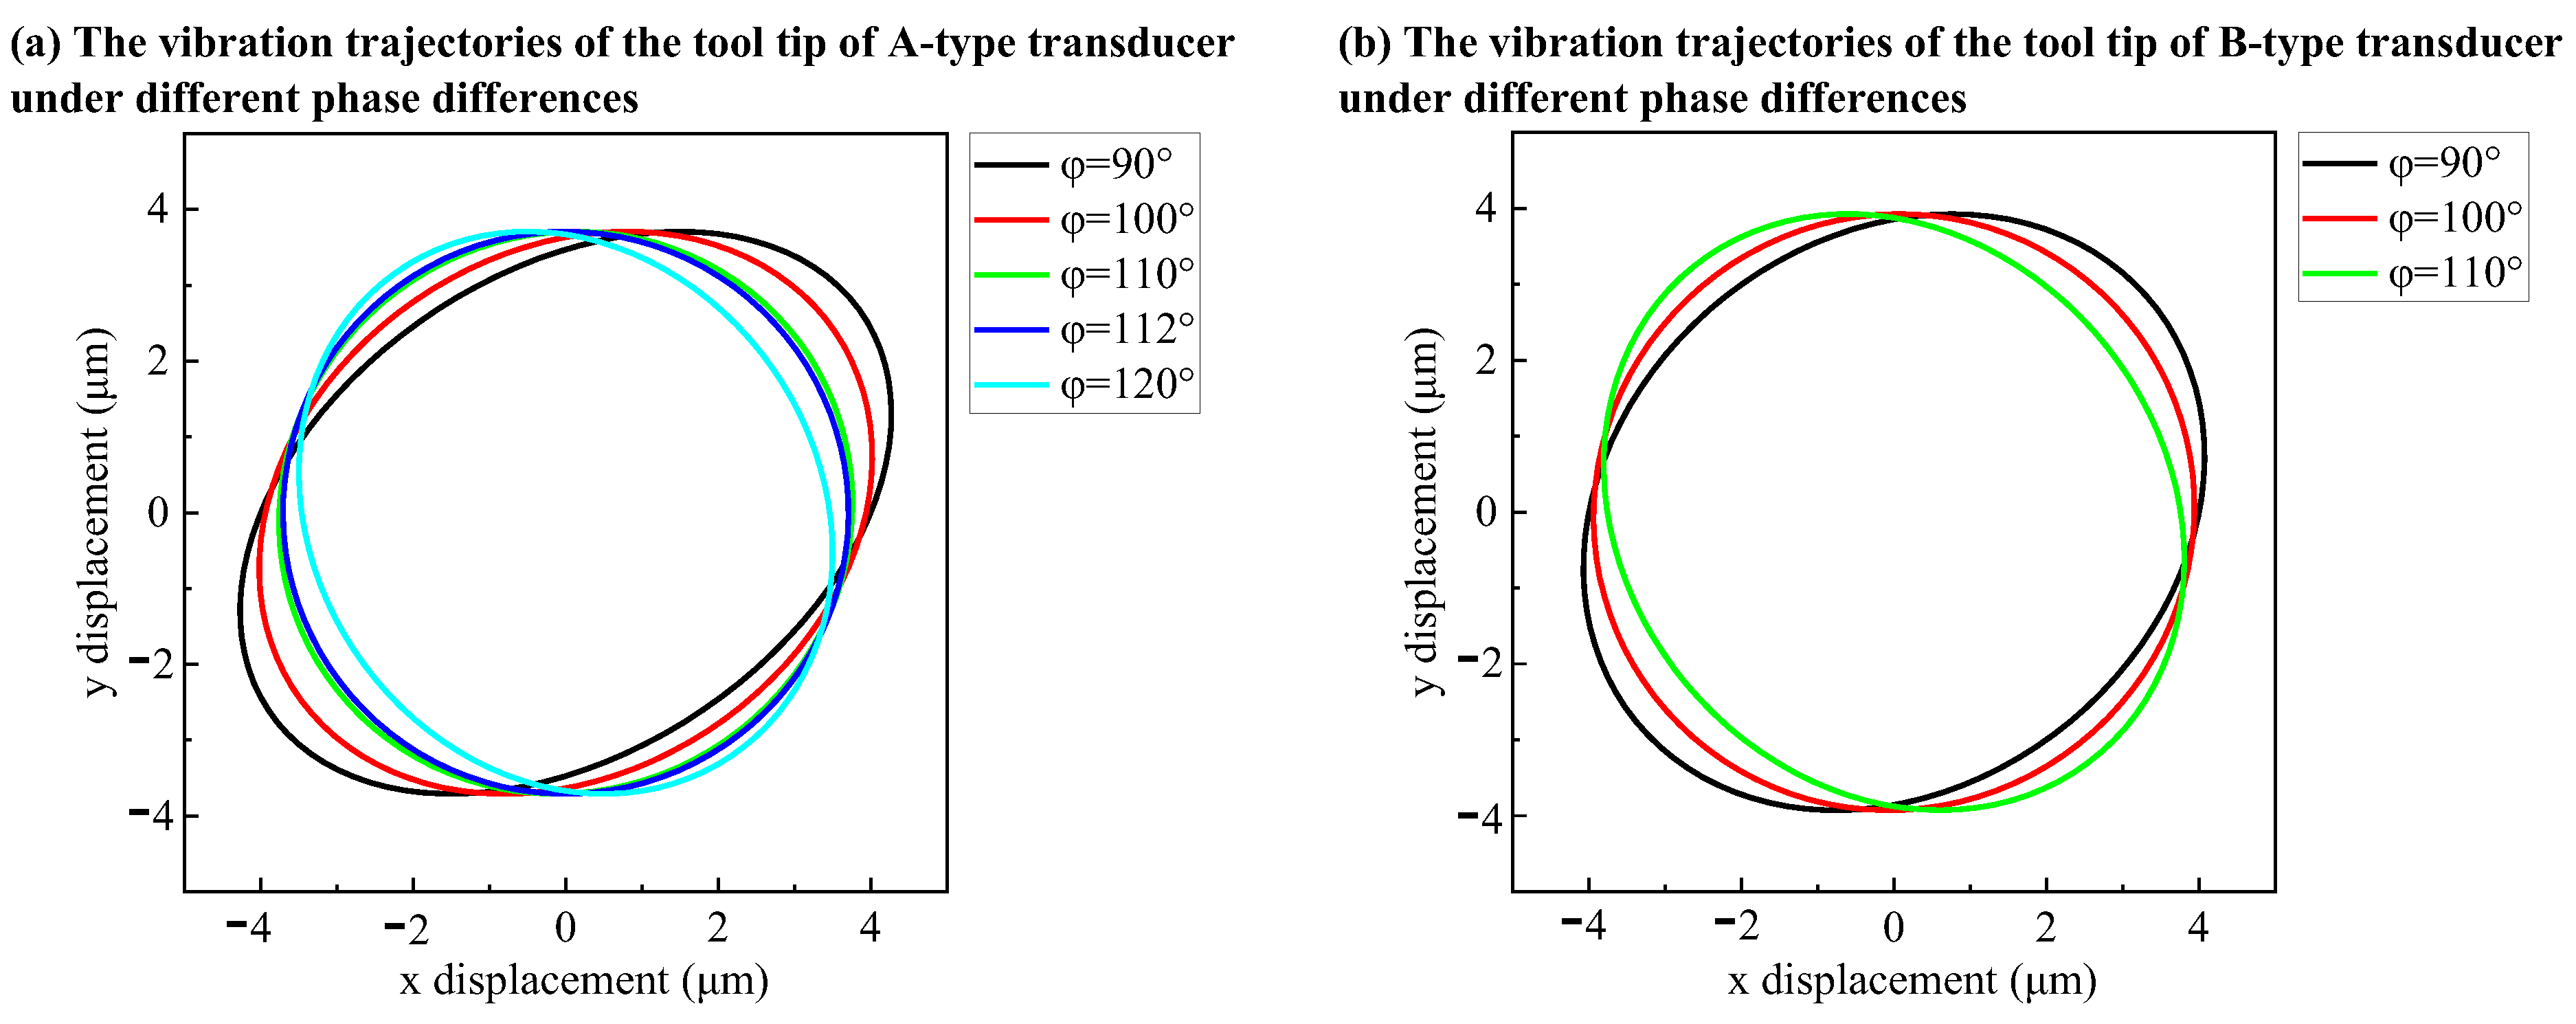
Figure 10a shows the vibration trajectories of the tool tip under different phase differences for an A-type transducer at
and
. Because there is an included angle of
between the directions of longitudinal vibration and bending vibration, the trajectory of the tool tip is an oblique oblate ellipse when the phase difference
is
, but it is approximately circular when the phase difference
is
.
Figure 10b shows the vibration trajectories of the tool tip under different phase differences for a B-type transducer at
and
. Because there is an included angle of
between the directions of longitudinal vibration and bending vibration, the trajectory of the tool tip is an oblique oblate ellipse when the phase difference
is
, but it is approximately circular when the phase difference
is
.
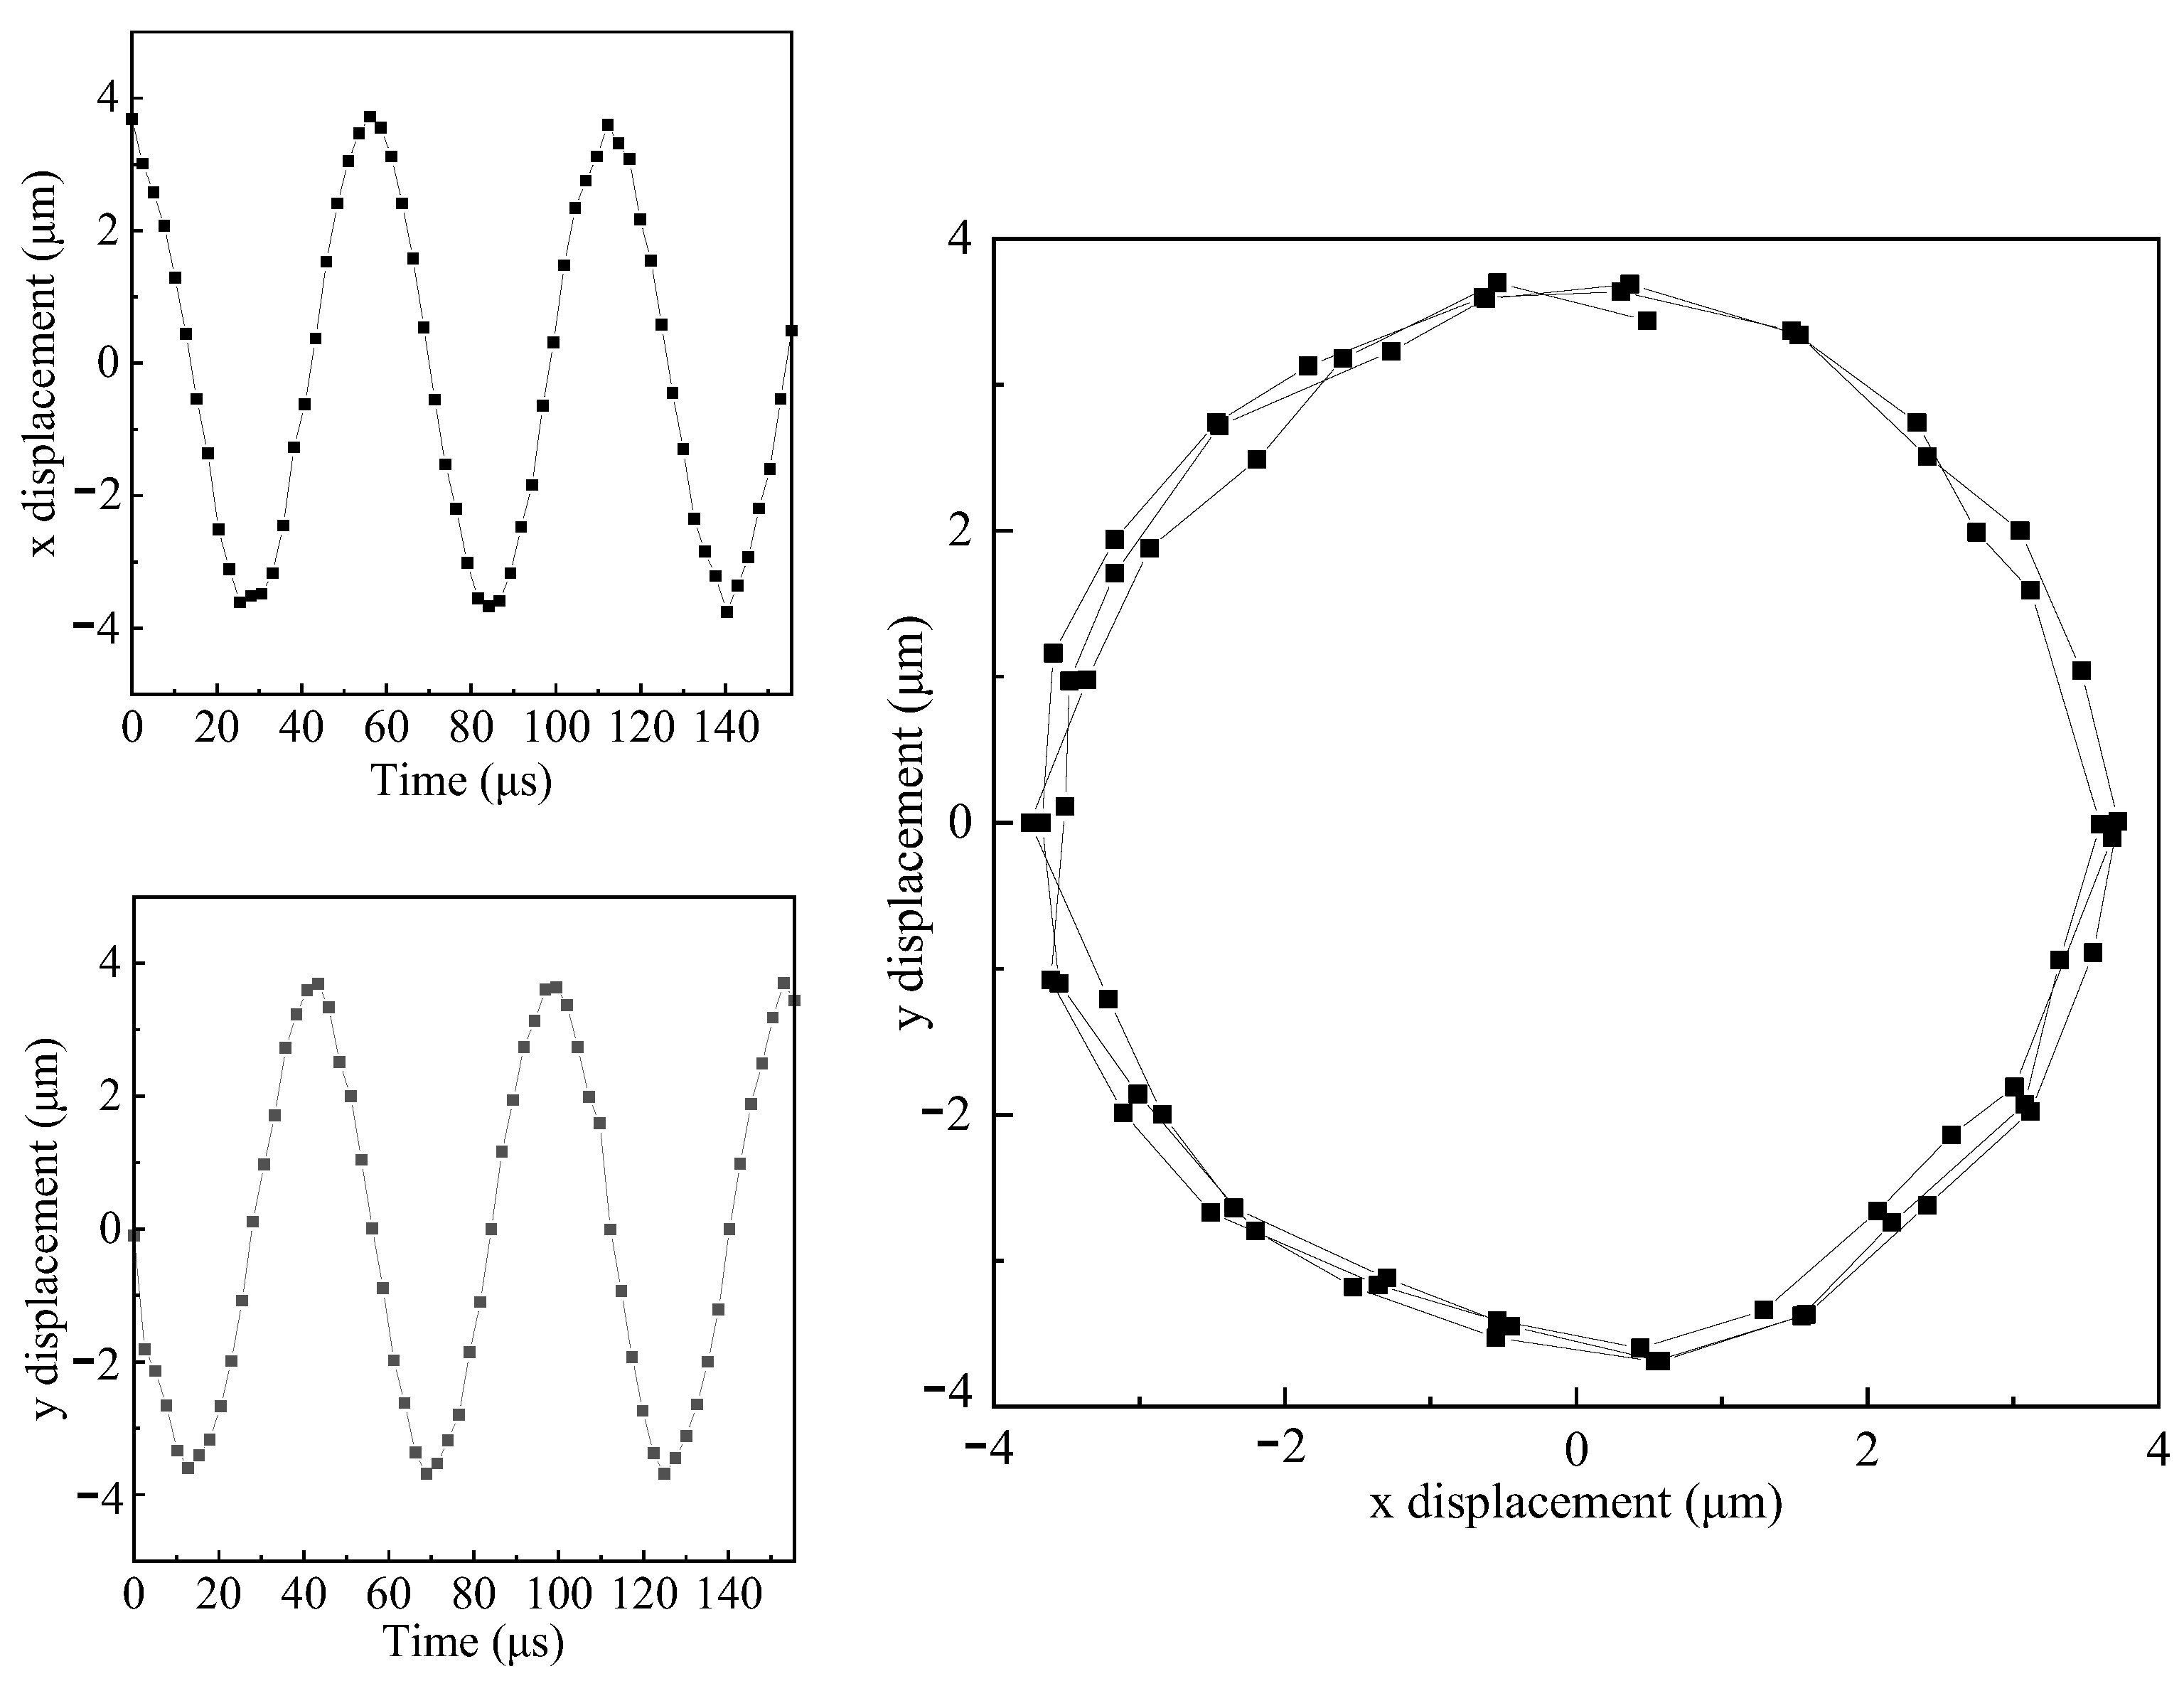
Figure 11 shows the measured vibration trajectory of the tool tip for an A-type transducer at
and
.
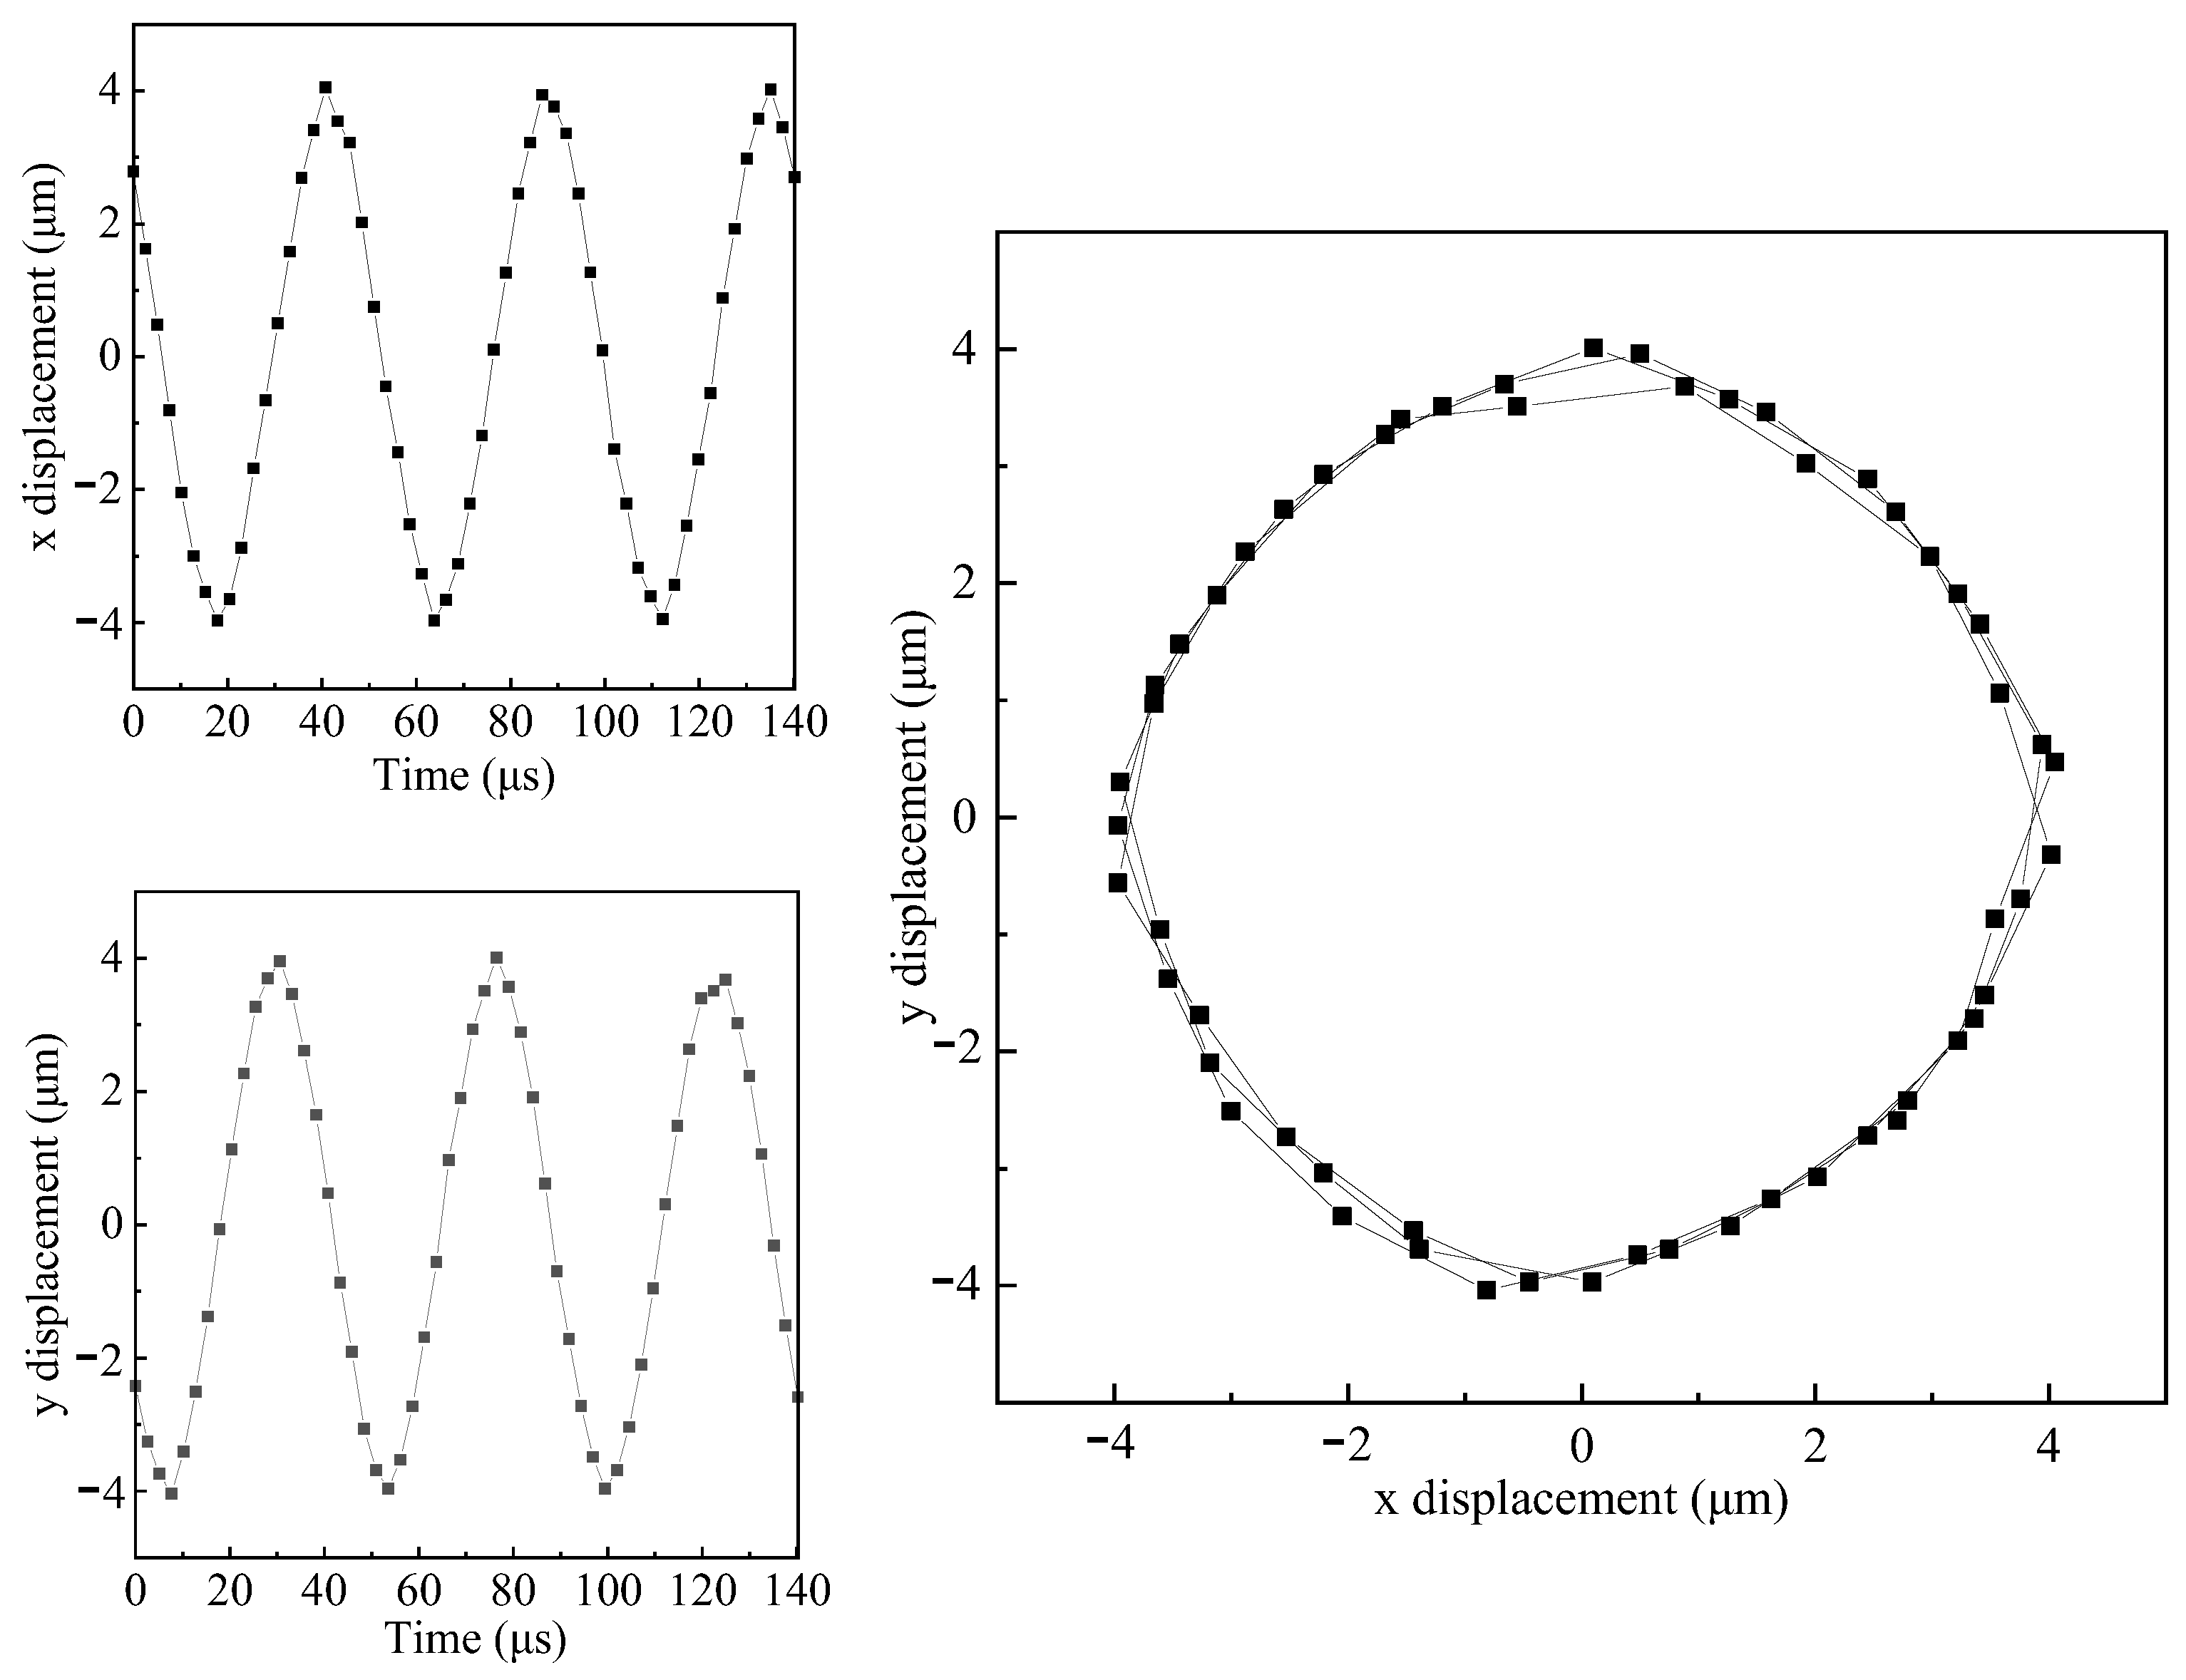
Figure 12 shows the measured vibration trajectory of the tool tip for a B-type transducer at
and
. The elliptical trajectories in
Figure 11 and
Figure 12 are all approximately circular. Due to the frequency difference between the longitudinal vibration and the bending vibration, after the frequency matching of the transducer, both the longitudinal vibration and the bending vibration do not work at the resonance frequency with the maximum amplitude. However, due to the small difference and the low amplitude adopted, the transducer does not overheat during processing. During the continuous monitoring for two hours, the resonant frequency, output current, and amplitude of the transducer are relatively stable.
4.3. Machining Test
It is challenging to open the cutting zone during continuous cutting, which results in high cutting temperatures and forces that significantly limit tool life when machining difficult-to-machine materials. Intermittent UVAC can decrease cutting temperature and force by opening the cutting area, thereby enhancing tool life and making it a popular choice for machining such materials. However, intermittent cutting makes the MRR of UVAC low. Zhang et al. [
10] put forward the partial separation continuous high-speed ultrasonic vibration cutting method, which can open the cutting area while cutting continuously, greatly improving the tool life and MRR. In this paper, we propose a partial separation continuous high-speed elliptical ultrasonic vibration cutting (HEUVC) method for cutting Inconel 718.
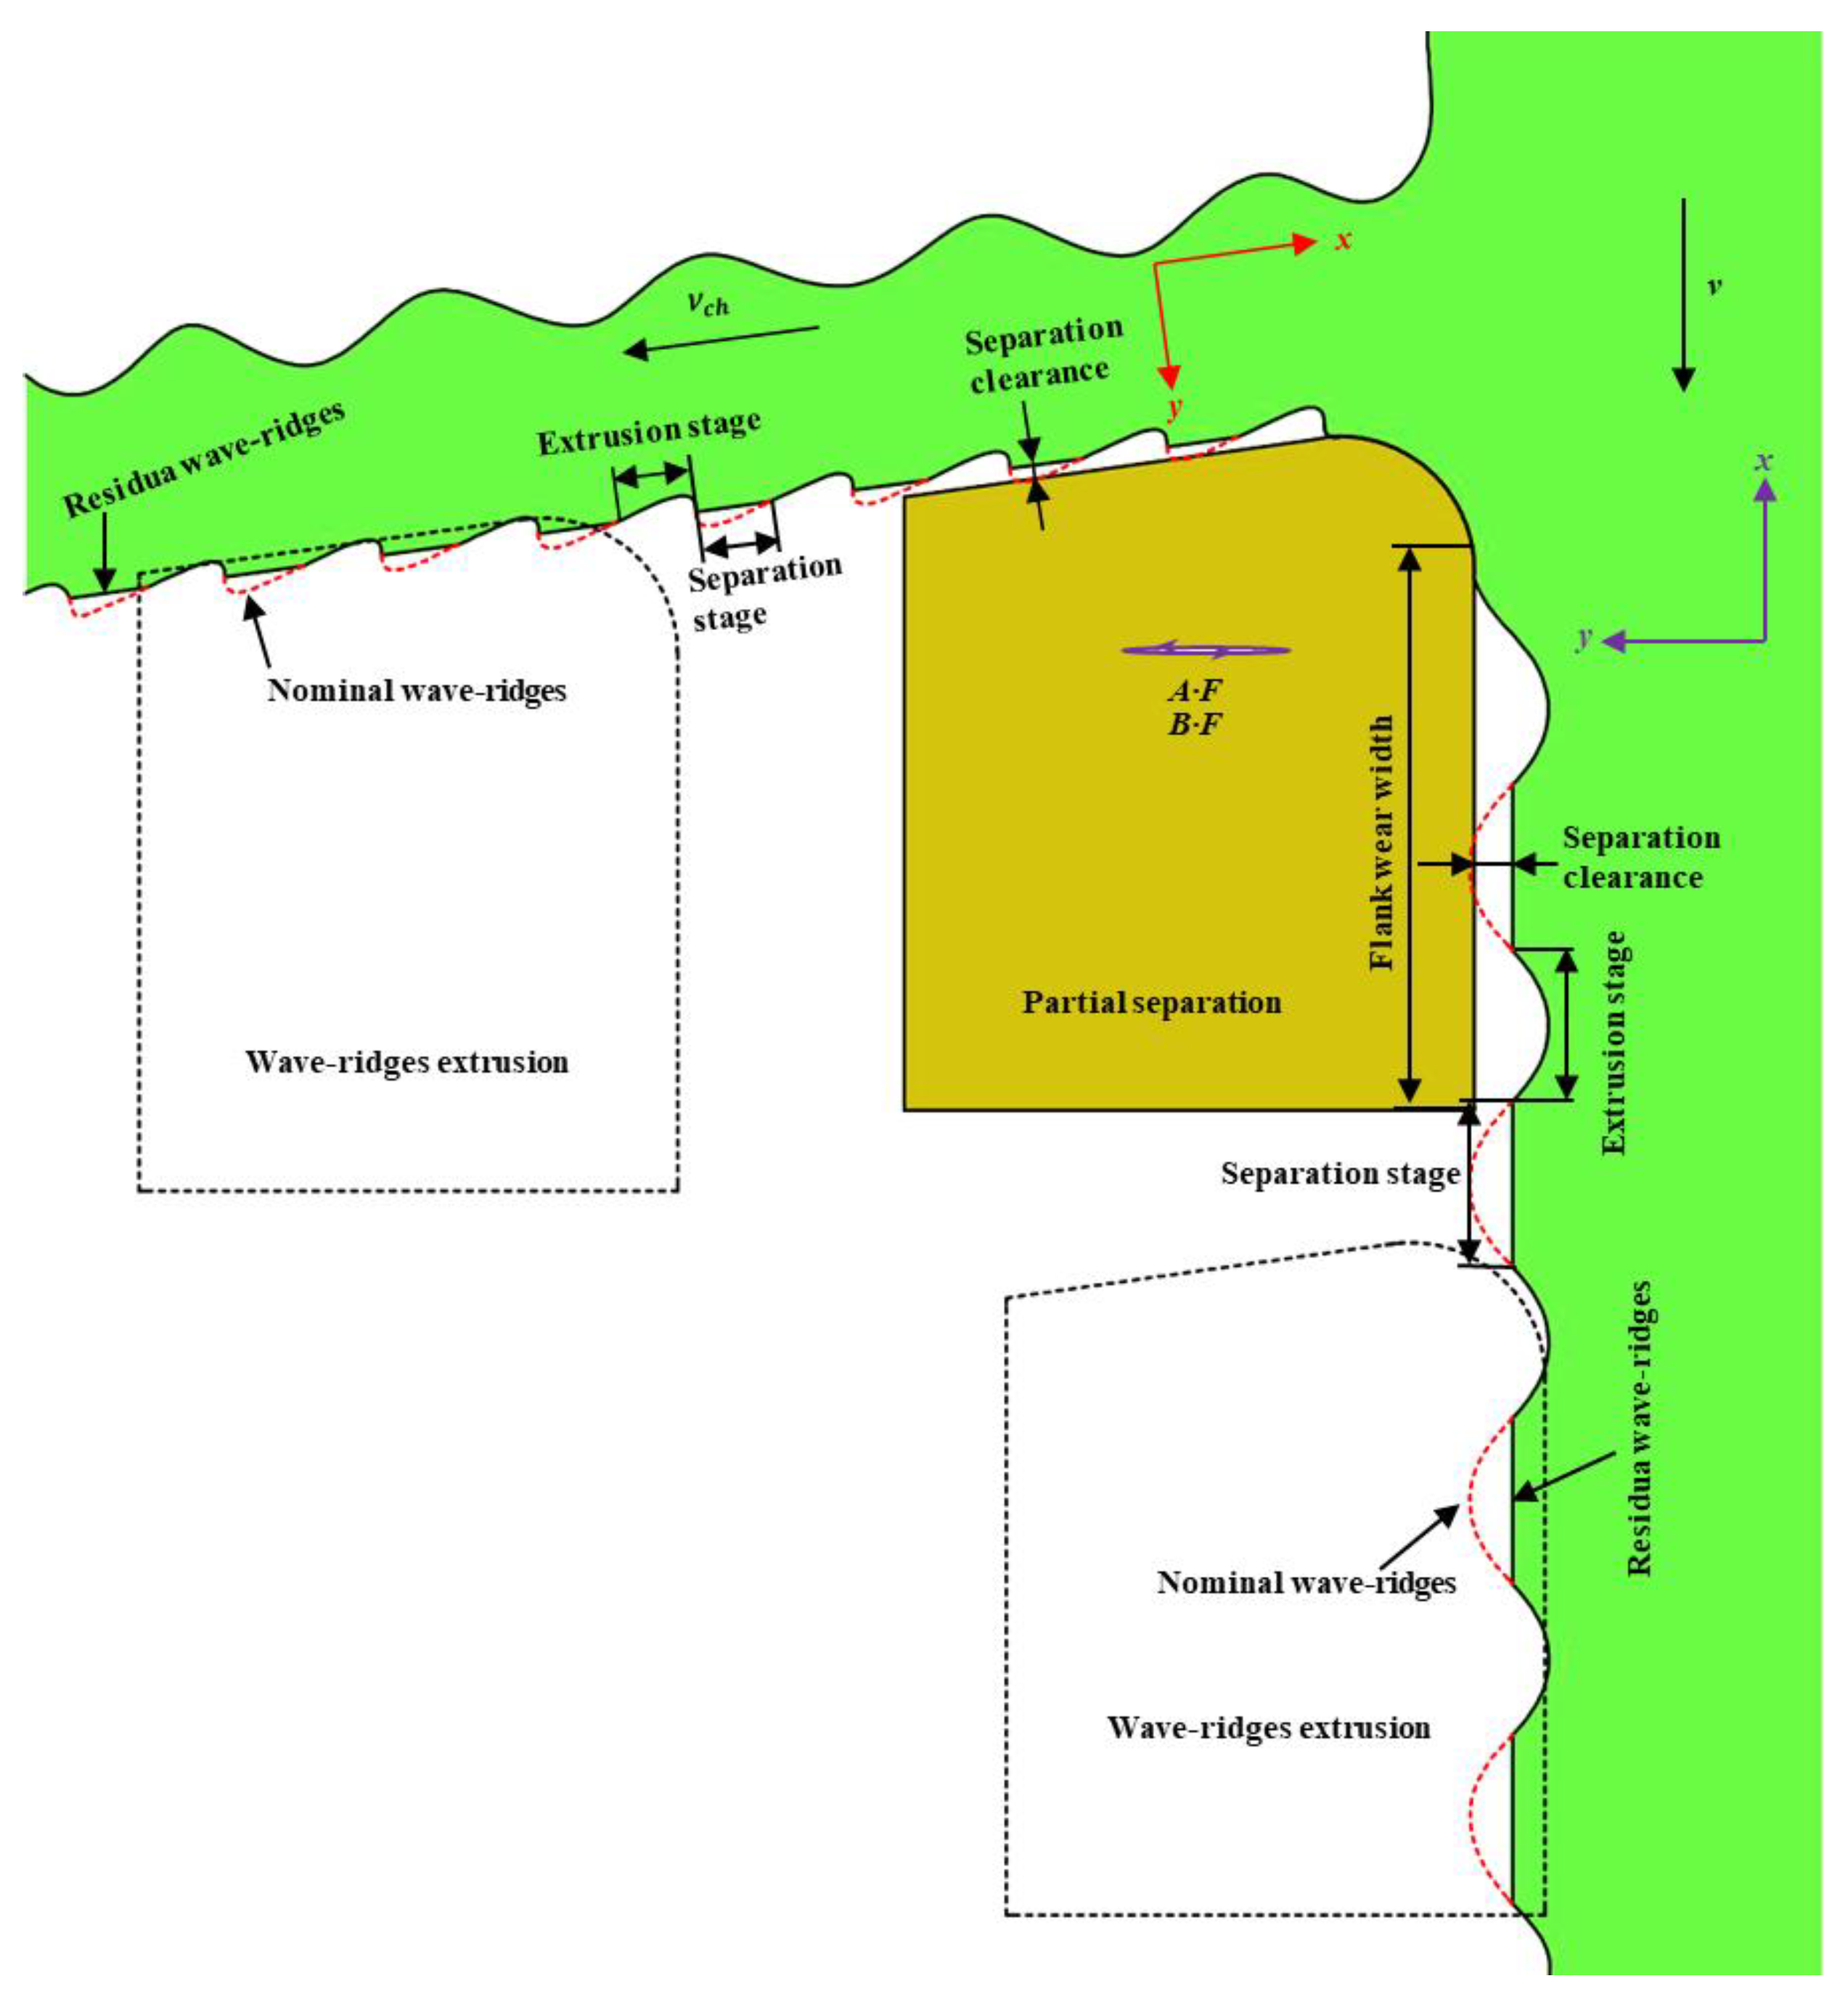
Figure 13 is a schematic diagram of a dynamic process of wave-ridges extrusion and partial separation on rake face and flank face in an orthogonal plane. Wave-ridges are periodic undulating structures generated in the direction of chip thickness or cutting thickness, including peaks and valleys. In a generation cycle of wave-ridges structure, there are two processes: wave-ridges extrusion and partial separation. In the process of wave-ridges extrusion, the tool extrudes the generated wave ridges. In the process of partial separation, a separation gap is generated between the tool and the previously extruded wave ridges.
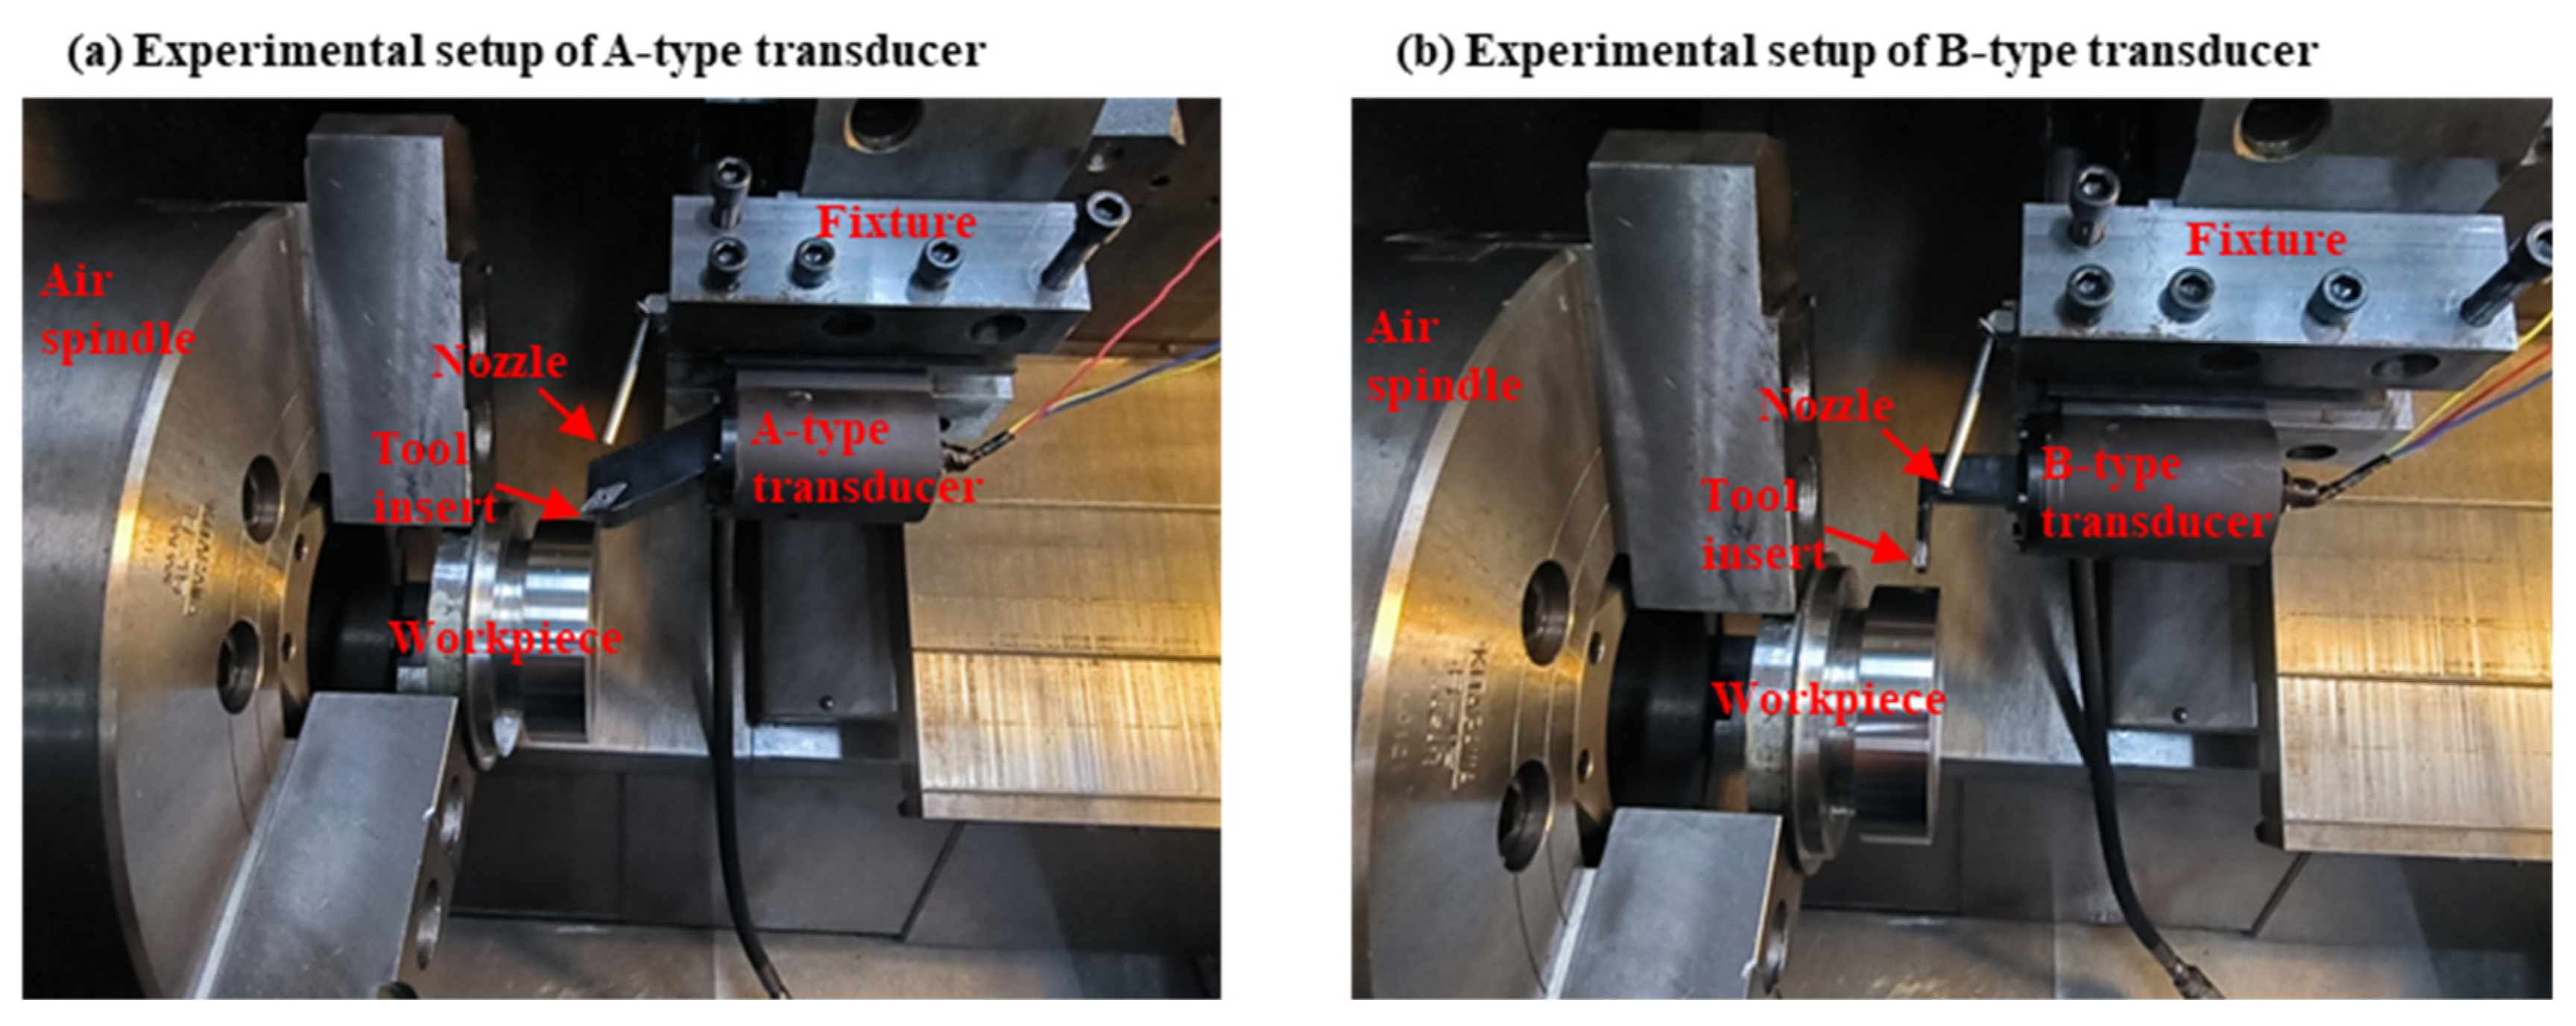
Figure 14 shows experimental setup in HEUVC. In
Figure 14a, a rhombic-type AlTiN-coated cemented carbide insert from Iscar (VCMT 160408-SM IC804) was mounted on the A-type transducer. The tool tip of the A-type transducer vibrates elliptically at the frequency of 17.8 kHz in the tool base. In
Figure 14b, a TiAlN+AlTiN+TiN-coated cemented carbide insert from Iscar (TAGB 630Y IC808) was mounted on the B-type transducer. The tool tip of the B-type transducer vibrates elliptically at the frequency of 21.4 kHz in the tool base. A water-soluble emulsion is applied as a coolant on the rake face.
The comparative experiments of HEUVC and CC were carried out on a CNC lathe.
Table 6 contains all the machining parameters. In this paper, the finishing experiment of Inconel 718 is carried out, and the cutting parameters are set according to the requirements of finishing. An Olympus BX51M microscope is used to measure tool wear. When the maximum flank wear VBmax = 0.3 mm, the cutting experiment is stopped, and the cutting distance at this time is the tool life under this cutting condition. Three experiments were carried out to obtain the average of the experimental results.
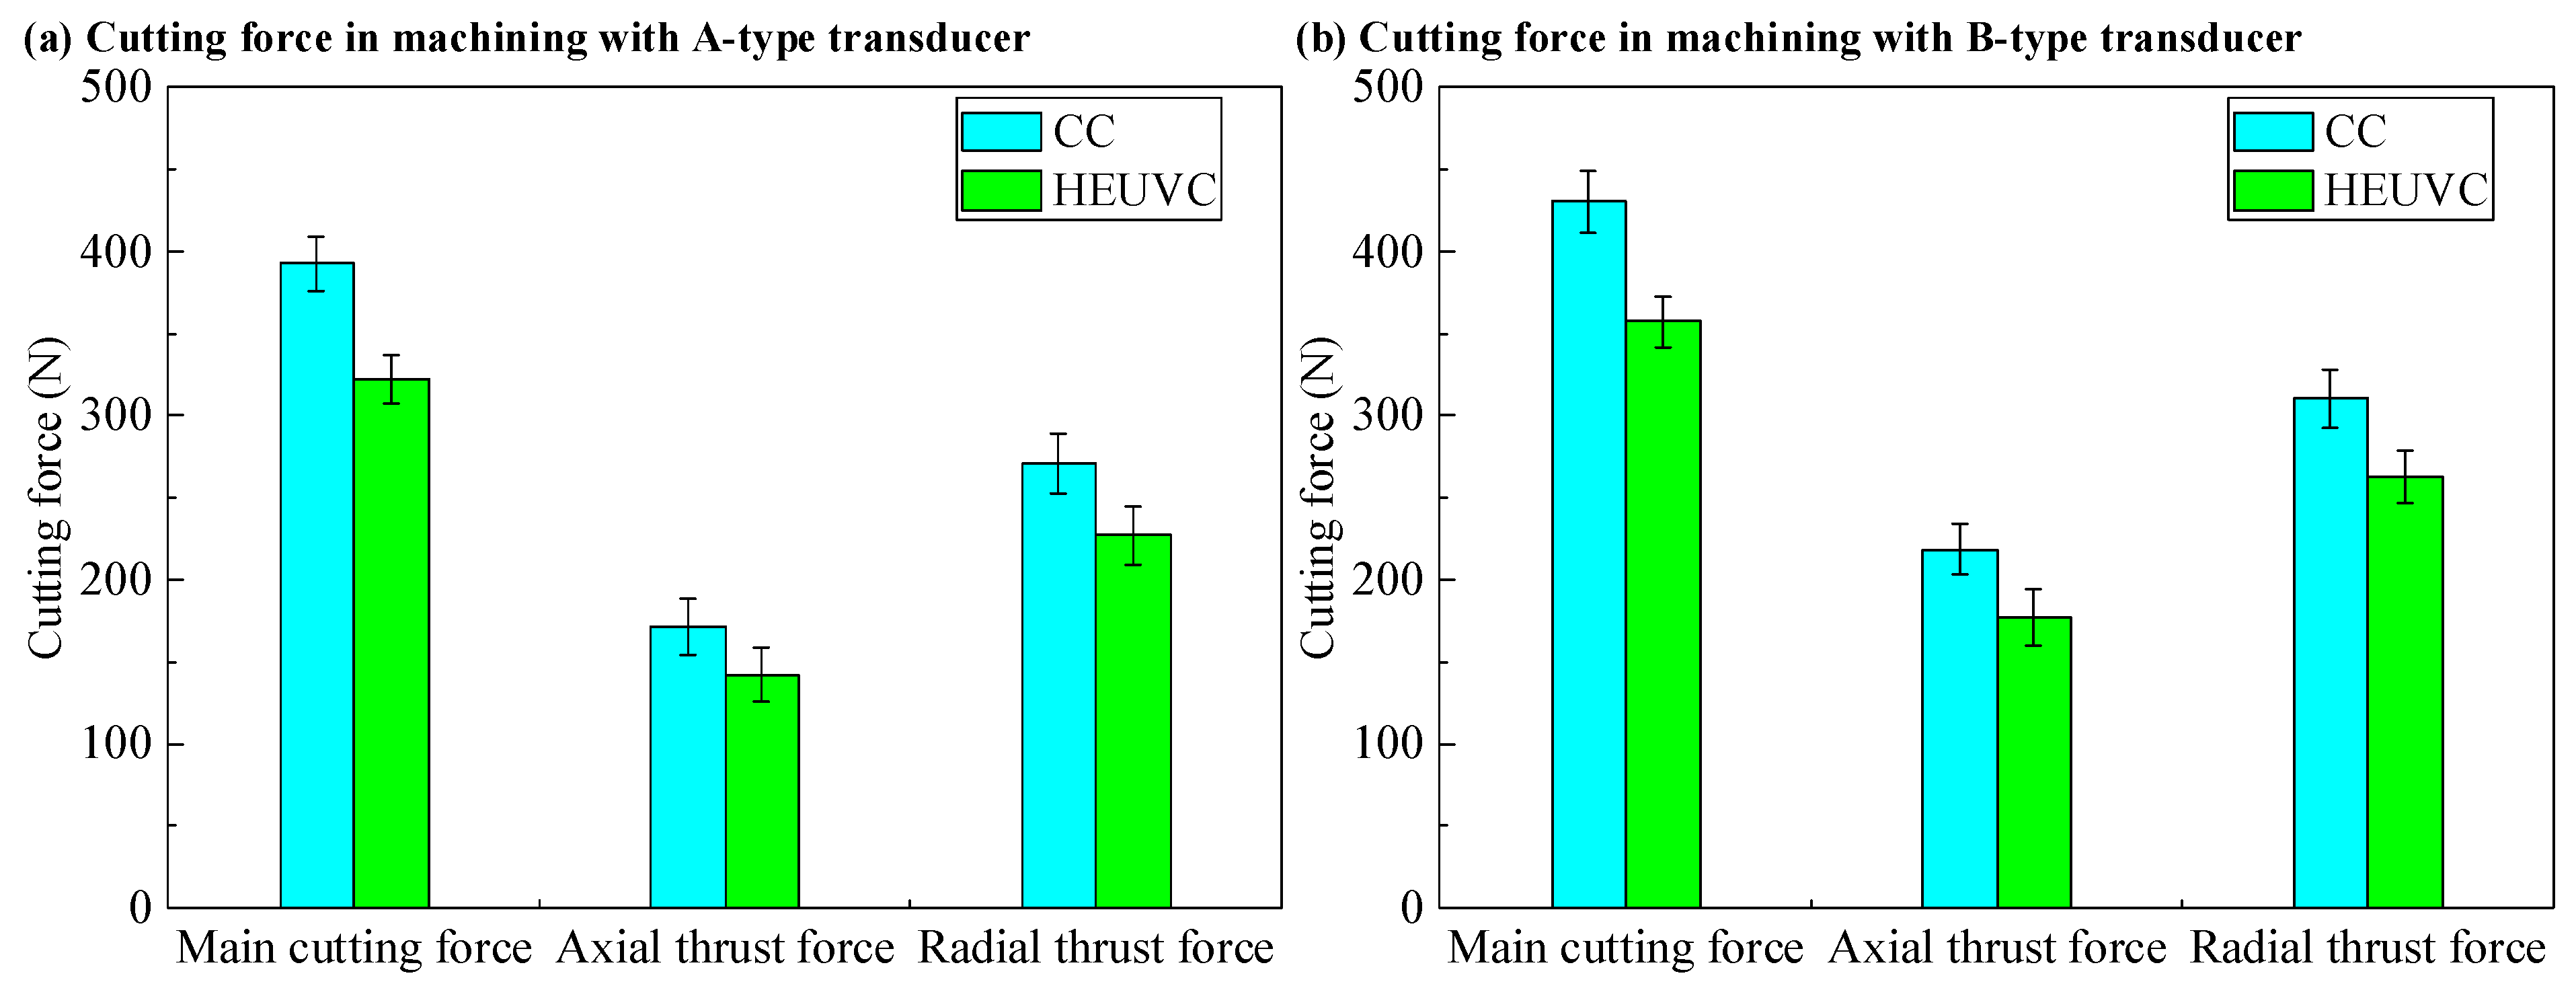
The HEUVC method can partially open the cutting area in the process of continuous cutting, so that the coolant can enter the cutting area to cool and lubricate the tool and workpiece, reduce the cutting temperature and cutting force, and thus prolong the tool life. As shown in
Figure 15, compared with CC, the main cutting force, axial thrust force, and radial thrust force of HEUVC are reduced by 17.96%, 17.25%, and 16.24%, respectively, when cutting with the A-type transducer. Compared with CC, the main cutting force, axial thrust force, and radial thrust force of HEUVC are reduced by 16.95%, 18.93%, and 15.36%, respectively, when cutting with the B-type transducer.
Figure 16 shows the effect of cutting distance on flank wear when an elliptical vibration ultrasonic transducer with a bending horn is used to study the partial separation continuous high-speed elliptical ultrasonic vibration cutting Inconel 718. Compared with CC, HEUVC can improve the tool life by 65.74% when cutting with an A-type transducer. Compared with CC, HEUVC can improve the tool life by 44.62% when cutting with a B-type transducer. The rhombic-type tool is used in an A-type transducer, while the ball-end tool is used in a B-type transducer. Compared with the rhombic-type tool, the length of the cutting edge in which the ball-end tool participates in cutting is increased, which makes the cutting heat relatively dispersed, so the tool life of the ball-end tool is longer than that of the rhombic-type tool. Because the rhombic-type tool used in the A-type transducer has a short tool life, HEUVC can improve tool life more than CC. In other words, the smaller the base, the higher the improvement.
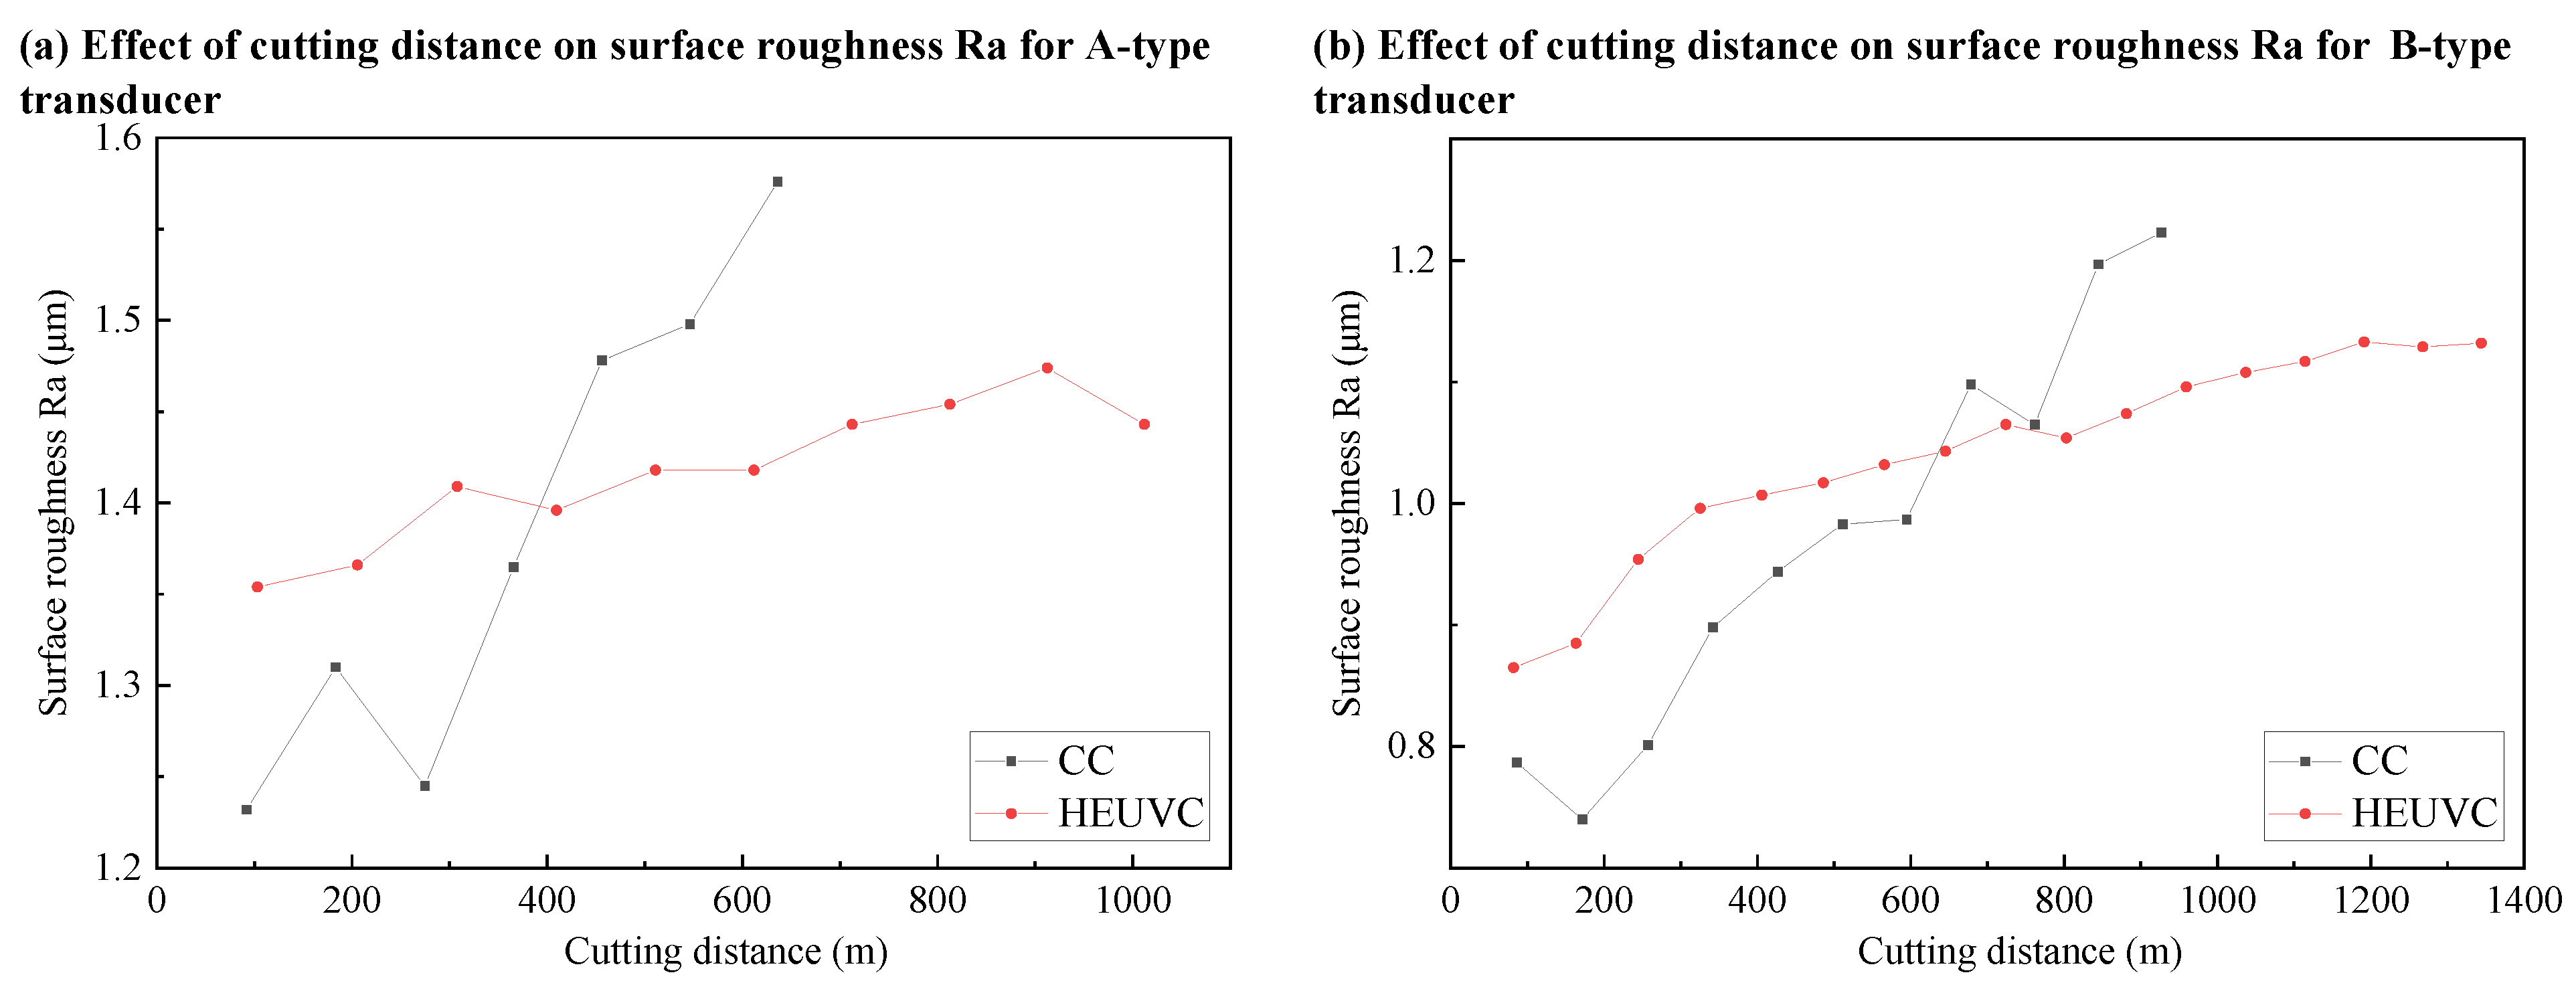
As shown in
Figure 17, the roughness meets the finishing requirement that Ra is less than 1.6 μm. The vibration marks on the machined surface of HEUVC slightly increase the roughness, which can be seen from the roughness value at the initial stage of cutting. With the progress of cutting, the effect of HEUVC reducing cutting temperature and cutting force will reduce the deterioration of the machined surface by tools, thus achieving a lower surface roughness than CC.
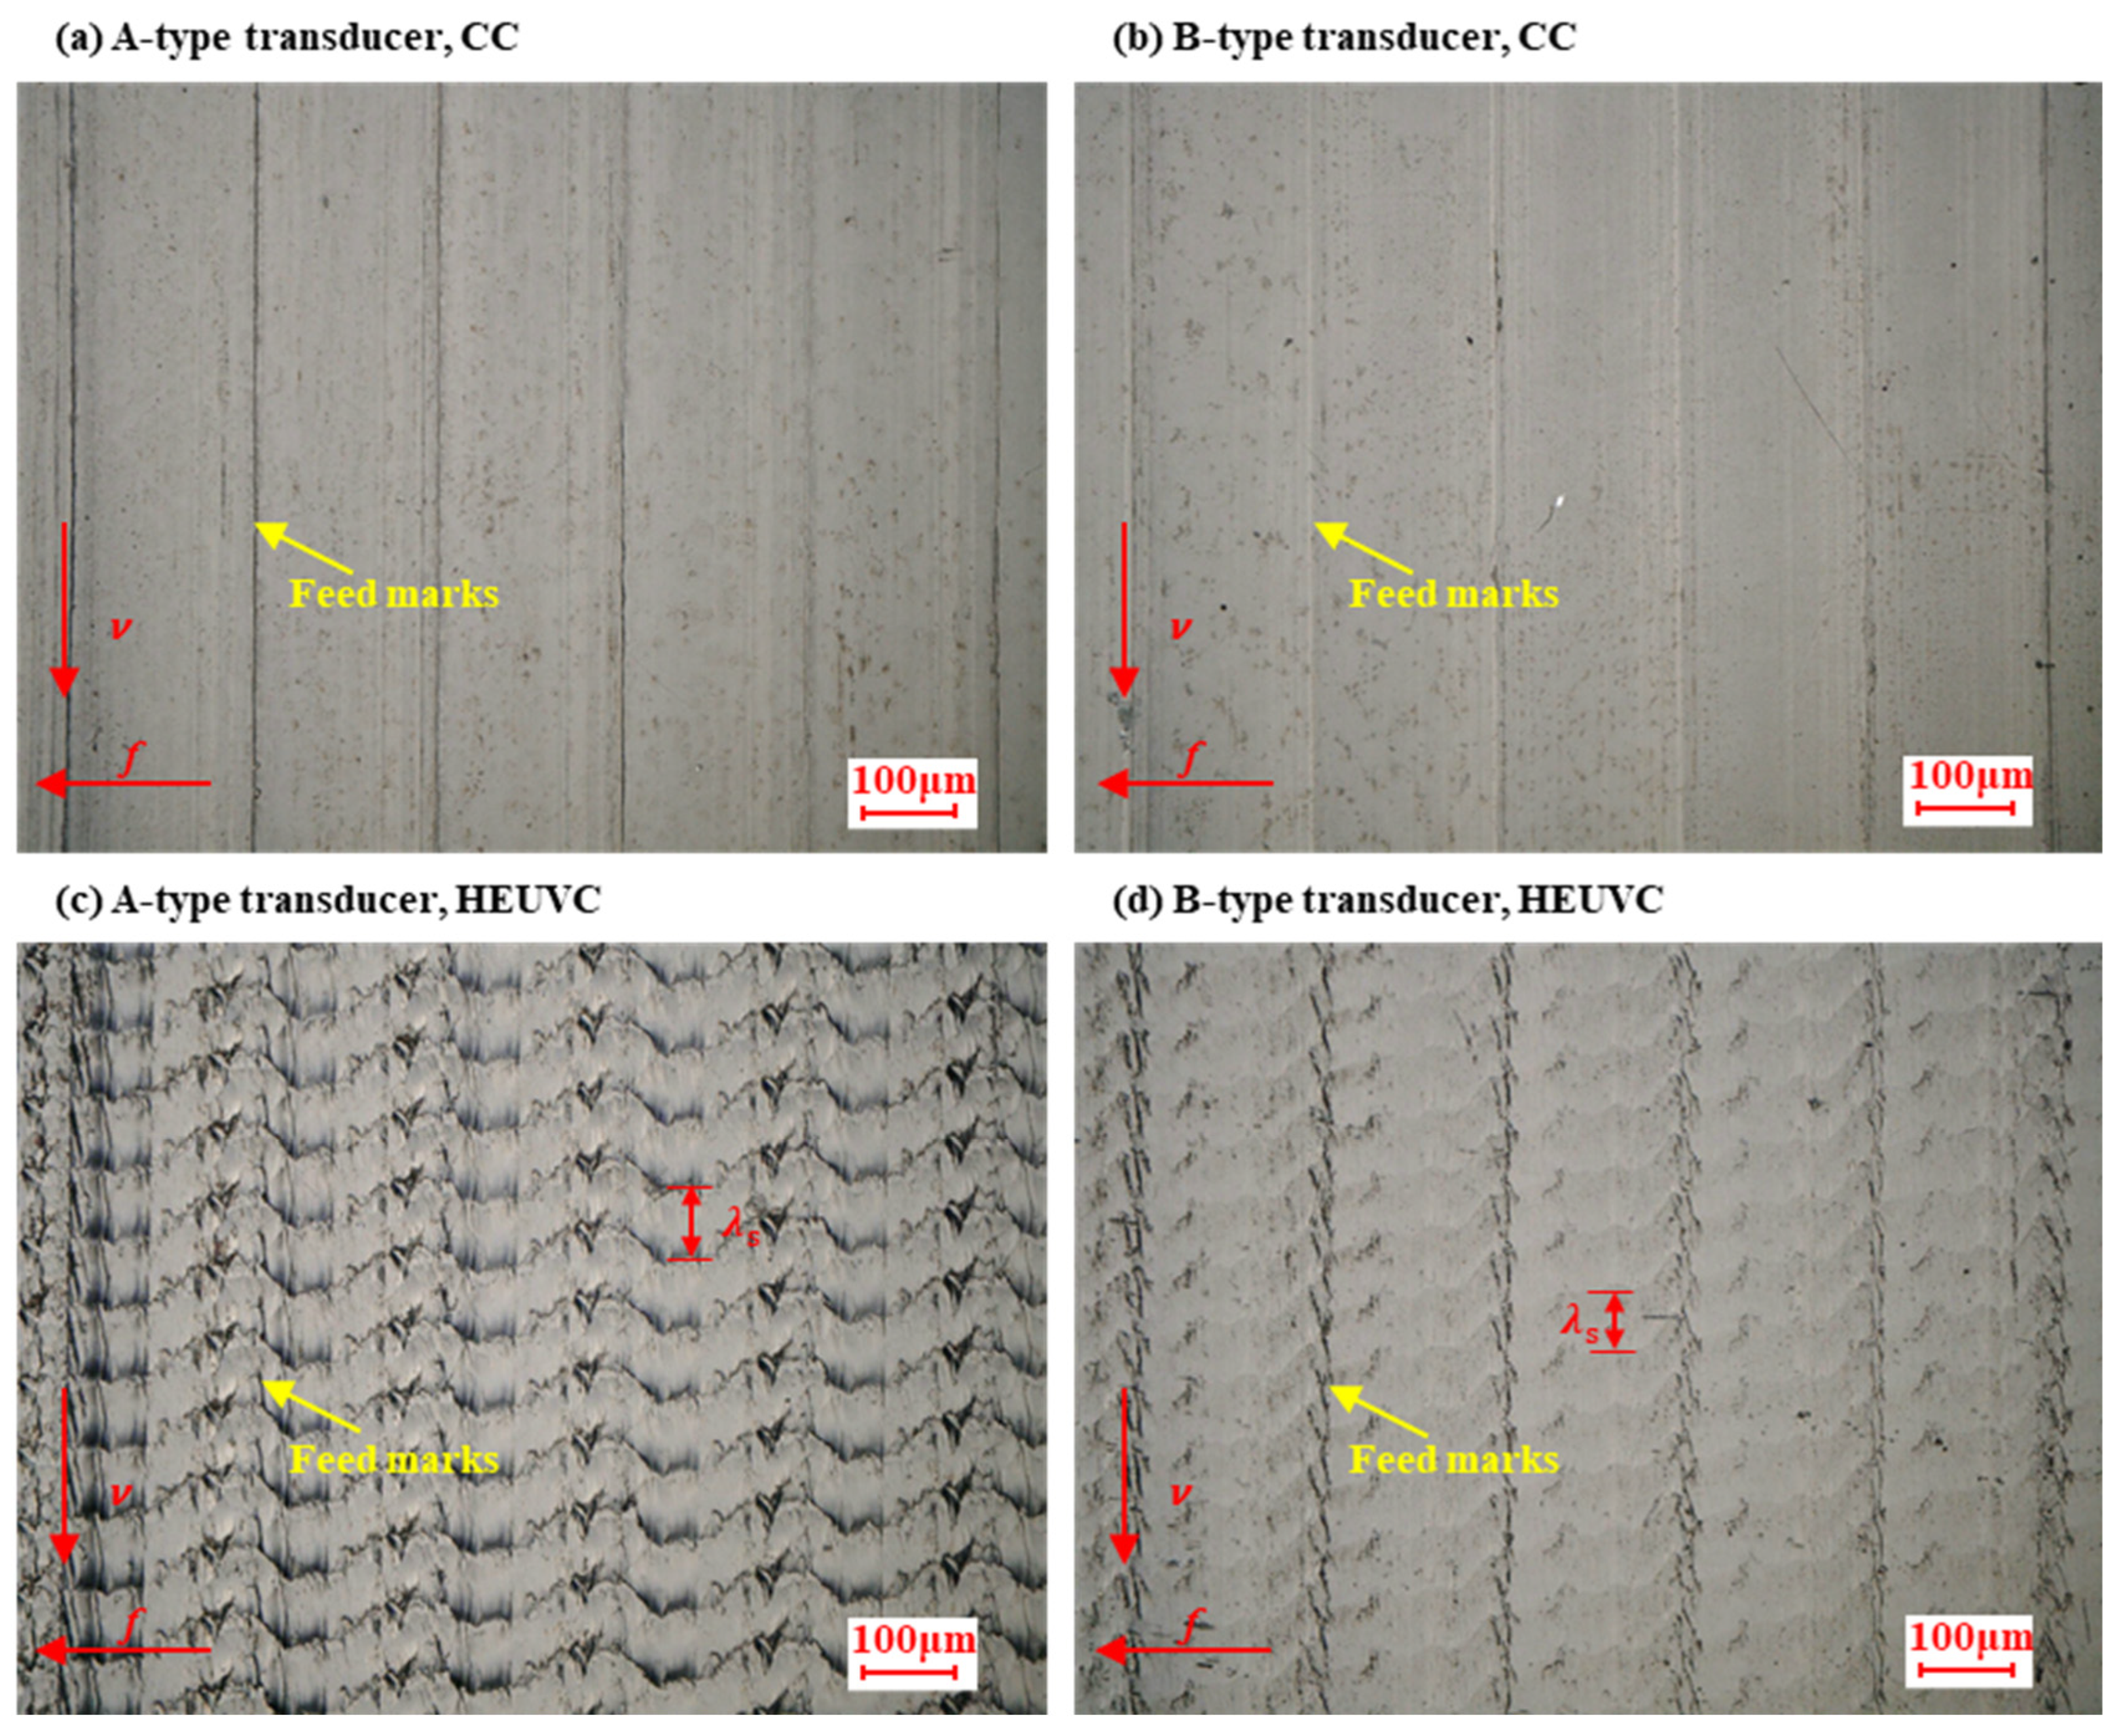
Figure 18 shows topographies of the machined surface of Inconel 718.
Figure 18a,b are topographies of machined surface in CC. The existence of chatter marks is not observed in
Figure 18a,b, which indicates that the designed ultrasonic vibration tool holder has sufficient rigidity. Figure c,d are topographies of machined surfaces in HEUVC. In
Figure 18c,d, the stable ultrasonic vibration trace on the workpiece surface shows that the ultrasonic turning tool holder has a stable resonance characteristic, which shows that the design of elliptical vibration ultrasonic turning tool holder with a bending horn is successful. The wavelength
of ultrasonic vibration in
Figure 18c is 73 μm, which is close to the theoretical calculation of 75 μm. The wavelength
of ultrasonic vibration in
Figure 18d is 63 μm, which is close to the theoretical calculation of 62 μm.


 and
and 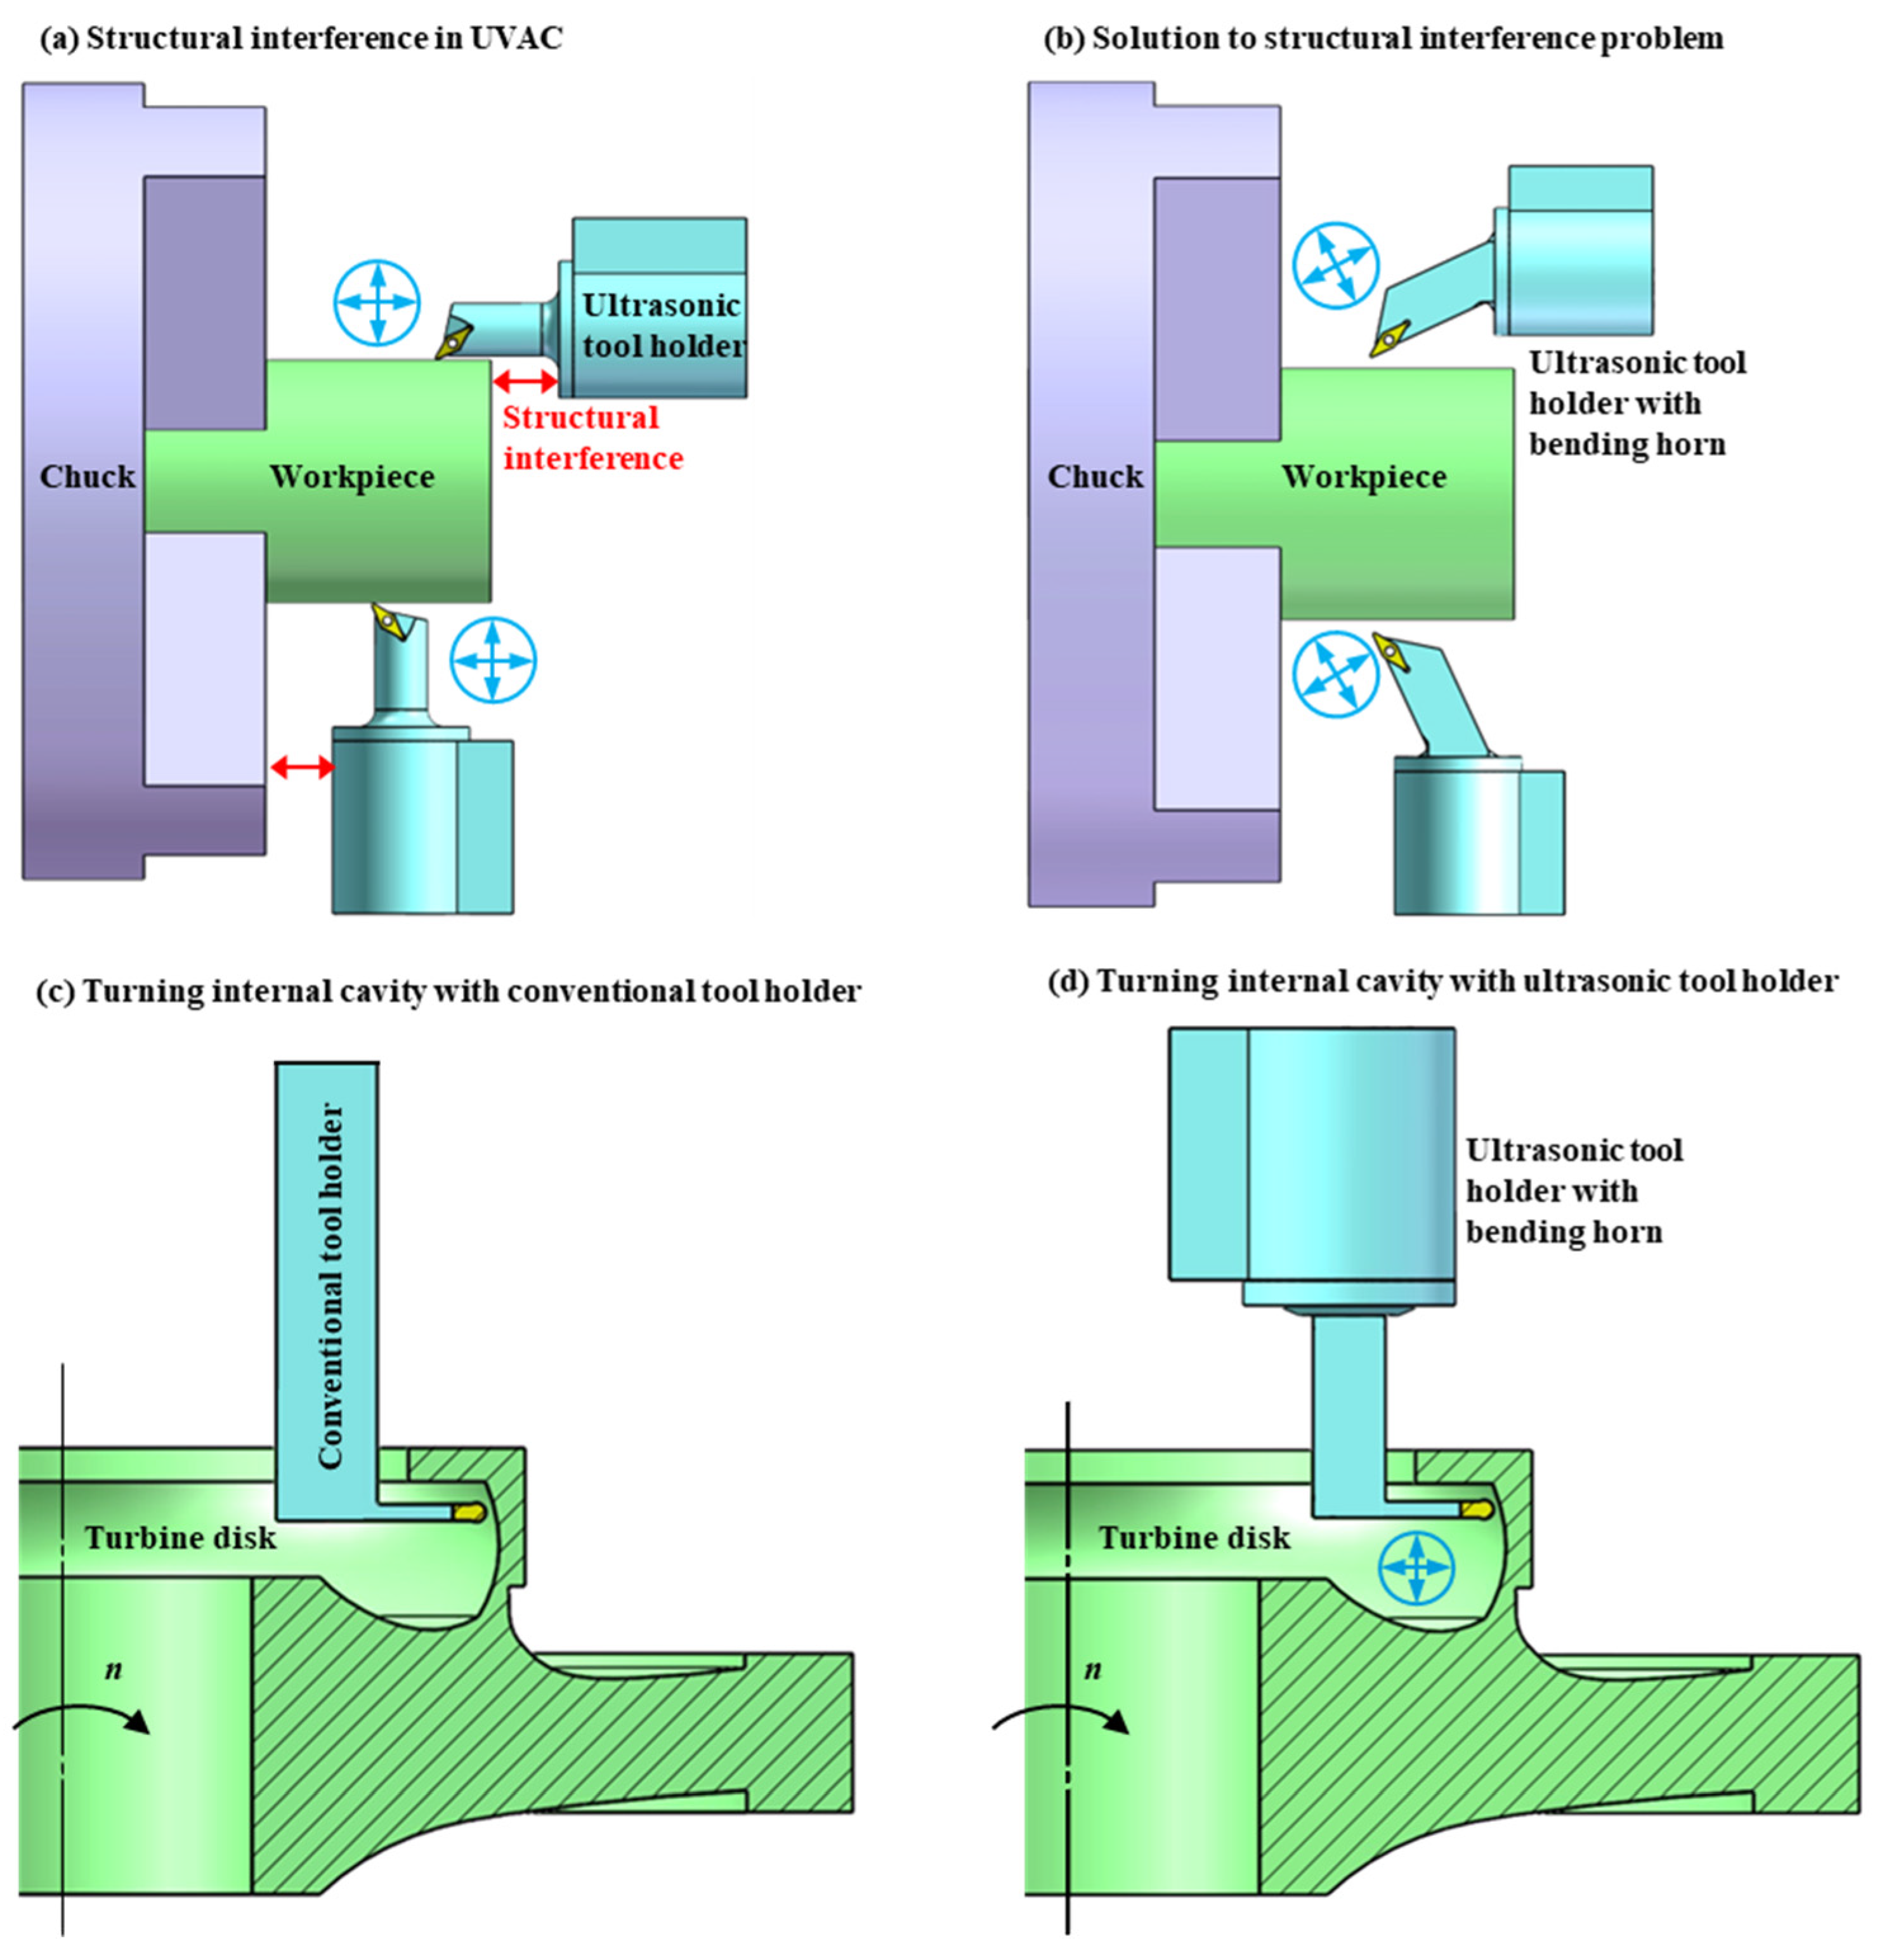


