Article

Multi-Signal Induction Motor Broken Rotor Bar Detection Based on Merged Convolutional Neural Network

1
Faculty of Robot Science and Engineering, Northeastern University, Shenyang 110819, China
2
College of Information Science and Engineering, Northeastern University, Shenyang 110819, China
*
Author to whom correspondence should be addressed.
Actuators 2025, 14(3), 113; https://doi.org/10.3390/act14030113
Submission received: 27 January 2025 / Revised: 15 February 2025 / Accepted: 23 February 2025 / Published: 25 February 2025
(This article belongs to the Section Actuators for Manufacturing Systems)

Abstract

:
Motor fault detection plays a vital role in industrial maintenance. Timely detection of faults in their early stages can prevent catastrophic consequences and reduce maintenance costs. Traditional methods face challenges in motor broken rotor bar (BRB) detection: model-driven methods are difficult to apply accurately in complex and changing environments, while data-driven methods usually require sophisticated feature extraction and classification processes. In this paper, we propose a novel non-invasive fault detection method. The method preprocesses motor currents by Hilbert-Huang Transform (HHT) and Park’s Vector Modulus (PVM) and then uses a merged convolutional neural network (CNN) for classification. This experiment investigates the detection of broken rotor bars of motors with different loads (25%, 50%, 75%, and 100% of rated load) and different fault levels (Normal, 1BRB, 2BRB, 3BRB, and 4BRB). The results show that the model’s classification accuracy exceeds 95% under various operating conditions and can maintain high accuracy under low load conditions, thus addressing the limitations faced by existing methods. In addition, it is computationally efficient and can guarantee high real-time performance. This method combines advanced signal processing techniques and deep learning algorithms to provide a practical solution for motor broken rotor bar detection.

1. Introduction

Industrial motors are a fundamental part of modern production systems. The reliability of them has a direct impact on productivity and operational costs. Three-phase induction motors are more commonly used in industrial production, comprising about 70% of all industrial motors [1]. Regarding energy consumption, it is estimated that more than 50% of the electricity produced globally is used in motors, with induction motors accounting for about 60% of the industrial electrical load [2].
There is a wide range of motor faults, including electrical faults, such as stator faults [3] and broken rotor bars [4], as well as mechanical faults, such as bearing faults [5] and air gap eccentricity [6]. According to an IEEE report [7], about 10% of motor faults are rotor-related.
Many factors can lead to broken rotor bars in large industrial induction motors with copper cages. The main causes are corrosion, vibration, and the thermal expansion of the rotor bars in the axial direction [8]. During motor operation, the rotor is subjected to various stresses from thermal, mechanical, dynamic, and magnetic fields [9,10,11], which act together to cause rotor faults.
In recent decades, motor fault detection methods have developed significantly. They have transitioned from model-driven methods to data-driven methods. Model-driven methods focus on building a mathematical model of a motor based on physical laws and expertise and comparing its expected behavior with actual measured data to identify anomalies [12]. However, such models have major limitations: they are usually device-specific and difficult to adapt to changing operating conditions or new types of faults [13]. These disadvantages limit the widespread use of this approach.
With the advancement of signal processing techniques, data-driven methods have emerged. These methods learn patterns of normal and faulty behaviors directly from historical data to achieve stronger fault detection performance, are highly adaptable to different operating conditions, and can be extended to different types of motors [14]. Among all data-driven methods, motor current signature analysis (MCSA) stands out for its non-invasive nature [15]. In contrast to vibration, thermal, and oil sensors, electrical sensors are typically installed in the motor control cabinet rather than the asset itself, resulting in a safer installation and better protection against operational hazards.
However, early MCSA methods that detect faults by comparing the frequency spectrum of the motor current as it operates to that of the motor’s healthy working state face significant challenges. The accuracy of such methods is easily affected by load variations. It has been shown that, under low load conditions, fault eigenfrequencies become less pronounced [16], which can lead to reduced detection accuracy, and, in some cases, certain faults can only be detected above a certain load level.
To address these challenges, some researchers have used filtering methods [17,18], spectrum subtraction [19], and mathematical morphology [20,21] to preprocess current signals and enhance fault characteristics in the frequency spectrum. However, these methods still cannot completely remove the influence of noise, and some can distort the original data and obscure genuine fault signals. Others have explored time–frequency analysis techniques, such as wavelet transform [22], wavelet packet decomposition (WPD) [23], and MCSA-based Wigner-Ville distribution (WVD) [24]. While these methods can improve feature extraction capabilities, they require extensive parameter tuning, limiting their transferability across different motors. Furthermore, some methods have high computational complexity, which reduces the efficiency of fault detection.
Nonparametric demodulation transformation methods were proposed to overcome these limitations. Classic methods include Park’s Vector Analysis (PVA) [25], Hilbert transformation [26,27], and Teager-Kaiser energy operator (TKEO) [28]. These methods can decompose the original current signal into multiple components, including power fundamental waves, fault harmonics, and environmental noise, thereby highlighting fault features. The disadvantage is that their standalone use often struggles to distinguish similar fault frequencies.
In the traditional MCSA techniques mentioned above, after feature extraction, fault classification is usually performed using manual or rule-based decision-making, which relies on expert knowledge of the fault characteristics. The success of fault detection depends on selecting appropriate features that are both sensitive to faults and robust to noise and operational variability. Artificial Intelligence (AI) methods can solve the problem of the over-complexity of traditional classifiers through model training. AI methods can be divided into two main categories: shallow learning and deep learning. Typical shallow learning methods include fuzzy logic (FL) [29], multi-layer perceptron (MLP) [30], random forest (RF) [31], support vector machine (SVM) [32,33,34], and decision tree (DT) [35]. However, these methods require prior knowledge for manual feature engineering, with classification accuracy suffering without proper preprocessing [15].
Deep learning (DL) methods can automatically learn hierarchical features of input data without the need for manual feature engineering, thus enabling efficient classification of preprocessed signals. Current research includes the convolutional neural network (CNN) [36,37], deep belief network (DBN) [38], autoencoder (AE) [39], generative adversarial network (GAN) [40], and Kolmogorov-Arnold Network (KAN) [41,42]. While some studies have applied one-dimensional CNNs (1D CNNs) directly to raw current signals [43,44], eliminating the need for signal preprocessing, this approach can struggle with complex noise patterns and load variations that are common in industrial settings. In addition, cognitive computing is a more novel approach, and related research can be found in references [45,46].
In this paper, we propose a data-driven approach that hybridizes signal processing techniques with deep learning. We first preprocess the motor current data through HHT and PVM to generate images, which are divided into two labels: Normal and BRB. Then, we use the labeled data to train a merged convolutional neural network for fault classification. We combine the advantages of nonparametric data processing methods and deep learning algorithms to provide a new approach to broken rotor bar detection.
The main contributions of this paper can be summarized in four areas:
  • A non-invasive, data-driven method for broken rotor bar detection is investigated. The method is based on motor currents, does not require invasive sensors, and has a straightforward, practical architecture.
  • The adaptive demodulation transformation method is used for data preprocessing, without complex parameter adjustment. A deep neural network is used as a classifier for fault classification, without manual feature engineering.
  • We demonstrated the robustness of the methodology through comprehensive experimental validation at multiple load levels (25%, 50%, 75%, and 100%) and fault levels (normal and 1-4 broken rotor bars).
  • The metrics to evaluate the computational efficiency of the model training and testing procedures are calculated to demonstrate its real-time performance.
The rest of this paper is organized as follows: Section 2 introduces the theoretical basis of the proposed method. Section 3 introduces the method in detail, including signal preprocessing and CNN architecture. Section 4 introduces the experimental setup and model testing process, presents the experimental results, and discusses them. Finally, Section 5 concludes this paper and proposes future research directions.

2. Theoretical Foundation

2.1. Principles of BRB and MCSA

2.1.1. Physical Structure and Fault Mechanism

The squirrel cage rotor consists of conductive bars which are connected by end rings at each end. During normal operation, the conductive bars carry an induced current that interacts with the rotating magnetic field of the stator to produce torque. The rotor bars are subjected to a variety of stresses generated by thermal, mechanical, and magnetic fields as well as load variations during operation.
A broken rotor bar causes discontinuity in the current path through the rotor cage, which, in turn, leads to redistribution of the current between neighboring bars of the broken rotor bar, resulting in an asymmetrical current pattern in the rotor [47]. Increased current densities in neighboring conductive bars can cause that section to heat up and accelerate its degradation. If the initial fault goes undetected, it can lead to cascading faults.

2.1.2. Electromagnetic Field Effects

A broken rotor bar affects the motor air gap magnetic field in two ways. First, the redistribution of local currents produces an asymmetric magnetic field distribution in the air gap [48,49]. This asymmetry modulates the base magnetic field of the motor as the rotor rotates. The depth of modulation is related to the severity of the fault, with multiple broken bars producing a stronger modulation effect.
Second, an asymmetric current distribution leads to a magnetic imbalance. This imbalance leads to torque pulsations twice the slip rate [50]. The torque pulsation component introduces velocity fluctuations, which, in turn, produce additional modulation of the air gap magnetic field.

2.1.3. Motor Current Signature

A broken rotor bar produces characteristic sidebands on the motor current spectrum. The sidebands are categorized into two types as follows.
1.
Primary Sidebands:
The primary sidebands are given by 1 ± 2 s f s , where f s is the supply frequency and s is the slip. The lower sideband 1 2 s f s represents the counterrotating magnetic field component, and the upper sideband 1 + 2 s f s is caused by speed oscillation [51].
2.
Higher Order Sidebands:
Due to the spatial distribution of the magnetic field and the periodic nature of the fault, the mathematical relationship between slip s and sideband frequencies f s b can be expressed through the general formula [15]:
f s b = 1 ± 2 k s f s         k = 1 , 2 , 3
A motor with broken rotor bars will produce a current with abnormal sideband frequencies. Data preprocessing can transform the raw current data into more meaningful fault classification information. After proper preprocessing of the current, we can highlight the features that distinguish between a normal motor and a faulty motor.

2.2. Hilbert-Huang Transform

Hilbert-Huang Transform (HHT) is a data processing method that combines time–frequency analysis and demodulation transformation. It provides a data-driven approach to analyzing nonlinear and non-stationary signals. This method is adaptive and does not require basis functions like traditional time–frequency analysis methods.

2.2.1. Empirical Mode Decomposition

The HHT begins with Empirical Mode Decomposition (EMD) [52], which adaptively decomposes a signal into Intrinsic Mode Functions (IMFs). Each IMF must satisfy two conditions: the number of extrema and zero crossings must either be equal or differ at most by one; the mean value of the envelope defined by local maxima and local minima must be zero.
The EMD process follows these steps [53]:
  • Initialization:
Set the initial residual r 0 t = x t and the iteration counter i = 1 .
2.
Extrema Identification:
Identify all local maxima and minima of the current residual r i 1 t .
3.
Envelope Generation:
Create an upper envelope e m a x t by interpolating between the local maxima using a cubic spline.
Create a lower envelope e m i n t by interpolating between the local minima using a cubic spline.
4.
Mean Envelope Calculation:
Calculate the mean envelope m i 1 t as the average of the upper and lower envelopes:
m i 1 t = e m a x t + e m i n t 2
5.
Detail Extraction:
Subtract the mean envelope from the current residual to obtain a candidate IMF h i 1 , k t :
h i 1 , k t = r i 1 t m i 1 t
where k is the inner iteration counter, initialized to 1 for each new IMF.
6.
IMF Check (Inner Loop):
Check if h i 1 , k t satisfies the IMF conditions.
If h i 1 , k t satisfies the conditions, it is considered an IMF. Proceed to step 7.
If h i 1 , k t does not satisfy the conditions, increment k   k = k + 1 , set r i 1 t = h i 1 , k 1 t , and repeat steps 2–5 (inner loop). This inner loop sifts h until it meets the IMF criteria. A common stopping criterion for this inner loop is to ensure that the standard deviation (SD) between successive sifting results, calculated as follows, is below a predefined threshold (usually between 0.2 and 0.3) [54].
S D = t = 0 T h i 1 , k 1 t h i 1 , k t 2 h i 1 , k 1 2 t
7.
IMF Extraction and Residual Update:
Once an IMF, c i t , is found (i.e., h i 1 , k t becomes an IMF), store it:
c i t = h i 1 , k t
Update the residual:
r i t = r i 1 t c i t
8.
Outer Loop Iteration:
Increment the IMF counter ( i = i + 1 ).
9.
Stopping Criterion (Outer Loop):
If the residual r i t becomes monotonic or if the number of IMFs reaches a predefined limit, the decomposition is complete.
Otherwise, set r i 1 t = r i t and return to step 2.
The EMD process results in a decomposition of the original signal x t into n IMFs, c i t , and a final residual, r n t :
x t = i = 1 n c i t + r n t
where r n t represents the overall trend of the signal. The IMFs are nearly orthogonal and represent different oscillatory modes embedded in the original signal, ordered from high frequency to low frequency.

2.2.2. Hilbert Transform and Instantaneous Frequency

After obtaining IMFs, perform Hilbert transform on each IMF. For an IMF x(t), its Hilbert transform y(t) is as follows:
y t = 1 π P . V . x τ t τ d τ
where the P.V. refers to the principal value, which handles the singularity at τ = t in the integrand.
The analytic signal z(t) is then formed:
z t = x t + j y t = A t e j θ t
where A(t) is instantaneous amplitude and θ(t) is the instantaneous phase.
The instantaneous frequency is calculated as follows:
f t = 1 2 π d θ t d t
Finally, different colors are used to represent the instantaneous frequency of each IMF at each moment to generate the HHT spectrum.
Figure 1a shows all the IMFs generated by a current signal after EMD, and Figure 1b is the HHT spectrum generated by IMF after Hilbert transform. The horizontal axis represents time (from 0 to 0.167 s), and the vertical axis represents the IMF index (from 0 to 8), where lower indexes correspond to high-frequency components and higher indexes correspond to low-frequency components. The color intensity follows the logarithmic frequency distribution law, representing the instantaneous frequency corresponding to the horizontal axis time, red for high frequency and blue for low frequency. This color distribution pattern can better highlight the fault characteristic frequencies with smaller amplitudes.

2.2.3. Computer Algorithm for Calculating the Analytic Signal

When using a computer to calculate the Hilbert transform, to improve the calculation efficiency, the following algorithm is used for calculating the analytic signal z(t):
  • x ← array(x)
  • Xf ← fft(x)
  • h ← zeros
  • if N%2 = 0 then:
    h[0], h[N/2] ← 1, 1
    h[1:N/2] ← 2
  • else: h[0]←1; h[1:(N + 1)/2] ← 2
  • z ← ifft(Xf⋅h, axis)
  • return z
where x is the input real-valued signal, which needs to be converted to an array, fft is fast Fourier transform, and ifft is inverse Fourier transform. N defaults to the length of the input signal, and axis defaults to −1. For more details, please refer to [55].

2.3. Park’s Vector Analysis

Park’s Vector Analysis (PVA) is a classical demodulation transformation method that converts three-phase currents ( i a , i b , i c ) into a two-dimensional vector ( i d , i q ) [56]. This method is well suited for steady state analysis as it demodulates the modulated current of a faulty motor, removes the fundamental component, and highlights the fault features for effective fault detection. Park’s transform is given by the following equations:
i d = 2 3 i a 1 2 i b 1 2 i c
i q = 1 3 i b i c
The PVM is the modulus of Park’s vector and is given by the following equation:
P V M = i d 2 + i q 2
The ordinary PVA image is the trajectory of the point ( i d , i q ) in the coordinate system, which is close to a hexagonal pattern, while the PVM image has the motor current sampling points on the horizontal axis and the corresponding PVM values on the vertical axis. As shown in Figure 2, the PVA images of normal and faulty motors show slight geometric differences, while the PVM images show more obvious differences in oscillation characteristics, which are easier to capture with deep learning models.

2.4. Convolutional Neural Network Architecture

2.4.1. Convolutional Layer

Convolutional layer is the basic structure of CNN, performing feature extraction through kernels sliding across input data. For an input feature map x and kernel w, the convolution operation at position i , j is computed as follows:
y i , j = m = 0 k 1 n = 0 k 1 x i + m , j + n w m , n + b
where k is the kernel size, x i + m , j + n is the value of the input feature map at position i + m , j + n , w m , n is the kernel at position m , n , and b is the bias term. Multiple kernels of the CNN run in parallel to learn different feature representations. Each kernel is specialized to detect specific patterns such as edges and textures. The size of the output feature map is determined by the kernel size, stride s , and padding parameter p , which is computed as follows:
output   size = input   size k + 2 p s + 1

2.4.2. Pooling Layer

Pooling layers reduce spatial dimensions while retaining important features through downsampling [57]. The merged CNN proposed in this paper adopts max pooling, which outputs the maximum value within a sliding window:
y i , j = max x i + m , j + n         0 m < h , 0 n < w
where h and w define the pooling window size. Pooling contributes to achieving translation invariance by decreasing feature map dimensions while preserving dominant features. Reducing dimensionality helps prevent overfitting, improve model generalization, and lower computational complexity.

2.4.3. Fully Connected Layer

The fully connected layer receives flattened feature maps and performs high-level reasoning through dense connections [57]. Each neuron connects to all neurons in the previous layer, computing the following:
y i = j = 1 n w i j x j + b i
where w i j represents the connection weight between the j -th neuron in the previous layer and the i -th neuron in the current layer, x j is the output from the j -th neuron of the previous layer, and b i is the bias term for the i -th neuron in the current layer.

2.4.4. Mish Activation Function

Mish activation provides smooth, non-monotonic behavior beneficial for deep networks [58], defined as follows:
M i s h x = x tanh ln 1 + e x
This self-regularizing function has the advantages of zero centering, unbounded positive values, and bounded negative values. Its smoothness helps the gradient flow during back-propagation, allowing better information flow than the traditional ReLU activation function, which is especially beneficial for deep architectures.

2.4.5. Model Training Process

Training optimizes network parameters through backpropagation using categorical cross-entropy loss:
L = i = 1 C y true , i log y pred , i
where C is the number of classes, y true , i is the true probability distribution (usually 1 for the correct class, 0 for others), and y p r e d , i is the predicted probability distribution from the network.
The Adaptive Moment Estimation (Adam) optimizer [59] adjusts parameters using adaptive learning rates:
θ t + 1 = θ t α m t ^ v t ^ + ϵ
where θ t is the parameter at time step t , α is the learning rate, m t ^ and v t ^ are bias-corrected moment estimates for the first and second moments of the gradients, and ϵ is a small constant to prevent division by zero.

2.4.6. Merged Model Architecture

The merged architecture combines parallel convolutional neural networks (streams), processes multiple inputs, and fuses their features before the final classification [60].
Let F 1 represent the final feature map tensor produced by the HHT processing stream before flattening, and F 2 represent the final feature map tensor from the PVM stream. These feature map tensors are first flattened into one-dimensional vectors: v 1 = f l a t t e n F 1 ; v 2 = f l a t t e n F 2
The f l a t t e n ( ) operation reshapes the tensors into vectors by concatenating their elements. These flattened vectors are then concatenated to create a single, combined feature vector, v c o m b i n e d = v 1 ; v 2 , where [ ; ] denotes concatenation. v c o m b i n e d is then used as the input to the first fully connected layer, as described in Section 2.4.3.

3. Proposed Methodology

3.1. Data Collection and Segmentation

The experiment collects current signals in a total of 20 different operating states on a real industrial motor (For the motor dataset, please refer to the website https://new.abb.com/cn/innovation/2024-abb-cup-innovation-contest/MO-contest, accessed on 2 January 2025): normal operation and four levels of broken rotor bar faults (1–4 BRB) combined with four different loads (25%, 50%, 75%, and 100% of rated load).
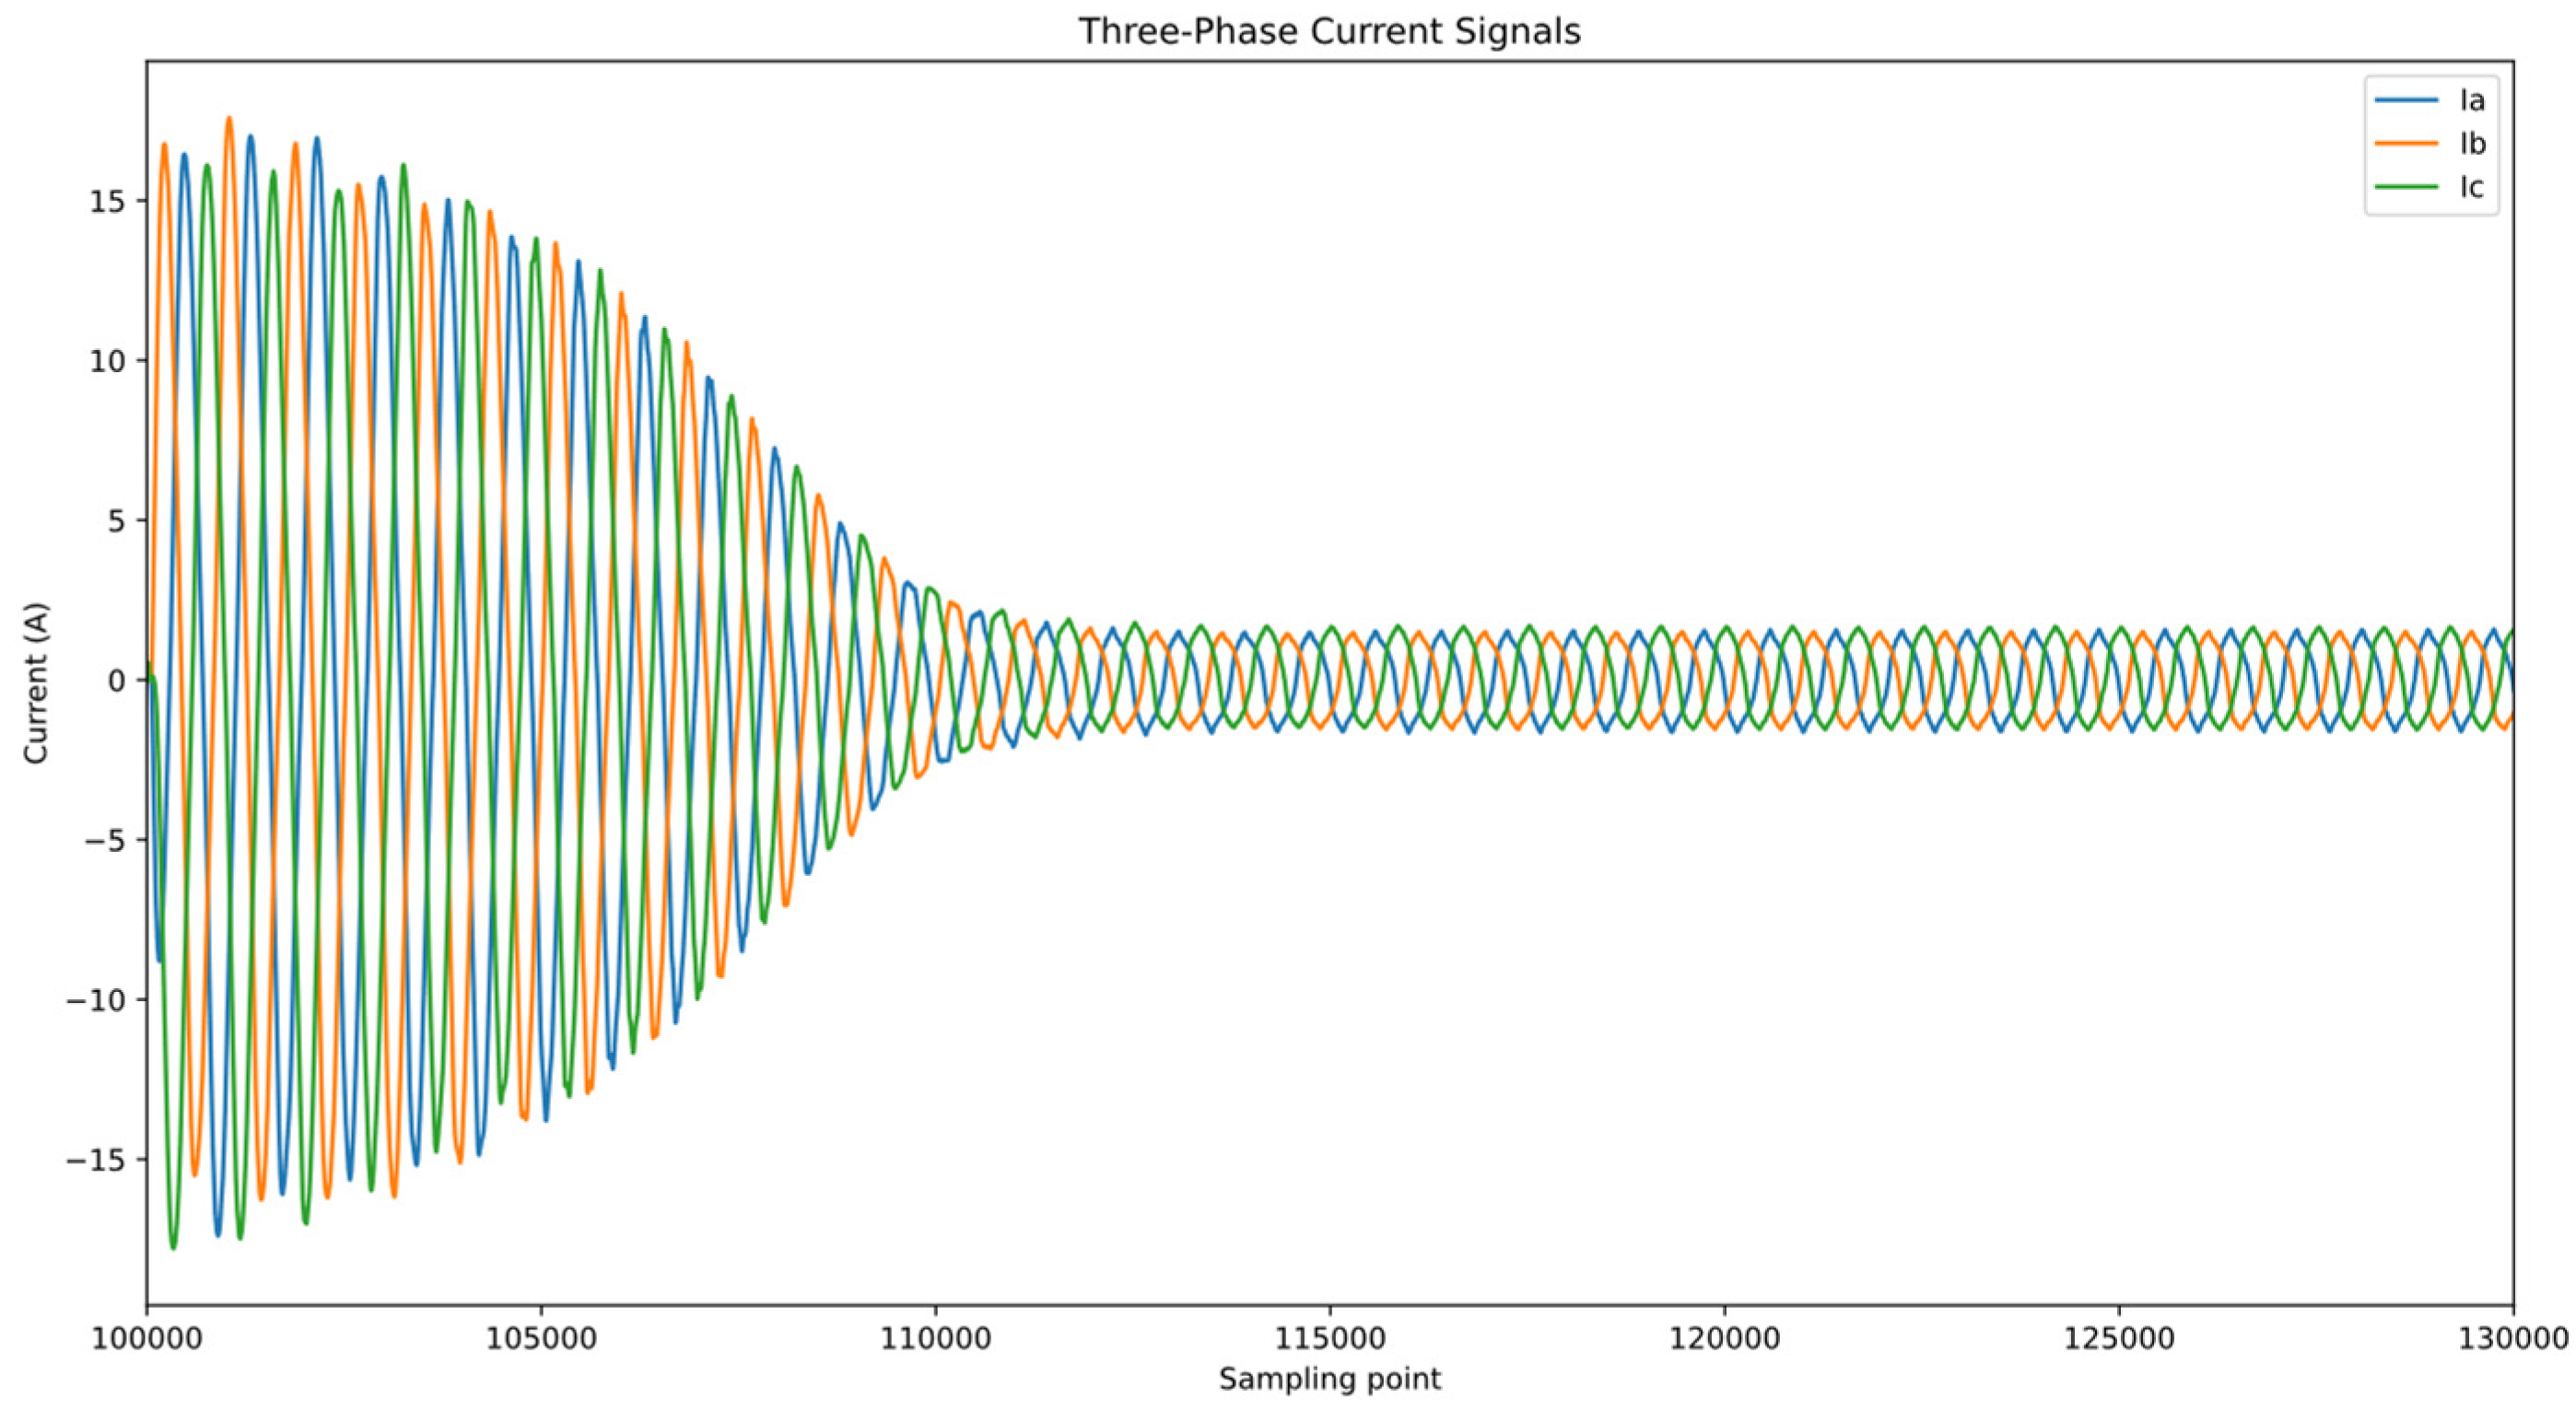
The motor current data used in this experiment come from real motors, not simulated data, and already contain common noise. As can be seen from Figure 3, the current waveform is not a completely smooth sine curve.
The power frequency of the motor is 60 Hz. The current sensor samples the motor current at a sampling frequency of 50,000 Hz. The motor current is sampled for 20 s in each operating state, including the motor start-up transient and the steady state. Figure 3 shows the sampled signals of the motor from start-up transient (sampling point 100,000–112,000) to steady state (sampling points after 112,000). This experiment only uses steady-state motor currents.
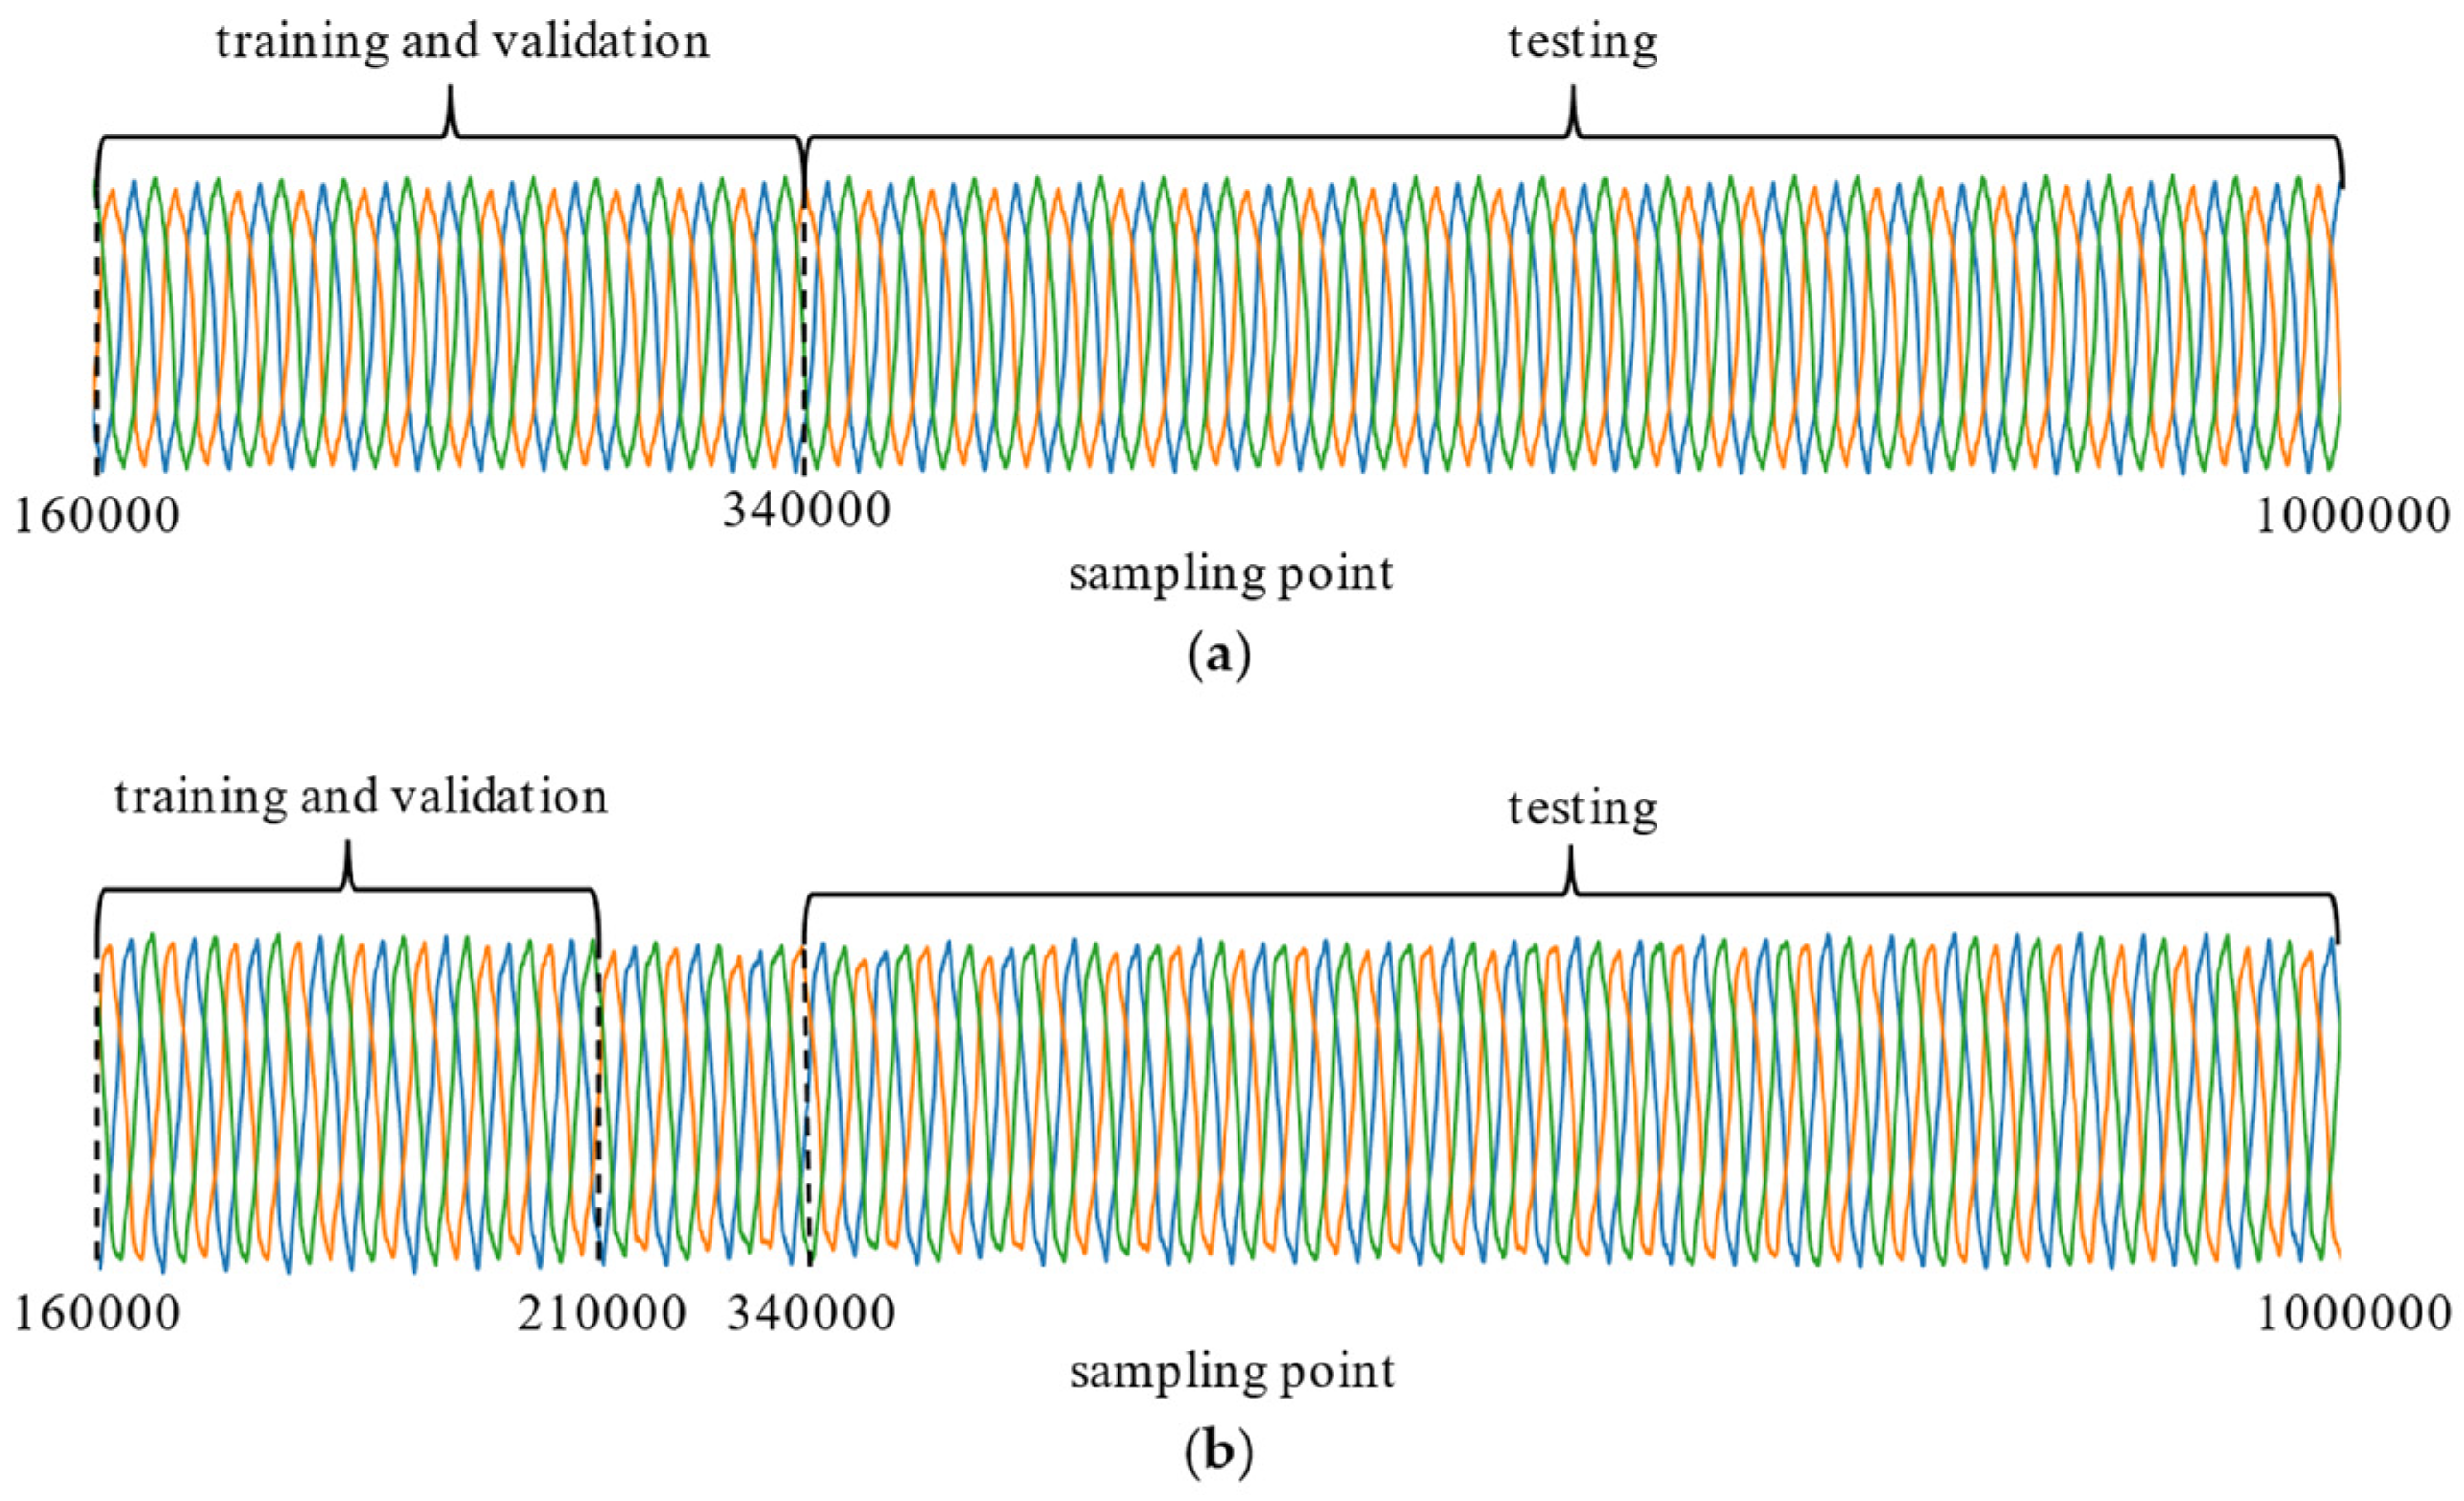
We use a sliding window of 8333 data points in length for data segmentation (corresponding to approximately 10 power cycles, capturing the full periodic behavior of the current signal), with a sliding step of 833 data points (approximately one power cycle). As shown in Figure 4, for normal motor current, approximately the 160,000th (about 1 s after the motor enters steady state) to 340,000th data points are used for model training, generating a total of 800 pairs of training data (will be further divided into training and validation datasets), and the data points after the 340,000th are used for model testing. For faulty motor currents, from the 160,000th to the 210,000th data points are used for model training and validation, also generating a total of 800 pairs of training data, and the data points after the 340,000th are used for model testing. All current data contain a total of approximately 1,000,000 data points. The training set is used to train the model, the validation set is used to adjust hyperparameters and monitor overfitting, and the testing set is used to finally evaluate the model performance.

3.2. Data Preprocessing

In the data preprocessing stage of the experiment, we use HHT to process single-phase current and PVM to process three-phase current. Both data processing methods are used to process the steady-state current.
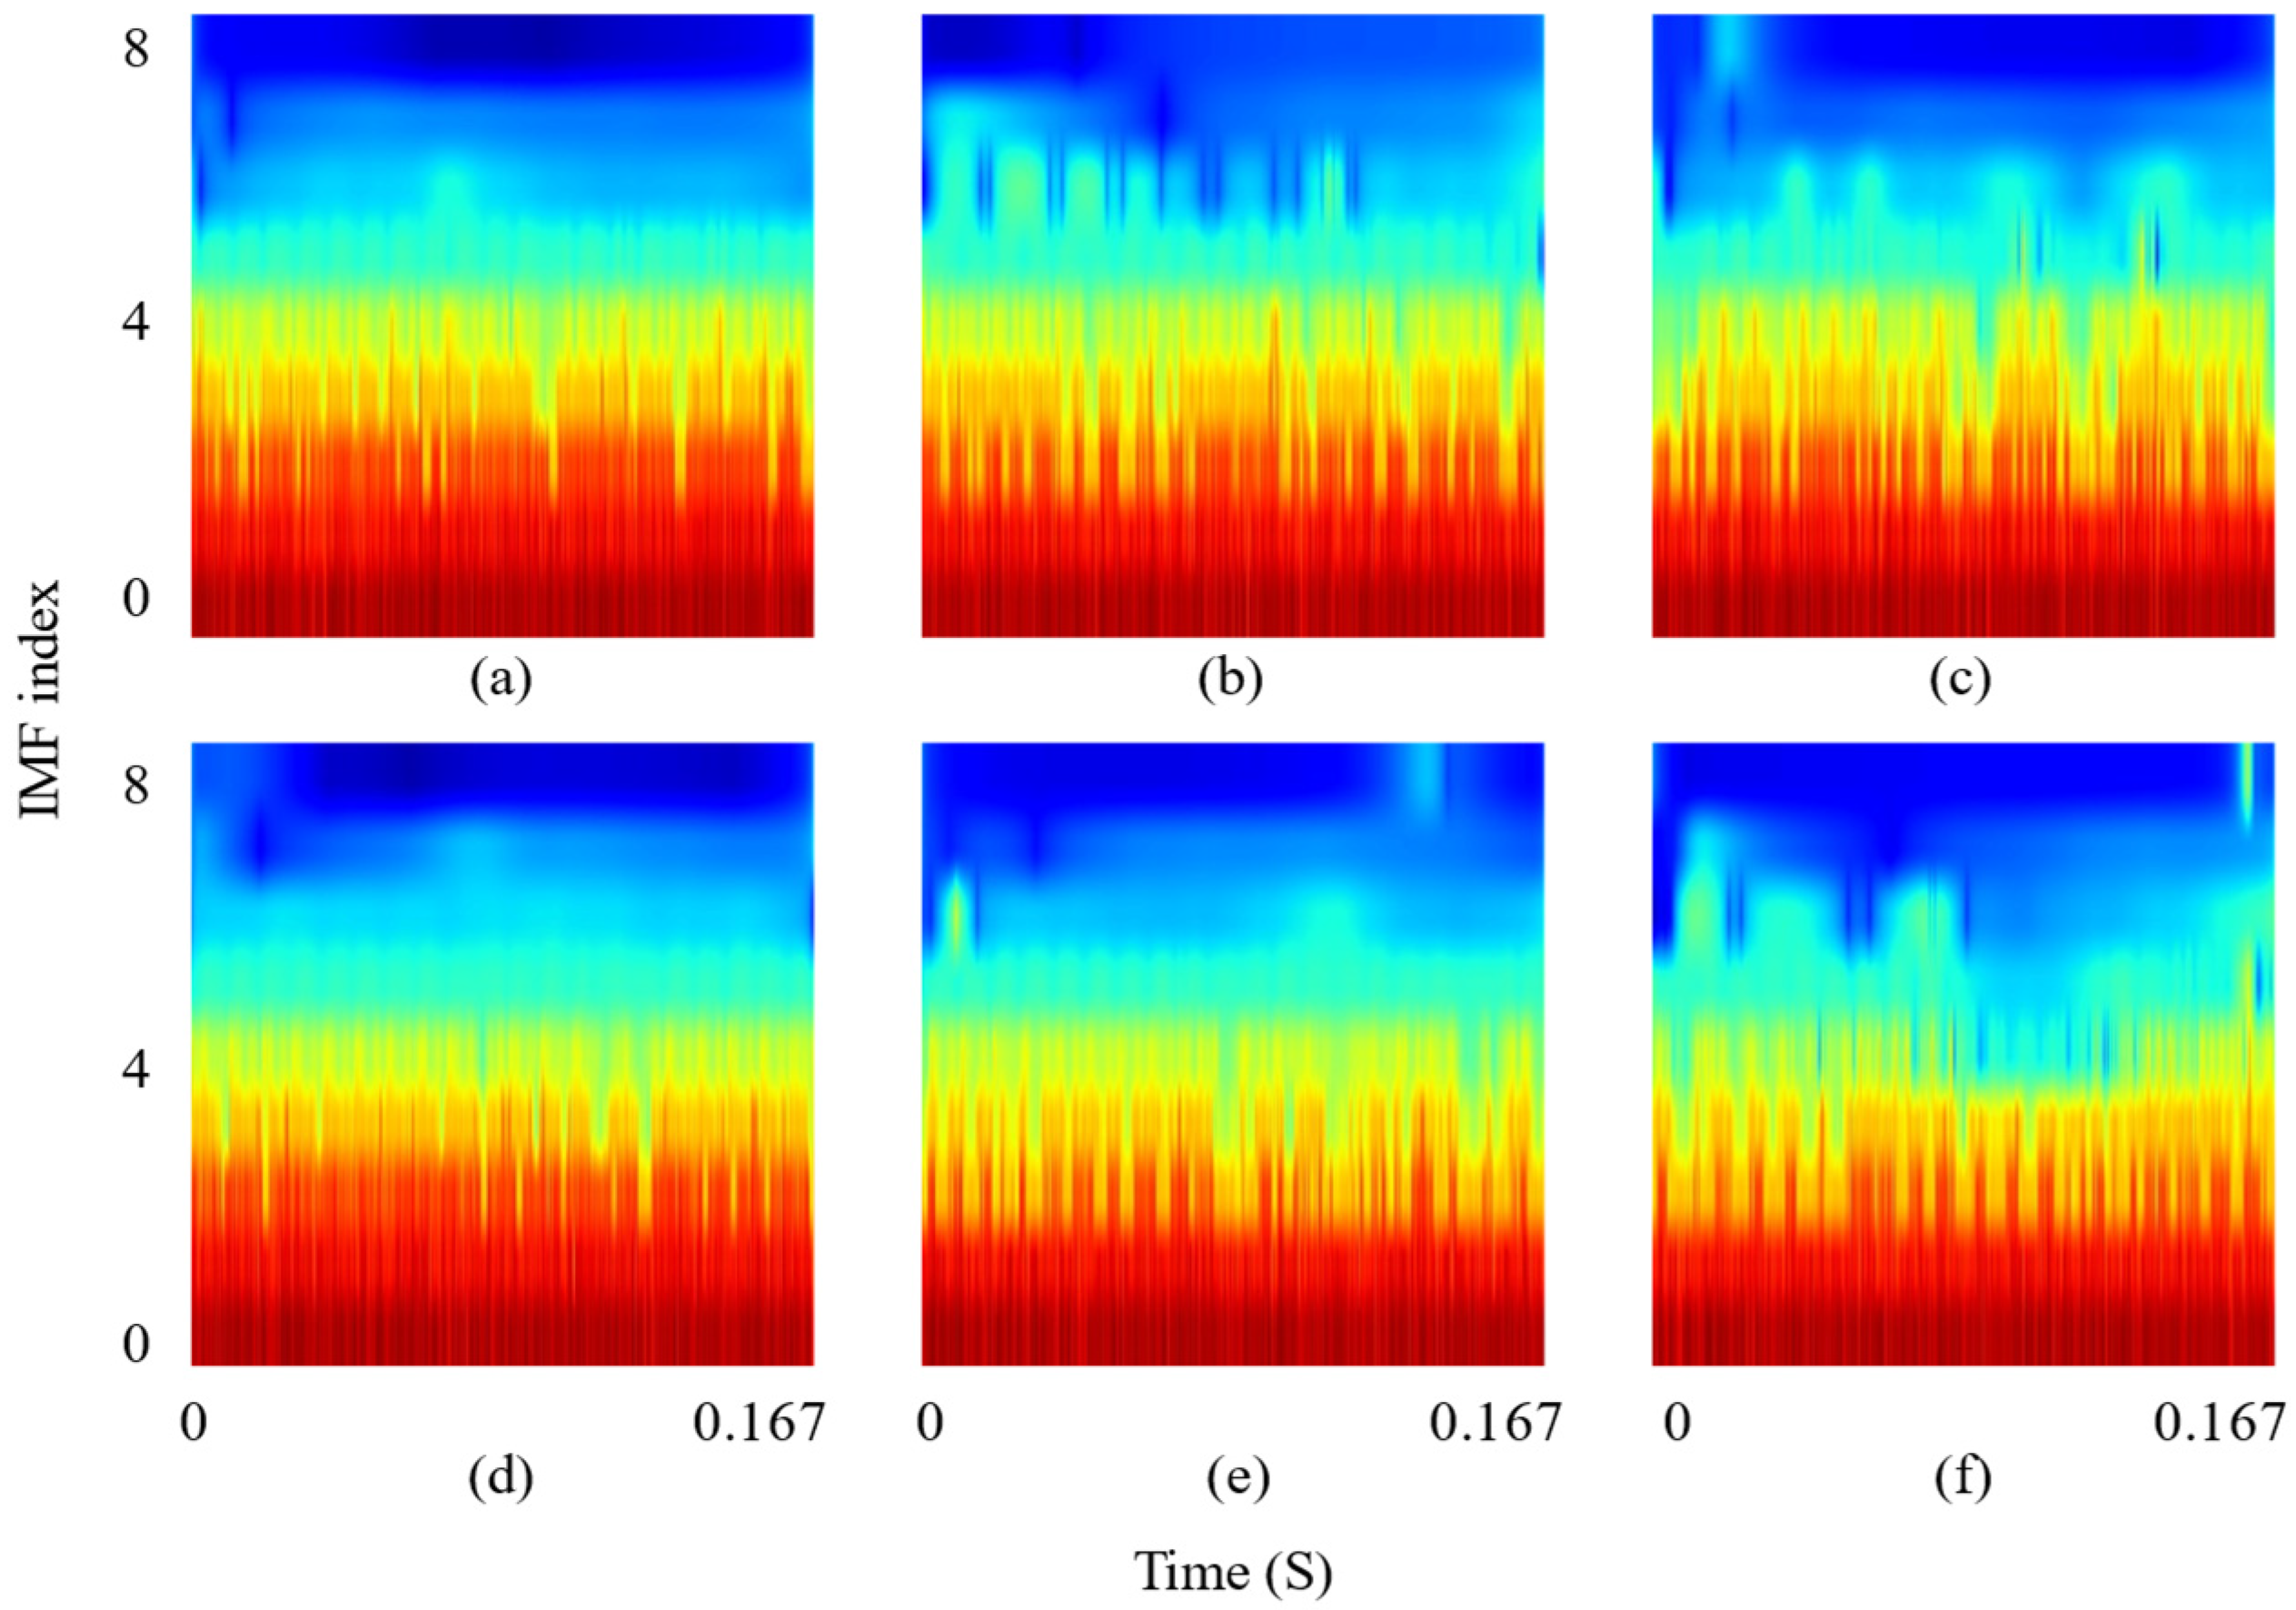
In Figure 5, the HHT spectrum clearly shows the modal structure of the motor current. From this, we can distinguish the abnormal modes of faulty motors.
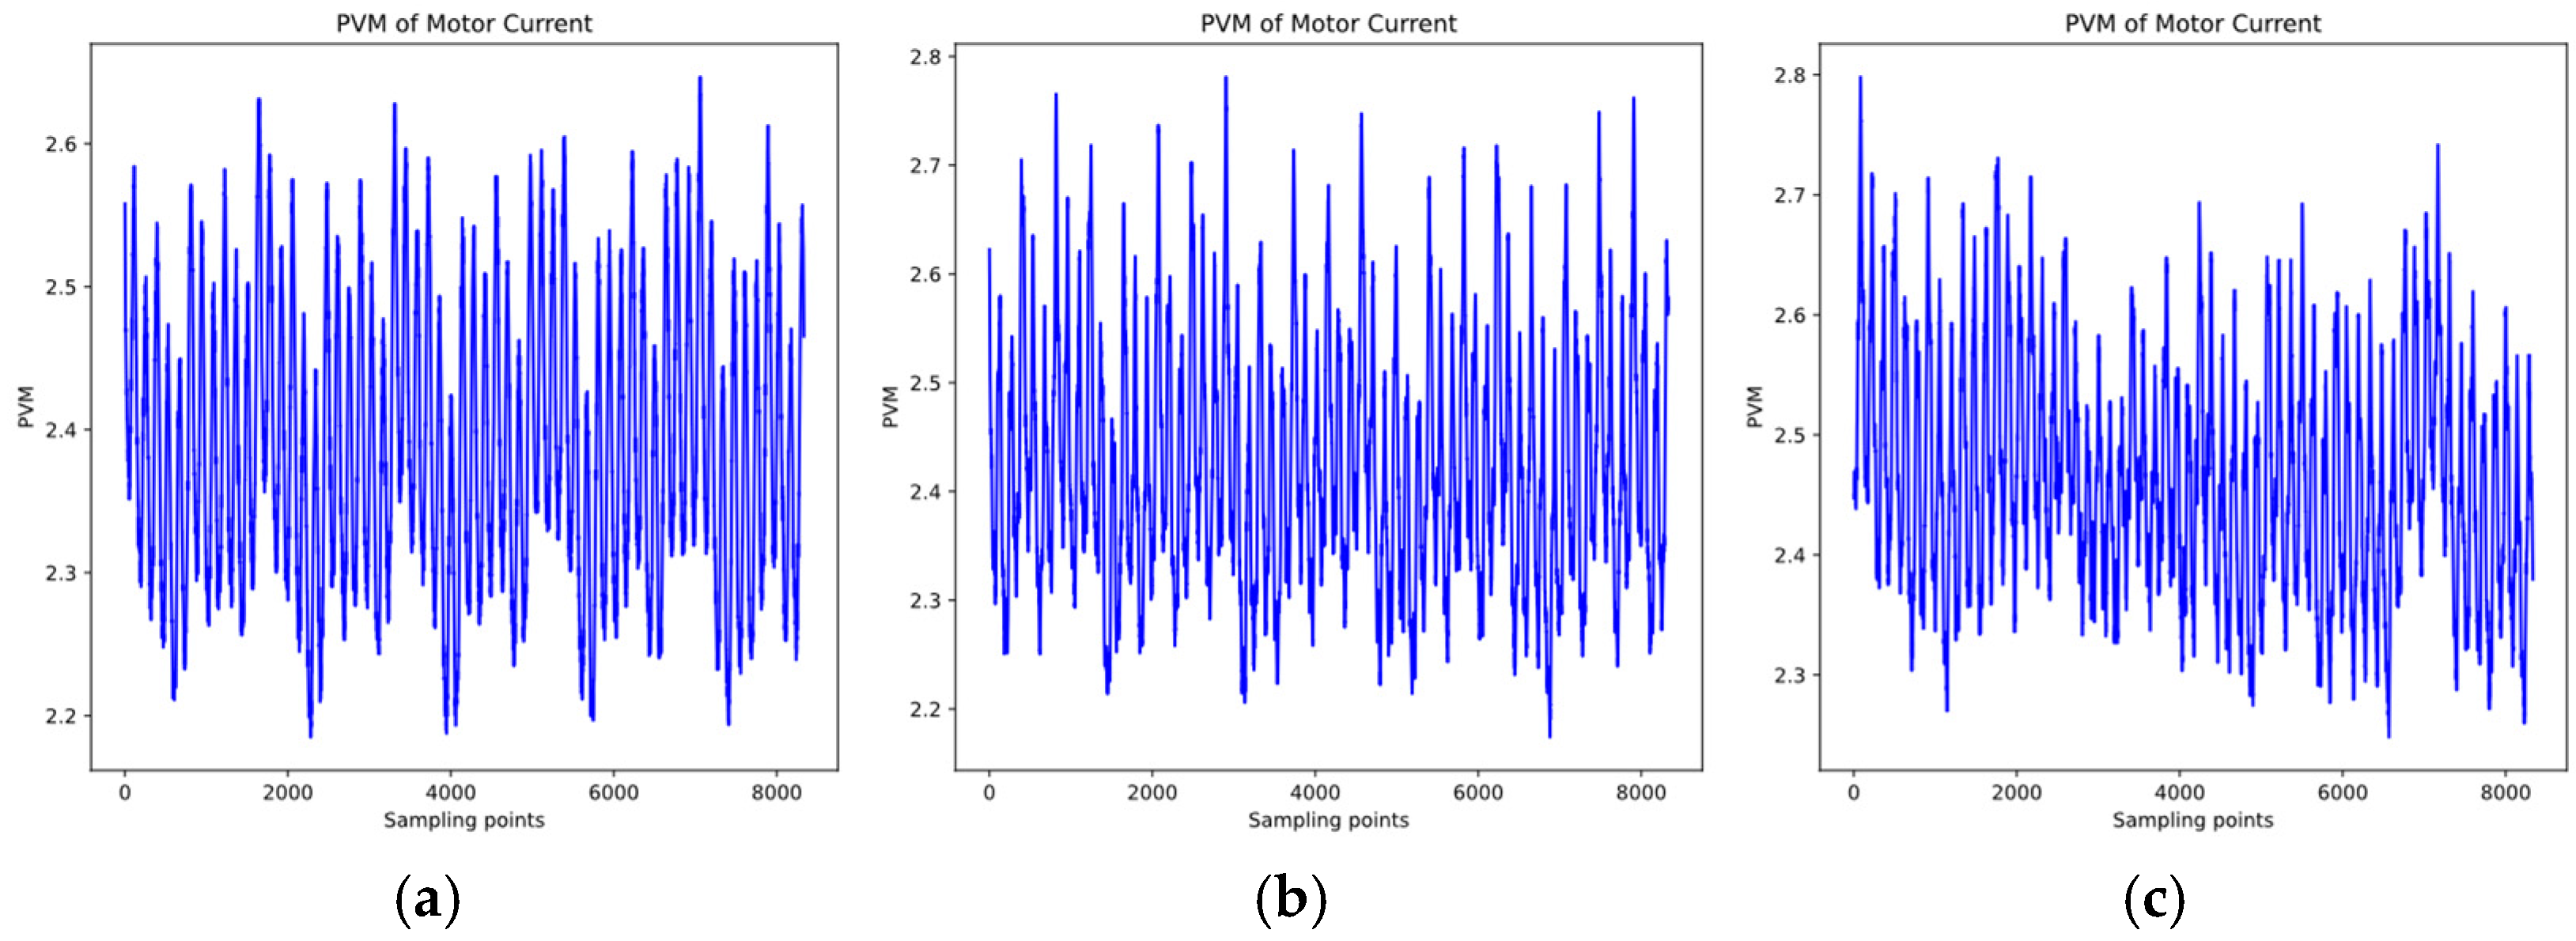
PVA acts as an excellent demodulator for fault-related current components. As shown in Figure 6a, the PVM shows a relatively consistent oscillation pattern, and the modulation envelope is more uniform. This is a characteristic of normal motor operation. In contrast, the PVM in Figure 6b,c show obvious differences: the oscillation range is increased overall, and the oscillation pattern has no obvious periodicity, reflecting the obvious characteristics of a faulty motor.

3.3. Deep Learning Architecture

Figure 7 shows the whole process of model training. The process first acquires and segments data and then preprocesses the segmented data to generate HHT and PVM images as training datasets. The training datasets consist of the following: 800 HHT plots of normal motors, 800 HHT plots of faulty motors, 800 PVM plots of normal motors, and 800 PVM plots of faulty motors. Each set contains four load levels. In the training process, the datasets are divided into two labels: Normal and BRB. In this case, 1–4 BRB are all counted as “BRB”. Both labels contain 800 HHT images and 800 PVM images, respectively. Then, we convert them into 128 × 128 grayscale images as CNN input for model training. After model training, the model parameters are saved for subsequent experiments.
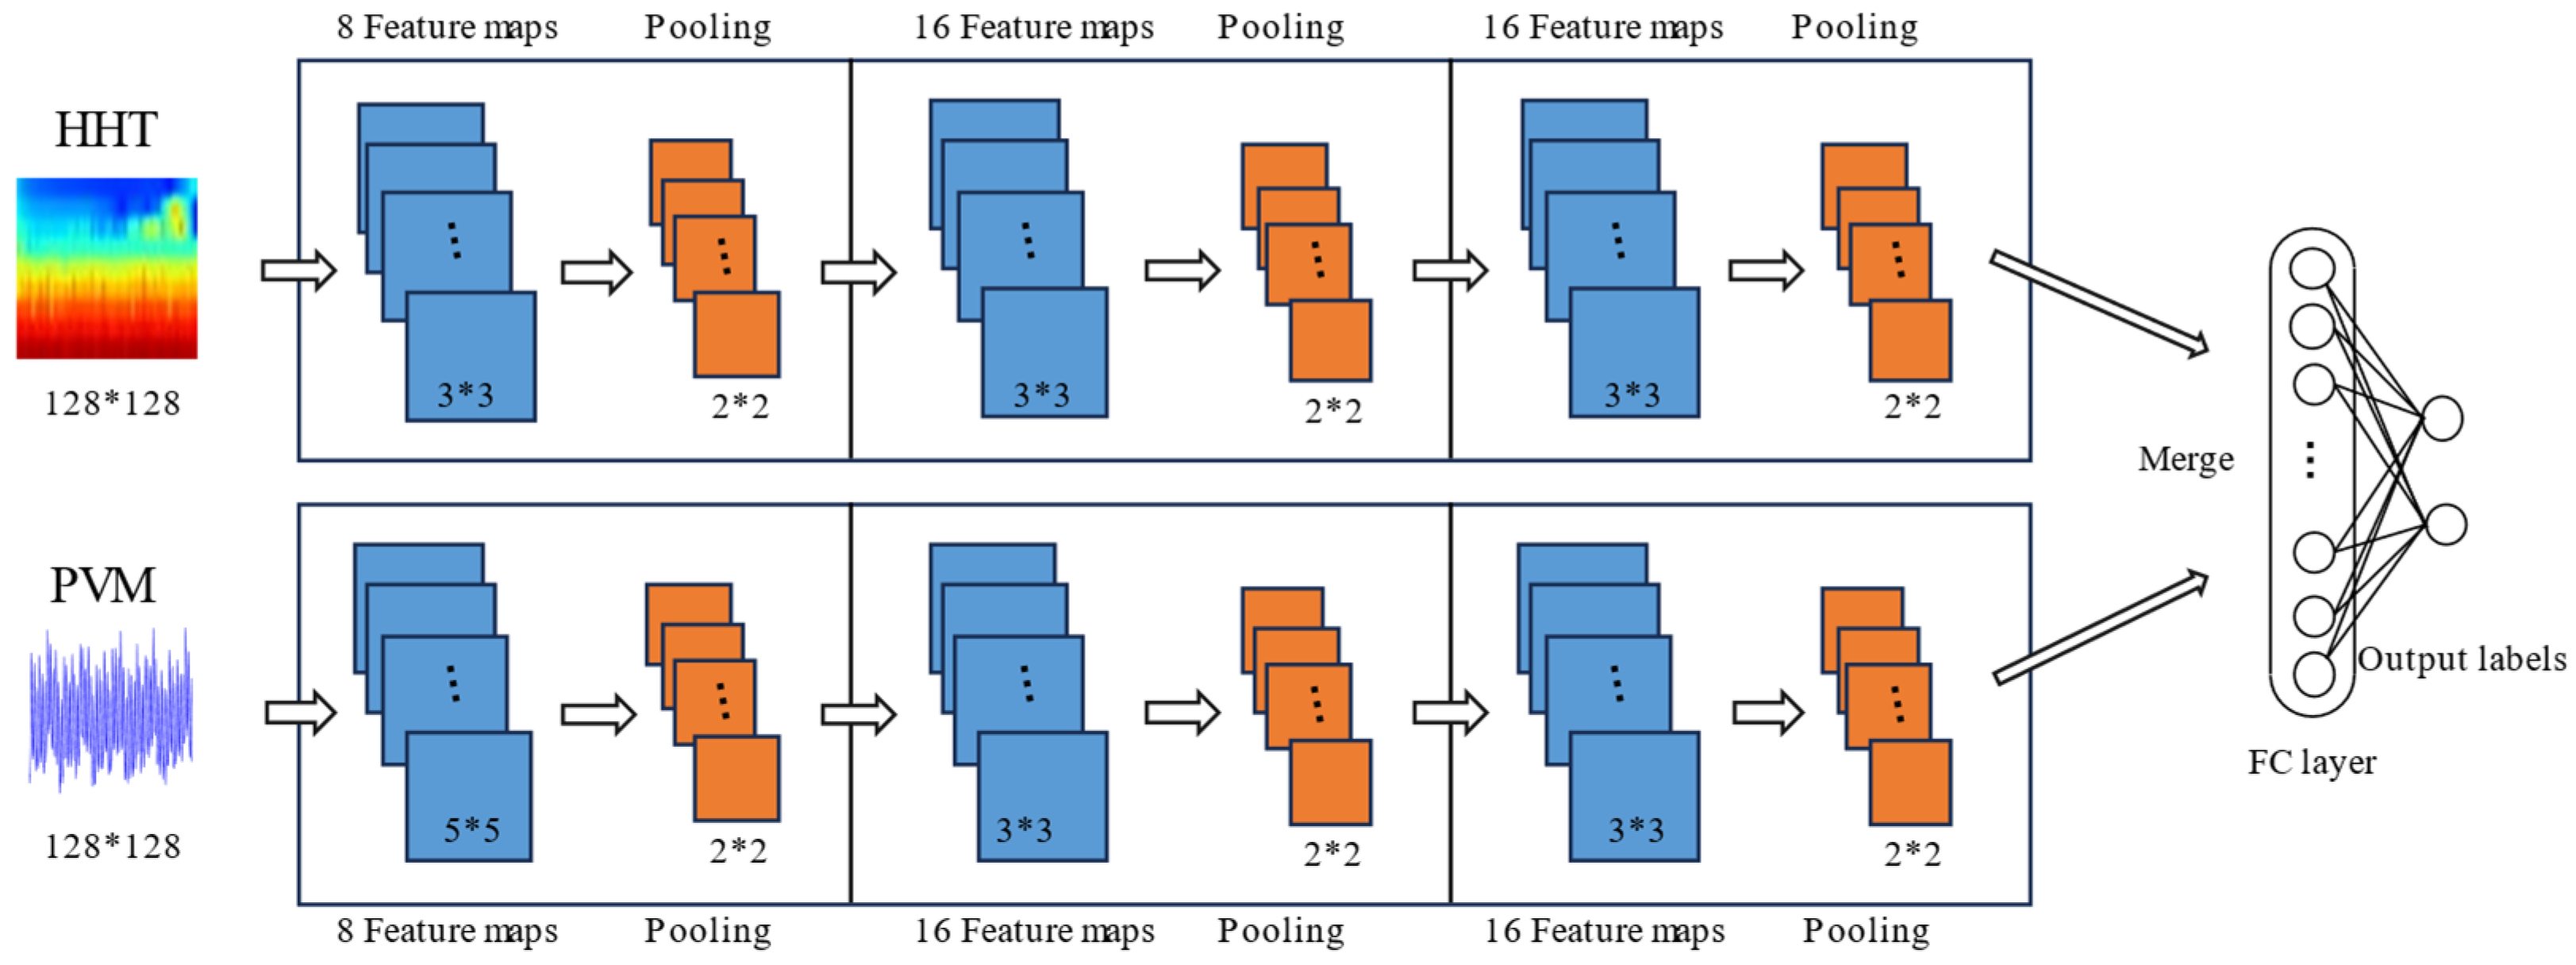
The fault classifier adopts a merged CNN architecture, where each stream processes a type of signal independently, one stream processes the HHT image, and the other stream processes the PVM image. Finally, they are merged at the fully connected layer for classification.
As detailed in Figure 8, the HHT processing flow (top) receives a 128 × 128-pixel grayscale HHT image as input. First, it passes through a convolutional layer with eight feature maps, 3 × 3 kernel size, stride 1, “valid” padding (no padding), and Mish activation. The feature maps are then downsampled by a 2 × 2 max pooling layer with stride 2. This is followed by two identical convolution-pooling layer combinations: a convolutional layer with 16 3 × 3 kernels, stride 1, “valid” padding, and Mish activation; and a max pooling layer with 2 × 2 size and stride 2. After three sets of convolution and pooling operations, the feature maps are flattened into a one-dimensional vector.
The PVM processing flow (bottom) receives a 128 × 128-pixel grayscale PVM image as input. Its structure is similar to the HHT flow. Except for the first convolutional layer with a kernel size of 5 × 5, the other parameters are the same as the HHT stream.
The outputs of the two processing streams (flattened 1D vectors) are concatenated to form a feature vector containing the combined information of HHT and PVM. The feature vector is then input to a fully connected layer with 1024 neurons and a ReLU activation function. Finally, a fully connected layer with two neurons (output layer) is used to output the probability of the sample belonging to the two categories (normal or BRB) using a Softmax activation function. We use a relatively small number of feature maps and neurons in the fully connected layer to avoid overfitting. During model training, we use the Adam optimizer with a default learning rate of 0.001 and categorical cross entropy as the loss function. The training process is performed for 30 epochs with a batch size of 32. Model parameters are automatically updated through the back-propagation algorithm.
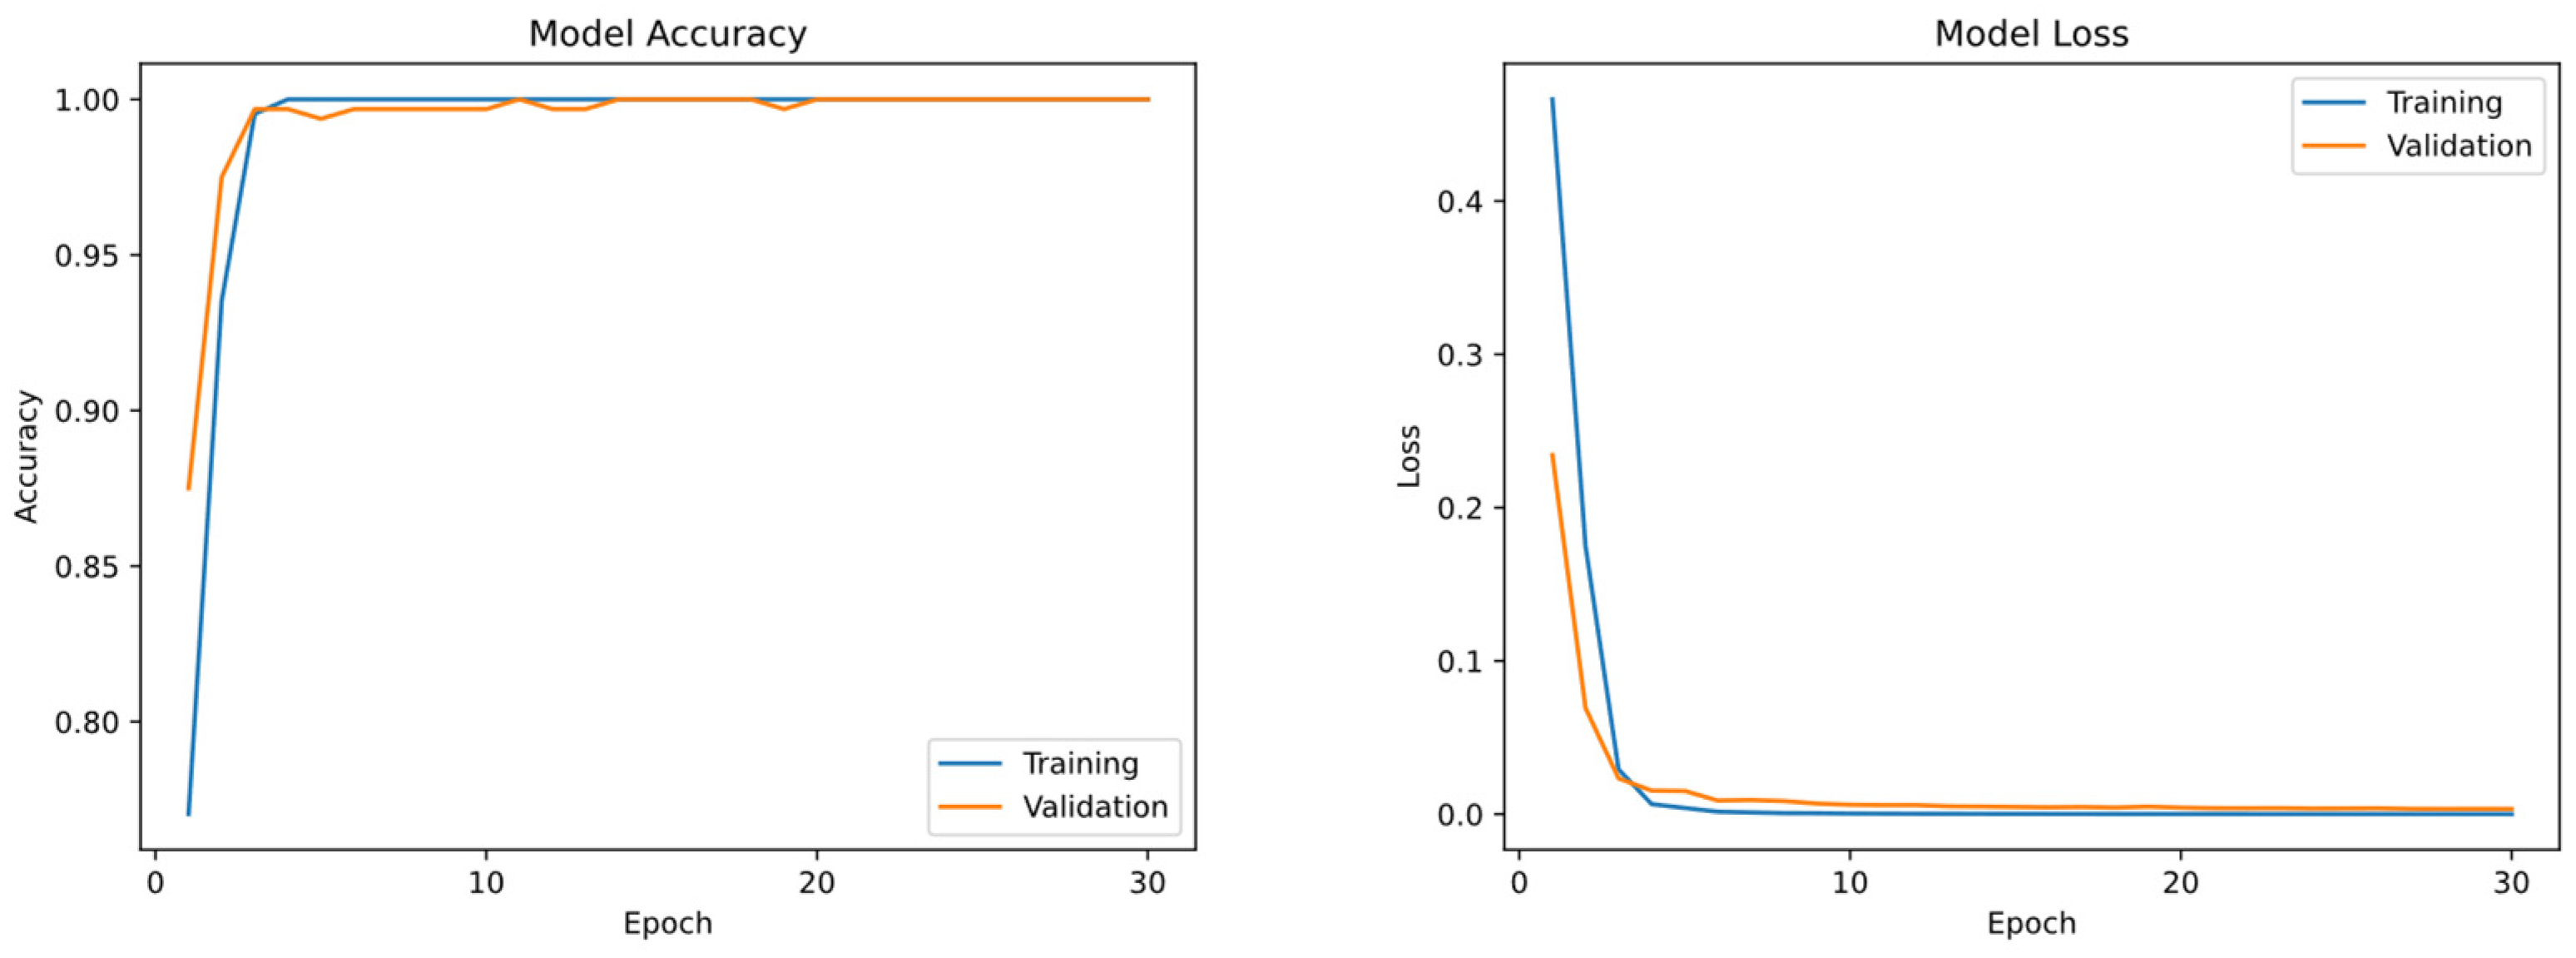
Figure 9 shows the evaluation indicators of the model training process, including accuracy and loss value. As can be seen from the figure, the model reaches convergence around the 10th training epoch, with a fast convergence speed, and maintains high accuracy and low loss value in subsequent training rounds without excessive fluctuations. Moreover, the model is not overfitted.

4. Experimental Validation

4.1. Experimental Test Results

In the experimental validation phase, we segment the testing current data obtained by the method shown in Figure 4 using non-overlapping windows to generate HHT and PVM images, which are input into the trained model for model testing. The window length is 8333 and the sliding step is also 8333. A total of 1580 samples are generated for testing.
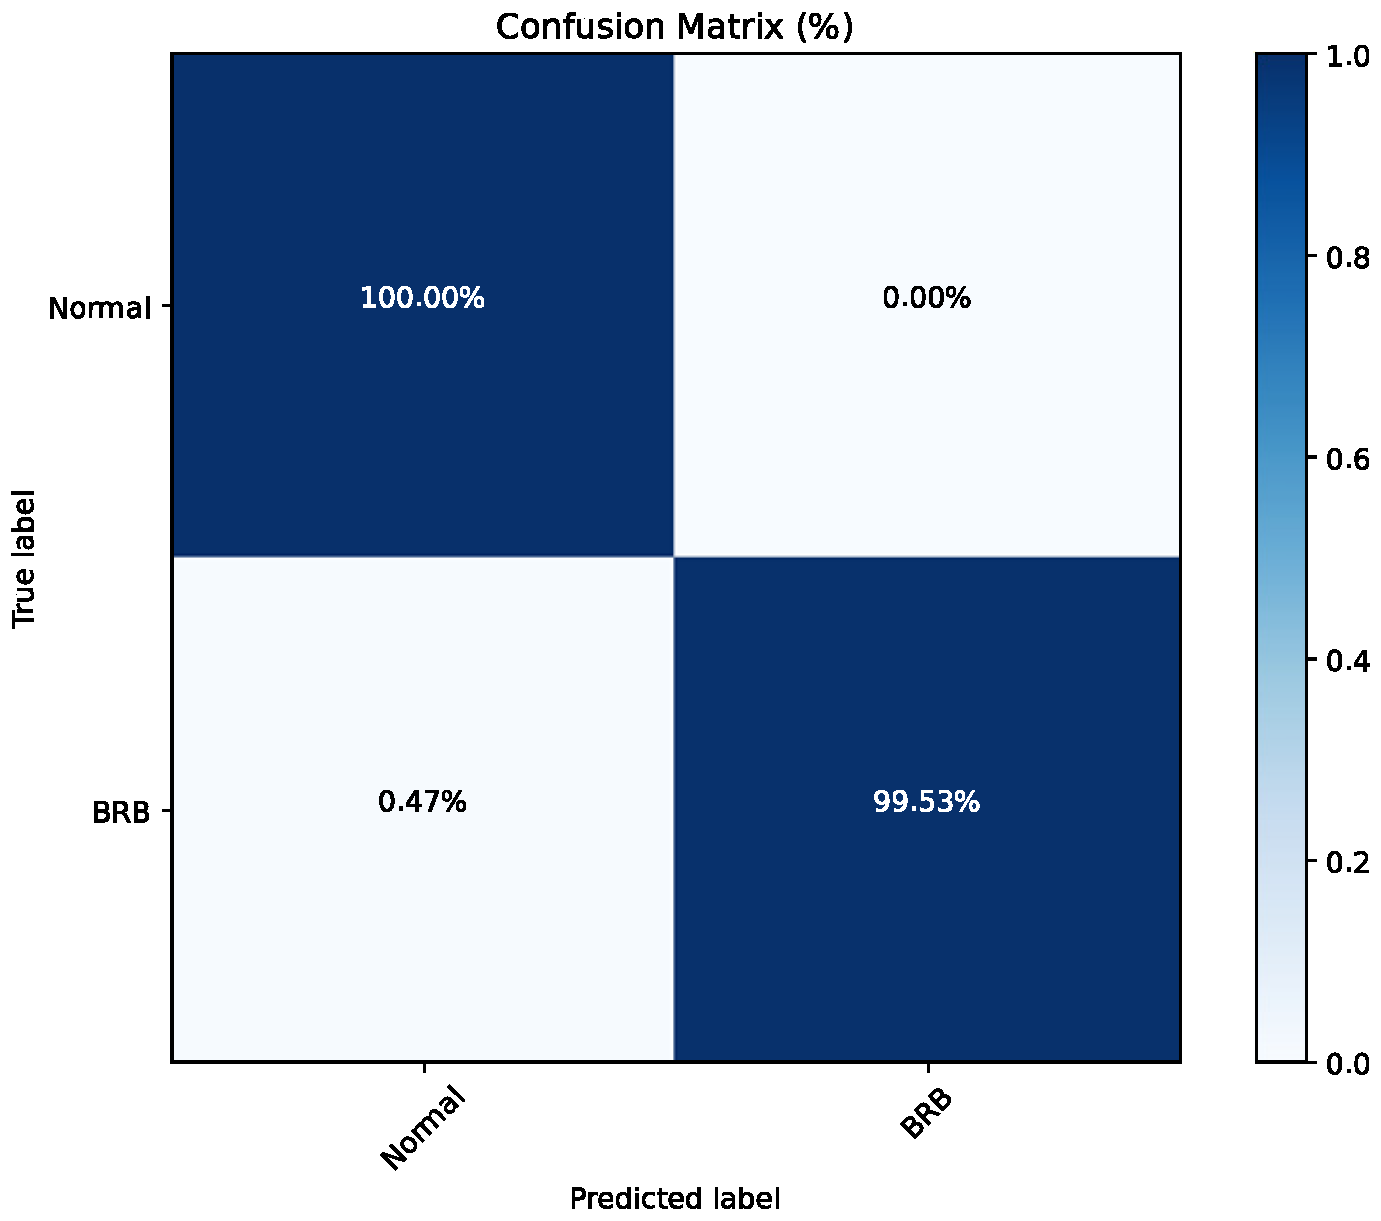
We use the ratio of the number of correctly predicted samples (data segments) to the total number of samples as the overall accuracy of the model. The overall accuracy reaches 99.62% in the experiment. To further evaluate the model performance, we generate the classification report and confusion matrix, as shown in Table 1 and Figure 10. We can see that the model is very accurate without overfitting. The confusion matrix visualizes the classification results, where percentages represent the proportion of samples of each true class (rows) that are classified into each predicted class (columns). These percentages are derived from the data used to calculate precision and recall in Table 1.
Table 2 illustrates the fault detection accuracy for each of the 20 operating conditions. The results show that the model has about 3–5% incorrect prediction labels for motors with one BRB at 25% and 50% loads, mainly because the current fault characteristics of motors with smaller faults at lighter loads are not obvious enough. Except for this, the prediction accuracy for the other working states reaches 100%. In general, it can be considered that the accuracy of the model remains high under the condition of weak characteristics.

4.2. Comparative Analysis

We compare the accuracy of the proposed approach to alternative approaches to show its advantages. The comparison includes the following:
  • Single-signal approaches using HHT or PVM with CNN classifiers.
  • Wavelet transform-based time–frequency distribution (TFD) images with CNN classifiers.
  • Various signal combination strategies in the merged CNN architecture.
All the above methods use the same parameters and training epochs. We split the previously acquired training dataset into 60% for training, 20% for validation, and 20% for testing. Each method is tested 20 times independently, each time using different random seeds for weight initialization and data shuffling. The mean test accuracy ± standard deviation of each method is listed in Table 2.
As can be seen from Table 3, the accuracy of the merged model is generally higher than that of the single-signal model, mainly because the single-signal model learns the features of only one signal, while the merged model can learn the complementary features of multiple signals, which significantly improves the accuracy and stability.
TFD images are generated by the wavelet transform of the electric current signal, which needs to be adjusted for various parameters including scale, frequency range, and type of wavelet basis function. This makes the TFD method difficult to optimize and means that it may miss critical fault features. On the other hand, HHT and PVM are adaptive data processing methods that do not require parameter adjustment, are more efficient, and have stronger generalization ability. In summary, the HHT + PVM + Merged model method proposed in this paper is more practical and efficient.

4.3. Real-Time Performance Analysis

Practical applications of fault detection require not only high accuracy but also computational efficiency of the algorithm [61]. The CNN algorithms for this experiment are executed on the TensorFlow Keras platform, and all experiments are implemented on a Windows personal computer with an Intel Core i9 12th Gen. CPU.
The model training time is 59.57 s, meaning that the computational complexity is low, allowing us to train the model in about 1 min.
During model testing, for each testing motor current file, we calculate the HHT transform, PVM transform, model inference, and total pipeline times, and calculate their average, standard deviation, minimum, and maximum, as shown in Table 4.
From the table, we can infer that the model can predict a current sample (8333 data points) within an average of 0.2 s, reflecting the high computational efficiency and the capability for real-time operation.

5. Conclusions and Future Work

This paper proposes a practical method for broken rotor bar fault detection. This method preprocesses the motor current signal through HHT and PVM, trains a merged CNN model, realizes nonparametric feature extraction and automatic fault classification, and maintains high accuracy at both low loads and small fault levels. In addition, the computational complexity of this method is low, and real-time fault detection can be achieved.
The limitation is that the research is only conducted on one motor, which makes it difficult to ensure generalization ability, and the detection of incomplete broken rotor bar faults (such as 1/2 BRB, 3/4 BRB) is not studied.
Future research directions include collecting more abundant motor current data to solve the above problems, improving the detection accuracy of weak features through denoising methods and tuning the network architecture, extending this method to the detection of multiple faults, and solving the problem of limited training data through data enhancement methods. In addition, pre-trained models can be studied to improve generalization capabilities.

Author Contributions

Conceptualization, T.W. and S.W.; methodology, T.W. and S.W.; software, T.W.; validation, T.W. and S.S.; formal analysis, T.W., S.S. and H.M.; investigation, T.W. and H.M.; data curation, T.W.; writing—original draft preparation, T.W. and S.S.; writing—review and editing, T.W., S.W. and H.M.; visualization, T.W.; supervision, T.W. and S.W.; project administration, T.W. and S.W. All authors have read and agreed to the published version of the manuscript.

Funding

This research received no external funding.

Data Availability Statement

The data is contained within the article, and the source code of the experiment can be obtained by contacting the corresponding author.

Conflicts of Interest

The authors declare no conflicts of interest.

References

  1. De Souza, D.F.; Salotti, F.A.M.; Sauer, I.L.; Tatizawa, H.; De Almeida, A.T.; Kanashiro, A.G. A Performance Evaluation of Three-Phase Induction Electric Motors between 1945 and 2020. Energies 2022, 15, 2002. [Google Scholar] [CrossRef]
  2. Bazzi, A.M.; Krein, P.T. Review of Methods for Real-Time Loss Minimization in Induction Machines. IEEE Trans. Ind. Appl. 2010, 46, 2319–2328. [Google Scholar] [CrossRef]
  3. Bonnett, A.H.; Soukup, G.C. Cause and Analysis of Stator and Rotor Failures in Three-Phase Squirrel-Cage Induction Motors. IEEE Trans. Ind. Appl. 1992, 28, 921–937. [Google Scholar] [CrossRef]
  4. Drif, M.; Cardoso, A.J.M. The Use of the Instantaneous-Reactive-Power Signature Analysis for Rotor-Cage-Fault Diagnostics in Three-Phase Induction Motors. IEEE Trans. Ind. Electron. 2009, 56, 4606–4614. [Google Scholar] [CrossRef]
  5. Corne, B.; Debruyne, C.; De Baets, P.; Desmet, J. Stator Current Measurements as a Condition Monitoring Technology—The-State-of-the-Art. In Proceedings of the 2014 International Conference on Electrical Machines (ICEM), Berlin, Germany, 2–5 September 2014; pp. 1659–1665. [Google Scholar]
  6. Faiz, J.; Ojaghi, M. Different Indexes for Eccentricity Faults Diagnosis in Three-Phase Squirrel-Cage Induction Motors: A Review. Mechatronics 2009, 19, 2–13. [Google Scholar] [CrossRef]
  7. Albrecht, P.F.; Appiarius, J.C.; McCoy, R.M.; Owen, E.L.; Sharma, D.K. Assessment of the Reliability of Motors in Utility Applications—Updated. IEEE Trans. Energy Convers. 1986, EC-1, 39–46. [Google Scholar] [CrossRef]
  8. Stone, G.C.; Sasic, M.; Dunn, D.; Culbert, I. Recent Problems Experienced with Motor and Generator Windings. In Proceedings of the 2009 Record of Conference Papers—Industry Applications Society 56th Annual Petroleum and Chemical Industry Conference, Anaheim, CA, USA, 14–16 September 2009; pp. 1–9. [Google Scholar]
  9. Hassan, O.E.; Amer, M.; Abdelsalam, A.K.; Williams, B.W. Induction Motor Broken Rotor Bar Fault Detection Techniques Based on Fault Signature Analysis—A Review. IET Electr. Power Appl. 2018, 12, 895–907. [Google Scholar] [CrossRef]
  10. Nandi, S.; Bharadwaj, R.; Toliyat, H.A.; Parlos, A.G. Study of Three Phase Induction Motors with Incipient Rotor Cage Faults under Different Supply Conditions. In Proceedings of the Conference Record of the 1999 IEEE Industry Applications Conference. Thirty-Forth IAS Annual Meeting (Cat. No.99CH36370), Phoenix, AZ, USA, 3–7 October 1999; Volume 3, pp. 1922–1928. [Google Scholar]
  11. Nandi, S.; Toliyat, H.A.; Li, X. Condition Monitoring and Fault Diagnosis of Electrical Motors—A Review. IEEE Trans. Energy Convers. 2005, 20, 719–729. [Google Scholar] [CrossRef]
  12. Gonzalez-Jimenez, D.; del-Olmo, J.; Poza, J.; Garramiola, F.; Madina, P. Data-Driven Fault Diagnosis for Electric Drives: A Review. Sensors 2021, 21, 4024. [Google Scholar] [CrossRef]
  13. Artesis Model Based Fault Detection Systems—Artesis. Available online: https://artesis.com/blog/ (accessed on 12 January 2025).
  14. Gawde, S.; Patil, S.; Kumar, S.; Kamat, P.; Kotecha, K.; Abraham, A. Multi-Fault Diagnosis of Industrial Rotating Machines Using Data-Driven Approach: A Review of Two Decades of Research. Eng. Appl. Artif. Intell. 2023, 123, 106139. [Google Scholar] [CrossRef]
  15. Niu, G.; Dong, X.; Chen, Y. Motor Fault Diagnostics Based on Current Signatures: A Review. IEEE Trans. Instrum. Meas. 2023, 72, 1–19. [Google Scholar] [CrossRef]
  16. Obaid, R.R.; Habetler, T.G. Effect of Load on Detecting Mechanical Faults in Small Induction Motors. In Proceedings of the 4th IEEE International Symposium on Diagnostics for Electric Machines, Power Electronics and Drives, SDEMPED 2003, Stone Mountain, GA, USA, 24–26 August 2003; pp. 307–311. [Google Scholar]
  17. Gyftakis, K.N.; Marques Cardoso, A.J.; Antonino-Daviu, J.A. Introducing the Filtered Park’s and Filtered Extended Park’s Vector Approach to Detect Broken Rotor Bars in Induction Motors Independently from the Rotor Slots Number. Mech. Syst. Signal Process. 2017, 93, 30–50. [Google Scholar] [CrossRef]
  18. Asad, B.; Vaimann, T.; Belahcen, A.; Kallaste, A.; Rassõlkin, A.; Iqbal, M.N. Broken Rotor Bar Fault Detection of the Grid and Inverter-fed Induction Motor by Effective Attenuation of the Fundamental Component. IET Electr. Power Appl. 2019, 13, 2005–2014. [Google Scholar] [CrossRef]
  19. Rivera-Guillen, J.R.; De Santiago-Perez, J.J.; Amezquita-Sanchez, J.P.; Valtierra-Rodriguez, M.; Romero-Troncoso, R.J. Enhanced FFT-Based Method for Incipient Broken Rotor Bar Detection in Induction Motors during the Startup Transient. Measurement 2018, 124, 277–285. [Google Scholar] [CrossRef]
  20. Li, H.; Zhen, D.; Otuyemi, F.; Gu, F.; Ball, A.D. Broken Rotor Bar Detection Using Mathematical Morphology Based on Instantaneous Induction Motor Electrical Signals Analysis. In Proceedings of the 2019 25th International Conference on Automation and Computing (ICAC), Lancaster, UK, 5–7 September 2019; pp. 1–4. [Google Scholar] [CrossRef]
  21. De Jesus Rangel-Magdaleno, J.; Peregrina-Barreto, H.; Ramirez-Cortes, J.M.; Gomez-Gil, P.; Morales-Caporal, R. FPGA-Based Broken Bars Detection on Induction Motors Under Different Load Using Motor Current Signature Analysis and Mathematical Morphology. IEEE Trans. Instrum. Meas. 2014, 63, 1032–1040. [Google Scholar] [CrossRef]
  22. Bal’, V.B.; Kotelenets, N.F.; Deeb, M. Discrete Wavelet Transform for Stator Fault Detection in an Induction Motor. Power Technol. Eng. 2023, 57, 175–185. [Google Scholar] [CrossRef]
  23. Talhaoui, H.; Ameid, T.; Aissa, O.; Kessal, A. Wavelet Packet and Fuzzy Logic Theory for Automatic Fault Detection in Induction Motor. Soft Comput. 2022, 26, 11935–11949. [Google Scholar] [CrossRef]
  24. Climente-Alarcon, V.; Antonino-Daviu, J.; Riera-Guasp, M.; Pons-Llinares, J.; Roger-Folch, J.; Jover-Rodriguez, P.; Arkkio, A. Transient Tracking of Low and High-Order Eccentricity-Related Components in Induction Motors via TFD Tools. Mech. Syst. Signal Process. 2011, 25, 667–679. [Google Scholar] [CrossRef]
  25. Sharma, A.; Chatterji, S.; Mathew, L. A Novel Park’s Vector Approach for Investigation of Incipient Stator Fault Using MCSA in Three-Phase Induction Motors. In Proceedings of the 2017 International Conference on Innovations in Control, Communication and Information Systems (ICICCI), Greater Noida, India, 12–13 August 2017; pp. 1–5. [Google Scholar]
  26. Ramu, S.K.; Vairavasundaram, I.; Aljafari, B.; Kareri, T. Rotor Bar Fault Diagnosis in Indirect Field–Oriented Control-Fed Induction Motor Drive Using Hilbert Transform, Discrete Wavelet Transform, and Energy Eigenvalue Computation. Machines 2023, 11, 711. [Google Scholar] [CrossRef]
  27. Ramu, S.K.; Irudayaraj, G.C.R.; Subramani, S.; Subramaniam, U. Broken Rotor Bar Fault Detection Using Hilbert Transform and Neural Networks Applied to Direct Torque Control of Induction Motor Drive. IET Power Electron. 2020, 13, 3328–3338. [Google Scholar] [CrossRef]
  28. Agah, G.R.; Rahideh, A.; Khodadadzadeh, H.; Khoshnazar, S.M.; Hedayati Kia, S. Broken Rotor Bar and Rotor Eccentricity Fault Detection in Induction Motors Using a Combination of Discrete Wavelet Transform and TeagerKaiser Energy Operator. IEEE Trans. Energy Convers. 2022, 37, 2199–2206. [Google Scholar] [CrossRef]
  29. Dilmi, I.; Bouguerra, A.; Djrioui, A.; Chrifi-Alaoui, L. Interval Type-2 Fuzzy Logic-Second Order Sliding Mode Based Fault Detection and Active Fault-Tolerant Control of Brushless DC Motor. J. Eur. Systèmes Autom. 2021, 54, 475–485. [Google Scholar] [CrossRef]
  30. Tarek, K.; Abdelaziz, L.; Zoubir, C.; Kais, K.; Karim, N. Optimized Multi Layer Perceptron Artificial Neural Network Based Fault Diagnosis of Induction Motor Using Vibration Signals. Diagnostyka 2021, 22, 65–74. [Google Scholar] [CrossRef]
  31. Jiang, Y. Fault Detection Method of Motor Bearing Based on Improved Random Forest Algorithm. In Proceedings of the 2023 International Conference on Mechatronics, IoT and Industrial Informatics (ICMIII), Melbourne, Australia, 9–11 June 2023; pp. 311–314. [Google Scholar] [CrossRef]
  32. Ghediri, A. Induction Motor Failures Detection Using Motor Current Signal Analysis (MCSA) and Two-Step Support Vector Machine (SVM) Classifier. Przegląd Elektrotechniczny 2024, 1, 274–280. [Google Scholar] [CrossRef]
  33. Pietrzak, P.; Wolkiewicz, M. Application of Support Vector Machine to Stator Winding Fault Detection and Classification of Permanent Magnet Synchronous Motor. In Proceedings of the 2021 IEEE 19th International Power Electronics and Motion Control Conference (PEMC), Gliwice, Poland, 25–29 April 2021; pp. 880–887. [Google Scholar] [CrossRef]
  34. Almounajjed, A.; Sahoo, A.K. Wavelet-Based Multi-Class Support Vector Machine for Stator Fault Diagnosis in Induction Motor. Trans. Inst. Meas. Control 2023, 45, 261–273. [Google Scholar] [CrossRef]
  35. Aguayo-Tapia, S.; Avalos-Almazan, G.; Rangel-Magdaleno, J.; Ramirez-Cortes, J.M.; Paternina, M.R.A. Broken Bar Detection on IM Using ROCOF and Decision Tree. In Proceedings of the 2023 IEEE 14th International Symposium on Diagnostics for Electrical Machines, Power Electronics and Drives (SDEMPED), Chania, Greece, 28–31 August 2023; pp. 198–203. [Google Scholar] [CrossRef]
  36. Wang, L.-H.; Zhao, X.-P.; Wu, J.-X.; Xie, Y.-Y.; Zhang, Y.-H. Motor Fault Diagnosis Based on Short-Time Fourier Transform and Convolutional Neural Network. Chin. J. Mech. Eng. 2017, 30, 1357–1368. [Google Scholar] [CrossRef]
  37. Lu, S.; Qian, G.; He, Q.; Liu, F.; Liu, Y.; Wang, Q. In Situ Motor Fault Diagnosis Using Enhanced Convolutional Neural Network in an Embedded System. IEEE Sens. J. 2020, 20, 8287–8296. [Google Scholar] [CrossRef]
  38. Katta, P.; Karunanithi, K.; Raja, S.P.; Ramesh, S.; Prakash, S.V.J.; Joseph, D. Optimized Deep Belief Network for Efficient Fault Detection in Induction Motor. ADCAIJ Adv. Distrib. Comput. Artif. Intell. J. 2024, 13, e31616. [Google Scholar] [CrossRef]
  39. Choi, Y.; Joe, I. Motor Fault Diagnosis and Detection with Convolutional Autoencoder (CAE) Based on Analysis of Electrical Energy Data. Electronics 2024, 13, 3946. [Google Scholar] [CrossRef]
  40. Luo, P.; Yin, Z.; Yuan, D.; Gao, F.; Liu, J. An Intelligent Method for Early Motor Bearing Fault Diagnosis Based on Wasserstein Distance Generative Adversarial Networks Meta Learning. IEEE Trans. Instrum. Meas. 2023, 72, 3517611. [Google Scholar] [CrossRef]
  41. Peng, Y.; He, M.; Hu, F.; Mao, Z.; Huang, X.; Ding, J. Predictive Modeling of Flexible EHD Pumps Using Kolmogorov–Arnold Networks. Biomim. Intell. Robot. 2024, 4, 100184. [Google Scholar] [CrossRef]
  42. Piedad, E.J.; Del Rosario, C.A.; Camaclang, R.C.; Prieto-Araujo, E.; Gomis-Bellmunt, O. Kolmogorov-Arnold Network for Machine Learning-Based Motor Condition Diagnosis. In Proceedings of the 2024 IEEE 7th International Conference on Electrical, Electronics and System Engineering (ICEESE), Kanazawa, Japan, 19–20 November 2024; pp. 1–5. [Google Scholar] [CrossRef]
  43. Ince, T. Real-Time Broken Rotor Bar Fault Detection and Classification by Shallow 1D Convolutional Neural Networks. Electr. Eng. 2019, 101, 599–608. [Google Scholar] [CrossRef]
  44. Ince, T.; Kiranyaz, S.; Eren, L.; Askar, M.; Gabbouj, M. Real-Time Motor Fault Detection by 1-D Convolutional Neural Networks. IEEE Trans. Ind. Electron. 2016, 63, 7067–7075. [Google Scholar] [CrossRef]
  45. Predicting Flow Status of a Flexible Rectifier Using Cognitive Computing. Expert Syst. Appl. 2025, 264, 125878. [CrossRef]
  46. Netsanet, S.; Zheng, D.; Wei, Z.; Teshager, G. Cognitive Edge Computing–Based Fault Detection and Location Strategy for Active Distribution Networks. Front. Energy Res. 2022, 10, 826915. [Google Scholar] [CrossRef]
  47. Penman, J.; Stavrou, A. Broken Rotor Bars: Their Effect on the Transient Performance of Induction Machines. IEE Proc.—Electr. Power Appl. 1996, 143, 449. [Google Scholar] [CrossRef]
  48. Kathir, I.; Balakrishnan, S.; Sakthivel, G. Detection of Rotor Fault in an Induction Motor Under Standstill Condition—A Power Quality Perspective. Procedia Eng. 2012, 38, 3200–3214. [Google Scholar] [CrossRef]
  49. Yu, M.; Tao, X.; Xin, D.; Xin, Z. Fault Diagnosis and Numerical Simulation of Broken Rotor Bars for Small Cage Induction Motors. In Proceedings of the 2017 Chinese Automation Congress (CAC), Jinan, China, 20–22 October 2017; pp. 5355–5359. [Google Scholar] [CrossRef]
  50. Gomez, A.J.F.; Sobczyk, T.J.; Weinreb, K. Influence on Rotor Broken Bar Fault Diagnosis of Mechanical Torque Pulsations by Means of FFT. In Proceedings of the 2015 IEEE 10th International Symposium on Diagnostics for Electrical Machines, Power Electronics and Drives (SDEMPED), Guarda, Portugal, 4 September 2015; pp. 44–49. [Google Scholar]
  51. Milimonfared, J.; Kelk, H.M.; Nandi, S.; Minassians, A.D.; Toliyat, H.A. A Novel Approach for Broken-Rotor-Bar Detection in Cage Induction Motors. IEEE Trans. Ind. Appl. 1999, 35, 1000–1006. [Google Scholar] [CrossRef]
  52. Huang, N.E.; Shen, Z.; Long, S.R.; Wu, M.C.; Shih, H.H.; Zheng, Q.; Yen, N.-C.; Tung, C.C.; Liu, H.H. The Empirical Mode Decomposition and the Hilbert Spectrum for Nonlinear and Non-Stationary Time Series Analysis. Proc. R. Soc. Lond. Ser. Math. Phys. Eng. Sci. 1998, 454, 903–995. [Google Scholar] [CrossRef]
  53. Boudraa, A.-O.; Cexus, J.-C. EMD-Based Signal Filtering. IEEE Trans. Instrum. Meas. 2007, 56, 2196–2202. [Google Scholar] [CrossRef]
  54. Valles-Novo, R.; De Jesus Rangel-Magdaleno, J.; Ramirez-Cortes, J.M.; Peregrina-Barreto, H.; Morales-Caporal, R. Empirical Mode Decomposition Analysis for Broken-Bar Detection on Squirrel Cage Induction Motors. IEEE Trans. Instrum. Meas. 2015, 64, 1118–1128. [Google Scholar] [CrossRef]
  55. Hilbert—SciPy v1.15.0 Manual. Available online: https://docs.scipy.org/doc/scipy-1.15.0/reference/generated/scipy.signal.hilbert.html (accessed on 14 January 2025).
  56. Zarei, J.; Hassani, H.; Wei, Z.; Karimi, H.R. Broken Rotor Bars Detection via Park’s Vector Approach Based on ANFIS. In Proceedings of the 2014 IEEE 23rd International Symposium on Industrial Electronics (ISIE), Istanbul, Turkey, 1–4 June 2014; pp. 2422–2426. [Google Scholar]
  57. Gu, J.; Wang, Z.; Kuen, J.; Ma, L.; Shahroudy, A.; Shuai, B.; Liu, T.; Wang, X.; Wang, G.; Cai, J. Recent Advances in Convolutional Neural Networks. Pattern Recognit. 2018, 77, 354–377. [Google Scholar] [CrossRef]
  58. Misra, D. Mish: A Self Regularized Non-Monotonic Activation Function. arXiv 2020, arXiv:1908.08681. [Google Scholar]
  59. Ogundokun, R.O.; Maskeliunas, R.; Misra, S.; Damaševičius, R. Improved CNN Based on Batch Normalization and Adam Optimizer. In Computational Science and Its Applications—ICCSA 2022 Workshops; Gervasi, O., Murgante, B., Misra, S., Rocha, A.M.A.C., Garau, C., Eds.; Lecture Notes in Computer Science; Springer International Publishing: Cham, Switzerland, 2022; Volume 13381, pp. 593–604. ISBN 978-3-031-10547-0. [Google Scholar]
  60. Zhao, J.; Mao, X.; Chen, L. Learning Deep Features to Recognise Speech Emotion Using Merged Deep CNN. IET Signal Process. 2018, 12, 713–721. [Google Scholar] [CrossRef]
  61. Kiranyaz, S.; Gastli, A.; Ben-Brahim, L.; Al-Emadi, N.; Gabbouj, M. Real-Time Fault Detection and Identification for MMC Using 1-D Convolutional Neural Networks. IEEE Trans. Ind. Electron. 2018, 66, 8760–8771. [Google Scholar] [CrossRef]
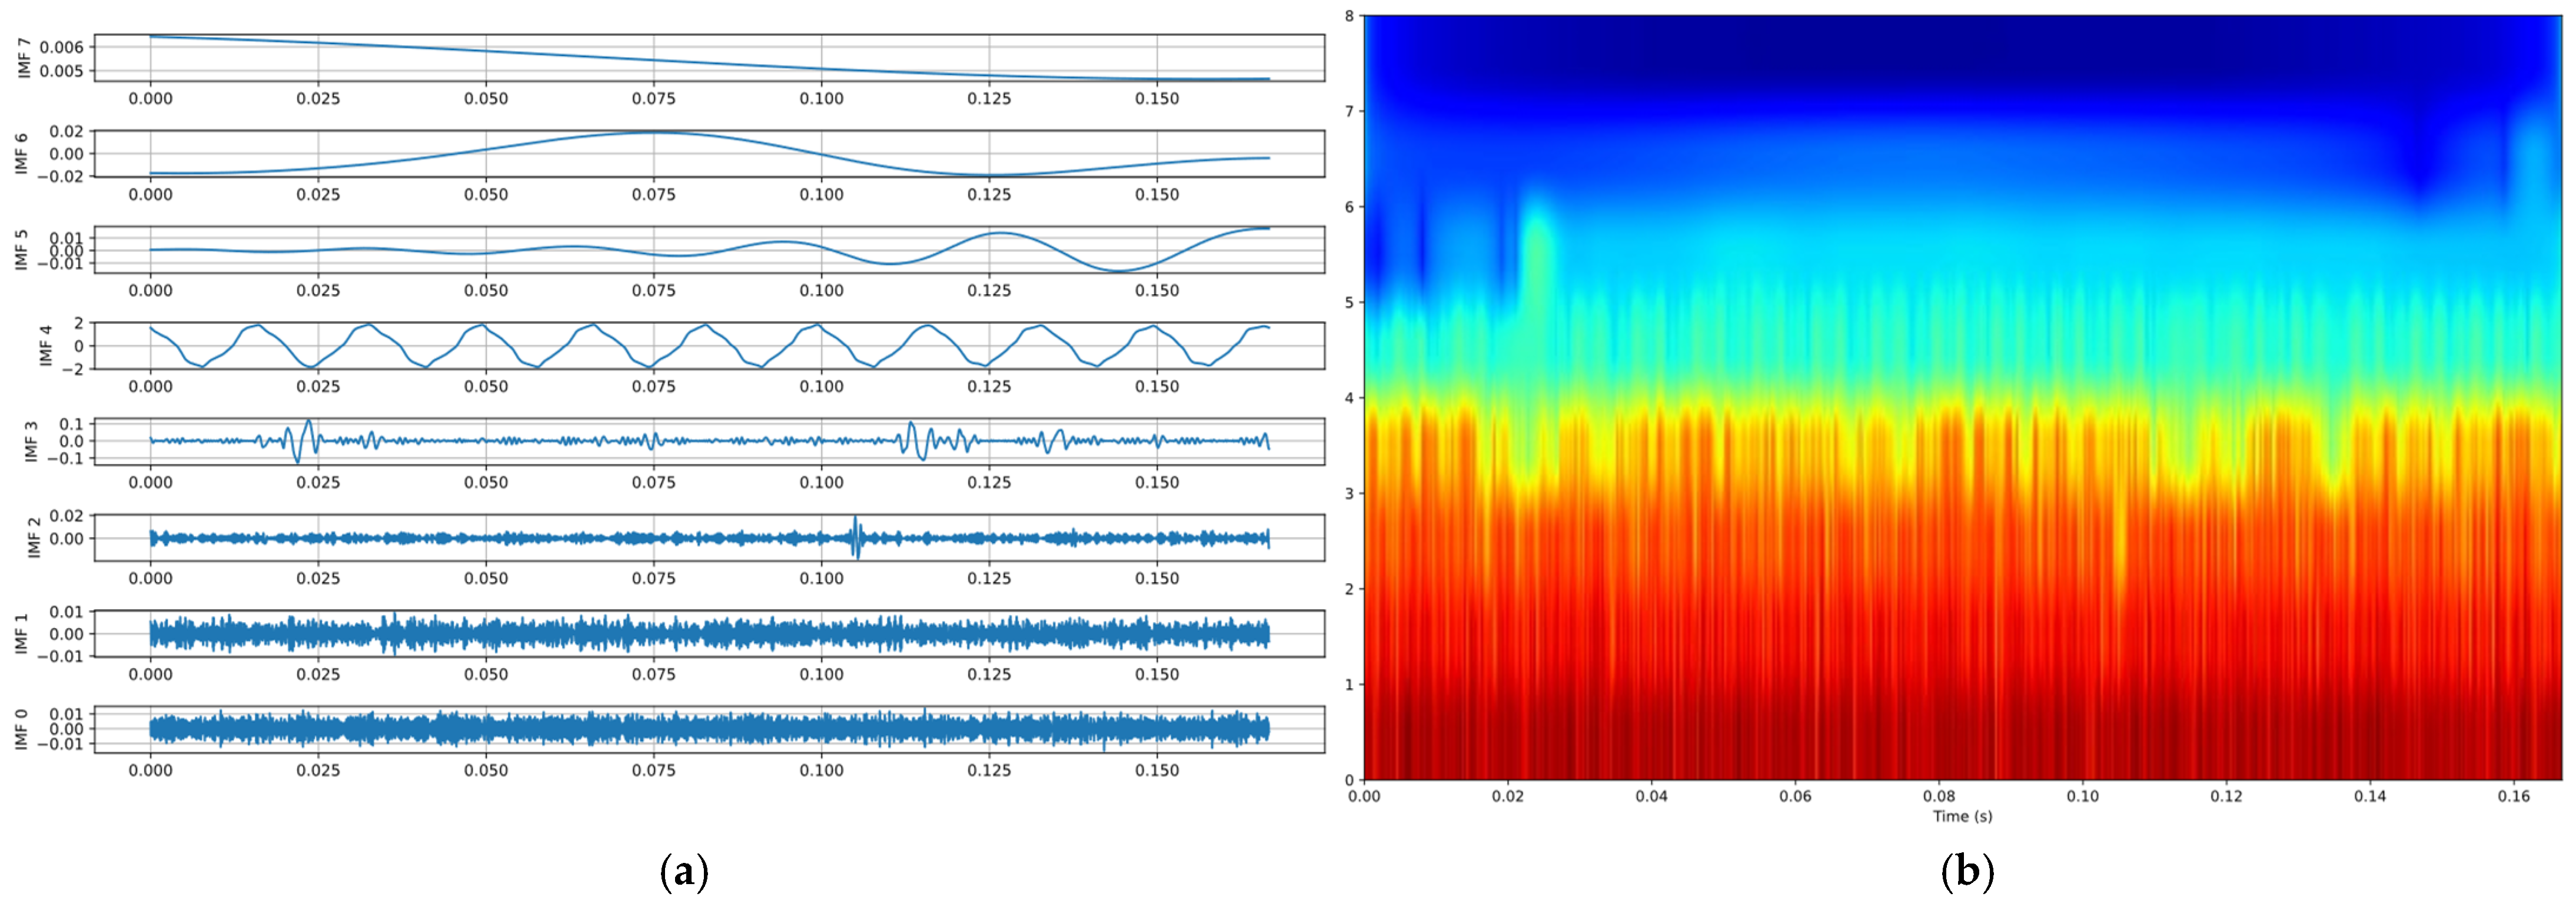
Figure 1. IMF list and corresponding HHT spectrum of a current sample. (a) The IMFs obtained after EMD; (b) the generated HHT spectrum.
Actuators 14 00113 g001
Figure 2. PVA and PVM images of normal motor and motor with four BRBs (100% load). (a,c) Normal motor; (b,d) faulty motor.
Actuators 14 00113 g002
Figure 3. Motor current sampling data, including start-up transient and steady state.
Actuators 14 00113 g003
Figure 4. Model training and testing data division method. (a) Normal motor, including four load levels, a total of four pieces of current data; (b) faulty motor, including four fault levels and four load levels, a total of 16 pieces of current data.
Actuators 14 00113 g004
Figure 5. HHT spectra of motors under different working conditions. (a) Normal motor at 75% load; (b) motor with one BRB at 75% load; (c) motor with four BRBs at 75% load; (d) normal motor at 100% load; (e) motor with one BRB at 100% load; (f) motor with four BRBs at 100% load.
Actuators 14 00113 g005
Figure 6. PVM images of motors under different working conditions. (a) Normal motor at 100% load; (b) motor with one BRB at 100% load; (c) motor with four BRBs at 100% load.
Actuators 14 00113 g006
Figure 7. Flowchart of end-to-end CNN model training.
Actuators 14 00113 g007
Figure 8. Detailed view of the merged CNN architecture.
Actuators 14 00113 g008
Figure 9. Line plot of model training and validation accuracy and loss.
Actuators 14 00113 g009
Figure 10. Overall confusion matrix of model testing.
Actuators 14 00113 g010
Table 1. Overall classification report of model testing.
PrecisionRecallF1-ScoreSupport
Normal0.98136610.990596316
BRB10.9952530.9976211264
Accuracy 0.9962031580
Macro Avg0.9906830.9976270.9941081580
Weighted Avg0.9962730.9962030.9962161580
Table 2. Testing accuracy of all 20 working states.
25% Load50% Load75% Load100% Load
Normal100%100%100%100%
1 BRB95.0%97.5%100%100%
2 BRB100%100%100%100%
3 BRB100%100%100%100%
4 BRB100%100%100%100%
Table 3. Accuracy comparison of different methods.
MethodMean Test Accuracy ± Standard Deviation
PVM single signal0.9875 ± 0.0069
HHT single signal0.9616 ± 0.0181
TFD single signal0.9880 ± 0.0072
PVM+TFD Merged0.9975 ± 0.0029
HHT+TFD Merged0.9936 ± 0.0115
HHT+PVM Merged0.9980 ± 0.0030
Table 4. Overall timing statistics (unit: seconds).
AverageStandard DeviationMinimumMaximum
HHT Transform12.49781.68069.625217.4304
PVM Transform1.34620.28351.12062.1740
Model Inference0.07460.04260.05350.2436
Total Pipeline13.92961.811411.185218.9608
Disclaimer/Publisher’s Note: The statements, opinions and data contained in all publications are solely those of the individual author(s) and contributor(s) and not of MDPI and/or the editor(s). MDPI and/or the editor(s) disclaim responsibility for any injury to people or property resulting from any ideas, methods, instructions or products referred to in the content.