Abstract
The cooling system is a core component for a vehicle’s powertrains to operate smoothly and maintain a satisfying noise, vibration, and harshness (NVH) performance. However, advances in new energy vehicles bring with them complex requirements for the cooling fan design due to new issues such as increased heat load, dynamic variations, and high-speed vibrations, which demand the optimization of fan dynamics over a wide range of parameters. In this paper, by thoroughly checking the effect of rigid–flexible coupling and the geometrically complex elastic frame of the fan, we propose a combined modeling approach to reduce the computational time of broad-range parameter variation analysis and examine the vibration problem in the cooling fans under various external excitations. First, the complicated frame of the fan is simplified through virtual prototyping based on an experiment. Then, modal transition is applied, reducing the complex kinetic expression, and a time-invariant system model is derived with multi-blade coordinate transformation. Stability and bifurcation analysis are performed regarding different excitation couplings from the rotor, powertrain, and road. The results of the simulation and experiment illustrate that the proposed methodology achieves a substantial reduction in computational time, and all degrees of freedom (DOFs) are divided into two groups including symmetrical and asymmetrical types. The results also imply the great potential for the optimization and control of the high-speed fan’s vibration for new energy cars.
1. Introduction
Compared to traditional vehicles, new energy vehicles (NEVs) not only exhibit greater energy efficiency but also demonstrate enhanced noise, vibration, and harshness (NVH) performance due to the absence of exhaust systems and reduced transmission components [1]. However, this improvement necessitates stricter control of vibration and noise from other sources. Regardless of type, be that battery electric vehicles (BEVs), hybrid electric vehicles (HEVs), or fuel cell vehicles (FCVs), efficient heat dissipation through cooling fans is critical [2], making them both essential components and primary NVH sources in NEVs [3].
Cooling fan vibration and noise arise from multiple factors, including mass imbalance, rotating electromagnetic forces, air pressure fluctuations, and dynamic interactions [4]. Extensive research has focused on mitigating these issues. For instance, three vibration reduction structures were experimentally evaluated, optimizing stiffness and damping parameters [5]. Equivalent models incorporating shrouds and rubber mounts were developed to isolate fan-induced vibrations [4]. While most studies treat fan components as rigid, the finite element method (FEM) has been used to analyze elastic effects, such as fatigue failure risks due to torsional natural frequency proximity [6]. Experimental methods have also studied resonance from switching frequencies [7], while other work has explored shape modes’ impact on heat transfer [8].
Noise research primarily employs Computational Fluid Dynamics (CFD) simulations to investigate aerodynamic noise sources [3,9]. While analytical frameworks have been developed to characterize blade flexibility in microscale piezoelectric fans [10], computational methods persist as the prevailing analysis paradigm due to their superior accuracy in capturing nonlinear effects [11]. For example, CFD has analyzed noise from parallel cooling fans in confined spaces [12] and optimized blade parameters (e.g., outer ring structure, installation angle) to reduce sound pressure levels [13,14]. Additionally, CFD has been applied to study integral cooling systems incorporating fans, aiming to minimize their noise emissions [15]. However, CFD’s computational cost and limited airflow interaction modeling have led to alternative approaches like the body force model, which reduces computational expense while capturing blade–airflow interactions [16,17,18]. This method enables fan modeling without detailed blade geometry, relying on performance data [19], offering valuable insights for frame simplification.
Research on cooling fan dynamics benefits from cross-disciplinary insights, such as wind turbine modeling. While simplified rigid-blade models analyze parametric vibrations [20], advanced approaches treat blades as flexible beams using multi-blade coordinate transformation to address periodic systems [21]. Comprehensive models further consider hub and blade flexibility to capture impeller deformation modes [22]. However, for cooling fans, rigid hubs with elastic blades remain prevalent, as demonstrated in aero-engine rotor fatigue and flywheel stability studies [23,24]. These approaches provide a foundation for addressing NEV cooling fan dynamics.
Generally, critical gaps persist in current research, hindering the systematic understanding and optimization of the cooling systems in NEVs. Firstly, simplified modeling methods tailored for NEVs’ cooling fans remain underdeveloped. Existing approaches often adopt oversimplified assumptions or overly complex numerical models, limiting their practicality in real-time control and design optimization. Secondly, few studies have comprehensively investigated the dynamic characteristics of NEVs’ cooling fans under diverse excitation conditions, restricting the ability to predict vibration responses or fatigue life under complex operating scenarios. Thirdly, the underlying mechanisms between vibration amplitudes and fan speed regulation are yet to be quantitatively elucidated. This knowledge gap impedes the forming of vibration-suppression strategies that balance cooling efficiency and structural durability. Moreover, the rapid acquisition of dynamic response characteristics in fan systems not only serves as a critical foundation for fault diagnosis [25,26], but also facilitates noise reduction and vibration mitigation [27,28]. Although a method for rapid fan noise identification through amplitude amplification factor analysis has been proposed, it can only characterize the vibration properties of the fan framework [29]. Collectively, these unresolved issues motivate our research here.
In this paper, the model of the cooling fan for an NEV considering the rigid–flexible coupling is established by combining the analytical model and virtual prototyping to present a rapid and convenient method for the dynamic analysis of the cooling fan with complex blades. The dynamic behavior suffering road excitation and rotor frequency excitation are analyzed, respectively. The experiment is also executed to validate the present model. Key contributions of the research can be summarized as follows:
- (1)
- We propose a combined modeling method for the cooling fan of new energy vehicles (NEVs). Virtual prototyping is employed to acquire critical parameters such as the equivalent stiffness of the fan frame, thereby resolving the challenge of simplified modeling for structurally complex cooling fans.
- (2)
- We introduce a centroidal velocity-based strategy to derive the kinetic equation of fan blades. By replacing the velocity of arbitrary points with that of the blade centroid, this approach significantly simplifies the analytical formulation of kinetic energy for irregularly shaped blades.
- (3)
- We clarify the amplitude–speed dependency mechanism and degree-of-freedom coupling under road-induced and rotational-frequency excitations. The revealed dynamics provide practical guidelines for optimizing vibration suppression and enhancing the fatigue life of high-speed cooling fans in NEVs.
In Section 2, the fan’s virtual prototype is developed using experimental data, and the fan’s frame is simplified. Based on the data of the virtual prototype, the analytical model is established in Section 3, and the multi-blade coordinate (MBC) transformation is introduced to convert a periodically modulated cooling fan system to a time-invariant system. In Section 4, the dynamic behavior of the cooling fan suffering road excitation and rotor frequency excitation is analyzed using the analytical model. The experiments for the cooling fan and the time cost of the proposed method are given in Section 5. Finally, key conclusions are summarized in Section 6.
2. Virtual Prototyping Acquisition and the Frame Simplification
A combined modeling procedure for the cooling fan is illustrated in Figure 1. In this section, virtual prototyping acquisition based on the experimental data and the fan’s frame simplification, i.e., stages 1 and 2 of Figure 1, are described, respectively.
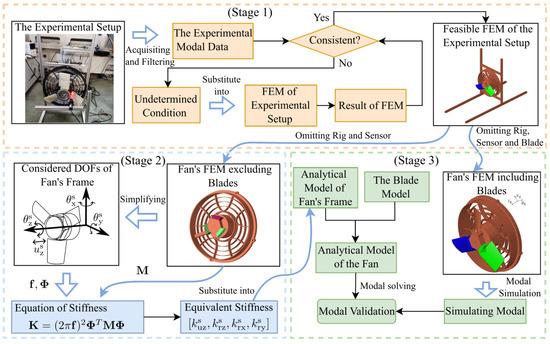
Figure 1.
The procedure of the combined modeling for the cooling fan based on the experimental data and virtual prototyping. (Stage 1) indicates the process of obtaining the virtual prototyping based on the experiment, where the feasible FEM of the experimental setup is obtained by modifying boundary conditions to be consistent with experimental data and then the fan’s FEM excluding blades and including blades are derived; (Stage 2) indicates simplifying the fan’s frame-based FEM, where the fan’s FEM-excluding blades are employed to identify the mass, modal information, and stiffness of considered DOFs; (Stage 3) indicates the process of obtaining the feasible analytical model of the fan which is validated by comparing it with the fan’s FEM model. Orange, blue, and green elements correspond to Stages 1–3, respectively, and arrows indicate data flow between sub-models.
2.1. Virtual Prototyping Based on the Experiment
As shown in Stage 1 of Figure 1, the modal experiment, discussed in Section 5, is employed to obtain the experimental modal data. The undetermined condition, i.e., the equivalent mass of the sensor and its suspended wire, is set initially and substituted into the finite element model (FEM) to obtain the modal result of FEM. Then, the modal results (i.e., natural frequencies) from the experiment and FEM are compared. If they are consistent, a feasible FEM model of the experimental setup is obtained. Otherwise, the equivalent mass of the sensor and its connecting wire will be adjusted and substituted back into the FEM model for recalibration.
In Stage 1 of Figure 1, the validated FEM of the experimental setup is presented in Figure 2a, which contains the bracket and sensor configurations and leads to the challenges in obtaining accurate fan parameters.
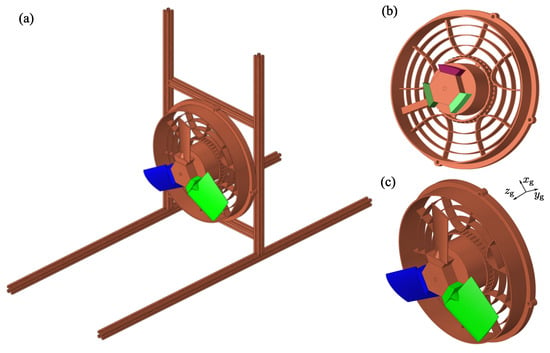
Figure 2.
The FEM model of the cooling fan. (a) The FEM model with the bracket and sensors for the experimental rig. (b) The FEM model excluding blades. (c) The FEM model including blades.
To provide accurate parameters for the frame simplification, the FEM model of the virtual prototype is developed by the validated FEM of the experimental setup, as illustrated in Figure 2. Figure 2b,c depict the FEM models of the fan excluding blades and including blades, which are presented to extract the required parameters and to validate the analytical model, respectively.
Moreover, although the blade with a variable section is also complicated, there is widespread research regarding how to treat the problem. For example, the model and solution method used in [30,31] are employed to establish and solve the blade model, respectively, instead of FEM.
2.2. Simplification of the Fan’s Frame
In this subsection, virtual prototyping based on the experimental data is used to simplify the fan’s frame, as shown in Stage 2 of Figure 1. The mass and moments of inertia are obtained by virtual prototyping, while the frequencies and modal shapes of the considered DOFs are derived from the simulation of this virtual prototyping. Then the information mentioned above is substituted into the equation of stiffness to identify the stiffness of the considered DOFs.
In this virtual prototyping, the density of the blade, Young’s modulus, Poisson’s ratio, and the mass of the fan excluding blades and frame are required as input parameters, as listed in Table 1. Using these inputs, the mass and moments of inertia with respect to , , and , namely , , , and , are calculated through the virtual prototyping process and are also presented in Table 1.

Table 1.
The parameters of the cooling fan.
According to the modal result of fan shown in Figure 3, the DOFs dominated the movement of the fan, including rotational motions about the , , and axes, as well as translational motion along the axis, which are considered and denoted as , , , and . As shown in Figure 4, the fan is divided into three components, including blades, rigid components, and the fan’s frame. The blades and frame of the fan are regarded as the elastic bodies, while the rigid component assembled by the motor and coupling is considered the rigid body. Consequently, the stiffness associated with the fan’s frame, such as , , , and , are determined by the characteristics of the rigid component and frame.
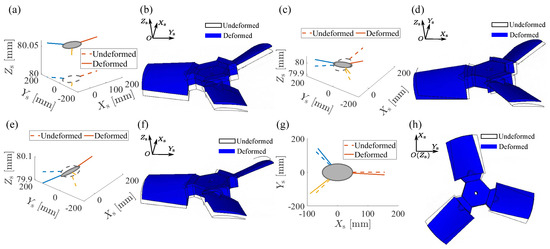
Figure 3.
The modal shape results. (a,c,e,g) represent the 1st to 4th modal shapes obtained using the present method (The yellow dotted and solid lines respectively represent the centroid lines of one of the three blades before and after deformation, and the lines of other colors are similar.), while (b,d,f,h) depict the 1st to 4th modal shapes obtained through FEM.
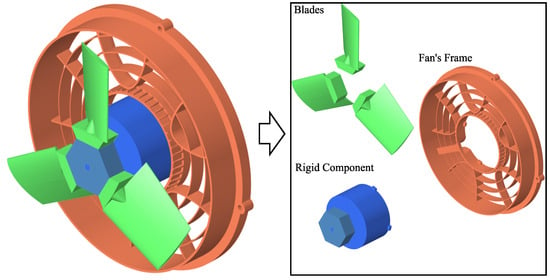
Figure 4.
The schematic diagram illustrates that the cooling fan system is divided into the three components, i.e., the motor assembly, regarded as a rigid component, and the frame of the blades and fans, regarded as elastic components.
To identify the stiffness corresponding to the considered DOFs, modal analysis of the FEM model excluding blades shown in Figure 2b is executed and the frequencies of the considered DOFs are listed in Table 2. Those frequencies and the corresponding stiffnesses satisfy the following relationships:
where denotes the stiffness matrix corresponding to the motions , , , and . is the matrix of the frequencies, i.e., . represents the matrix for the mass and moment of the inertia matrix, while is the modal shape matrix. Based on the results shown in Figure 3, it is reasonable to neglect the coupling between the modes. Consequently, the stiffness values can be conveniently obtained using the following equation:
where the and are the stiffness and mass (or moment of inertia) of the j-th DOF. The stiffness solutions are listed in Table 1.

Table 2.
The modal results of the FEM model without blades.
3. The Rotating Fan Modeling
In this section, the analytical model of the cooling fan is established, which is a system with periodic coefficients. The multi-blade coordinate transformation is introduced to address this system. The transformed system is solved through the implementation of the complex modal analysis method.
3.1. Analytical Model of the Fan
According to the result of Stage 2 in Figure 1, the schematic of the cooling fan with evenly spaced blades is illustrated in Figure 5, where a three-blade configuration is employed for visualization purposes instead of the requirement of the present method. The coordinate systems , , and correspond to the static coordinate system, fan coordinate system, and blade coordinate system, respectively.
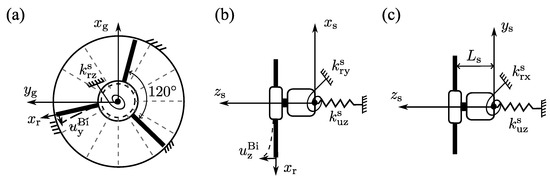
Figure 5.
The schematic of a fan model illustrates the considered DOFs of blade deformations and fan motions (The arrows and dotted lines represent the coordinate systems and spokes of the fan’s frame, respectively). (a) Front view indicates the blade deformation along and the fan’s torsion about . (b) Side view indicates the blade deformation along , the fan’s torsion about and translation along . (c) Top view indicates the fan’s torsion about and translation along .
By modeling the blade as a homogeneous beam, its coordinates in the fan coordinate system are expressed as follows:
where R denotes the radius of the fan’s hub. w and represent the deformation due to the blade’s bending and torsion, respectively. is the pre-twist angle of the blade.
The transformation from single-blade to multi-blade is given as
Considering the fan’s rotating and torsion around the , the transformation from to is written as
where is the rotating speed. is the torsion angle around the .
The transformation from to due to move about the is given as
where is the displacement moving about the . is the distance between two original points of and .
The transformation matrices for rotating around and , which handle the transformation from to are given as follows:
where and denote the torsional angles around the and axes, respectively. The position of an arbitrary point on the blade can be expressed as
Consequently, the velocity of this position is obtained:
To avoid the complicated equation, the velocity of the centroid is introduced:
Substituting the coordinate of the centroid into Equation (3), Equation (11) is obtained:
where and represent the deformations along the corresponding axes in the fan coordinate system, respectively. denotes the n-th modal coordinate of the j-th blade, while N is the number of truncated modes considered. and are the n-th mode shapes corresponding to the and directions, respectively:
where and are the n-th modal shape of the blade’s bending and torsion, and obtained by mathematical or experimental methods. In this paper, the modal shape functions are derived by the modeling and solution method used in Refs. [30,31], as shown in Equation (A1) in Appendix A.
The kinetic energy of the fan including blades is given as follows:
where is the total mass of the fan except blades. , and are moment of inertia with respect to , and for the fan without blades and motor. It is worth noting that the centroid velocity effectively represents the overall dynamic characteristics for low-order bending and torsional modes. However, for higher-order modes, local warping or high-curvature deformation may introduce minor discrepancies. Such modes occur at frequencies far above the fan’s operational range and thus have negligible influence on practical application. is the number of blades. The elastic potential energy of all blades is given as
where is the n-th stiffness in modal space, and is written as
where is the n-th natural frequency of the blade. and A are the density and area of the blade’s section, respectively. The work of the centrifugal force in the modal space is obtained:
where L is the length of the blade. The total potential is added by the potential of the fan’s frame, Equation (14), and the centrifugal working, Equation (16):
The equation of kinetic, total potential, and force work can be given by the Hamilton theory:
where W is the work of the excitation. is used to denote the element of the total work.
According to Equations (13), (17), and (18), the equation of the system is obtained by omitting some higher-order terms:
where is the matrix of the displacements of all DOFs, and is written as
where is the state matrix of j-th blade, and . is the matrix of excitation. , , and are the matrices of mass, gyroscope, and stiffness, respectively, as shown in Equation (A2). Note that in this study, only linear viscous damping is considered; therefore, the friction term is not explicitly included during the derivation of Equation (19). If required, the frictional effect can be directly incorporated into during computation. The gyroscopic terms are contained in the first-order derivative term , and the overall equation represents a linear system with time-varying coefficients.
3.2. Multi-Blade Coordinate Transformation
In the system described by Equation (19), the mass, gyroscopic, and stiffness matrices are time-dependent due to the coupling between the blade rotation and the overall motion of the fan. However, these time-dependent terms can be effectively eliminated by representing the blade deformations as a combination of specific modal shapes. This approach is known as the multi-blade coordinate transformation, i.e., Fourier coordinate transformation. Accordingly, the modal coordinates are expressed as
where , , and represent the -th order Fourier coefficients corresponding to the n-th order modal functions. The term denotes the coefficient associated with the no-response component, which is present only in systems with an even number of blades. denotes the number of harmonics, where for odd and for even [32].
The transformation matrix for an arbitrary number of blades is obtained:
where and are the matrix of the displacement in Fourier coordinates and the transmitting matrix, respectively. They are written as
where is the identity matrix. N is the number of the modal truncation of the blade. has following properties:
where and are given as follows:
Equations (23) and (24) are used to obtain the constant coefficient system of the fan:
where , and are the transformed matrices and obtained by , , and , respectively.
For the fan system, the blade state variables retain their physical significance after applying the multi-blade coordinate transformation. In a three-blade system, , , and correspond to the modal coordinates of the fan’s plane [33]. The associated modal shapes are illustrated in Figure 6, where (a), (b), and (c) represent the symmetric motion, asymmetric motion 1, and asymmetric motion 2, respectively.

Figure 6.
The modal shape in multi-blade coordinate system (dotted lines are used to denote the deformed plan of the fan.): (a) symmetric motion, (b) asymmetric motion 1, (c) asymmetric motion 2.
3.3. Solution by Complex Modal Method
Although the fan system has been transformed into a constant coefficient system, solving the system represented by Equation (25) remains challenging due to its asymmetry. To address this complexity, the complex modal method is employed to solve the system containing gyroscopic terms. Consequently, Equation (25) is reformulated as
where the transformed matrix of force is . The transformed matrices of mass, gyroscope, and stiffness, i.e., the constant matrices, are , , and , respectively.
According to the complex modal method, the solution of Equation (26) is assumed as
Substituting Equation (27) into Equation (26) and letting the , the eigenvalue and eigenvector are obtained as follows:
where the imaginary part of is the natural frequency and the eigenvector is the corresponding modal shape.
For the system in Equation (26), the lift eigenvector is also necessary to decouple this system
where the superscript ‘H’ donates the conjugate transpose.
Here, and denote the right and left modal matrices of the system, expressed as and , where and are the n-th right and left mode shapes, respectively.
Introducing the and substituting it into Equation (30), the decoupled system is obtained:
where , .
According to the properties of the eigenvalue and eigenvector [34], Equation (30) is obtained:
where , .
Furthermore, the amplitudes of the fan’s considered DOFs suffering the excitation are given as
where is a complex column matrix whose dimensions correspond to the motion degrees of freedom of the blades and impeller. The complex values indicate the presence of phase differences between the motions of different degrees of freedom.
4. Dynamic Analysis in Various Excitations
In this section, a specific vehicle cooling fan is analyzed using both the FEM and the proposed model. The natural frequencies and modal shapes obtained from these methods are compared to validate the accuracy of the proposed model, as shown in Stage 3 of Figure 1. Subsequently, the dynamic behavior of the fan under road excitation and rotor frequency excitation is investigated.
4.1. Modal Examination w.r.t FEM Results
A specific fan is illustrated in Figure 3b. To simplify the analysis, the fan’s frame is represented in a more concise form in Figure 5. The modal functions of the blade are provided in Equation (A1). The material properties and parameters of the fan, as listed in Table 1, are utilized in both the proposed model and the FEM analysis.
The natural frequencies obtained from both the FEM analysis and the proposed method are presented in Table 3. Quantitatively, the discrepancies for the first seven modes are within 5%, while those for the higher-order modes (above the 8th) range from 8% to 12%. The deviation mainly arises from the centroidal simplification, which neglects higher-order warping and local inertial effects. Nevertheless, these high-frequency modes exceed the fan’s working range and do not affect engineering accuracy. The table includes only the relevant frequency results from the FEM analysis. The frequencies corresponding to modes 1 through 8 show minimal discrepancies between the FEM and the proposed method, whereas higher-order frequencies exhibit more significant differences. This disparity primarily arises from the centroid approximation used to simplify the fan system, leading to the neglect of warping effects, which notably influence torsional modes. However, these higher-order frequencies are well above the operational frequency range and thus have minimal impact on the fan’s dynamic behavior. Additionally, certain DOFs considered in the FEM analysis are not included in the proposed method, contributing to the observed differences. Furthermore, the proposed method models the blade as a beam, whereas the FEM analysis treats it as a solid element.

Table 3.
The natural frequencies obtained from the FEM and the present method.
To validate the effectiveness of the proposed method, the FEM model with blades, as shown in Figure 2c, is utilized to obtain simulation results for comparison with those from the analytical model. The modal shapes obtained by both FEM and the proposed method are presented in Figure 3. It can be observed that the modal shapes from both methods are in good agreement. Additionally, the natural frequencies calculated by FEM and the analytical model are listed in Table 3, indicating that the discrepancies are within an acceptable range, particularly for the lower-order modes. These results demonstrate the applicability of the proposed method to vehicle cooling fans, as verified by the data in Table 3 and Figure 3. While the blade’s natural frequencies are higher than the operating frequencies, the natural frequencies of the fan’s frame are more critical for resonance avoidance in design considerations.
4.2. Effect of Road Excitation
To investigate the impact of road excitation on the fan system, excitations are applied to the DOFs of and with dimensionless amplitudes of and a frequency of , respectively. is a normalized excitation amplitude defined as the ratio between the actual axial force and the characteristic stiffness of the fan system. This dimensionless formulation allows the analysis results to be generalized to fans with different scales and working conditions. The adopted value corresponds to the typical load magnitude observed in standard operating conditions. The fan operates at a rotational speed of , and the system’s response is shown in Figure 7.
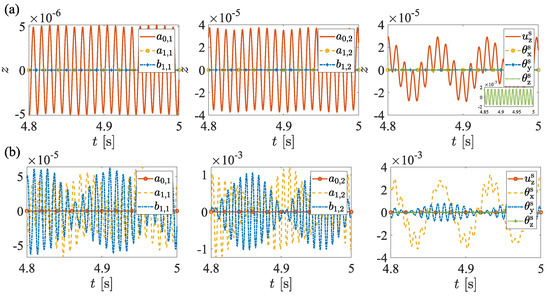
Figure 7.
The time history of considered DOFs for excitations with and Hz. (a) The excitation acting on . (b) The excitation acting on .
According to Figure 7, all DOFs can be classified into two groups: the symmetric group, which includes , , , and , and the asymmetric group, which comprises , , , , , and . As depicted in Figure 7a,b, the displacements of the asymmetric group are nearly zero when the excitation is applied to , whereas the symmetric group exhibits a significant response. These findings indicate that coupling exists within each group but not between them.
The coupling behavior is governed by the matrices and , as expressed in Equations (A3) and (A4) in Appendix A. In particular, the coupling is primarily influenced by the mass matrix , since is a diagonal matrix.
Furthermore, the system’s response to forced excitation is not characterized by a single periodic vibration. This phenomenon arises from the consideration of gyroscopic effects rather than damping. Consequently, multiple natural frequencies are present in the steady-state response under forced excitation, as discussed in [34].
The power spectra of the system’s response to excitations applied at and are presented in Figure 8. These spectra reveal the presence of significant frequency components other than the excitation frequencies, highlighting the influence of gyroscopic effects on the system’s dynamic behavior. The gyroscopic effect introduces coupling between translational and rotational DOFs, resulting in the splitting of forward and backward whirling modes. Physically, as the rotational speed increases, the inertia matrix becomes asymmetric, causing frequency bifurcation and multi-frequency responses. This effect explains the appearance of sideband frequencies in the measured vibration spectra and reflects the intrinsic dynamic behavior of high-speed rotating systems such as cooling fans.
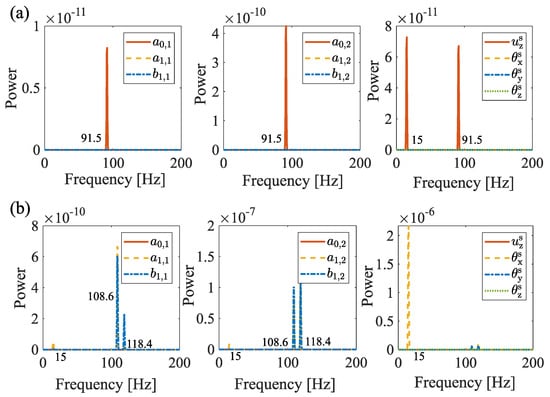
Figure 8.
The spectrum of considered DOFs for excitations with , Hz. (a) Excitation acting on . (b) Excitation acting on .
The amplitude responses within the operational frequency range are presented in Figure 9. To clearly illustrate the trend of the curves, normalized amplitudes are used in this figure. Although some curves overlap, this does not imply that their actual amplitudes are identical. As shown in Figure 9a, the amplitude of remains nearly constant under excitation applied at . In contrast, the amplitudes of the other DOFs within the symmetric group decrease with increasing rotational speed due to coupling effects. According to Figure 10, the natural frequencies of , , and are higher than the excitation frequency, with the variation in the natural frequency of being less pronounced than that of and . Consequently, and primarily influence the amplitude trends. Their amplitudes decrease as their natural frequencies diverge from the excitation frequency.
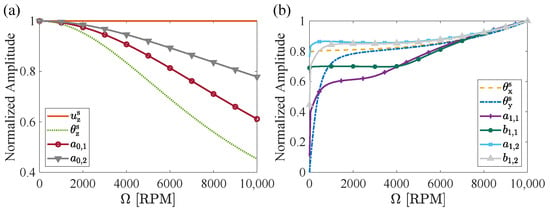
Figure 9.
The vibration amplitude of considered DOFs for excitations with and Hz as a function of speed. (a) Excitation acting on . (b) Excitation acting on .
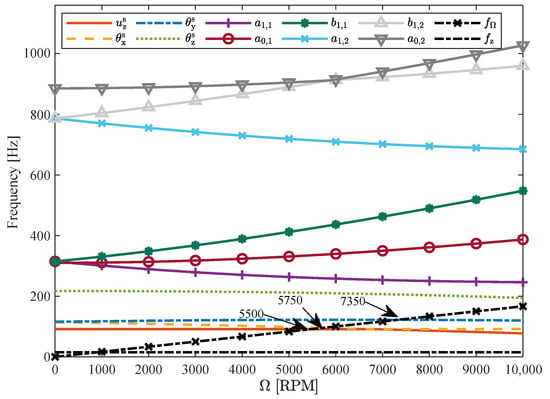
Figure 10.
Campbell diagram (the natural frequencies for the considered DOFs as a function of speed).
As shown in Figure 9b, the amplitudes of the asymmetric group increase with rising rotational speed when the excitation is applied to . According to Figure 10, the frequencies of , , and approach the excitation frequency as the speed increases, while the frequencies of , , and diverge from it. However, the amplitudes are primarily influenced by , , and due to their closer proximity to the excitation frequencies. Consequently, the amplitudes of , , and increase with increasing speed. Additionally, the amplitudes of , , and also rise due to coupling effects. Figure 9 further indicates that the excitation influences only the DOFs within the same group and has negligible impact on the DOFs of the other group, regardless of the rotational speed.
Figure 11 illustrates the trajectory of the blade tip and hub center in the static coordinate system, representing the actual displacement of the blade. When the excitation is applied to , the blade tip exhibits a complex trajectory due to coupling effects, whereas the hub center follows a linear path. Conversely, when the excitation is applied to , the amplitude of the blade tip’s motion increases significantly, and the trajectory of the hub center becomes more complex. These results indicate that the amplitude of the response is more pronounced when the excitation is applied to the torsional DOF compared to when it is applied to the translational DOF.

Figure 11.
The trajectory for excitations with and Hz (The blue line represents the trajectory of the leaf tip, and the yellow line is the highlighted display of a section of it). (a) The trajectory of blade tip at excitation acting on , (b) The trajectory of hub center at excitation acting on . (c) The trajectory of blade tip at excitation acting on . (d) The trajectory of hub center at excitation acting on .
4.3. Effect of Rotor Frequency Excitation
Rotor frequency excitation is applied to the DOFs of and to investigate the impact of road excitation on the fan system. As shown in Figure 12, the normalized amplitudes are presented as a function of speed, with the excitation characterized by a dimensionless amplitude of and a frequency of .
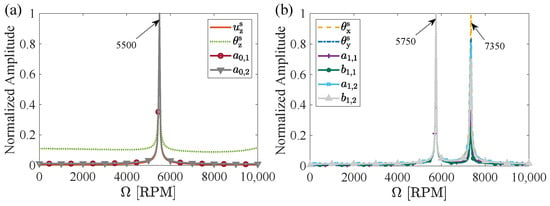
Figure 12.
The normalized amplitude of and as a function of speed. (a) Excitation acting on . (b) Excitation acting on .
A resonance peak is observed at 5500 RPM in Figure 12a. According to the Campbell diagram shown in Figure 10, the frequencies of and coincide at 5500 RPM. Additional resonance peaks are identified at 5750 RPM and 7350 RPM in Figure 12b. These peaks correspond to the intersecting frequencies of , , and , as indicated in Figure 10. To mitigate resonance, optimization of the fan frame’s stiffness and damping is recommended, given that the blade’s natural frequencies are significantly higher than the working frequency. The Campbell diagram, as shown in Figure 10, serves as an effective tool for this optimization.
The trajectory of the blade tip at resonance is shown in Figure 13. The amplitudes at RPM and RPM are significantly larger than that at RPM, indicating the onset of asymmetric group vibration. Compared to Figure 11, the trajectory of the blade tip at resonance is simpler, due to the synchronization of frequency and phase. However, the amplitudes at resonance are notably higher than those observed at non-resonant frequencies.

Figure 13.
The trajectory for excitations with (The blue line represents the trajectory of the leaf tip, and the yellow line is the highlighted display of a section of it): (a) , (b) , (c) .
5. Experimental Validation
In this section, both model testing and vibration testing at various rotational speeds of the cooling fan are conducted to validate the fan model.
5.1. Experiment Setup and Procedure
The experimental setup is shown in Figure 14, where the positions and orientations of the acceleration sensors are indicated. Sensors 1 to 3 are positioned at the rear of the electric motor to capture the maximum acceleration along the -axis, while minimizing the impact on the fan’s operation. Sensor 4 is placed on the bracket to monitor its vibration.
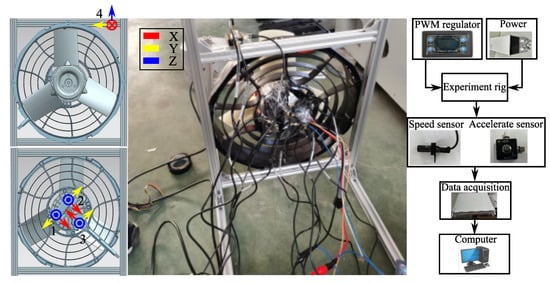
Figure 14.
The experimental device, where the left part shows the positions and orientations of sensors 1, 2, 3, and 4. The middle part presents the whole experimental rig. The right part outlines the control and data acquisition process.
In this experiment, the influence of the sensor mass and wiring is significant and cannot be ignored. However, due to the difficulty in obtaining the exact mass values—complicated by factors such as whether the wires are suspended or supported—a direct measurement is challenging. To address this issue, an indirect validation method is proposed, as shown in Figure 15. The experimental data undergoes processing, including filtering, to obtain the relevant results. By setting initial values for the unknown parameters, FEM results incorporating the sensors are generated and subsequently compared with the experimental results. These parameters are then adjusted to fit the experimental data. The final FEM model, excluding the sensors, is established using the updated parameters, and the results are compared to the analytical findings to validate the model presented in this paper.
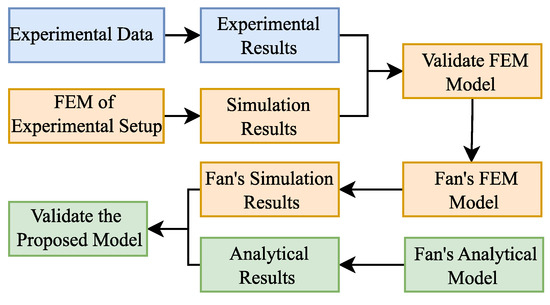
Figure 15.
The procedure of the indirect validation method.
5.2. Modal Test
In the modal test, a hammer is used to excite the vibration of the experimental rig. The resulting vibrations are captured by the acceleration sensors and recorded through a data acquisition system. The processed data, shown in Figure 16, are then analyzed. A Butterworth filter, which is a linear filter that minimally alters the data’s coherence, is applied to the data with a passband frequency range set between 10 and 3000 Hz. The Power Spectral Density (PSD) and Magnitude Squared Coherence (MSC) of the filtered data are presented in Figure 16. The equation for the MSC is provided as follows:
where is the MSC of signal x and y at frequency f, whose range is . is the cross power spectral density of x and y. and are the PSD for x and y, respectively. The peaks of the PSD with high MSC () are taken to exclude the disturbing frequency, and the desired modal frequencies are obtained, as shown in Table 4.
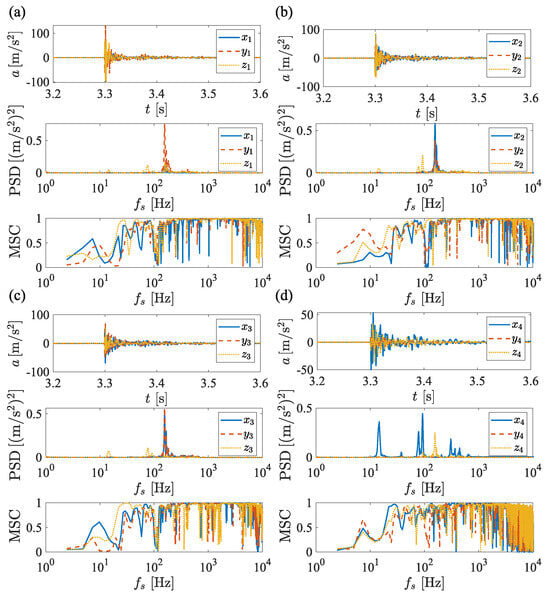
Figure 16.
The experimental results of the modal test. (a–d) The time history, PSD, and MSC for the sensor 1∼4.

Table 4.
The natural frequencies obtained from the experiment and FEM model with the bracket.
The FEM model, including the bracket and sensors, is illustrated in Figure 2a. By adjusting the mass of the sensors, the modal frequencies are obtained from the FEM model with the bracket and sensors, as presented in Table 4. The discrepancies between the FEM results and the experimental data are minimal, as shown in Table 4, indicating the accuracy and reliability of the FEM model with the bracket and sensors.
5.3. Vibration Test for Various Rotating Speeds
The experimental rig, shown in Figure 14, is also utilized in the operating test of the fan. A speed sensor is employed to record the fan’s rotational speed, which is set to , 2000, and 3000 RPM, respectively. In comparison to the signals from and , the signal exhibits a higher amplitude to mitigate noise, as shown in Figure 17.

Figure 17.
The experimental esults of the vibration test at , 2000, and 3000 RPM. (a) Time histories of speed, (b) PSD of the speed, and (c) PSD of the acceleration.
As shown in Figure 17a, the fan speed is adjusted to approach the target speed, but slight fluctuations are still present. The frequency of these fluctuations is below the lowest frequency of interest, 10 Hz, as depicted in Figure 17b. The fluctuations within the range of 0–10 Hz are removed using a Butterworth filter. Figure 17c illustrates the PSD of the acceleration at the three different speeds, where is defined as . For both RPM and RPM, the lowest frequency corresponds to , while for RPM, the lowest frequency is , and additional frequencies are present. This suggests that a different type of vibration is triggered at RPM.
The FEM model with blades, as shown in Figure 2c, is used to obtain the results under the rotating speed , 2000, and 3000 RPM, respectively. These results are then compared with those from the analytical model, as depicted in Figure 18. The responses in both the time and frequency domains are found to be similar, thereby validating the reliability and applicability of the present model.
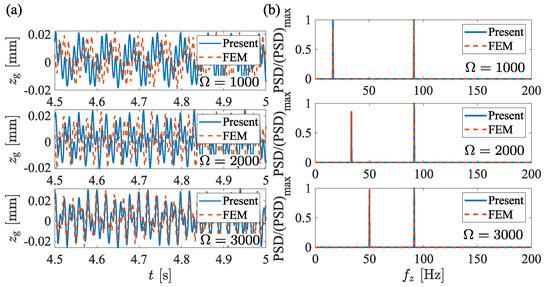
Figure 18.
The results obtained from the present model and the FEM at , 2000, and 3000 RPM. (a) Time histories of the acceleration; (b) PSD of the acceleration.
5.4. Time Cost of Present Method and FEM
For the vibration response analysis of the fan under n distinct rotational speed conditions, the FEM with 1770 k elements requires n iteration of simulation and takes 600 s per iteration. However, the present method contains 3 iterations of simulation, n iterations of blade model solution, and n iterations of analytical model. The total time of the present method and FEM are listed in Table 5. Considering the few time cost of the blade modal solution and the fan’s analytical model, the present method is significantly superior to the FEM under a large iteration count n.

Table 5.
The natural frequencies obtained from the experiment and FEM model with the bracket.
6. Conclusions
This study presents a combined modeling approach for cooling fans in NEVs, which obtains the virtual prototype based on the experimental data and establishes the theoretical model by employing the virtual prototype to simplify the fan frame structure and identify essential parameters. The blade’s kinetic energy formulation expressed by the centroid velocity expression is taken to reduce the model complexity. The model is solved using multi-blade coordinate transformation and complex modal analysis, and the dynamic behavior under road excitation and rotational frequency excitation is investigated. Experimental validation confirms the effectiveness of the proposed model. The main conclusions are given as follows:
- (1)
- The proposed methodology demonstrates significant computational efficiency improvements over FEM analysis, particularly which costs merely about 1/70th of the FEM processing time in scenarios requiring extensive iterative computations. This approach exhibits superior practicality for parametric studies of fan systems, such as enabling effective optimization of stiffness and damping characteristics across broad speed ranges.
- (2)
- The fan response analysis by the proposed method reveals that the system’s DOFs can be categorically decomposed into two distinct groups based on their coupling characteristics: symmetric and asymmetric DOFs (see Figure 6), which exhibit complete dynamic decoupling.
- (3)
- The response of the considered DOFs depends on the coupling effects as well as their natural frequency under road excitation. For an arbitrary DOF, its amplitude is primarily governed by the DOF whose natural frequency is closest to the excitation frequency within the same group.
- (4)
- The proposed methodology enables efficient generation of frequency-sweep response characteristics for the fan’s DOFs, including Campbell diagram visualization and rotational speed-dependent amplitude profiles. The results demonstrate that resonant phenomena remain confined within each respective DOF group (symmetric/asymmetric), exhibiting no cross-group coupling effects.
Future research will focus on applying the proposed fan model within thermal management systems. Building upon the findings of this study, the control strategies for thermal management will be explored, taking fan vibration into account to ensure optimal temperature regulation while minimizing vibration.
Author Contributions
Conceptualization, N.Z. and Y.R.; methodology, N.Z., Y.R. and Z.L.; software, N.Z. and H.L.; writing—original draft preparation, N.Z. and Y.R.; review and editing, Y.R., Z.L. and H.L. All authors have read and agreed to the published version of the manuscript.
Funding
This research was funded by the National Natural Science Foundation of China under grant number 52572439.
Data Availability Statement
The data presented in this study are available on request from the corresponding author. The data are not publicly available due to project confidentiality.
Conflicts of Interest
Yuankai Ren was employed by the company Chery Automobile Co., Ltd. The remaining authors declare that the research was conducted in the absence of any commercial or financial relationships that could be construed as a potential conflict of interest.
Appendix A. Supplementary Equations
References
- Huang, B.; Xu, J.; Wang, J.; Xu, L.; Chen, X. Numerical Investigation on the Aerodynamic and Aeroacoustic Characteristics in New Energy Vehicle Cooling Fan with Shroud. Processes 2024, 12, 333. [Google Scholar] [CrossRef]
- Dong, W.; Hu, D.; Shen, Y.; Li, J.; Yang, Q. Feasibility verification of reducing the total sound pressure level of multiple cooling fans for fuel cell vehicle. Int. J. Green Energy 2024, 21, 26–42. [Google Scholar] [CrossRef]
- Lakzayi, H.; Pouransari, Z.; KargarAbjahan, M. Numerical and experimental investigation of aerodynamic noise from a cooling fan in a turbulent flow. Int. J. Aeroacoust. 2024, 23, 38–59. [Google Scholar] [CrossRef]
- Lim, J.; Sim, W.; Yun, S.; Lee, D.; Chung, J. Reduction of vibration forces transmitted from a radiator cooling fan to a vehicle body. J. Sound Vib. 2018, 419, 183–199. [Google Scholar] [CrossRef]
- Ren, J.; Xie, Y. Environmental vibration experiment and optimization of new energy car battery cooling fan. Fresenius Environ. Bull. 2019, 28, 9318–9326. [Google Scholar]
- Zhao, Y.; Feng, J.; Zhou, Q.; Peng, X. Blade fracture analysis of a motor cooling fan in a high-speed reciprocating compressor package. Eng. Fail. Anal. 2018, 89, 88–99. [Google Scholar] [CrossRef]
- Wei, W.; Ghoreishi, S.H. Engine Cooling Fan Noise and Vibration Problem Caused by a Switching Power Supply; Technical Report; SAE Technical Paper; SAE International: Warrendale, PA, USA, 2003. [Google Scholar]
- Fairuz, Z.; Sufian, S.; Abdullah, M.; Zubair, M.; Aziz, M.A. Effect of piezoelectric fan mode shape on the heat transfer characteristics. Int. Commun. Heat Mass Transf. 2014, 52, 140–151. [Google Scholar] [CrossRef]
- Park, M.J.; Lee, D.J. Sources of broadband noise of an automotive cooling fan. Appl. Acoust. 2017, 118, 66–75. [Google Scholar] [CrossRef]
- Feng, X.; Leng, Y.; Guo, X.; Liang, H.; Dong, C. Wave propagation phenomenon of poroelastic piezoelectric micro-fan actuators for power equipment detection. Acta Mech. 2025, 236, 4025–4040. [Google Scholar] [CrossRef]
- Koyuncu, A.; Erdoğmuş, A.B. Experimental and Numerical Investigation of Thermal Performance of Piezoelectric Fan. In Proceedings of the 2024 23rd IEEE Intersociety Conference on Thermal and Thermomechanical Phenomena in Electronic Systems (ITherm), Aurora, CO, USA, 28–31 May 2024; pp. 1–8. [Google Scholar]
- Sun, Z.; Chai, P.; Tian, J.; Du, Z.; Ouyang, H. Aerodynamic Noise Characteristics of Axial Flow Fan in Narrow Space and Noise Reduction Based on Flow Control. In Proceedings of the ASME Turbo Expo 2022: Turbomachinery Technical Conference and Exposition, Rotterdam, The Netherlands, 13–17 June 2022; Volume 86113, p. V10CT33A008. [Google Scholar]
- Guo, R.; Mi, T.; Li, L.; Luo, R. Research on aerodynamic performance and noise reduction of high-voltage fans on fuel cell vehicles. Appl. Acoust. 2022, 186, 108454. [Google Scholar] [CrossRef]
- Zhang, Z.; Wang, D.; Guo, Y.; Shen, L.; Wang, X. Study on the Influence of Fan and Fan Cowl on Intake Air Parameters of Cooling Module. J. Therm. Sci. Eng. Appl. 2024, 16, 031005. [Google Scholar] [CrossRef]
- Ferrari, C.; Beccati, N.; Pedrielli, F. CFD Methodology for an Underhood Analysis towards the Optimum Fan Position in a Compact Off-Road Machine. Energies 2023, 16, 4369. [Google Scholar] [CrossRef]
- Saini, P.; Defoe, J. The effect of blade count on body force model performance for axial fans. J. Turbomach. 2021, 143, 071011. [Google Scholar] [CrossRef]
- Dosne, C.; Barrier, R.; Bourasseau, S.; Carini, M.; Moretti, R.; Peter, J. A First Assessment of Adjoint Body-Force Modeling Capabilities for Fan Design. In Proceedings of the AIAA SCITECH 2024 Forum, Orlando, FL, USA, 8–12 January 2024; p. 2640. [Google Scholar]
- Kong, Q.; Jia, W. A Three-Dimensional Body Force Modeling of Fans in Windmilling Condition and Its Application. Aerospace 2023, 10, 724. [Google Scholar] [CrossRef]
- Mao, Y.; Dang, T.Q. Simple approach for modeling fan systems with a computational-fluid-dynamics-based body-force model. J. Propuls. Power 2020, 36, 642–654. [Google Scholar] [CrossRef]
- Ikeda, T.; Harata, Y.; Ishida, Y. Parametric instability and localization of vibrations in three-blade wind turbines. J. Comput. Nonlinear Dyn. 2018, 13, 071001. [Google Scholar] [CrossRef]
- Hansen, M.H. Improved modal dynamics of wind turbines to avoid stall-induced vibrations. Wind Energy: Int. J. Prog. Appl. Wind Power Convers. Technol. 2003, 6, 179–195. [Google Scholar] [CrossRef]
- Yang, C.H.; Huang, S.C. The influence of disk’s flexibility on coupling vibration of shaft–disk–blades systems. J. Sound Vib. 2007, 301, 1–17. [Google Scholar] [CrossRef]
- Liu, D.; Hong, J. Failure analysis of backward whirl motion in an aero-engine rotor. Eng. Fail. Anal. 2021, 128, 105620. [Google Scholar] [CrossRef]
- Ren, Y.; Su, D.; Fang, J. Whirling modes stability criterion for a magnetically suspended flywheel rotor with significant gyroscopic effects and bending modes. IEEE Trans. Power Electron. 2013, 28, 5890–5901. [Google Scholar] [CrossRef]
- Wang, Y.; Yuan, X.; Lin, Y.; Gu, J.; Zhang, M. A semi-supervised multi-scale deep adversarial model for fan anomaly detection. IEEE Trans. Consum. Electron. 2023, 70, 3539–3547. [Google Scholar] [CrossRef]
- Zhu, L.; Zhu, Z.; Jiang, W. Research on ventilation and noise reduction technology for substations based on deep learning. In Proceedings of the 2024 3rd International Conference on Energy and Power Engineering, Control Engineering (EPECE), Chengdu, China, 23–25 February 2024; pp. 14–17. [Google Scholar]
- Chen, J.; Yang, X.; Yang, C. Analysis and optimization of beat vibration for an electric vehicle. Acoust. Technol. 2023, 42, 338–345. [Google Scholar]
- Paudel, S.; Niroula, S.; Bhattarai, S.; Sapkota, P.; Chitrakar, S. Vibrational Analysis on Cooling Fan with Induced Mechanical Faults. IOP Conf. Ser. Earth Environ. Sci. 2024, 1385, 012011. [Google Scholar] [CrossRef]
- Zhong, Y.; Li, Y. The Rapid Identification and Evaluation of the Resonant Noise of a Cooling Module Based on the Frequency Difference Sensitivity Method. Sensors 2023, 23, 9568. [Google Scholar] [CrossRef] [PubMed]
- De Biagi, V.; Chiaia, B.; Marano, G.C.; Fiore, A.; Greco, R.; Sardone, L.; Cucuzza, R.; Cascella, G.L.; Spinelli, M.; Lagaros, N.D. Series solution of beams with variable cross-section. Procedia Manuf. 2020, 44, 489–496. [Google Scholar] [CrossRef]
- Zou, L.; Wang, Z.; Zong, Z.; Zou, D.y.; Zhang, S. Solving shock wave with discontinuity by enhanced differential transform method (EDTM). Appl. Math. Mech. 2012, 33, 1569–1582. [Google Scholar] [CrossRef]
- Peters, D.A. Fast Floquet theory and trim for multi-bladed rotorcraft. J. Am. Helicopter Soc. 1994, 39, 82–89. [Google Scholar] [CrossRef]
- Filsoof, O.T.; Yde, A.; Bøttcher, P.; Zhang, X. On critical aeroelastic modes of a tri-rotor wind turbine. Int. J. Mech. Sci. 2021, 204, 106525. [Google Scholar] [CrossRef]
- Newland, D.E. Mechanical Vibration Analysis and Computation; Courier Corporation: North Chelmsford, MA, USA, 2006. [Google Scholar]
Disclaimer/Publisher’s Note: The statements, opinions and data contained in all publications are solely those of the individual author(s) and contributor(s) and not of MDPI and/or the editor(s). MDPI and/or the editor(s) disclaim responsibility for any injury to people or property resulting from any ideas, methods, instructions or products referred to in the content. |
© 2025 by the authors. Licensee MDPI, Basel, Switzerland. This article is an open access article distributed under the terms and conditions of the Creative Commons Attribution (CC BY) license (https://creativecommons.org/licenses/by/4.0/).