Abstract
Utilizing machine vision technology based on YOLOv5, a six-axis robot can quickly identify and classify targets. However, when the YOLOv5 model is used for the recognition and grasping of small workpieces, issues such as low precision and missed detections frequently occur. This paper proposes an enhanced object recognition algorithm, integrating a CBAM attention module and an improved loss function into YOLOv5 to control the hand–eye coordination of the six-axis robot during grasping. The CBAM attention module is incorporated into the backbone network of YOLOv5 to enhance its feature extraction capabilities, while the original loss function is modified to accelerate convergence and improve regression accuracy. An experimental platform for six-axis robot hand–eye coordination grasping was built, and grasping experiments were conducted. The proposed method significantly improves the robot’s grasping accuracy, with a 99.59% mAP0.5 and a 90.83% successful grasping rate, effectively addressing the challenges of low accuracy and missed detections in traditional systems.
1. Introduction
In today’s automated industrial manufacturing processes, the demand for sorting different types of workpieces is increasing, resulting in increasingly complex sorting tasks. Traditional industrial robots achieve grasping functionality through manual demonstration and recording of movements for programming. This method only allows for the grasping of objects of the same type, with fixed positions, leading to low efficiency. It cannot meet the modern industrial manufacturing needs, where goods are diverse and updated rapidly. To address this, the integration of machine vision with traditional robotic arms, enabling them with perception capabilities through object detection algorithms, has become a hot research topic in the field. This makes the study of more efficient and higher-performing object detection algorithms of great significance [1].
On the basis of scale-invariant feature transform (SIFT) and speeded-up robust features (SURF), An Weisheng et al. [2] introduced improvements by referencing the Gaussian image pyramid algorithm, proposing a novel image registration algorithm. Their experimental results demonstrated significant improvements in both matching accuracy and speed. Wang J’s [3] team developed a new object recognition and positioning method by combining SIFT and moment invariants, and their experimental results showed that this algorithm exhibited strong robustness.
However, the above classical object recognition methods rely on predefined image features, making them vulnerable to environmental disturbances such as lighting variations and occlusions, leading to unsatisfactory recognition results. With the rapid development of modern computing technologies and the advent of affordable sensors, deep learning-based object recognition algorithms have gradually come into focus. Compared to traditional feature extraction methods, deep learning can automatically learn and extract high-level feature representations from data. Its multi-level and hierarchical structures give it superior flexibility, while extensive data training offers better generalization capabilities [4]. Du Xuedan et al. [5] used Faster R-CNN as the object detection model to accomplish object recognition and localization tasks, though it suffers from slow detection speed. Additionally, as a two-stage method, the training process is relatively complex. Gang Liu [6] proposed a lightweight object detection algorithm and an improved YOLOv5 robot, introducing C3Ghost and GhostConv modules into the YOLOv5 backbone to reduce the computational load required for feature extraction and enhance detection speed. Object detection algorithms represented by the YOLO series [7,8] have gained widespread application in industry due to their advantages in detection accuracy and speed.
The YOLOv5 algorithm achieves an ideal balance between detection accuracy and speed. However, its accuracy in detecting small objects remains somewhat insufficient, and false detections often occur when the target occupies a small portion of the image or has indistinct features. To address this, this paper uses the smallest model in the YOLOv5 family, YOLOv5s, as the baseline network. While maintaining the speed advantage of the YOLOv5 model, we integrate the Convolutional Block Attention Module (CBAM) to enhance the network’s feature perception capabilities, which helps in detecting small objects and overcoming challenges in feature extraction.
Additionally, CBAM is combined with the EIoU (enhanced intersection over union) loss function. Compared to other loss functions, EIoU is more effective in handling cases where there is little or no overlap between bounding boxes, reducing offset errors between them, ensuring more accurate bounding box regression, and improving the precision of model training.
Finally, we created a dataset for training and validation and built a robotic system to conduct grasping experiments based on the improved algorithm. A host computer control system was designed, resulting in a complete six-axis robot hand–eye coordination grasping system.
2. YOLOv5 Object Detection Algorithm
The YOLO algorithm divides an image into fixed-size grids, treating each grid cell as a basic unit for detection [9]. Each grid cell is responsible for predicting bounding boxes and categories of potential objects within that cell, along with confidence scores for each predicted bounding box. Once the bounding boxes are predicted, the algorithm calculates the discrepancies between these predicted boxes and the ground truth object positions. Subsequently, through non-maximum suppression, it computes the intersection over union to eliminate highly overlapping bounding boxes, retaining those most likely to contain objects. Finally, based on a set confidence threshold, the algorithm filters out detections with high confidence scores, effectively improving detection accuracy.
YOLOv5 is one of the top-performing object detection algorithms currently available and is widely used in industrial applications [10]. The model is primarily composed of four parts: the input module, backbone network, feature fusion module, and prediction layer. The overall architecture of the YOLOv5 network is illustrated in Figure 1.
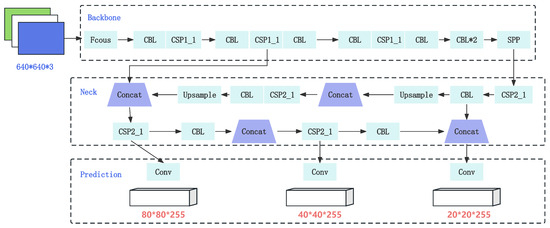
Figure 1.
YOLOv5 algorithm’s structure.
In practical manufacturing scenarios, the targets to be grasped include both large-to-medium-sized items such as valves, three-way valves, and stainless steel elbows, as well as smaller objects like screws, small hex wrenches, and other small components. While YOLOv5 demonstrates effective detection for large and medium-sized prominent objects, its performance may not be ideal for detecting small targets with few samples and complex backgrounds. To enhance feature representation and improve detection performance for small target objects, improvements are needed in both feature information extraction and loss function design see Figure 2.

Figure 2.
YOLOv5 detection results: (a) is wrong detection, (b) missed detection, and (c) successful detection.
3. Attention Mechanism and Loss Function-Based YOLOv5 Algorithm Improvement
3.1. Introducing CBAM Attention Mechanism
By incorporating the CBAM (Convolutional Block Attention Module) attention mechanism into the YOLOv5 backbone structure [11], the network is able to focus more on useful information while ignoring irrelevant details, thereby extracting more fine-grained features. This improvement in feature extraction boosts the network’s efficiency. CBAM is a lightweight convolutional attention network that combines both channel attention and spatial attention mechanisms [12]. Given an intermediate feature map , CBAM applies the channel attention mechanism by performing both global average pooling (GAP) and global max pooling (GMP) on the input features, resulting in two tensors, where C is the number of channels. These tensors are then passed through a shared fully connected network and a sigmoid activation function to generate new vectors. These vectors are multiplied with the original feature map to obtain the channel attention features, as shown in Equation (1).
In this context, represents the descriptor vector of channel C after global average pooling, while is the descriptor vector of channel C after global max pooling. is the weight matrix of the first fully connected layer, and is the weight matrix of the second fully connected layer. denotes the ReLU activation function, and represents the sigmoid activation function, which maps the channel attention values to the [0, 1] range. This process reduces the spatial dimensions of the input feature map while preserving the most significant features of the image.
The spatial attention mechanism helps the model focus on the spatial regions of the feature layer that are important, i.e., determining which spatial parameters should be prioritized. This mechanism compresses the channel dimension. Similar to the channel attention mechanism, it applies global average pooling (GAP) and global max pooling (GMP) on the input feature map along the channel dimension, producing two feature descriptors. These two descriptors are concatenated along the channel dimension to form a 2-channel feature map F. Then, a convolution operation with a kernel is applied to enhance the receptive field, followed by the sigmoid activation function. Finally, the result is element-wise multiplied with the original feature map, yielding the spatial attention features, as shown in Equation (2).
Through dynamic adjustments with channel attention and spatial attention mechanisms, CBAM adapts the response of the feature map, allowing the integrated YOLOv5 model to focus more on important regions and features within the image. This helps the network reduce its focus on background information and concentrate more on the features of small targets, thereby improving the accuracy of small target detection. Moreover, CBAM is designed to be relatively lightweight, minimizing its impact on the performance of YOLOv5. As illustrated in Figure 3, a CBAM module is embedded after each C3_F module in the neck layer, resulting in the creation of a new model named YOLOv5s-I.
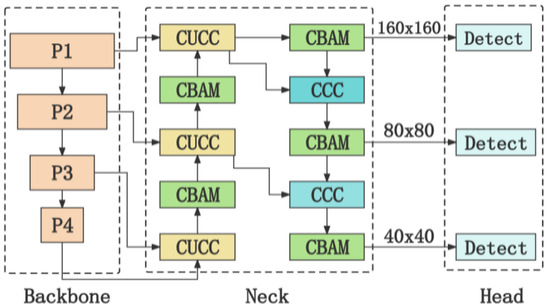
Figure 3.
YOLOv5s-I model.
3.2. Loss Function Improvement
The loss function in YOLOv5 serves as a method to quantify the accuracy of the model’s predictions, where its value represents the disparity between the predicted values and the ground truth. By evaluating the degree of overlap between the predicted bounding boxes and the ground truth boxes, minimizing the loss function allows the model to converge.
Traditional object detection loss functions rely on aggregating metrics related to bounding box regression, such as the distance between predicted and ground truth boxes, overlap area, and aspect ratios. The most commonly used metric in bounding box regression loss calculation is intersection over union (IoU). The principle of IoU is depicted in Figure 4, where IoU measures the overlap ratio between the candidate bound and the ground truth bound. Specifically, IoU is calculated as the area of intersection between two rectangles divided by the area of their union.
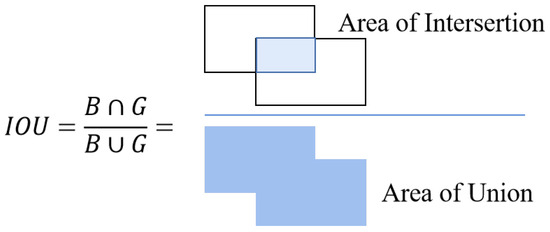
Figure 4.
Diagram of loU.
The CIoU (complete intersection over union) loss function used by YOLOv5 helps the model predict the position and size of the bounding box more accurately, thereby improving the precision of object detection. The CIoU calculation formula is as follows:
In the formula, IoU represents the basic intersection over union metric. denotes the Euclidean distance between the center points of the predicted bounding box and the ground truth box, while c is the diagonal length of the smallest enclosing box that contains both the predicted and ground truth boxes. is the penalty term for the aspect ratio difference, where is a balancing coefficient and v measures the difference in aspect ratio between the predicted box and the ground truth box.
CIoU takes into account the overlap area, the distance between the center points, and the aspect ratio, providing an accurate measure of the relative position between the predicted and ground truth boxes. It also addresses the optimization of both horizontal and vertical directions. However, CIoU does not consider the alignment between the orientation of the predicted and ground truth boxes, which can result in slower convergence speeds [13]. To address this issue, EIoU is chosen as the loss function in this paper, replacing CIoU. EIoU, which is an improved version of CIoU, further enhances performance. The formula for the EIoU loss function is shown in Equation (4).
This loss function consists of three components: overlap loss, center distance loss, and width–height loss. The first two components follow the approach used in CIoU, while the third part in EIoU independently handles the width and height differences. This allows the network to simultaneously optimize the center point and the size of the predicted box. By separately adjusting the width and height, the model can more smoothly adapt the shape of the predicted bounding box to the variations in small metal objects, resulting in more accurate boundary box predictions.
4. Hardware Experiment Setup
4.1. Dataset Creation
The experimental setup described in Table 1 is employed in this study. The YOLOv5s neural network model is trained both before and after the improvement. The training parameters utilize the Adam optimization algorithm, with a batch size of 8, a momentum factor of 0.92, and a weight decay coefficient of 0.0005.

Table 1.
Environment.
The quality of the sample dataset directly influences the detection performance of deep learning models. The research method proposed in this paper is primarily applied to the recognition and detection of industrial parts. However, there is currently no publicly available dataset for industrial parts. Considering the complexity of real-world scenarios, to further evaluate the model’s capabilities, this study selects six types of parts with varying sizes, complex features, diverse shapes and materials, and significant color differences, as shown in Figure 5.
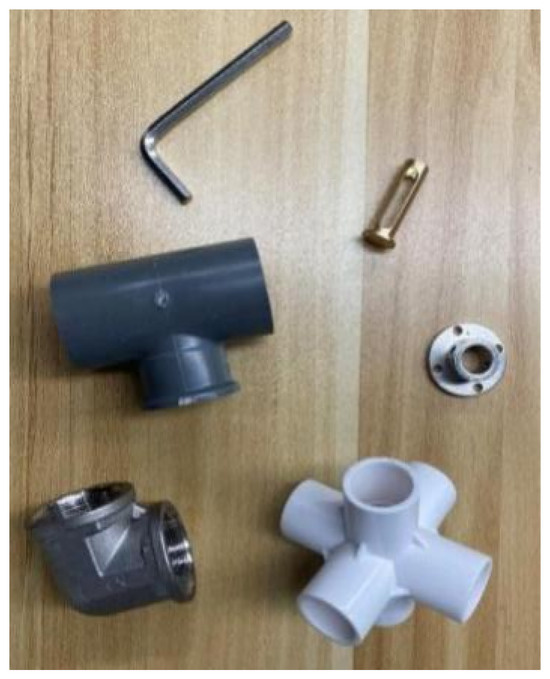
Figure 5.
Sample model of custom dataset.
In the experiment, a custom dataset was created using samples of screwdriver, valve, tee valve, stainless steel elbow, 6-port valves, and flange coupling. Images were captured using an Intel RealSense D435 camera in various orientations. To enhance the model’s generalization ability and the detection accuracy of the workpieces, diverse data were generated by altering the number of instances for each class, varying the poses and positions of the objects, changing backgrounds, and introducing unrelated objects to disrupt the scenes. These methods were employed to increase the diversity of the dataset. Additionally, image processing functions [14] from OpenCV were utilized for data augmentation to achieve optimal training results.
The annotation of the part images was performed manually using the LabelImg tool, with bounding boxes labeled, named, and categorized accordingly. The dataset was then randomly divided into training, testing, and validation sets in a 4:1:1 ratio, resulting in 2712 images for training, 678 images for testing, and 678 images for validation. The experiment’s testing set comprised a total of 4068 images. Figure 6 and Figure 7 depict the distribution of dataset sizes and center positions, respectively.
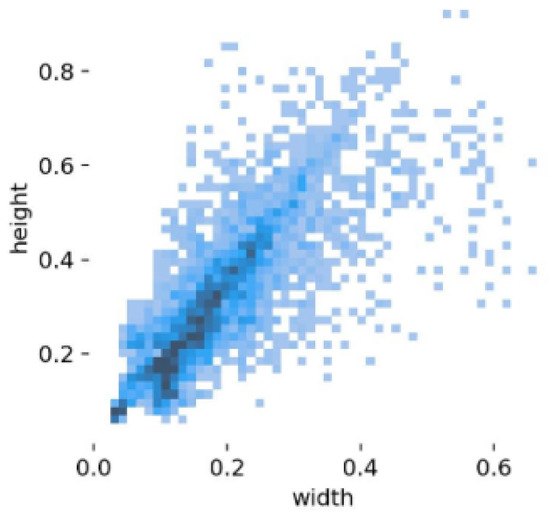
Figure 6.
Distribution of object sizes in training.
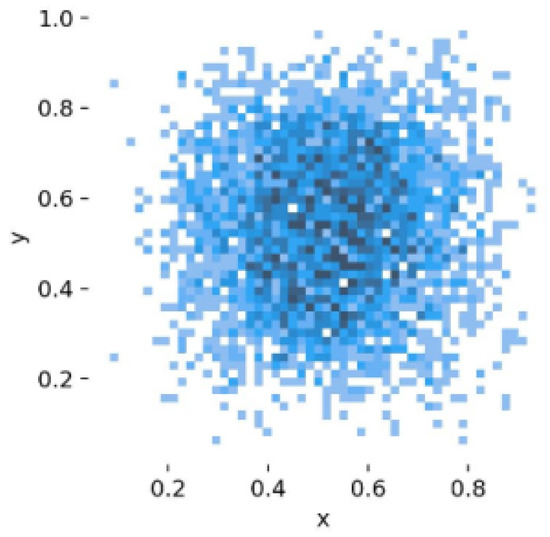
Figure 7.
Distribution of object center positions in training.
4.2. Evaluation Index
To evaluate the effectiveness of the model improvements, four key metrics were used to assess the algorithm’s performance [15]: Precision (P), mAP@0.5, mAP@0.95, and detection speed (FPS). Precision (P) measures the algorithm’s accuracy in predicting true positives. A higher precision indicates stronger prediction capability for positive samples in a classification algorithm. mAP (mean average precision) is utilized to evaluate the overall performance of an object detection algorithm. mAP@0.5 and mAP@0.95 represent the average precision when the IoU threshold is set to 0.5 and are the average precision across IoU thresholds of 0.5 and 0.95, respectively. These are crucial indicators of an algorithm’s accuracy in object detection tasks. A high mAP suggests that the algorithm achieves high detection precision and recall across different categories. FPS (frames per second) refers to the number of images the object detection network can process per second, measuring the model’s detection speed.
4.3. Hand–Eye Calibration
To ensure the robot accurately grasps the workpiece, pixel coordinates must be converted, which requires hand–eye calibration of the robot [16]. In the integration of robot systems, such as with cameras and robots, two different camera extrinsic calibration methods can be used: eye-in-hand and eye-to-hand. The eye-in-hand method involves attaching the camera to the robot’s end effector, which reduces the absolute measurement error from the camera and improves accuracy during grasping. However, this approach requires more complex calculations, involves complicated calibration processes, and faces difficulties when the camera cannot easily approach the target or when interference occurs. The eye-to-hand method, on the other hand, separates the camera and robot, allowing only the robot to move. Calibration is performed by capturing images of the calibration board from different positions and orientations, while the camera remains fixed. This method requires only a single external calibration, and the results can be used for an extended period without frequent adjustments. It simplifies the calibration and computation process, improving system stability and efficiency. Tasks in industrial production, such as automated sorting and quality inspection, often rely on a static, global perspective that requires a fixed camera field of view. Therefore, in this paper, the eye-to-hand method was chosen to construct the hand–eye system. The calibration diagrams are shown in Figure 8 and Figure 9.
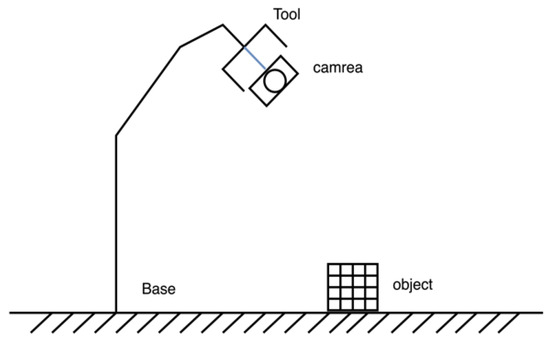
Figure 8.
Schematic diagram of eye-in-hand hand–eye calibration.
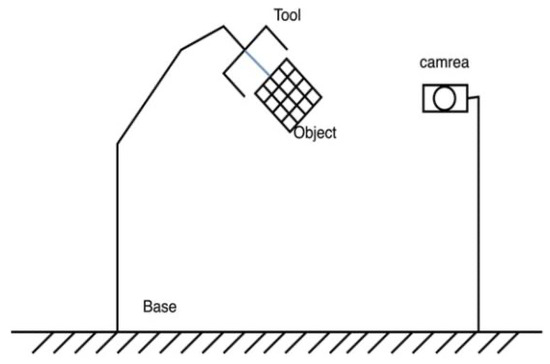
Figure 9.
Schematic diagram of eye-to-hand hand–eye calibration.
During calibration, the calibration marker is first fixed at the end effector of the robot. The positions of the calibration board at different poses are recorded in the camera’s field of view, and the corresponding positions of the robot end effector are recorded through the robot’s upper computer. Because the relative pose between the robot end effector and the calibration board is fixed, the pixel coordinates of these known feature points and the coordinates of the robot end effector are paired, and the relative transformation matrix between the robot end effector and the camera is calculated using the corresponding mathematical model. ArUco marker [17] is used as the calibration marker, which is a type of 2D barcode based on OpenCV. It is attached to the robot end effector, and the robot is controlled to move so that the camera sees the calibration board fixed at the robot end effector.
Multiple sets of end effector poses of the robot are recorded by the upper computer during the shooting process. During shooting, it is necessary to ensure that the ArUco marker is fully captured by the camera, and the distance and pose between the camera and the marker change. The pose of the calibration board in the camera is output through the \aruco_signal\pose topic [18] in the rostopic using the robot’s upper computer.
A total of 12 sets of poses of the calibration board in the camera and the poses of the robot arm in the upper computer were recorded. The commonly used calibration algorithms Tsai–Lenz [19], Park [20], Horaud, and Daniilidis [21] were applied to calculate the calibration results. The results obtained by the four methods were basically consistent, and eventually, the Tsai–Lenz algorithm was adopted. This algorithm converts the hand–eye calibration problem into a system of linear equations and uses the least squares method to solve the system of linear equations to obtain the relative position and orientation between the robot end effector and the camera. It has a fast calculation speed and simple steps. Based on the 12 sets of data, the relative transformation matrix between the robot end effector and the camera was calculated, thereby establishing the coordinate transformation relationship between the robot and the camera [22].
When the robot’s workspace remains at the same horizontal height, the plane-based nine-point calibration method is used for calibration [23], which is characterized by fast speed and high accuracy. To establish the corresponding relationship, the robot gripper end effector is sequentially directed to each sampling point, and the coordinates of the nine centers in the robot coordinate system are obtained from the robot upper computer software. It is important to ensure that the calibration board remains horizontal during shooting, and the nine points on the calibration board need to be clearly photographed and identified.
By using OpenCV to obtain the pixel coordinates of the nine centers of the circles and obtaining the coordinates of the nine robot end effector points through the robot upper computer, the transformation relationship between the robot base coordinate system and the pixel coordinate system can be obtained using singular value decomposition (SVD) [24].
4.4. Experimental Verification of Coordinate Conversion Module
The above content provides a theoretical analysis from the perspective of the camera imaging model, detailing the entire process of coordinate calculation. This section validates the theoretical algorithms described above. Firstly, sampling operations are performed on points in the images to measure the pixel coordinates at different positions. Using the plane-based nine-point calibration method, a hand–eye relationship transformation is conducted, and the transformed coordinates are recorded. Secondly, by operating the robot’s upper computer, the robot end effector is moved to the same position, and the coordinates of the robot base coordinate system at this time are recorded. According to the requirements of object recognition, multiple experiments are conducted on the objects, and the average error of six experiments is calculated. The experimental results are shown in Table 2.

Table 2.
Sampling of 6 sets of pose calibration.
From Table 2, it can be observed that based on the measurements from the RealSense D435 camera and the results from the robot’s upper computer software, the positioning errors in the x and y directions are less than 4 mm, with an average Euclidean distance error of 0.237 m. The translation error is controlled within the millimeter level, meeting the requirements for robot grasping. Therefore, the experiment validates the effectiveness of using the RealSense D435 sensor for target localization, and the approach of solving coordinate transformations using camera calibration and imaging model principles is proven to be effective.
4.5. System Workflow
The main functionality of the overall system control program is implemented through Python 3.7.3 programming, with a graphical user interface (GUI) for human–machine interaction in workpiece detection. The system is divided into three components: target detection, coordinate conversion, and robot motion control.
After running the system, the trained and improved YOLOv5 workpiece detection model is first loaded. Once the detection model is loaded, the RealSense camera captures real-time workpiece data, and the improved YOLOv5 object recognition algorithm detects the categories and pixel coordinates of the center points of all workpieces on the workstation. The system then uses the coordinate transformation matrix, obtained through internal and external camera calibration, to convert these coordinates into the robot arm’s coordinate system.
The coordinates output by the conversion module are processed through the robot arm’s inverse kinematics model, translating them into joint angles for the robot arm’s six axes. These are then formatted into corresponding command instructions. The serial communication module acts as a bridge within the robotic system, connecting the vision module to the motion module. In frameworks above Qt5, the cross-platform serial class QSerialPort is provided, which facilitates serial port configuration across different platforms.
Next, instructions are sent via serial communication to the robot arm’s control cabinet. Upon receiving the instructions, the robot controller synchronizes the robot’s real-time movements according to the commands, enabling precise remote control of the robotic arm in real time. Figure 8 illustrates the real-time grasping platform environment for the robotic arm.
5. Result and Discussion
5.1. Ablation Studies
To validate the superiority of the proposed improved algorithm, an ablation study is conducted on the individual modules of the enhanced algorithm. First, the CBAM module is integrated after each C3_F module in the neck layer of the original YOLOv5s algorithm. Then, the CIoU loss is replaced by EIoU loss as the loss function, resulting in the final improved algorithm model, YOLOv5s-I. A comparative experiment is performed between this improved algorithm and the original YOLOv5s model. The evaluation metrics used are mAP@0.5 and mAP@0.95. The comparative experiments were conducted using pretrained weights for consistency. The training process was carried out for 200 epochs, with a batch size of eight images per iteration. The results are shown in the table below, see Table 3.

Table 3.
Ablation study.
From the table, we can observe that compared to Number 1 (YOLOv5s), Number 2, which incorporates the CBAM attention mechanism, improves detection accuracy (mAP@0.5) by 1.71 percentage points. This indicates that the CBAM attention mechanism has a positive effect on improving detection accuracy. Number 3, built upon Number 2 by replacing the CIoU loss function with the EIoU loss function, forms the final improved model (YOLOv5s-I). Compared to Number 2, its detection accuracy reaches 99.59%, an increase of 2.86 percentage points, demonstrating the superiority of EIoU over CIoU in enhancing model performance. Figure 10 and Figure 11 illustrate the comparison between the loss function and precision during the training of the improved model and the original model. The rate of decline in the loss function effectively reflects the convergence speed of the model, see Figure 12.
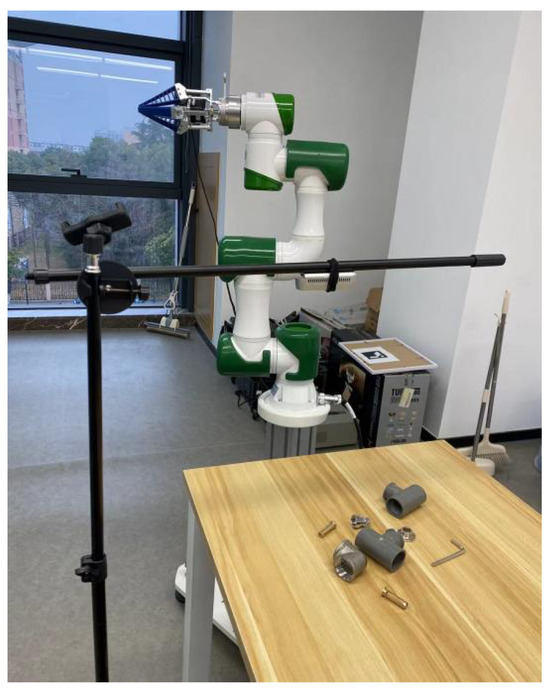
Figure 10.
System workflow.
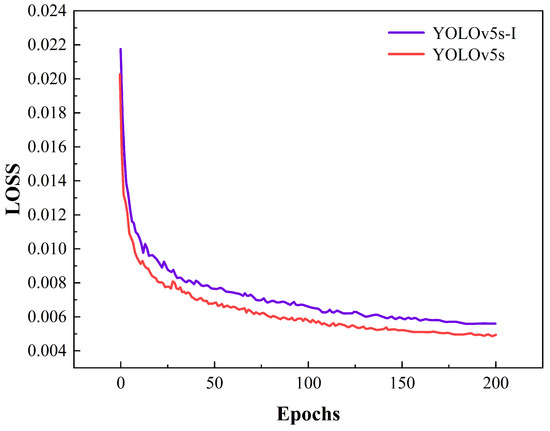
Figure 11.
Comparison of loss curves before and after improvement.
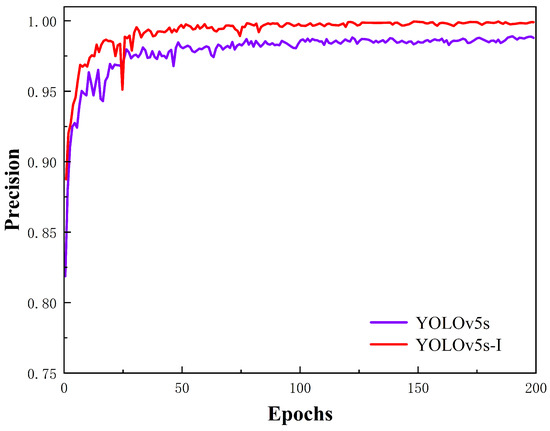
Figure 12.
Comparison of precision curves before and after improvement.
5.2. Comparative Experiments of Mainstream Object Detection Algorithms
To validate the superiority of the proposed improved algorithm compared to mainstream object detection algorithms, we conducted comparative experiments using the performance metrics mAP@0.5 and FPS. The algorithms compared included Faster R-CNN, RetinaNet, YOLOv4, and YOLOv5s. Faster R-CNN is a classic two-stage object detection algorithm, while RetinaNet is a well-known single-stage detector. YOLOv4 and YOLOv5s are efficient models within the YOLO series. By evaluating these algorithms under the same experimental conditions, we can comprehensively assess the performance of the improved algorithm and ensure the reliability of the experimental results.
The results are presented in Table 4. The comparison shows that the proposed improved algorithm achieves the highest detection accuracy among mainstream object detection algorithms. While YOLOv4 has a detection accuracy of 96.26%, which is 1.24% higher than YOLOv5s, its detection speed is significantly lower than YOLOv5s. The proposed improved algorithm, despite sacrificing some detection speed, outperforms YOLOv5s in detection accuracy by 4.57%.

Table 4.
Comparison of mainstream algorithms.
In summary, the proposed improved algorithm demonstrates a significant advantage in detection accuracy over mainstream object detection algorithms while maintaining a competitive detection speed. It achieves an optimal balance between accuracy and speed, effectively addressing issues of false positives and missed detections. The next step involves applying the algorithm to practical robotic grasping systems for further experimentation.
5.3. Robotic Arm Grasping Experiments
After completing the system functionality debugging, experiments were conducted on the robot grasping on the experimental platform. Initially, the six types of target objects, namely, screwdriver, valve, stainless steel elbow, tee valve, Six-way valves, and flange coupling, were randomly placed on the experimental platform. Each type of object was individually grasped in a single-object scenario, with twenty repetitions for each object. For multi-object detection, the above objects were randomly combined into groups of at least three, and each object was grasped twenty times. A statistical histogram of the grasping results for different types of objects is presented in Figure 13.
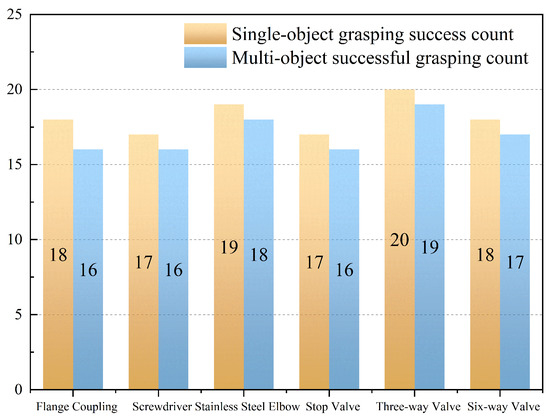
Figure 13.
Statistical analysis of successful grasping attempts by the robotic arm.
As shown in Figure 13, the success rate of grasping is slightly lower than the detection accuracy calculated earlier. This discrepancy is influenced by factors such as the properties of the metal workpieces and their placement. In single-object grasping scenarios, objects like screwdrivers and stop valves are challenging to grasp due to their smooth surfaces and small diameters and thicknesses, which make them prone to slipping during the process. Additionally, the flange coupling has an irregular shape, making it difficult to grip, which affects the stability and gripping capacity of the robotic arm. Therefore, these workpieces exhibit a lower success rate. In future experiments, adding friction-enhancing materials such as rubber pads to the surface of the robotic gripper and increasing the contact points of the gripper could help solve these issues.
In the multi-object grasping experiments, the overall success rate was slightly lower than that of single-object grasping. The primary reason for this is that multiple objects may interfere with or block each other. Additionally, the robot needs to perform multiple movements and grasping actions, which reduces the overall success rate. The results of grasping different types of workpieces in various environments are shown in Table 5.

Table 5.
Statistical analysis of robotic grasping experiment success rate.
The detection results show that the improved YOLOv5s-based object recognition and positioning algorithm selected in this paper, along with the constructed robotic system, achieved a 90.8% success rate in grasping individual small workpieces and an 85% success rate in multi-target recognition and grasping. The accuracy and real-time performance of the grasping operations fall within acceptable error margins, meeting the requirements of the sorting system.
6. Conclusions
This paper addresses the issues encountered by robots when grasping small workpieces and proposes a YOLOv5-based six-axis robotic hand–eye coordination control system, utilizing an improved object detection algorithm. The goal was to solve the challenges posed by varying workpiece sizes and poor detection performance for small targets. Leveraging the YOLOv5 target detection algorithm as its foundation, the system integrates the CBAM attention mechanism and optimized loss functions. Training and validation are conducted on a custom-made workpiece dataset, and a dedicated hardware and software platform is designed for real grasping experiments. Experimental data indicate that the improved algorithm achieves a detection accuracy of 99.59% under real-time detection conditions, representing a 4.57% enhancement. This improvement reduces the occurrences of missed and false detections for small workpieces, thereby enabling the robot to effectively recognize and grasp most small-target workpieces automatically. Future research can focus on optimizing the robot’s grasping strategy. For example, after detecting a target object, further investigation could explore how to automatically generate key grasping points using visual information, enabling the robotic arm to grasp the object at these critical points, thereby improving the success rate of grasping and further enhancing the automatic sorting system of the six-axis robot.
Author Contributions
Conceptualization, Y.W. and C.L.; data curation, L.Z., S.L. and H.H.; formal analysis, Y.Z.; investigation, Y.W.; methodology, C.L. and Q.Z.; project administration, Y.W., C.L. and Q.Z.; resources, Q.Z.; software, L.Z. and Y.Z.; supervision, Y.W.; validation, Y.S., S.L. and H.H.; visualization, L.Z. and Y.S.; writing—original draft, Y.W. and C.L. All authors have read and agreed to the published version of the manuscript.
Funding
This research was funded by Huzhou City’s “Unveiling and Commanding” Project (grant number: 2022JB03), Zhejiang Provincial “Jianbing” “Lingyan” Research and Development Program of China (grant number: 2022C01132), Scientific Research Fund of Zhejiang Provincial Education Department (grant number: Y202351058), and Postgraduate Research and Innovation Project of Huzhou University (grant number: 2024KYCX37).
Data Availability Statement
Data not available due to [ethical/legal/commercial] restrictions.
Conflicts of Interest
The authors have no relevant financial or non-financial interests to disclose.
References
- Qing, W.; Yulu, W. Research on the Impact of Industrial Robot Application on the High-quality Development of Manufacturing Industry. J. Ind. Technol. Econ. 2023, 42, 115–124. [Google Scholar]
- An, W.; Yu, R.; Wu, Y. Image Registration Algorithm Based on FAST and SURF. Comput. Eng. 2015, 41, 232–235+239. [Google Scholar]
- Han, Z.; Wei, S. Research status and development trend of deep learning. China Educ. Technol. Equip. 2023, 74–76+80. [Google Scholar] [CrossRef]
- Wang, J.; Dou, H.; Zheng, S.; Sugisaka, M. Target Recognition based on Machine Vision for Industrial Sorting Robot. J. Robot. Netw. Artif. Life 2015, 2, 100–102. [Google Scholar] [CrossRef][Green Version]
- Du, X.; Cai, Y.; Lu, T.; Wang, S.; Yan, Z. A Deep Learning Based Robotic Arm Gripping Method. Robot 2017, 39, 820–828+837. [Google Scholar] [CrossRef]
- Liu, G.; Hu, Y.; Chen, Z.; Guo, J.; Ni, P. Lightweight object detection algorithm for robots with improved YOLOv5. Eng. Appl. Artif. Intell. 2023, 123, 106217. [Google Scholar] [CrossRef]
- Li, X.; Deng, Y.; Chen, Z.; He, X. Improved YOLOv5’s Foreign Object Debris Detection Algorithm for Airport Runways. Comput. Eng. Appl. 2023, 59, 202–211. [Google Scholar]
- Song, Q.; Li, S.; Bai, Q.; Yang, J.; Zhang, X.; Li, Z.; Duan, Z. Object Detection Method for Grasping Robot Based on Improved YOLOv5. Micromachines 2021, 12, 1273. [Google Scholar] [CrossRef] [PubMed]
- Jiang, P.; Ergu, D.; Liu, F.; Cai, Y.; Ma, B. A Review of Yolo algorithm developments. Procedia Comput. Sci. 2022, 199, 1066–1073. [Google Scholar] [CrossRef]
- Ma, Z.; Zeng, Y.; Zhang, L.; Li, J. The Workpiece Sorting Method Based on Improved YOLOv5 For Vision Robotic Arm. In Proceedings of the 2022 IEEE International Conference on Mechatronics and Automation (ICMA), Guilin, China, 7–10 August 2022; pp. 481–486. [Google Scholar]
- Woo, S.; Park, J.; Lee, J.Y.; Kweon, I.S. Cbam: Convolutional block attention module. In Proceedings of the European Conference on Computer Vision (ECCV), Munich, Germany, 8–14 September 2018; pp. 3–19. [Google Scholar]
- Chen, J. Research and Implementation of Target Detection Based on YOLOv3 Algorithm. Master’s Thesis, University of Electronic Science and Technology of China, Chengdu, China, 2020. [Google Scholar]
- Zhang, Y.F.; Ren, W.; Zhang, Z.; Jia, Z.; Wang, L.; Tan, T. Focal and efficient IOU loss for accurate bounding box regression. Neurocomputing 2022, 506, 146–157. [Google Scholar] [CrossRef]
- Chen, J.; Tam, D.; Raffel, C.; Bansal, M.; Yang, D. An empirical survey of data augmentation for limited data learning in nlp. Trans. Assoc. Comput. Linguist. 2023, 11, 191–211. [Google Scholar] [CrossRef]
- Lu, D.; Ma, W. Gesture Recognition Based on Improved YOLOv4-tiny Algorithm. J. Electron. Inf. Technol. 2021, 43, 3257–3265. [Google Scholar]
- Zhang, Y.; Ma, J.; Wang, Y.; Wang, Q. Study on 3-Dimensions Hand-Eye Calibration Method for Robot Grasping. Mach. Tool Hydraul. 2022, 50, 38–42. [Google Scholar]
- Wang, L.; Mao, Q. Position measurement method for tunnel segment grabbing based on RGB and depth information fusion. J. Zhejiang Univ. (Eng. Sci.) 2023, 57, 47–54. [Google Scholar]
- Sani, M.F.; Karimian, G. Automatic navigation and landing of an indoor AR. drone quadrotor using ArUco marker and inertial sensors. In Proceedings of the 2017 International Conference on Computer and Drone Applications (IConDA), Kuching, Malaysia, 9–11 November 2017; pp. 102–107. [Google Scholar]
- Zhao, Y.; Xie, W.; Li, W.; Hu, J. Robot hand-eye calibration algorithm based on covariance matrix adaptation evolutionary strategy. J. Comput. Appl. 2023, 43, 3225. [Google Scholar]
- Horaud, R.; Dornaika, F. Hand-eye calibration. Int. J. Robot. Res. 1995, 14, 195–210. [Google Scholar] [CrossRef]
- Quigley, M.; Conley, K.; Gerkey, B.; Faust, J.; Foote, T.; Leibs, J.; Wheeler, R.; Ng, A.Y. ROS: An open-source Robot Operating System. In Proceedings of the ICRA Workshop on Open Source Software, Kobe, Japan, 12–17 May 2009; Volume 3, p. 5. [Google Scholar]
- Wu, K.; Gong, Q.; Zhu, S.; Chen, N. Construction of Automatic Hand-Eye Calibration System Based on ROS Platform. In International Workshop of Advanced Manufacturing and Automation; Springer: Singapore, 2022; pp. 50–57. [Google Scholar]
- Sun, H.; Cao, Y.; Bian, K.; Wei, A.; Kong, Q. Design and Application of a Nine-Point Calibration-based Robotic Arm for Gripping. Mod. Ind. Econ. Informationization 2023, 13, 107–109+144. [Google Scholar]
- Anowar, F.; Sadaoui, S.; Selim, B. Conceptual and empirical comparison of dimensionality reduction algorithms (pca, kpca, lda, mds, svd, lle, isomap, le, ica, t-sne). Comput. Sci. Rev. 2021, 40, 100378. [Google Scholar] [CrossRef]
Disclaimer/Publisher’s Note: The statements, opinions and data contained in all publications are solely those of the individual author(s) and contributor(s) and not of MDPI and/or the editor(s). MDPI and/or the editor(s) disclaim responsibility for any injury to people or property resulting from any ideas, methods, instructions or products referred to in the content. |
© 2024 by the authors. Licensee MDPI, Basel, Switzerland. This article is an open access article distributed under the terms and conditions of the Creative Commons Attribution (CC BY) license (https://creativecommons.org/licenses/by/4.0/).