Abstract
This study introduces an integrated structural optimization design method based on a BP neural network and NSGA-II multi-objective genetic algorithm. Initially, a two-dimensional axisymmetric finite element model of the Giant Magnetostrictive Actuator (GMA) was established, and the coupling simulation of the electromagnetic field, structural field, and temperature field was conducted to obtain the GMA’s performance parameters. Subsequently, the structural parameters of the GMA magnetic circuit, including the magnetic conducting ring, magnetic conducting sidewall, magnetic conducting body, and coil, were used as inputs, and the axial magnetic induction intensity, uniformity of axial magnetic induction intensity, and coil loss on the Giant Magnetostrictive Material (GMM) rod were used as outputs to establish a back propagation (BP) neural network model. This model delineated the nonlinear relationship between structural parameters and performance parameters. Then, the BP-NSGA-II algorithm was applied to perform multi-objective optimization on the actuator’s structural parameters, resulting in a set of Pareto optimal non-dominated solutions, from which a set of optimal solutions was obtained using the entropy weight method. Finally, simulation analysis of this optimal solution was conducted, indicating that under a 5 A power supply excitation, the maximum axial magnetic induction intensity on the optimized GMM rod increased from 0.87 T to 1.12 T; the uniformity of axial magnetic induction intensity improved from 93.1% to 96.5%; and the coil loss decreased from 7.79 × 10⁴ W/m3 to 4.97 × 10⁴ W/m3. Based on the optimization results, a prototype actuator was produced, and the test results of the prototype’s output characteristics proved the feasibility of this optimization design method.
1. Introduction
Giant Magnetostrictive Materials are a special class of materials that are characterized by their magnetostrictive effect. At room temperature, these materials demonstrate high efficiency in the conversion between mechanical and electrical energy, high energy density, low driving voltage, fast response speed, and wide operating bandwidth [1,2,3,4]. These characteristics make them widely applicable in fields such as sensors, driving servo valves, precision micro-displacement actuators, and mechanical vibration [5,6,7,8,9].
The Giant Magnetostrictive Actuator (GMA) is a novel type of actuator that employs Giant Magnetostrictive Material (GMM) as its primary driving component. The working principle of the GMA is based on the magnetostrictive effect: when an electric current is passed through the coil, a magnetic field is generated in the coil by the principle of electromagnetic induction, causing the GMM rod located within the coil to change its length. This, in turn, drives the output rod to produce a certain output displacement and force. The magnetic field’s strength directly influences the GMA’s output performance; a stronger magnetic field results in greater strain on the GMM, yielding larger displacement and force outputs. The magnetic circuit’s shape and size dictate the magnetic field’s distribution and intensity. A well-structured magnetic circuit can focus the magnetic field, enhancing the GMM’s operational efficiency. The coil’s structure size, number of turns, and arrangement also impact the magnetic field’s generation. Therefore, an impractical design of the magnetic circuit and coil structure could result in a low electromagnetic conversion efficiency and uneven axial magnetic field distribution along the GMM rod, further affecting the motion stability and dynamic response characteristics of the actuator [10]. Additionally, when the GMA operates under low-frequency excitation, coil losses generate heat, leading to heating of the GMM and energy loss [11]. Given that GMM has temperature-sensitive characteristics, temperature variations can affect its magnetic properties, thereby influencing the actuator’s output characteristics [12]. Therefore, it is crucial to design the magnetic circuit and coil structure reasonably, optimize the magnetic field intensity and the axial distribution’s uniformity on the GMM rod, and reduce coil losses while meeting the design performance. Some of the literature has presented structural optimization designs to improve the performance of actuators and magnetostrictive transducers that utilize GMM as the driving element. Yafang Li et al. [13] analyzed and studied the internal magnetic field and output characteristics of magnetostrictive transducers with different numbers of GMM rods, indicating that the dual-rod structure has better internal alignment uniformity and more stable output. However, the optimization only considered the GMM rod’s design. Jianwei Tu et al. [14] used ANSYS finite element software (http://www.ansys.com) to build a finite element model of a Giant Magnetostrictive Actuator, studying the impact of parameters such as excitation coils and magnetic conductors on the magnetic induction intensity and optimizing parameters like the axial length of excitation coils and radius of the magnetic conductor. The optimization method was single-objective. Anmin Wang et al. [15] conducted a parametric scan of the actuator’s magnetic circuit structure size and coil driving efficiency to select the optimum solution, which was computationally intensive and had opposing trends for different performance indicators, necessitating an integrated optimization approach. Wenmei Huang et al. [16] utilized a genetic algorithm for a multi-objective optimization of the magnetostrictive transducer, considering the constraints between multiple objectives. Min Jiang et al. [17] adopted a multi-objective genetic algorithm, optimizing the structure of the magnetorheological damper with the objectives of maximizing the dynamic range and minimizing the number of turns of the electromagnetic coil. However, the coupled equation calculations required during iterative resolution result in longer computation times. It is evident that most of the aforementioned methods employ single-objective optimization design approaches. However, the multiple performance indicators of actuators are often in conflict with one another, meaning that there is no unique optimal solution. If a multi-objective optimization algorithm is used solely to optimize the objective function, it necessitates the solution of the coupled differential equations, which results in a longer computational time.
This study focuses on GMAs and utilizes the finite element method to obtain simulation data samples. Based on these data samples, a BP neural network model was established. Subsequently, the BP neural network prediction model was invoked within the multi-objective genetic algorithm (NSGA-II), taking the axial magnetic induction intensity, uniformity, and coil loss of the GMA as optimization objectives, to conduct a multi-objective structural optimization study. By comparing and analyzing the magnetic field characteristics and coil losses of the actuator before and after optimization, the influence of structural parameters on the performance of the actuator was revealed. A prototype was fabricated according to the optimization results, and experimental validation confirmed that the output performance of the actuator met the design requirements. Compared to traditional optimization methods that combine finite element simulation with optimization algorithms, this approach reduces computational load and enhances computational efficiency, providing a valuable reference for multi-objective optimization methods for GMAs.
2. The Basic Structure of a GMA
The actuator designed in this article is used for low-frequency active vibration reduction, operating within the frequency range of 0 to 100 Hz and the displacement range of 0 to 90 μm. The structure of the GMA is shown in Figure 1, mainly consisting of a GMM rod, coil, coil frame, magnetic conducting body, magnetic conducting ring, magnetic conducting sidewall, output rod, and disc spring, among others. The magnetic conducting ring, GMM rod, magnetic conducting body, and magnetic conducting sidewall form a closed magnetic circuit. This closed magnetic circuit can reduce magnetic leakage and improve the uniformity of the magnetic field.
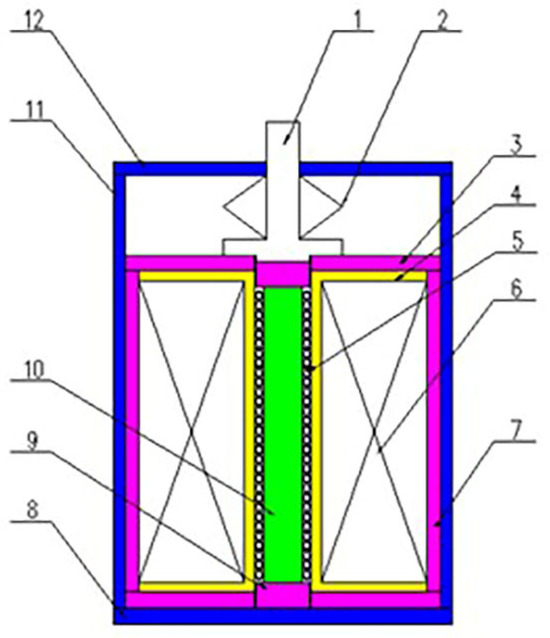
Figure 1.
GMA structure diagram: 1—output rod; 2—disc spring; 3—magnetic conducting ring; 4—coil frame; 5—cooling pipeline; 6—coil; 7—magnetic conducting sidewall; 8—base; 9—magnetic conducting body; 10—GMM rod; 11—shell; 12—upper end cap.
The GMM rod is subject to the coupled effects of electric, magnetic, mechanical, and thermal factors, with its numerical relationship represented by the magnetostrictive Equation (1).
Here, ε denotes strain; σt denotes the pre-compression stress of the material; EH denotes the Young’s modulus of the material; d33 is the piezomagnetic coefficient; T is the temperature; H stands for the magnetic field strength; B is the magnetic flux density; μ is the relative magnetic permeability; and α and β are the corresponding conversion coefficients.
From Equation (1), it can be observed that the strain ε changes with the magnetic flux density B. Therefore, optimizing the magnetic circuit structure and enhancing the magnetic flux density on the GMM rod can improve the output performance of the GMA. Additionally, temperature variations can alter the material properties and the coupling between energies, affecting the output performance of the GMA.
3. Multiphysical Field Coupled Simulation Calculation
GMMs exhibit characteristics of multiphysics field coupling, involving electrical, magnetic, mechanical, and thermal interactions. Therefore, when simulating the performance of GMAs, it is necessary to employ coupled analysis methods that integrate electromagnetic fields, temperature fields, and structural fields.
3.1. Geometric Models
This study employs COMSOL Multiphysics for finite element analysis to establish a geometric model. Owing to the symmetry of the GMA’s geometric structure, a simplified 2-D axisymmetric model, which retains only the magnetic circuit structure, is employed to improve computational efficiency [18]. The geometric model is shown in Figure 2, and the initial structural parameters of the actuator are presented in Table 1.
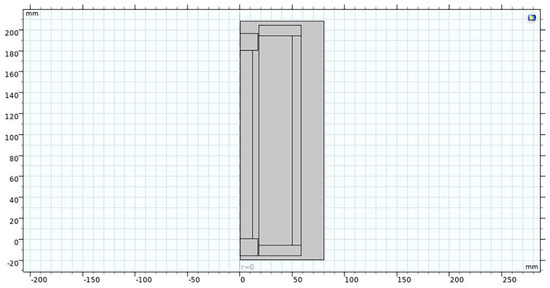
Figure 2.
Two-dimensional axisymmetric model.

Table 1.
The main structural parameters of the actuator.
3.2. Mathematical Model of Physical Field
In COMSOL Multiphysics software 6.1 version, the magnetic field module is used for electromagnetic field simulation, employing the nodal vector potential method. This typically involves the differential form of Maxwell’s equations.
Here, H denotes the magnetic field strength; J denotes the current density; A denotes the vector magnetic potential; σ denotes electrical conductivity; B denotes the magnetic flux density; E denotes the electric field strength; υ denotes the current velocity; and Je denotes the winding current density.
The GMM exhibits hysteresis characteristics, and the Jiles–Atherton model is used to describe the hysteresis relationship between the magnetic field strength and magnetization intensity. The specific relationship is expressed as follows:
Here, M is the magnetization strength; Man is the hysteresis-free magnetization strength; Mrev and Mirr are the reversible and irreversible magnetization strengths, respectively; η, Ms, a, τ, k are the domain wall interaction coefficient, saturation magnetization strength, hysteresis-free magnetization shape coefficient, reversible coefficient, and domain wall pinning coefficient, respectively; when H increases, δ = +1; and when H decreases, δ = −1.
The strain variable of GMM is calculated using a quadratic domain switching model, the expression is
Here, λs denotes the saturation magnetostriction strain and Ms denotes the saturation magnetization intensity.
Based on the isotropy of the GMM, by utilizing the law of conservation of energy and Fourier’s law, one can derive the heat conduction differential equation. The expression is as follows [19]:
Here, T denotes temperature, t stands for time, λ denotes the thermal diffusivity, Q is the heat generation per unit volume, and ρ and c, respectively, represent the density and specific heat capacity of the heat transfer body.
3.3. Electromagnetic Field–Structural Field Simulation Results
After incorporating material properties, boundary conditions, and mesh division, the calculation results in the distribution of magnetic flux density in the magnetic circuit under a 5 A DC power supply input. As shown in Figure 3 and Figure 4, due to the use of a closed magnetic circuit design, there is no magnetic leakage phenomenon in the magnetic circuit, and the maximum magnetic induction intensity in the magnetic circuit is 0.93 T. The maximum magnetic flux density on the GMM rod is 0.87 T, with the magnetic flux density at the axial ends being lower than in the middle portion. The uniformity of the axial magnetic flux density on the GMM rod, denoted as W, is 93.1%, which is calculated using Equation (6).
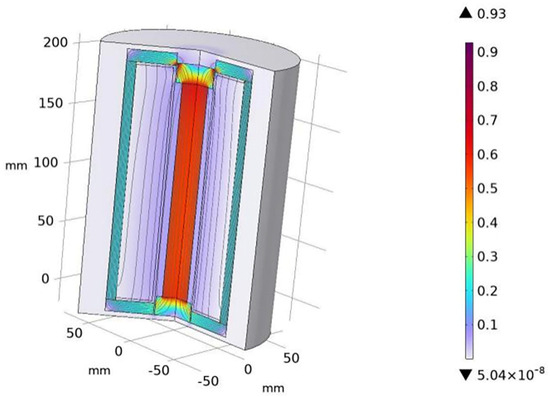
Figure 3.
Magnetic induction intensity distribution map.
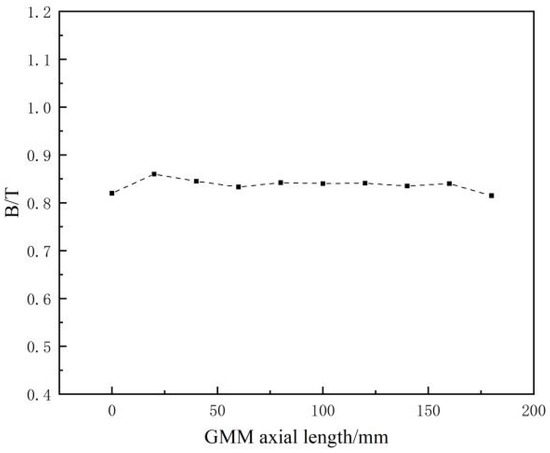
Figure 4.
GMM axial magnetic induction intensity.
The output displacement of the GMM as shown in Figure 5 indicates that the displacement at the axial top end of the GMM is less than that at the middle. This is due to the low magnetic induction intensity at the top end; hence, it is necessary to optimize the magnetic conductive components in the magnetic circuit to improve the uniformity of the GMM axial magnetic induction intensity.
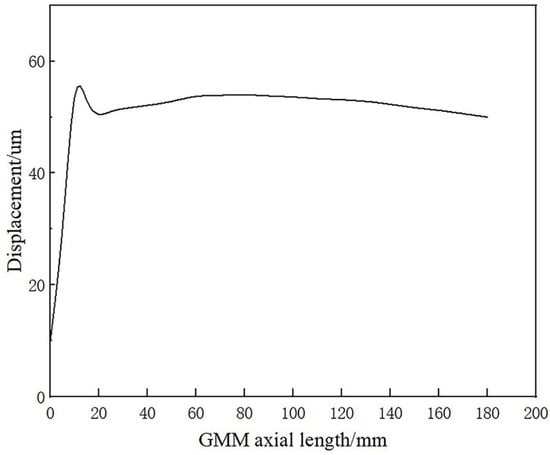
Figure 5.
GMM axial displacement.
3.4. Electromagnetic Field–Temperature Field Simulation Results
During operation, the GMA primarily generates heat due to coil loss, hysteresis loss, and eddy current loss. Given that the GMA designed in this study operates at low frequencies ranging from 0 to 100 Hz, the main source of heat is coil loss. Coil loss is due to resistive heat loss, and the calculation formula is as follows:
Here, Qw represents the coil loss density, Tw is the period, J is the volumetric current density, E stands for the electric field strength, and t denotes the time.
The simulations calculated the coil loss density at 7.79 × 10⁴ W/m3, as depicted in Figure 6. Treating the coil loss as a heat source for thermal analysis, the temperature distribution across the GMM was calculated in the absence of an active cooling system. The maximum temperature reached was 154 °C, as illustrated in Figure 7. The ideal temperature range for the operation of GMM is 0 to 80 °C. Therefore, it is necessary to carry out structural optimization design on the coil to reduce the resistance loss of the coil, thereby decreasing the amount of heat transferred to the GMM.
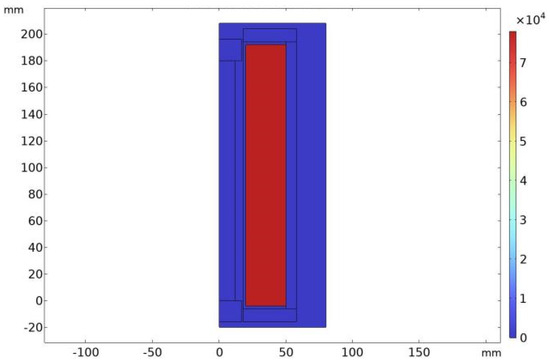
Figure 6.
Coil loss.
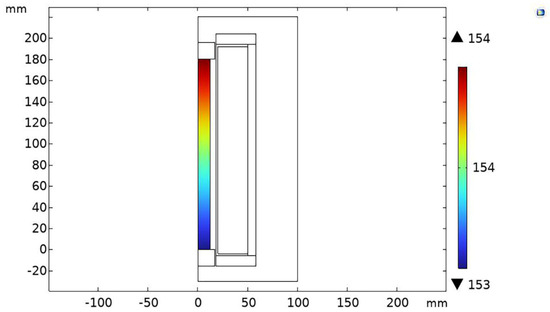
Figure 7.
GMM temperature distribution.
4. BP Neural Network Model
4.1. Input and Output Variable Selection
The BP neural network is a type of artificial neural network based on backpropagation algorithm [20]. It consists of an input layer, one or more hidden layer, and an output layer, with each neuron connected to all the neurons in the previous layer and with an adjustable weight [21]. The BP neural network operates by feeding input data through the input layer, processing it through the hidden layers, and generating results at the output layer. During the training phase, the network utilizes the backpropagation algorithm to adjust the weight of each connection to minimize the error between the predicted result and the actual result. This backpropagation process is iterated many times until the performance of the network converges. BP neural networks are widely used in pattern recognition, classification, regression and other tasks [22]. It is able to learn and capture complex relationships in input data and make predictions and decisions based on those relationships.
This study employs a BP neural network to map the nonlinear relationship between the structural parameters and performance parameters of the GMA. As shown in Figure 8, the selected structural parameters as the observations of the neural network model include the inner diameter (r1), outer diameter (r2), and thickness (h2) of the magnetic conducting ring; the thickness (h1) of the magnetic conducting sidewall; the radius (r5) and thickness (h3) of the magnetic conducting body; and the inner diameter (r3), outer diameter (r4), and length (L1) of the coil. The strength of the GMM rod magnetic induction intensity (B) and its axial uniformity (W), along with the coil’s loss (P), are three performance parameters that directly affect the output performance of the actuator. Therefore, these three parameters are selected as the targets of the neural network model.
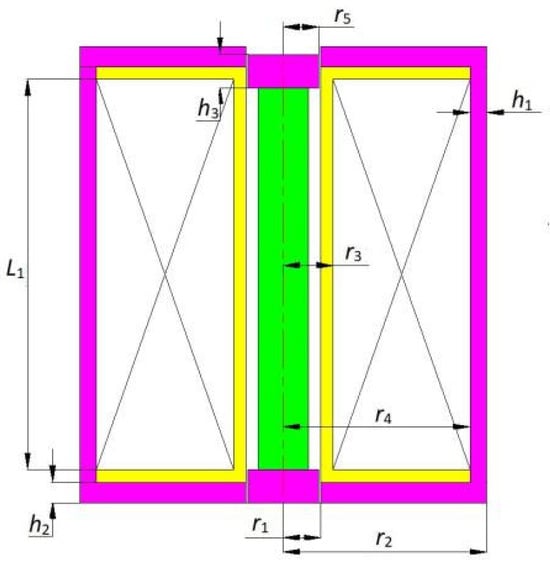
Figure 8.
GMA structure parameters.
4.2. Construction of BP Neural Network Model
Finite element model simulations were employed to obtain the sample sets. Table 2 displays the range of values for the corresponding structural parameters. Utilizing the parametric scanning function in the software, different sets of data can be obtained. In total, this study collected 100 sets of sample data.

Table 2.
Value range of actuator variable parameter.
In order to optimize the magnetic circuit structure and coil structure of the GMA, the neural network model shown in Figure 9 was constructed. Because the accuracy of single-layer hidden layer neural network training is not high enough, two hidden layers are used. The number of hidden layer neurons is usually determined using the empirical Formula (8) [23].
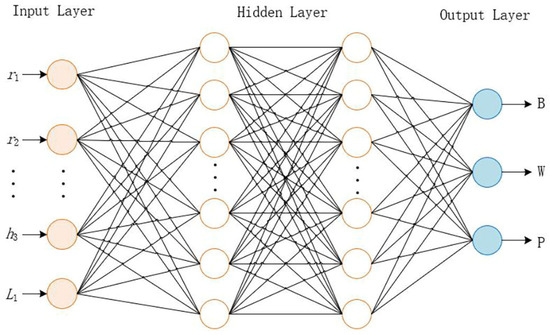
Figure 9.
BP neural network structure diagram.
Here, H represents the number of neurons in the hidden layer, I represents the number of neurons in the input layer, O represents the number of neurons in the output layer, and a is a constant between 1 and 10.
Following a comprehensive evaluation of training time and prediction accuracy based on empirical Formula (3), the neural network was finalized with a 9-10-8-3 architecture. The tansig function serves as the activation function between the input layer and the first hidden layer, as well as between the two hidden layers, while the activation function between the last hidden layer and the output layer is the purelin function. The Levenberg–Marquardt (L-M) algorithm is employed for training the backpropagation (BP) network. This algorithm is chosen for its rapid convergence and low mean square error, making it suitable for training small-to-medium-sized neural networks. Training parameters were set as follows: a learning rate of 0.0001, a maximum of 1000 iterations, and a training target minimum error of 0.001.
The root mean square error (RMSE) and determination coefficient R2 are utilized to assess the model’s accuracy. The respective computational formulas are presented in Equations (9) and (10).
Here, and are the target value and predicted value of the ith test sample, respectively, and is the average target value of the test sample. Before each training and testing session, it is necessary to normalize the data, and the output of the network requires inverse normalization processing.
The training and prediction of the BP model were implemented based on Matlab software 2023 version. A random selection of 80 data sets from the experimental samples was used as the training sets for the model, while the remaining 20 data sets were used to assess the model’s accuracy. Figure 10 shows the comparison between the predicted values of each output of the BP model and the expected values, as well as the prediction error. The BP model’s relevant evaluation indicators were calculated in Matlab, as shown in Table 3.
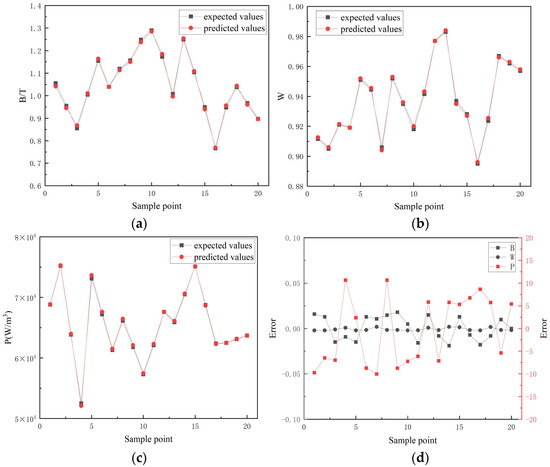
Figure 10.
(a) Comparison between the predicted value of magnetic induction intensity and the expected value. (b) Comparison between the predicted value of magnetic induction intensity uniformity and the expected value. (c) Comparison between the predicted value of coil loss density with the expected value. (d) Prediction error of BP model.

Table 3.
BP model-related evaluation index.
From Figure 10 and Table 3, it can be observed that the errors between the expected and predicted values of the GMM axial magnetic induction intensity B and uniformity W in the testing sets are small. Although the RSME value for coil loss P is 9.8735, considering the range of values for coil loss, the relative error is small. The correlation coefficient R2 for the BP model is close to 1. Based on the analysis above, it is evident that the constructed BP neural network prediction model possesses high predictive accuracy and is capable of effectively mapping the nonlinear relationship between the GMA structural parameters and performance parameters.
5. Structural Optimization Based on BP-NSGA-II Algorithm
NSGA-II is an improved multi-objective optimization algorithm based on a non-dominated sorting genetic algorithm (NSGA) [24]. The NSGA-II algorithm can search a group of approximate optimal solutions in multi-objective optimization problems and maintain the diversity of the population through non-dominant sorting, crowding distance and simple, and efficient operation [25]. The BP-NSGA-II algorithm enhances the calculation of the population individuals’ fitness by employing a BP neural network on the foundation of NSGA-II, which can effectively improve the computational efficiency of the algorithm. The flow of the BP-NSGA-II algorithm is shown in Figure 11.
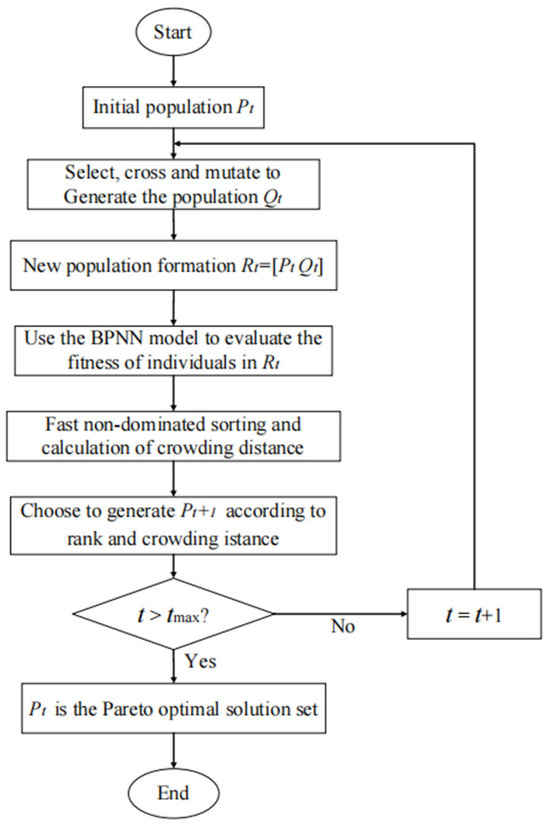
Figure 11.
Flow chart of BP-NSGA-II algorithm.
5.1. Choice of Objective Function
The magnetic conducting ring inner radius (r1), outer radius r2, thickness (h2), magnetic conducting sidewall thickness (h1), magnetic conducting body radius (r5) and height (h3), coil inner radius (r3), outer radius (r4), and length (L1) among the GMA structural parameters were selected as individual characteristics. The initialization of the population was carried out by generating 200 randomly distributed individuals within the range specified in Table 2. The objective function to be optimized includes the axial magnetic induction intensity (B) on the GMM rod, the uniformity of axial magnetic induction intensity (W), and the coil loss (P).
5.2. Optimization Results
Based on the established BP model, the objective function is evaluated, and a quick non-dominated sorting is performed based on the obtained fitness values. After 200 iterations of optimization, the Pareto front non-dominated solution set shown in Figure 12 is generated. There are 12 groups of optimal solutions in the optimized Pareto front.
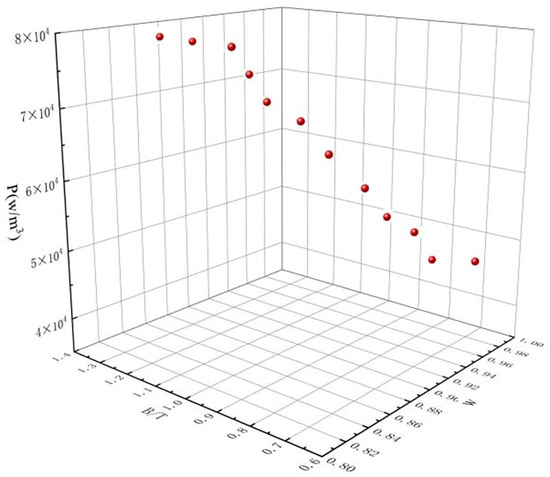
Figure 12.
Pareto front non-dominated solution set.
Pareto front solution is a non-dominant solution, which selects a relatively optimal solution set according to the mutual constraints of multiple parameters and optimization objectives. Firstly, the data standardization of Pareto optimal solution set is carried out according to the preference degree of different optimization objectives.
Since it is hoped that the greater the magnetic induction intensity and uniformity on the GMM rod, the standardization formula is as follows:
For coil loss density, the smaller the value, the better, so the standardized formula is
Then, the weight values of the three optimization objectives were calculated by entropy weight method, and a group of weights were obtained as 0.2116, 0.4047, and 0.3837, so as to obtain a group of optimization variables of GMA, as shown in Table 4.

Table 4.
Actuator variable optimization results.
6. Analysis and Verification of Optimization Results
6.1. Finite Element Simulation Verification
After optimization and using the same 5 A DC power supply input, the results of the magnetic circuit simulation for the GMA are shown in Figure 13 and Figure 14. It is evident that the magnetic induction intensity in the magnetic circuit has significantly increased, with the maximum magnetic induction intensity reaching 1.41 T. Comparing the axial magnetic induction intensity of GMM before and after optimization, the maximum axial magnetic induction intensity increased from 0.87 T to 1.12 T, and the uniformity of axial magnetic induction intensity improved from 93.1% to 96.5%.
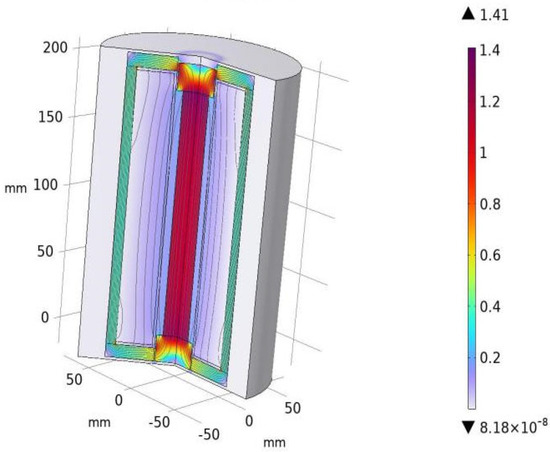
Figure 13.
Optimized magnetic induction intensity.
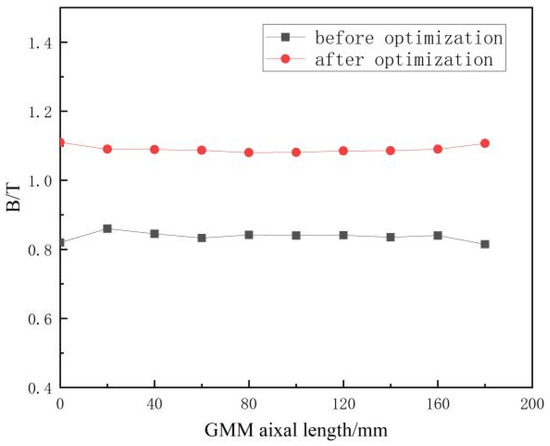
Figure 14.
Comparison of magnetic induction intensity before and after optimization.
The output displacement of the GMM, as shown in Figure 15, demonstrates a significant increase in the axial output displacement value due to the optimization of the magnetic circuit. Additionally, the output displacement at the top of the GMM is essentially consistent with the displacement in the middle.
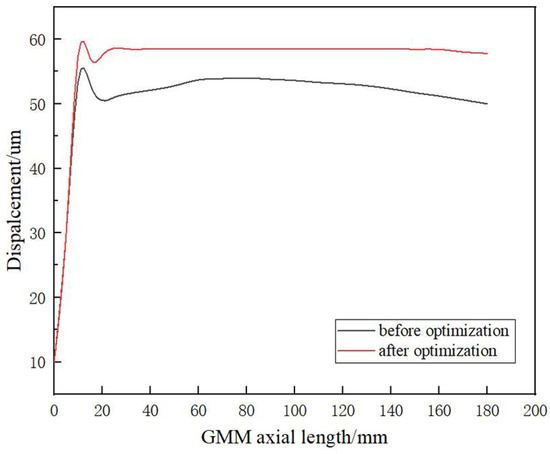
Figure 15.
The optimized GMM axial displacement.
After optimization, the loss of the coil was reduced to 4.97 × 10⁴ W/m3, and the maximum temperature on the GMM rod without the cooling system activated was lowered to 128 °C, as shown in Figure 16 and Figure 17.
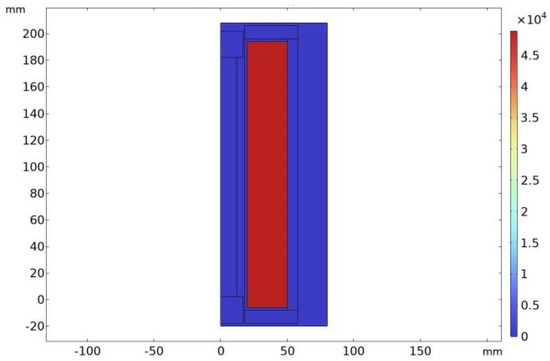
Figure 16.
Optimized drive coil loss.
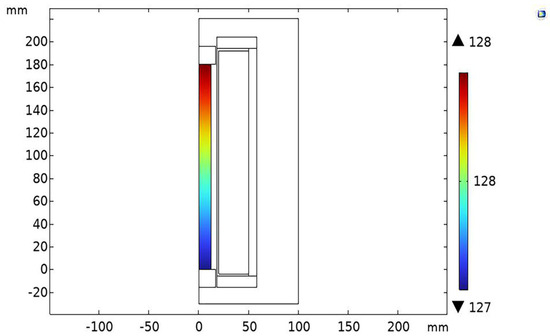
Figure 17.
Optimized GMM temperature distribution.
6.2. Optimization Model Verification
The BP-NSGA-II algorithm optimization model is compared and analyzed with the traditional NSGA-II algorithm optimization model in terms of training time and optimization results. In the NSGA-II algorithm optimization model, the objective functions for the performance parameters B, W, and P are, respectively, denoted as f1(x), f2(x), and f3(x), as shown in Equation (14).
Here, A0 represents the cross-sectional area of the GMM; A1 denotes the cross-sectional area of the magnetic conducting body; R0 is the magnetic reluctance of the GMM; Rc is the total magnetic reluctance of the magnetic conducting components; r3, r4, and L1 are the inner radius, outer radius, and height of the coil, respectively; and r0 and L are the radius and height of the GMM, respectively; α1 = r4/r3, β1 = L1/2r3.
The parameter settings and solution methods in the NSGA-II algorithm are the same as those in the BP-NSGA-II algorithm, and the simulation results of the optimal solutions obtained by the two algorithms are shown in Table 5.

Table 5.
Optimizing model performance comparison.
From Table 5, it can be observed that the training time for the BP-NSGA-II algorithm is 87 s, which is significantly less than that of the NSGA-II algorithm. The optimization results for performance parameters are also superior to those of the NSGA-II algorithm, thereby confirming the effectiveness of the BP-NSGA-II algorithm model.
6.3. Experimental Verification
Based on the optimization results, a prototype of a GMA was developed for testing. The experimental setup, as shown in Figure 18, mainly includes the GMA, YB1635 signal generator(Zheng Yuan, Shanghai, China), NI-usb6211 data acquisition card(National Instruments, Suzhou, China) and display devices, ATA309 power amplifier(Aigtek, Xi’an, China), cg—c1030 laser displacement sensor(Panasonic, Shanghai, China), PC, and MDO3014 oscilloscope(Tektronix, Shenzhen, China). Among these, the signal generator produces a sinusoidal AC signal, which is amplified by the power amplifier to drive the vibration of the giant magnetostrictive actuator. The laser displacement sensor, oscilloscope, data acquisition card, and display equipment, in conjunction with the PC, complete the tasks of data display, acquisition, processing, and subsequent analysis.
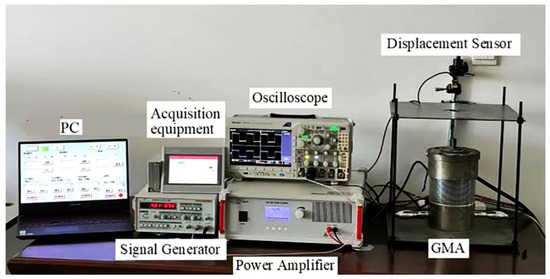
Figure 18.
Actuator performance test platform.
As shown in Figure 19, the experimental platform tested the relationship between the current and displacement at frequencies of 20 Hz, 50 Hz, and 80 Hz. It can be observed that within the 0~8 A current range, the displacement values show a linear increase, with the values growing more rapidly within the 4~8 A current range; between 8~10 A, the growth tends to level off. With the increase in frequency, the displacement value for the same current input decreases. Within the working frequency range, the actuator achieved the optimal working displacement target of 0~90 μm.
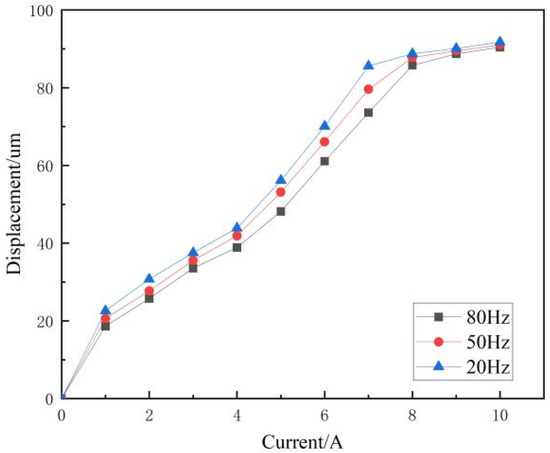
Figure 19.
Actuator displacement under different excitation currents and frequencies.
Figure 20 shows the real-time displacement output curve of the GMA with an excitation current of 8 A and an excitation current frequency of 20 Hz. It can be observed that the displacement output waveform of the actuator is essentially sinusoidal. The experiment verifies that the GMA, after multi-objective optimization, can achieve the target displacement values at the working frequency, and its output characteristics are stable.
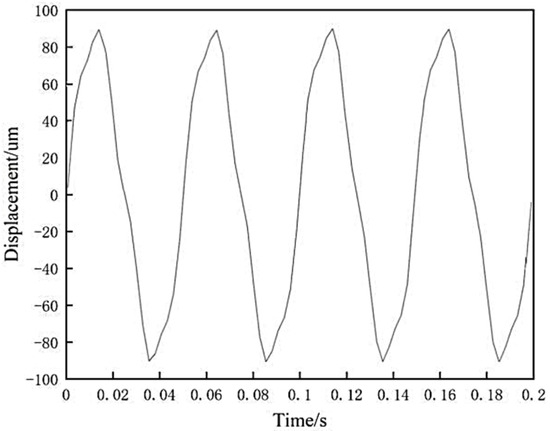
Figure 20.
Actuator displacement at 20 Hz.
7. Results
This study establishes a 2-D model of the GMA using finite element software and carries out a comprehensive structural optimization design of the actuator using a BP-NSGA-II optimization algorithm based on the BP neural network and the non-dominated sorting genetic algorithm II (NSGA-II).
- (1)
- The simulation data obtained through finite element software was used to establish a BP model that maps the relationship between the magnetic circuit structural parameters and the performance indicators of the GMA. After training and testing, the BP model exhibited a lower RMSE and a higher R2 value, demonstrating its capability to accurately predict the performance indicators of the GMA.
- (2)
- The BP-NSGA-II algorithm was applied to perform a multi-objective optimization of the BP neural network model. The results indicate that after optimization, the maximum axial magnetic induction intensity on the GMM rod increased from 0.87 T to 1.12 T; the uniformity of axial magnetic induction intensity improved from 93.1% to 96.5%; and the loss of the coil decreased from 7.79 × 10⁴ W/m3 to 4.97 × 10⁴ W/m3. By comparison, the training time for the BP-NSGA-II algorithm is 87 s, while the computation time for the NSGA-II algorithm is 169 s. Additionally, the BP-NSGA-II algorithm also outperforms the NSGA-II algorithm in terms of performance parameter optimization results, confirming the effectiveness of the BP-NSGA-II algorithm.
- (3)
- Based on the optimization results, a prototype of the GMA was fabricated. Testing confirmed that the GMA achieves a displacement range of 0 to 90 µm within the operational frequency range, with consistent output performance, thereby satisfying the design criteria. This validates the effectiveness of the proposed comprehensive optimization design approach, offering valuable guidance for the high-efficiency, multi-objective structural optimization of GMAs.
- (4)
- The properties of GMM are affected by temperature. In order to precisely control the output of GMA, further optimization on the structure of the cooling system is required.
Author Contributions
Software, T.L.; Writing—original draft, Y.L.; Writing—review & editing, Y.L.; Supervision, J.M. All authors have read and agreed to the published version of the manuscript.
Funding
This research was funded by the National Natural Science Foundation of China (NSFC) grant number (62063013).
Data Availability Statement
The data presented in this study are available on request from the corresponding author.
Conflicts of Interest
The authors declare no conflict of interest.
References
- Wang, A.; Meng, J.; Xu, R.; Zang, Y. Simulation and Experiment of High-Power Giant Magnetostrictive Actuator. Instrum. Technol. Sens. 2019, 4, 79–85. [Google Scholar]
- Söderberg, O.; Sozinov, A.; Ge, Y.; Hannula, S.-P.; Lindroos, V. Giant magnetostrictive materials. Smart Mater. Struct. 2006, 16, 1–39. [Google Scholar]
- Liu, J.; Jiang, C.; Xu, H. Giant magnetostrictive materials. Sci. China Technol. Sci. 2012, 55, 1319–1326. [Google Scholar] [CrossRef]
- Koon, N.; Williams, C.; Das, B. Giant magnetostriction materials. J. Magn. Magn. Mater. 1991, 100, 173–185. [Google Scholar] [CrossRef]
- Zhu, Y.; Liu, C.; Song, Y.; Chen, L.; Jiang, Y.; Wu, C. Research on an axial-mounted dual magnetostrictive material rods-based electro-hydrostatic actuator. J. Intell. Mater. Syst. Struct. 2022, 33, 330–341. [Google Scholar] [CrossRef]
- Zheng, J.; He, Z.; Zhou, J.; Xue, G.; Rong, C.; Bai, G. Structure design and output displacement modeling of a giant magnetostrictive actuator for a servo valve. J. Vib. Shock 2019, 38, 83–89. [Google Scholar] [CrossRef]
- Zhang, B.; Jin, K.; Kou, Y.; Zheng, X. The model of active vibration control based on giant magnetostrictive materials. Smart Mater. Struct. 2019, 28, 085028. [Google Scholar] [CrossRef]
- Li, P.; Liu, Q.; Li, W.; Zhou, X.; Wang, L.; Wang, D.; Yuan, Q. Structure of giant magnetostrictive ultrasonic transducer. J. Vib. Shock 2021, 40, 196–201. [Google Scholar] [CrossRef]
- Jia, Z.; Liu, H.; Wang, F.; Liu, W.; Ge, C. A novel magnetostrictive static force sensor based on the giant magnetostrictive material. Measurement 2011, 44, 88–95. [Google Scholar] [CrossRef]
- Yang, L.; Meng, J.; Rui, T.; Decang, L.; Gaoyang, M. Magnetic Circuit Simulation and Optimization of Giant Magnetostrictive Actuator Based on COMSOL. J. Lanzhou Jiaotong Univ. 2023, 42, 79–84. [Google Scholar] [CrossRef]
- Li, Y.; Dong, X.; Yu, X. Magnetic energy losses and temperature control system for giant magnetostrictive transducer. Sci. Rep. 2023, 14, 177. [Google Scholar] [CrossRef] [PubMed]
- Zhao, Z.; Sui, X. Temperature compensation design and experiment for a giant magnetostrictive actuator. Sci. Rep. 2021, 11, 251. [Google Scholar] [CrossRef] [PubMed]
- Li, Y.; Huang, W.; Wang, B.; Weng, L. High-frequency output characteristics of giant magnetostrictive transducer. IEEE Trans. Magn. 2019, 55, 8202305. [Google Scholar] [CrossRef]
- Tu, J.; Liu, Z.; Li, Z. Magnetic circuit optimization design and finite element analysis of giant magnetostrictive actuator. J. Chongqing Univ. 2021, 44, 52–63. [Google Scholar] [CrossRef]
- Wang, A.; Meng, J.; Xu, R. Structural optimization and dynamic performance study of a super magnetostrictive exciter. Vib. Shock 2019, 38, 184–190. [Google Scholar] [CrossRef]
- Huang, W.; Guo, W.; Guo, P.; Xia, Z. Optimization design of high frequency magnetostrictive transducer based on the multi-objective genetic algorithm. Chin. J. Sci. Instrum. 2022, 43, 111–119. [Google Scholar] [CrossRef]
- Jiang, M.; Rui, X.; Yang, F.; Zhu, W.; Zhang, Y. Multi-objective optimization design for a magnetorheological damper. J. Intell. Mater. Syst. Struct. 2022, 33, 33–45. [Google Scholar] [CrossRef]
- Liu, Q.; He, X. Magnetic circuit optimization design and thermal analysis of the giant magnetostrictive transducer. Ultrasonics 2023, 133, 107031. [Google Scholar] [CrossRef] [PubMed]
- Tan, C.; Li, B.; Liu, Y.; Ge, W.; Sun, B. Multiphysics methodology for thermal modelling and quantitative analysis of electromagnetic linear actuator. Smart Mater. Struct. 2019, 28, 087001. [Google Scholar] [CrossRef]
- Song, S.; Xiong, X.; Wu, X.; Xue, Z. Modeling the SOFC by BP neural network algorithm. Int. J. Hydrogen Energy 2021, 46, 20065–20077. [Google Scholar] [CrossRef]
- Cui, Y.; Liu, H.; Wang, Q.; Zheng, Z.; Wang, H.; Yue, Z.; Ming, Z.; Wen, M.; Feng, L.; Yao, M. Investigation on the ignition delay prediction model of multi-component surrogates based on back propagation (BP) neural network. Combust. Flame 2022, 237, 111852. [Google Scholar] [CrossRef]
- Abdolrasol, M.G.; Hussain, S.M.S.; Ustun, T.S.; Sarker, M.R.; Hannan, M.A.; Mohamed, R.; Ali, J.A.; Mekhilef, S.; Milad, A. Artificial neural networks based optimization techniques: A review. Electronics 2021, 10, 2689. [Google Scholar] [CrossRef]
- Gong, J.; Liu, F.; Wu, Y.; Zhang, Y.; Lei, S.; Zhu, Z. Design of Raman Fiber Amplifier Based on Neural Network and Artificial Bee Colony Algorithm. Acta Opt. Sin. 2021, 41, 24–32. [Google Scholar] [CrossRef]
- Tong, J.; Li, Y.; Liu, J.; Cheng, R.; Guan, J.; Wang, S.; Liu, S.; Hu, S.; Guo, T. Experiment analysis and computational optimization of the Atkinson cycle gasoline engine through NSGA II algorithm using machine learning. Energy Convers. Manag. 2021, 238, 113871. [Google Scholar] [CrossRef]
- Zhang, Z.; Liao, C.; Chai, H.; Ni, X.; Pei, K.; Sun, M.; Wu, H.; Jiang, S. Multi-objective optimization of controllable configurations for bistable laminates using NSGA-II. Compos. Struct. 2021, 266, 113764. [Google Scholar] [CrossRef]
Disclaimer/Publisher’s Note: The statements, opinions and data contained in all publications are solely those of the individual author(s) and contributor(s) and not of MDPI and/or the editor(s). MDPI and/or the editor(s) disclaim responsibility for any injury to people or property resulting from any ideas, methods, instructions or products referred to in the content. |
© 2024 by the authors. Licensee MDPI, Basel, Switzerland. This article is an open access article distributed under the terms and conditions of the Creative Commons Attribution (CC BY) license (https://creativecommons.org/licenses/by/4.0/).