Abstract
Carbon fiber-reinforced polymers (CFRPs) are extensively employed in the aerospace industry due to their excellent properties. Delamination damage occurring at critical locations in CFRPs can seriously reduce the safety of in-service components. The detection and localization of delamination damage using Lamb waves hold significant potential for widespread application in non-destructive testing. However, the choice of damage localization algorithm may produce different delamination damage localization results. This research presented an IRAPID (improved reconstruction algorithm for probabilistic inspection of defects) method derived from the RAPID (reconstruction algorithm for probabilistic inspection of defects) method, aiming to improve the accuracy and reliability of delamination damage localization. Three CFRP curved plates, including a healthy curved plate and two curved plates with delamination damage sizes of Φ20 mm and Φ40 mm, were prepared in the experiment. The detection experiment of the CFRP curved plate using lead zirconate titanate (PZT) as a transducer to excite and receive Lamb waves was conducted, and the influence of excitation signal frequency on the performance of the proposed method was discussed. Under the condition of an excitation signal frequency of 220~320 kHz and a step size of 10 kHz, the accuracy of the delamination damage localization method proposed in this paper was compared with that of existing methods. The experimental results indicate that the IRAPID algorithm exhibits good stability in the localization of delamination damage across the range of frequency variations considered. The localization error of the IRAPID algorithm for delamination damage is significantly lower than that of the DaS (delay-and-sum) algorithm and the RAPID algorithm. As the size of the delamination damage increases, so does the localization error. The accuracy of delamination damage localization is lower in the X-axis direction than in the Y-axis direction. By averaging the localization results across various frequencies, we can mitigate the potential localization errors associated with single-frequency detection to a certain extent. For the localization of delamination damage, Lamb waves at multiple frequencies can be employed for detection, and the detection results at each frequency are averaged to enhance the reliability of localization.
1. Introduction
CFRP exhibits a range of significant advantages, such as high specific strength, high specific stiffness, excellent design flexibility, outstanding damping performance, and prolonged fatigue life [1,2]. As a result, they are extensively employed in sectors like aerospace, military equipment, marine, and automotive industries [3,4,5,6]. In the manufacturing process of aerospace equipment, more than 50% of the components are made of CFRP. For instance, in the overall structure of the Boeing 787 Dreamliner, the proportion of CFRP used is as high as 57%, thereby achieving fuel savings of 15–20% [7]. A proportion of 53% of the total volume of the Airbus 350 WXB aircraft is made of CFRP, which reduces the aircraft’s weight; therefore, fuel consumption has been cut by nearly 25% [8]. For aero-engines, such as GE’s Aviation GEnx unit, the fan cases and blades in the cooler sections at the front end of the compressor are made of CFRP, which not only reduces the weight of the fuselage by 180 kg but also reduces emissions by 15% and operating costs by 20% [9]. At the same time, CFRP also plays a vital role in component manufacturing for military equipment such as helmets, body armor, combat shields, and armored vehicles [10,11].
CFRP exhibits orthotropic properties, which make its failure modes potentially more complex and hidden compared to those of isotropic materials [12,13,14,15], such as matrix cracking, fiber breakage, and delamination [16], during production and service. Delamination is the most common and harmful failure mode [17,18]. The internal cause of delamination is the low transverse tensile strength and interlaminar shear strength of CFRP laminates [19], while the external cause is damage such as drilling [20,21,22] and impact [23]. In addition, fatigue further causes delamination expansion [24,25]. The occurrence and expansion of delamination significantly reduce the structure’s stiffness, strength, and load-carrying capacity, resulting in a substantial reduction in the buckling load and compressive strength of CFRP laminates, which may ultimately cause catastrophic failure in CFRP structures [26]. However, delamination usually occurs inside CFRP structures and is hidden, which makes it challenging to detect delamination damage. Developing effective delamination detection techniques for CFRP structures is crucial for ensuring the safe and reliable realization of CFRP in various practical applications. Furthermore, CFRP is fabricated into various structural types to meet diverse engineering application needs, such as tubes [27], rods [28], beams [29], winglets [30], and curved structures [31]. As a relatively simple CFRP structure, curved components are widely used in aircraft, spacecraft, and ships [32,33]. Due to the characteristics of the CFRP curved structure, it is easy for stress concentration to occur at the curved areas, resulting in the emergence of delamination damage, which seriously affects the structure’s safety.
As an active method for structural damage detection and health monitoring, Lamb waves possess advantages such as long propagation distance, low cost, and high sensitivity to delamination damage. It has emerged as one of the primary methods in the engineering detection field [34] and is extensively applied in CFRP material structural damage detection [35]. Scattering and reflection phenomena will occur when Lamb waves encounter delamination damage in CFRP [36,37]. Simultaneously, Lamb waves will be divided into two parts, which will propagate independently in the upper and lower sub-layers of the delamination area, and undergo modal transformation at the edge of the delamination [38,39]. Based on this property of Lamb waves, delamination damage detection can be achieved. However, due to the dispersion characteristics of Lamb waves, their propagation process in CFRP becomes extremely complex. Each mode of Lamb waves propagates at varying velocities across different frequencies, which leads to deformation and amplitude reduction during the propagation of Lamb waves in CFRP. In addition, the propagation mechanism of Lamb waves is also affected by the environment [40]. For example, the group velocity and amplitude of the Lamb wave will change with the change in ambient temperature [41], which affects the sensitivity and effectiveness of the Lamb wave to damage [42], bringing potential challenges to the application of Lamb waves in engineering detection. Therefore, it is necessary to conduct research on the damage detection of CFRP structures based on Lamb waves.
So far, various methods have been developed to locate damage in CFRP [43,44]. As two well-known methods, the DaS [45,46,47] and RAPID [48,49,50] algorithms are widely used in damage identification and localization. The DaS algorithm was first proposed by Wang et al. [51] and has been continuously developed. The DaS algorithm is a method that uses the PZT network to obtain the Lamb wave signal and combines the ellipse method with the Lamb wave time of flight (ToF) to locate the damage location. Lu et al. [52] proposed a multi-DaS imaging algorithm based on sparse PZT for damage detection; the algorithm sends one excitation pulse each time, and the excitation pulse was time-compensated. The reflection coefficient was applied to eliminate the artifacts caused by the boundary reflection signal, and effective and accurate detection results were obtained. Nokhbatolfoghahai et al. [53] combined the hybrid DaS algorithm with the sparse reconstruction method for CFRP damage localization. The group velocity in different propagation directions was obtained experimentally via PZTs, and the hybrid DaS with the sparse reconstruction method was modified according to the direction-dependent group velocities. The performance of the improved hybrid method in detecting and locating damage is better than that of the DaS and sparse reconstruction methods used separately. Yu et al. [54] improved the traditional DaS algorithm, and a weighted DaS algorithm based on denoising autoencoder learning was proposed for the damage detection of anisotropic CFRP. The proposed algorithm was proven to suppress noise and has satisfactory robustness. To improve the accuracy of CFRP damage localization, Yue et al. [55] proposed a Lamb wave imaging method based on particle swarm optimization, and the damage imaging problem was transformed into a damage sources search problem. The fitness function for the damage imaging was designed according to the principle of the DaS algorithm. The experimental results show that the imaging method has stronger robustness and faster convergence speed. Although the DaS algorithm is simple and easy to operate, the performance of the DaS algorithm may be unstable due to the need for Lamb wave group velocity as a priori information.
Gao [56] and Hay [57] proposed the PAPID algorithm for damage identification and localization, and researchers inherited and developed the RAPID algorithm in subsequent research. Xiang Zhao et al. [58] compared and analyzed the effects of several tomography techniques on damage imaging, including the filtered back-projection algorithm, algebraic reconstruction algorithm, and RAPID. This research indicates that the RAPID algorithm can obtain better damage reconstruction quality faster. Liping Huang et al. have carried out various research on the PAPID algorithm. They [59] utilized the time reversibility of Lamb waves to propose an improved time reversal method and apply it to the RAPID algorithm for accurately locating impact damage in CFRP plates. At the same time, they [60] proposed a baseline-free damage detection method for multi-path reflected Lamb waves based on the mirror effect. The reflection of Lamb waves at the free boundary was regarded as a virtual transducer located at the mirror position of the actual transducer. The RAPID algorithm was improved according to the path composed of virtual and real transducers, and the method’s effectiveness was proved by experiments. Songlai Wang [61] compared the influence of different patterns of PZT sensors, such as circular, square, and parallel arrays, on the damage localization accuracy of the RAPID algorithm. Haode Huo [62] integrated the RAPID algorithm into the Bayesian framework. This method combines multiple damage-sensitive features, and numerical and experimental studies have been conducted to verify the effectiveness of the proposed method for locating composite plate damage using Lamb waves. The proposed method produces more accurate and reliable results. Jiahui Guo et al. [63] integrated RAPID algorithms and statistical methods to reduce the impact of composite anisotropy on the accuracy of damage detection. The matching pursuit decomposition algorithm was used to extract the accurate Lamb wave ToF for damage detection. The proposed algorithm can locate and quantify the damage of composite plates. Based on the PAPID algorithm and the multistage method, De Luca et al. [64] devised a PAPID multistage damage automatic identification and localization framework, which solved the limitations of the single method and provided an accurate indication of the damage location and the relevant probability location within 15 s. For the damage localization of the CFRP plate, Teng et al. [65] utilized the Hilbert–Huang transform to summarize the rule of instantaneous energy change and the distance from the damage to the sensor path. Taking the instantaneous energy characteristic as the damage index, a new probabilistic imaging method with high localization accuracy and stability was proposed.
However, there are few cases in which the above methods are used to locate the damage of CFRP curved plates. Based on the RAPID algorithm, this study proposes an IRAPID algorithm, which overcomes the deviation and fluctuation in the DaS and RAPID algorithms for the delamination damage localization of CFRP curved plates. The Lamb wave detection experiment was carried out on CFRP curved plates with Φ20 mm and Φ40 mm delamination damage using PZT as the transducer. The influence of the excitation signal frequency on the proposed method’s performance was discussed. Under the conditions of an excitation signal frequency of 220 ~ 320 kHz and a step size of 10 kHz, the accuracy of the delamination damage localization method proposed in this paper was compared with that of existing DaS and RAPID methods. The research results indicate that the method for delamination damage localization proposed in this paper exhibits good stability and accuracy. The rest of this paper is organized as follows. In Section 2, the basic theories of the DAS and RAPID algorithms are briefly reviewed, and the principle of the IRAPID algorithm proposed in this paper is described. Subsequently, the specimens and experimental procedure are introduced in Section 3. Section 4 gives the experimental results and discussion. Finally, the conclusions are drawn in Section 5.
2. Lamb Wave Localization Imaging Algorithm
The Lamb wave localization imaging algorithm is based on the principle that when the Lamb wave propagates in the waveguide structure and encounters damage, the damage can be regarded as a secondary wave source. The scattering of the Lamb wave occurs at the secondary wave source, and the scattered Lamb wave will continue to propagate in the waveguide structure, thus being caught by the receiving sensor. Lamb wave localization imaging can be performed based on the difference between the non-damage baseline signal and the signal with damage information.
2.1. DaS Algorithm
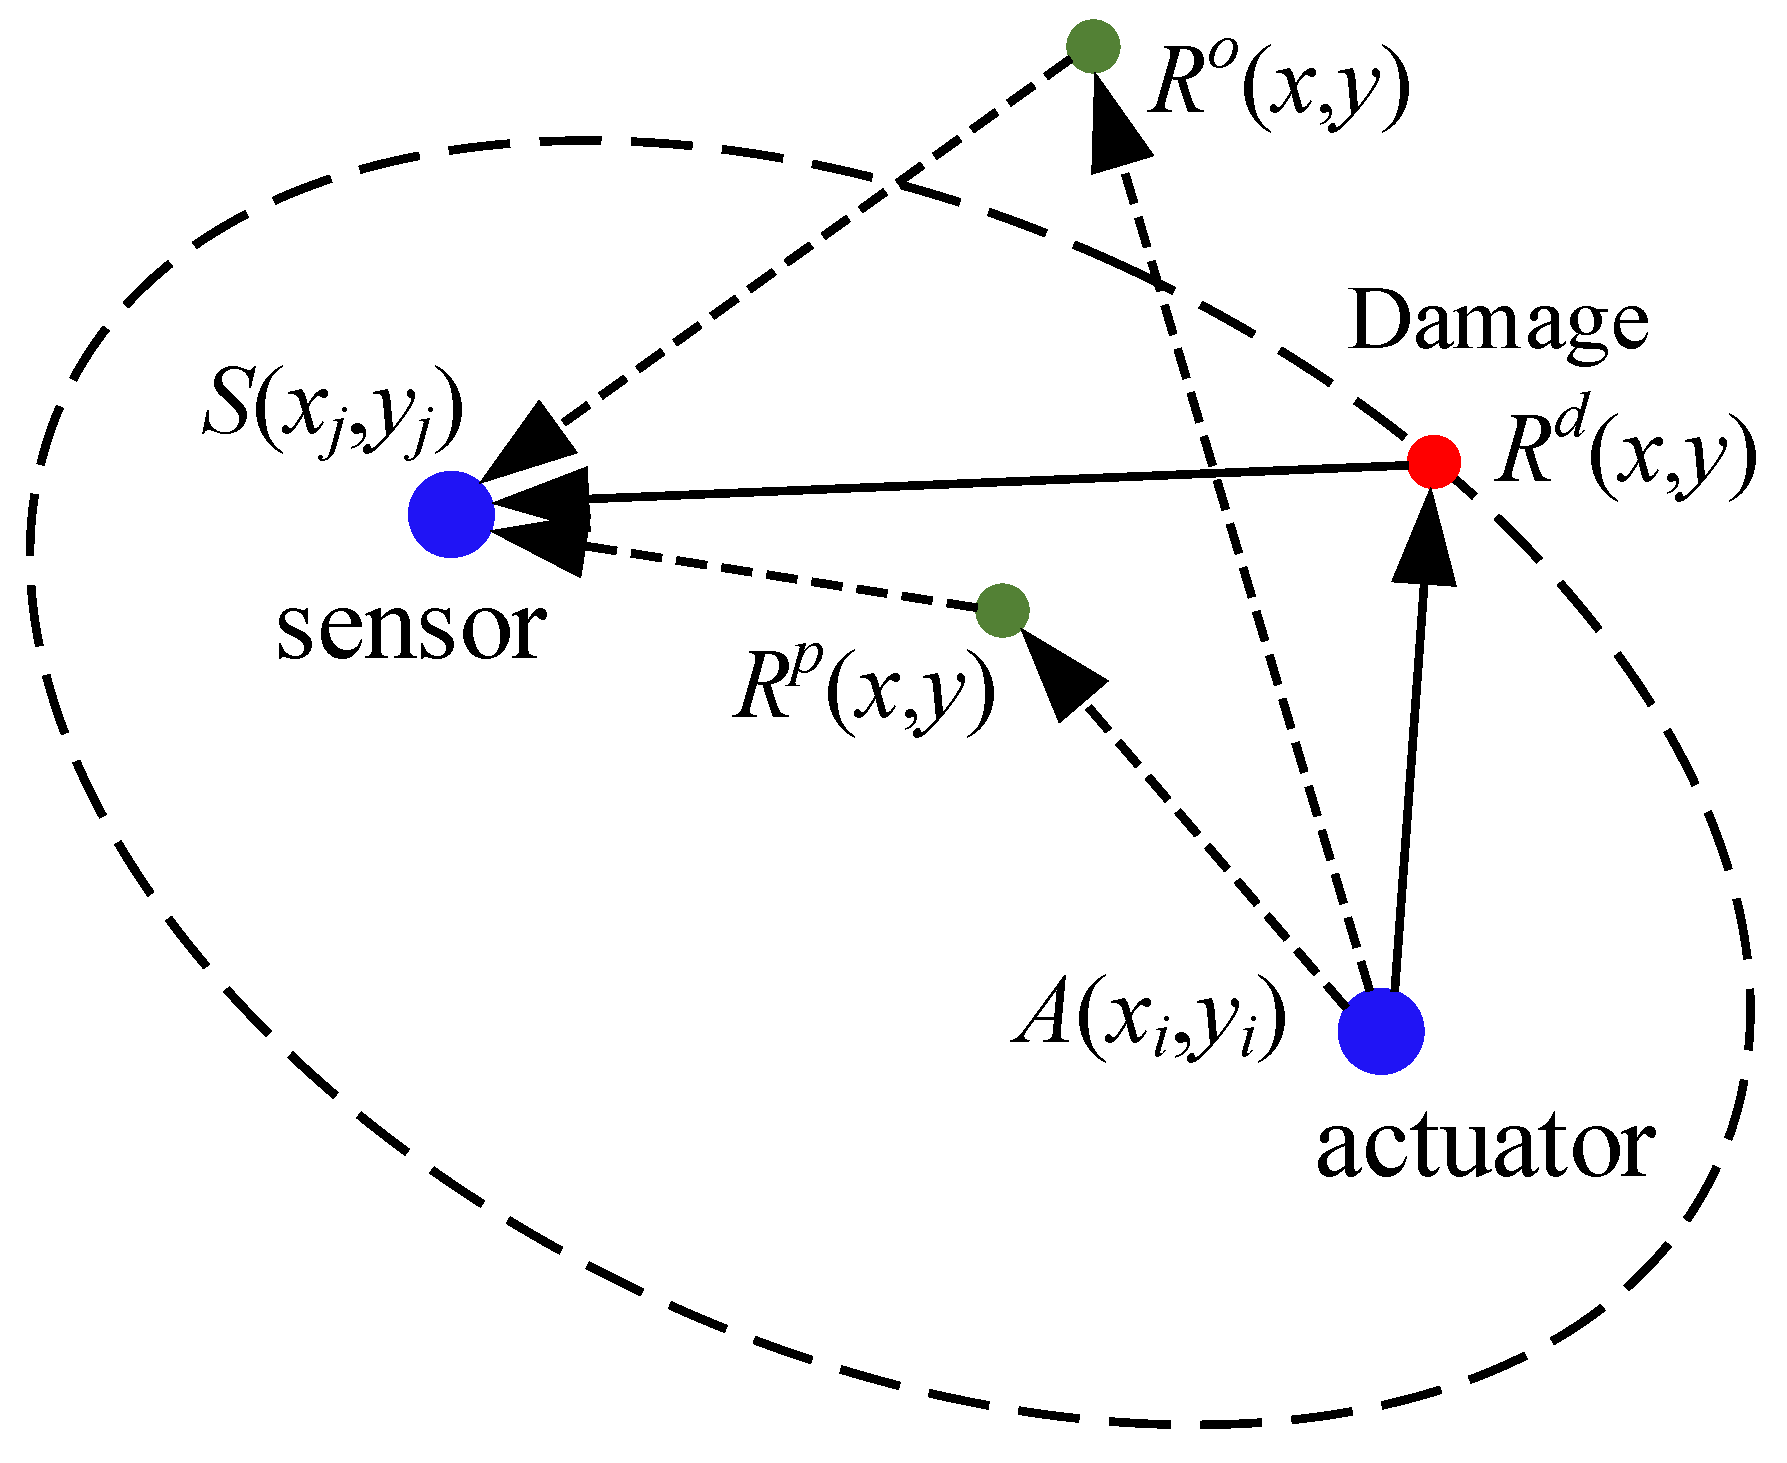
In the DaS algorithm [51], the detection area is discretized into regular grid nodes, and the grid nodes are assumed to be potential damage location points. The scattered wave’s ToF of the actuator–damage–sensor propagation path is calculated, and the values of all scattered wave signals on the corresponding ToF are fused to obtain the damage probability value of the grid nodes in the detection area. Through a priori information such as wave velocity and position of the transducer, the calculation of the ToF of scattered wave signals at each grid node under a certain path is expressed as [55]
where (x, y) are the position coordinates of the grid nodes in the detection area. The variable is the ToF of the scattered wave signal with the grid node coordinates (x, y) on the path from the i th actuator to the j th sensor. V is the group velocity of the Lamb wave. As shown in Figure 1, is the fixed position coordinate of the i th actuator, and is the fixed position coordinate of the j th sensor. When is a constant value, the trajectory formed by the coordinates (x, y) satisfying Equation (1) is an ellipse, and the position coordinates of the actuator and the sensor are the two focuses of the ellipse. The coordinates (x, y) traverse the entire detection area with a certain step size, and the of each grid node under a certain path can be obtained.
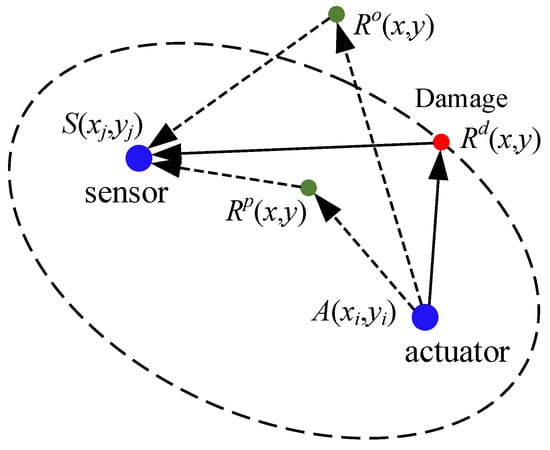
Figure 1.
Imaging trajectory.
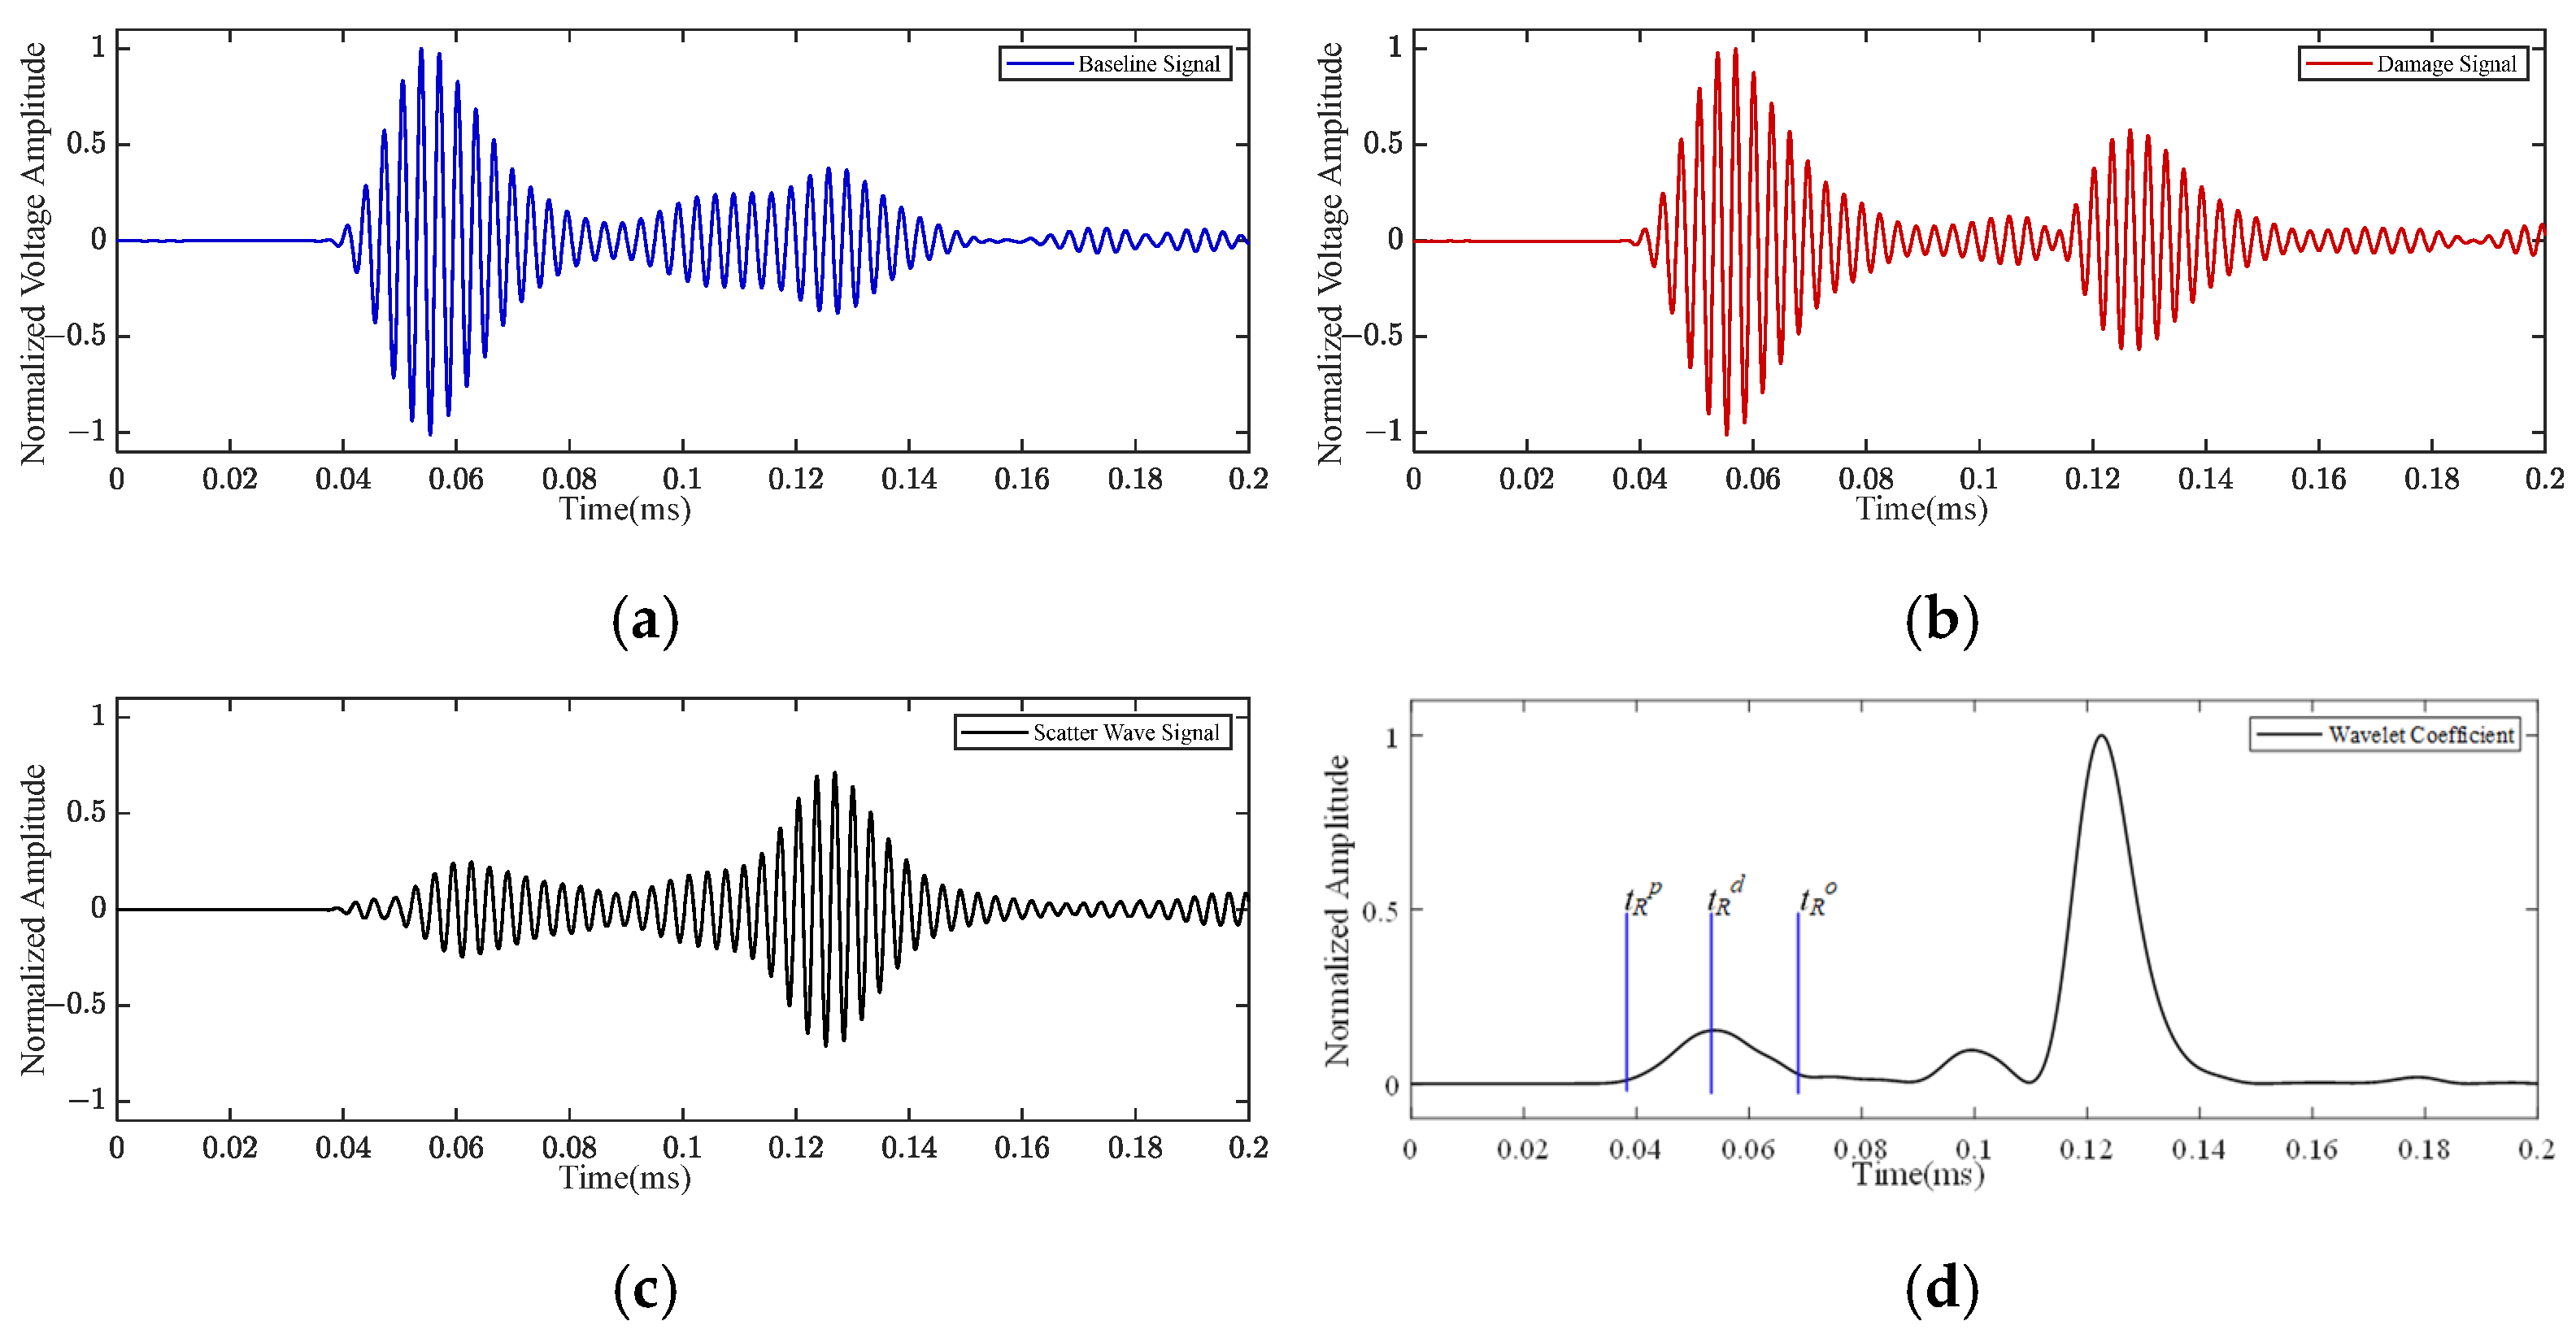
The Lamb wave detection experiments were carried out on both non-damaged and damaged specimens, and the resulting non-damaged and damaged signals are shown in Figure 2a and Figure 2b, respectively. The scattered wave signal obtained by subtracting the baseline signal from the damage signal is expressed as
where and are normalized signals.
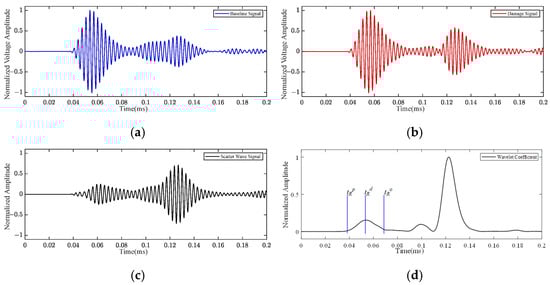
Figure 2.
Lamb wave signal: (a) baseline signal; (b) damage signal; (c) scattered wave signal; (d) CWTC.
The scattered wave signal is shown in Figure 2c. The scattered wave signal is processed using the continuous wavelet transform (CWT), the wavelet type is ‘amor’, and the resulting CWT coefficient (CWTC) is shown in Figure 2d. The CWTC value of the scattered wave signal at time is assigned to the corresponding grid node with coordinates (x, y). As shown in Figure 1 and Figure 2d, when the selected detection area grid node is located on the damage path, the calculated ToF is , and the reaches its maximum value at the moment . However, when the selected detection area grid nodes and are not located on the damage path, the calculated ToF is and , respectively. At the moments of and , the values obtained are comparatively small. Based on this, the distribution of in the detection area can be obtained. Fusing the distributions of multiple actuator–sensor pairs, the damage probability distribution of the detection area is obtained as [55]
where N is the total number of actuator–sensor pairs.
2.2. RAPID Algorithm
The RAPID algorithm [57], similar to the DaS algorithm, also discretizes the detection area into regular grid nodes. However, unlike the DaS algorithm, the RAPID algorithm does not require prior knowledge of the wave velocities and scattered waves’ ToF. It reconstructs the probability distribution of the damaged image through the correlation between the damage signal and the baseline signal. The damage that exists in the actuator–sensor path will affect the propagation characteristics of the Lamb waves, and the degree of Lamb waves affected by damage will gradually decrease as the distance of the actuator–damage–sensor propagation path increases. The correlation between the damage signal and the baseline signal is the signal correlation coefficient (SCC), which is expressed as [62]
where and are the damage signal and baseline signal, respectively. and are the mean values of the damage signal and baseline signal, respectively. M is the length of the signal sequence. If there is no damage on the actuator–sensor propagation path, the two signals are identical, resulting in an SCC value of 1.0. If the phases of the two signals are opposite, the SCC is close to 0.
In the RAPID algorithm, the signal difference coefficient (SDC) is defined as [62]
where the subscript ij represents the path formed by combining the i th actuator and the j th sensor. The SDC values of all actuator–sensor paths obtained are spatially distributed in an elliptical pattern to generate an SDC value image. The two focuses of the ellipse are located at the coordinates of the corresponding positions of the actuator and the sensor, as shown in Figure 3. The elliptic distribution function is defined as [62]
where parameter is a shape factor that controls the size of the elliptical distribution, and the value of is greater than 1.0. The value of in this paper is fixed at 1.3 [48]. is the ratio of the sum of the distance from the point to the i th actuator and the j th sensor to the distance between the i th actuator and the j th sensor, which is defined as [62]
where (x, y) are the coordinates of any position in the detection area. is the position coordinate of the i th actuator, and is the position coordinate of the j th sensor.
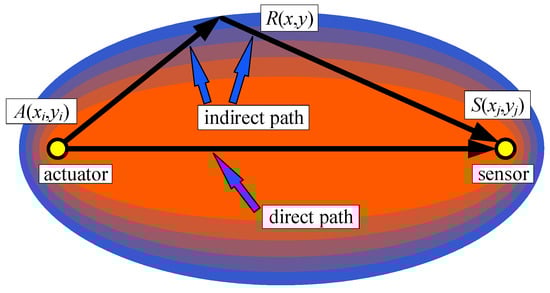
Figure 3.
The ellipse distribution diagram of the RAPID algorithm.
The product of the SDC value of each actuator–sensor pair and the value is linearly superimposed to obtain a normalized damage probability distribution , which is defined as [62]
where N is the total number of actuator–sensor pairs.
2.3. IRAPID Algorithm
Considering that the SCC is not necessarily linearly related to the distance of the actuator–damage–sensor propagation path, this paper proposes an IRAPID algorithm. The SDC is substituted with the signal ratio coefficient (SRC) to consider the possible non-linearities between the SCC and the distance of the actuator–damage–sensor propagation path, and SRC is defined as
where subscript ij represents the path formed by combining the i th actuator and the j th sensor.
The corresponding damage probability distribution is defined as
where N is the total number of actuator–sensor pairs.
3. Experiment
3.1. Preparation of CFRP Curved Plate
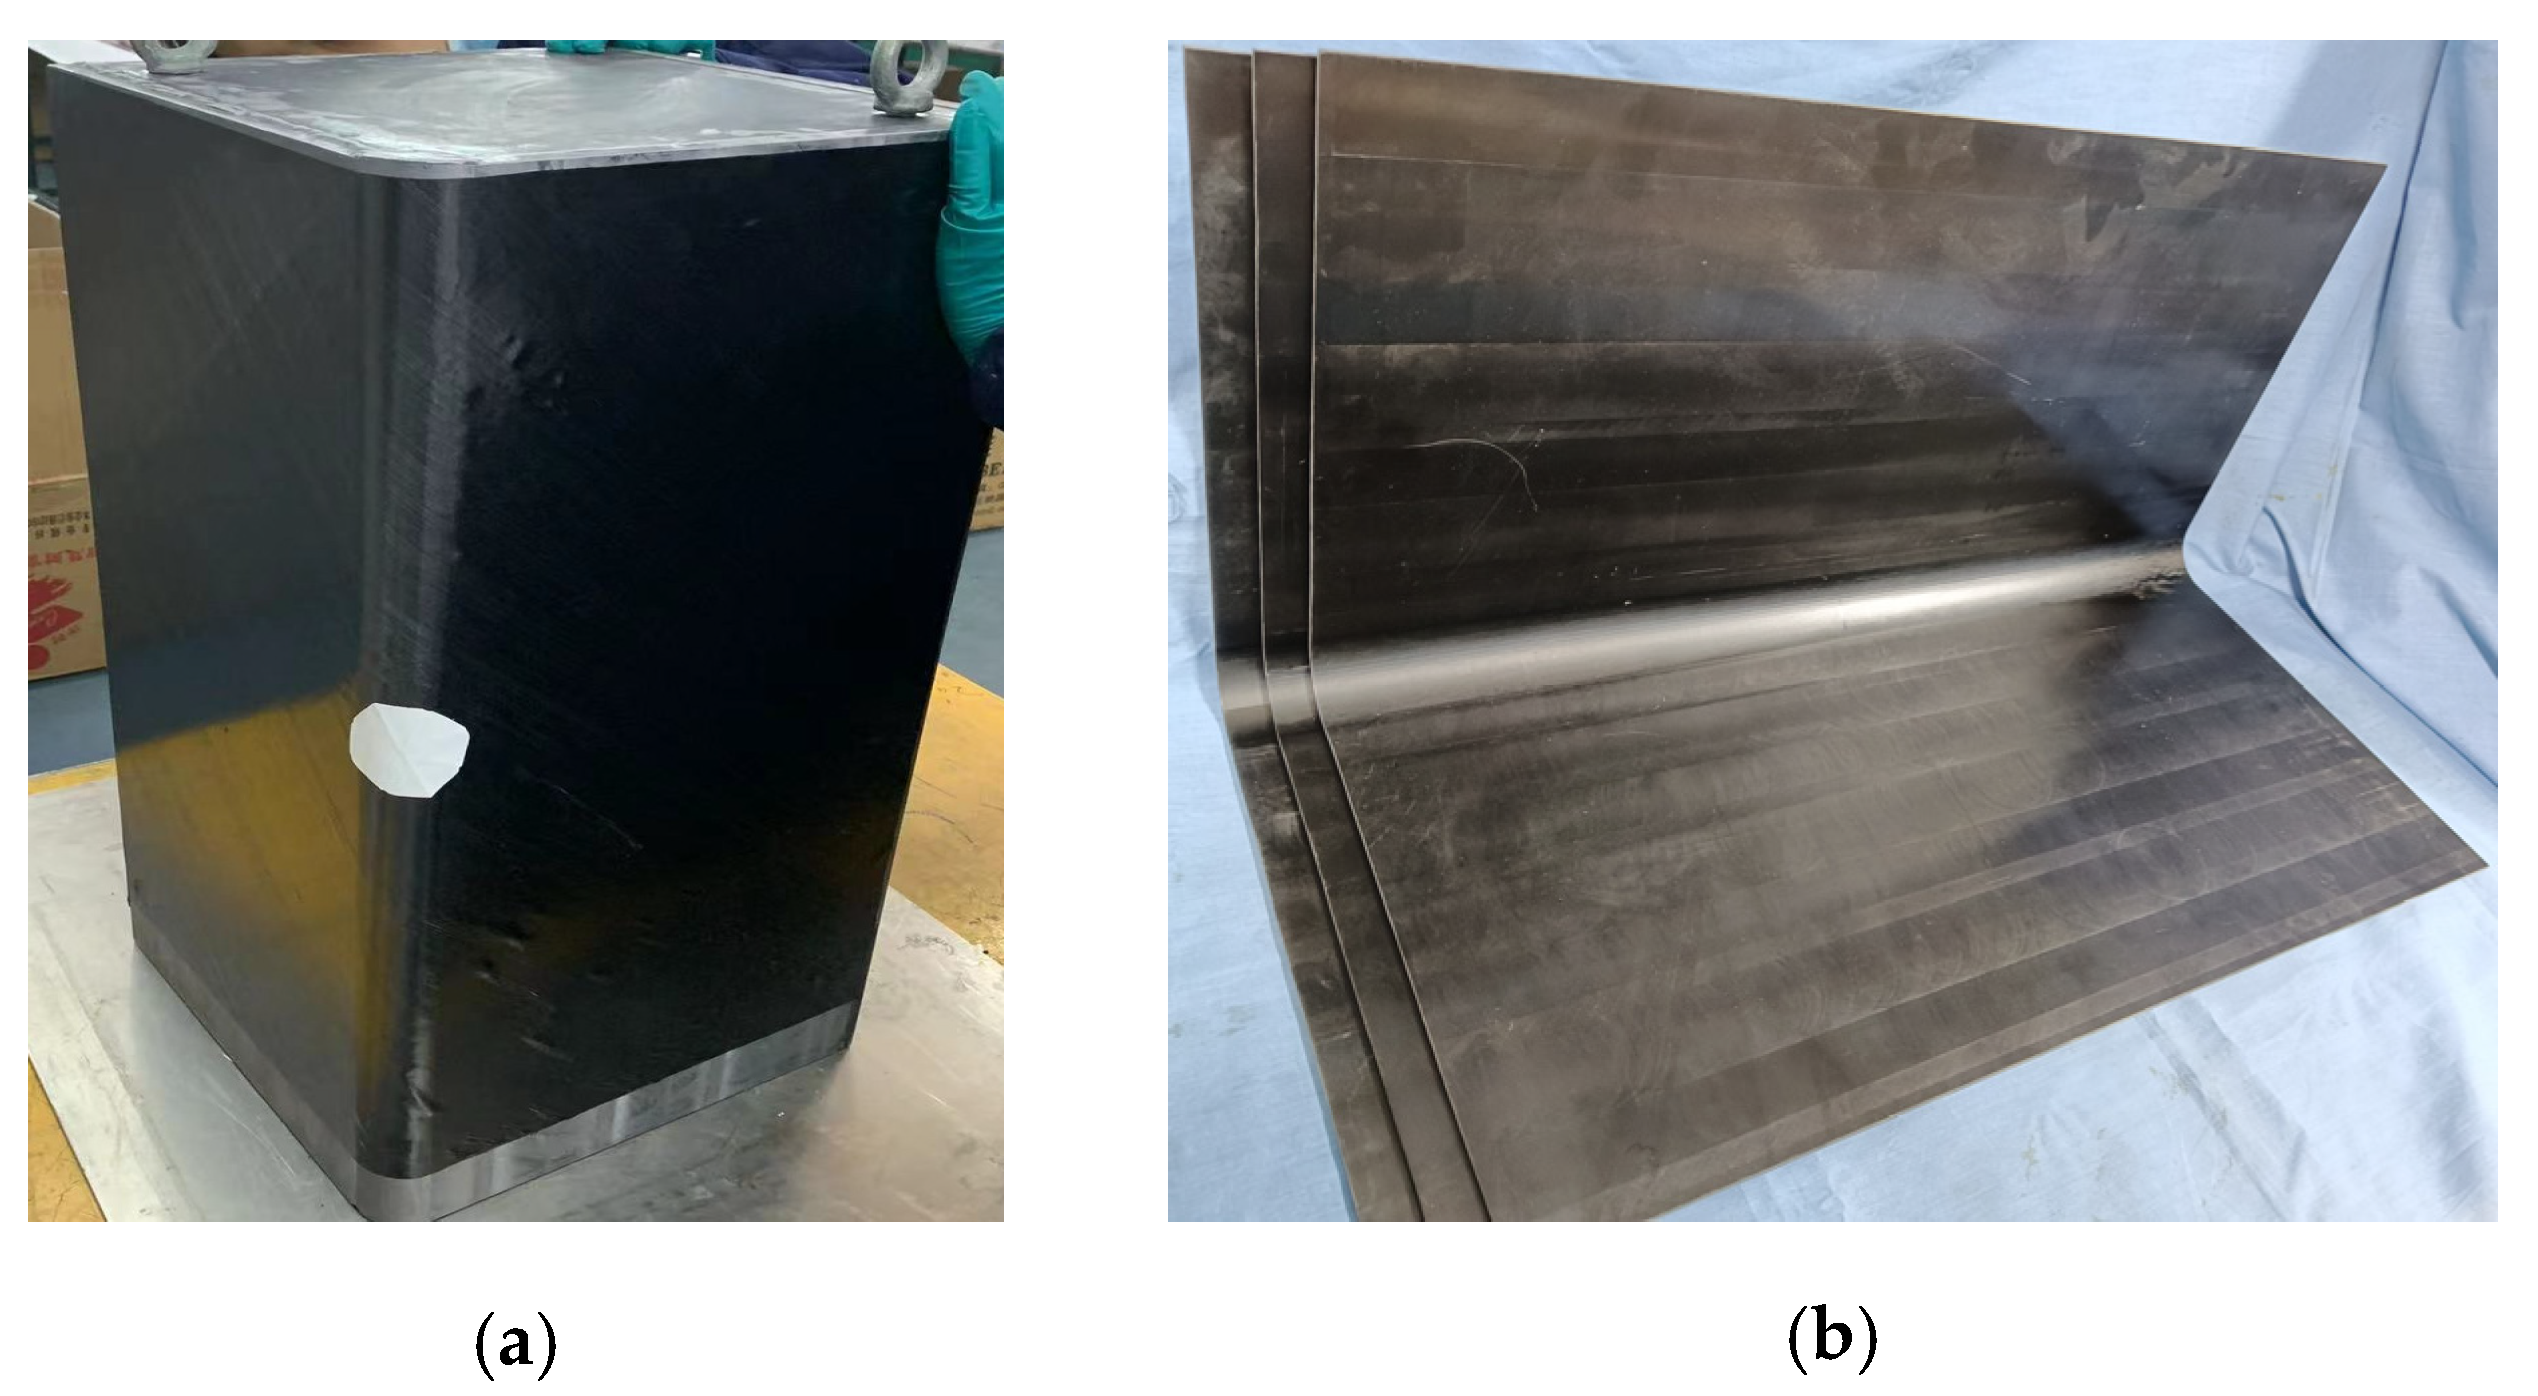
The mold for preparing the CFRP curved plates and the CFRP curved plate specimen are shown in Figure 4. The material used in the mold is aluminum. The CFRP curved plate uses resin as the matrix and T300-12K-200g-42% unidirectional carbon fiber as the reinforcing material. The preparation environment is −10 atmospheric pressures. The layup sequence for the CFRP curved plate is [0°/90°/45°/–45°/90°/0°]s. The theoretical mechanical properties of CFRP are shown in Table 1. The geometric dimensions of the CFRP curved plate and the configuration of the PZT are shown in Figure 5. The coordinate position of PZT numbered P4 is set as the coordinate origin, the coordinate of PZT numbered P1 is (0 mm, 200 mm), the coordinate of PZT numbered P2 is (200 mm, 200 mm), and the coordinate of PZT numbered P3 is (200 mm, 0 mm). The straight edge direction of the CFRP curved plate is the X-axis, and the circumferential direction of the curved edge of the CFRP curved plate is the Y-axis. The thickness of the CFRP curved plate is 2.28 mm, the side length in the X-axis and Y-axis directions is 600 mm, the curved radius R is 30 mm, and the curved angle is 90°. Delamination damage was simulated by filling the Teflon film in the middle layer of the CFRP curved plate, which was located at the center of the CFRP curved plate with coordinates (x, y) = (100 mm, 100 mm). Three CFRP curved plates, including a healthy curved plate and two curved plates with delamination damage sizes of Φ20 mm and Φ40 mm, were prepared for experimental research, respectively.
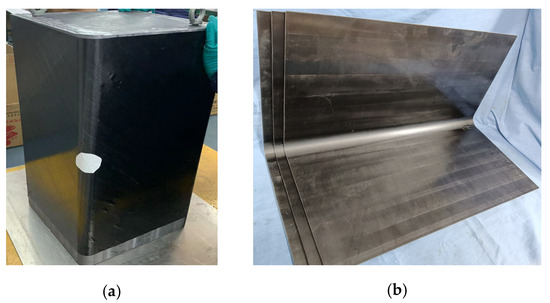
Figure 4.
Aluminum mold and the CFRP curved plate specimen: (a) aluminum mold; (b) CFRP curved plate specimen.

Table 1.
The mechanical properties of CFRP.
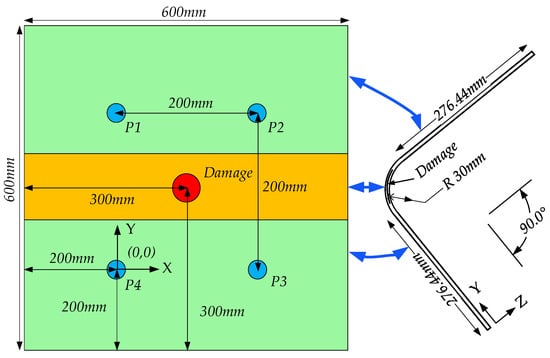
Figure 5.
CFRP curved plate geometric dimension and PZT configuration.
3.2. Experimental Procedure
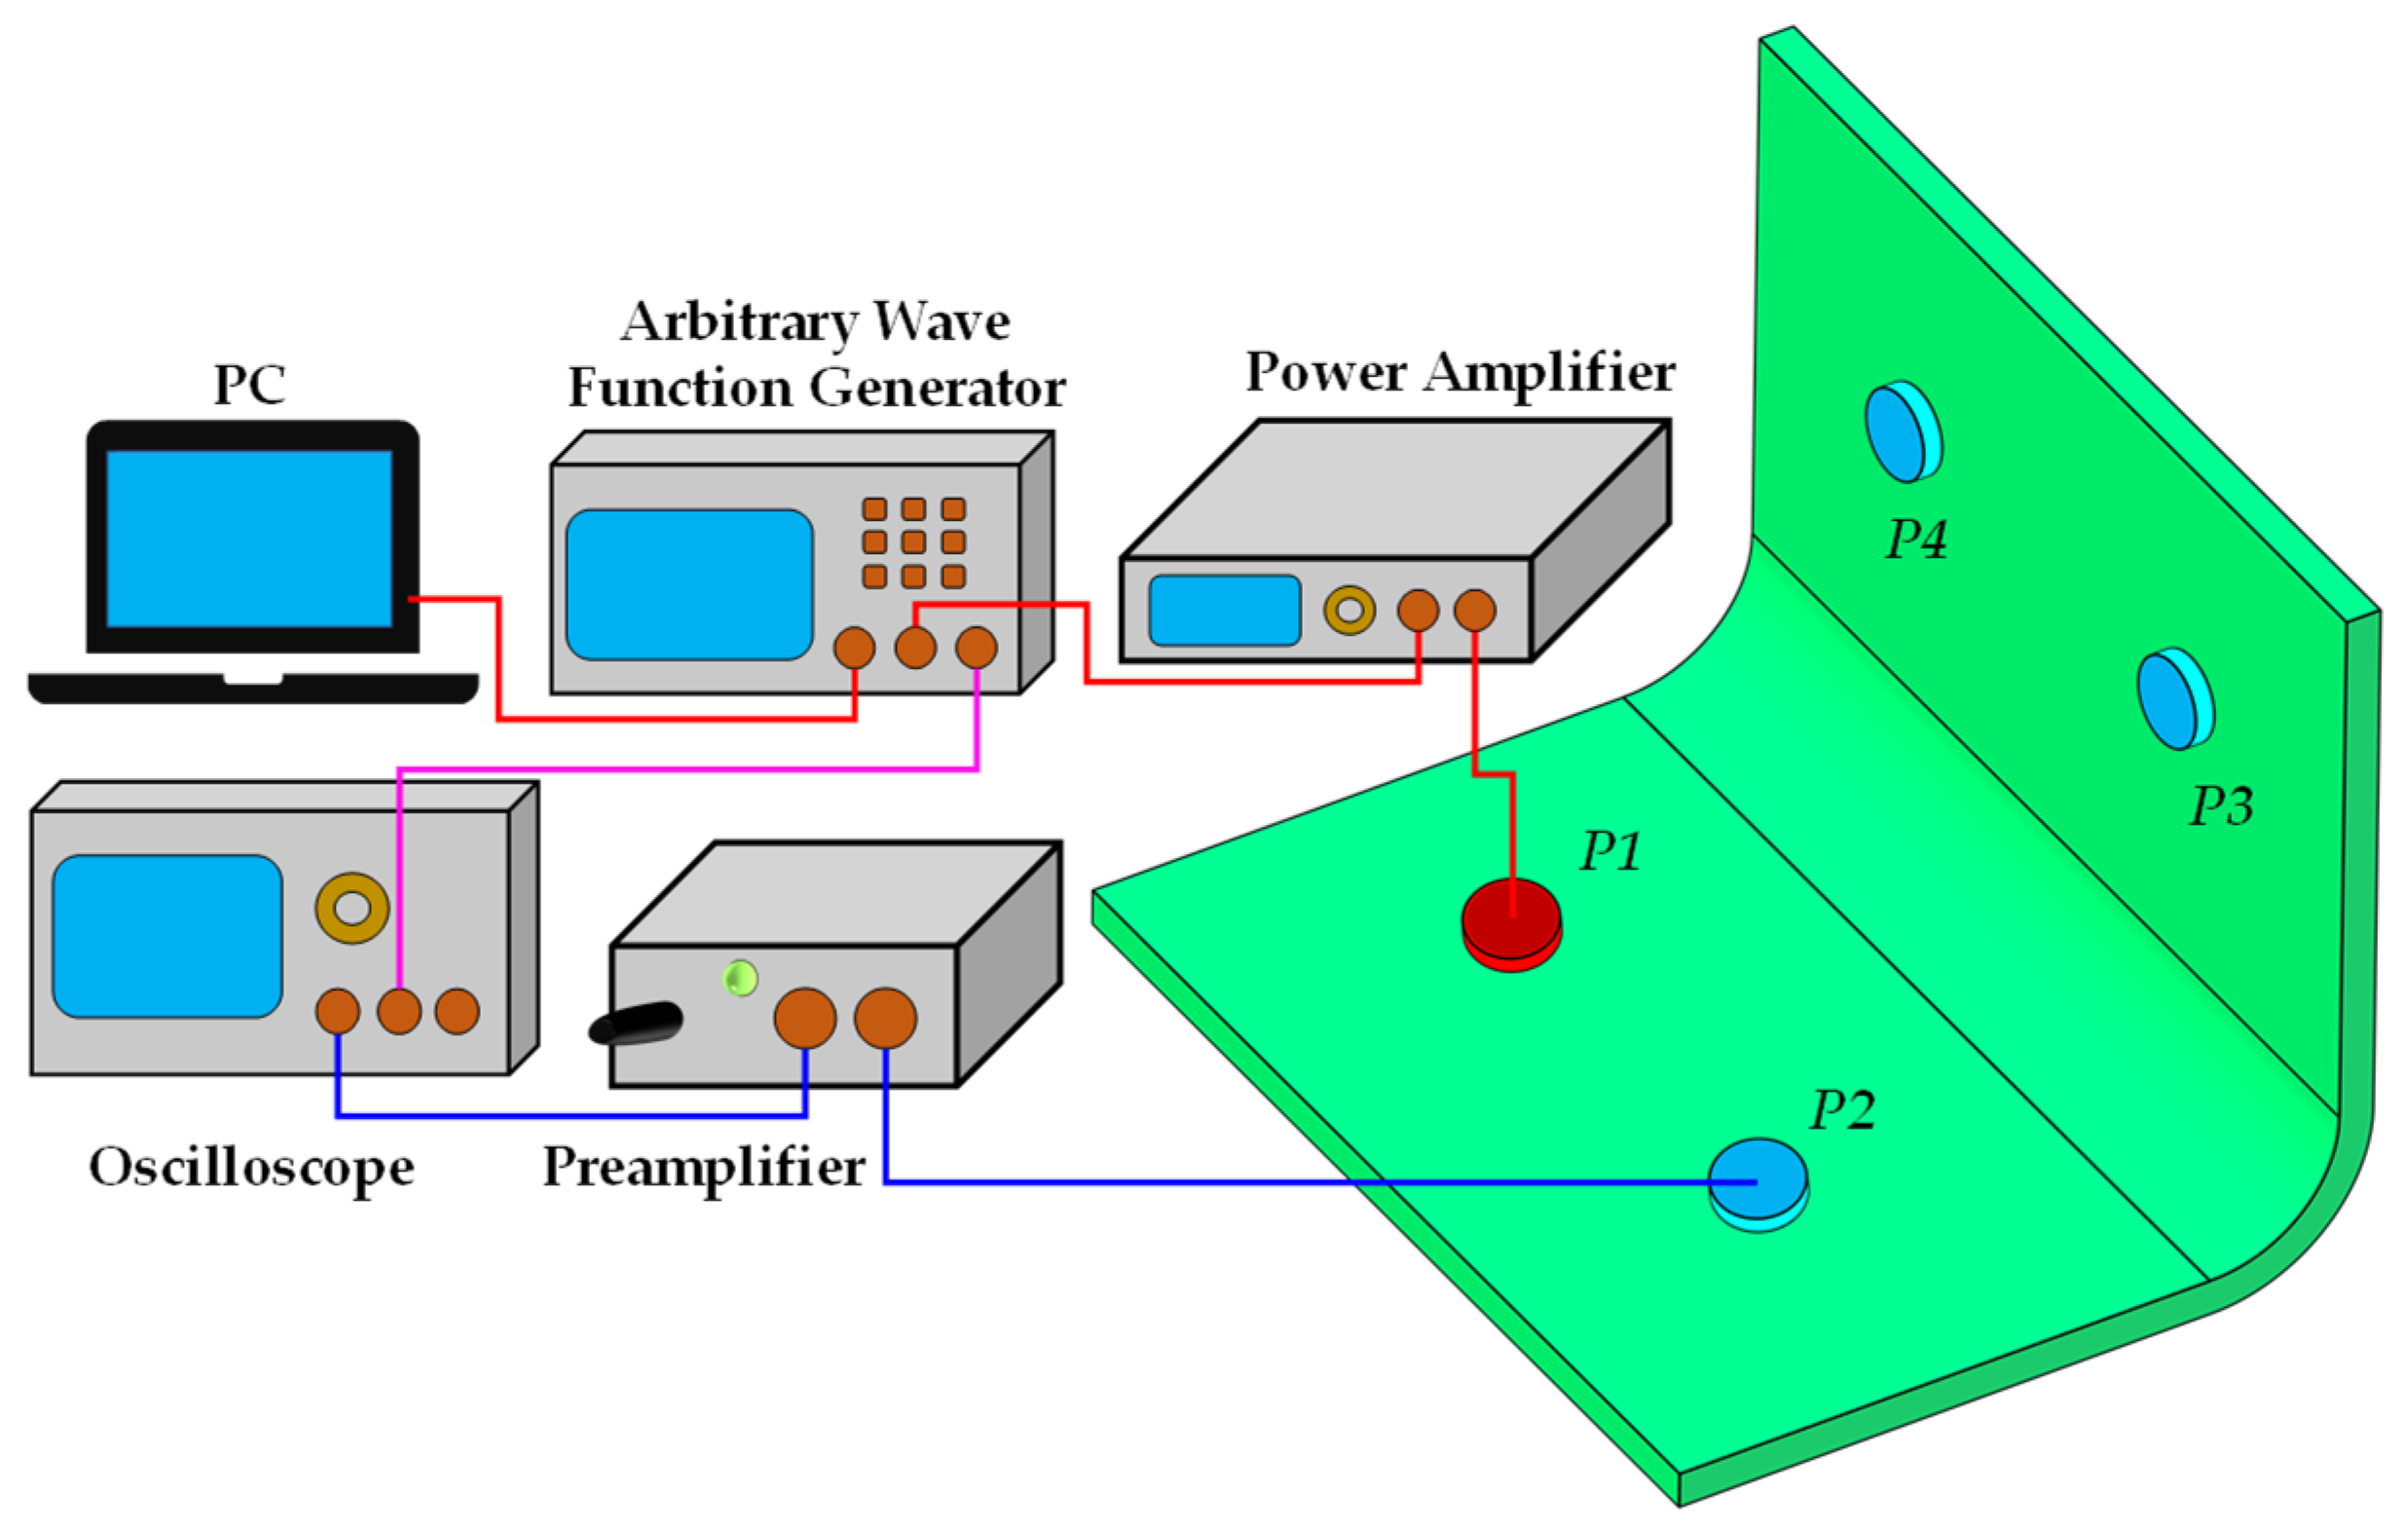
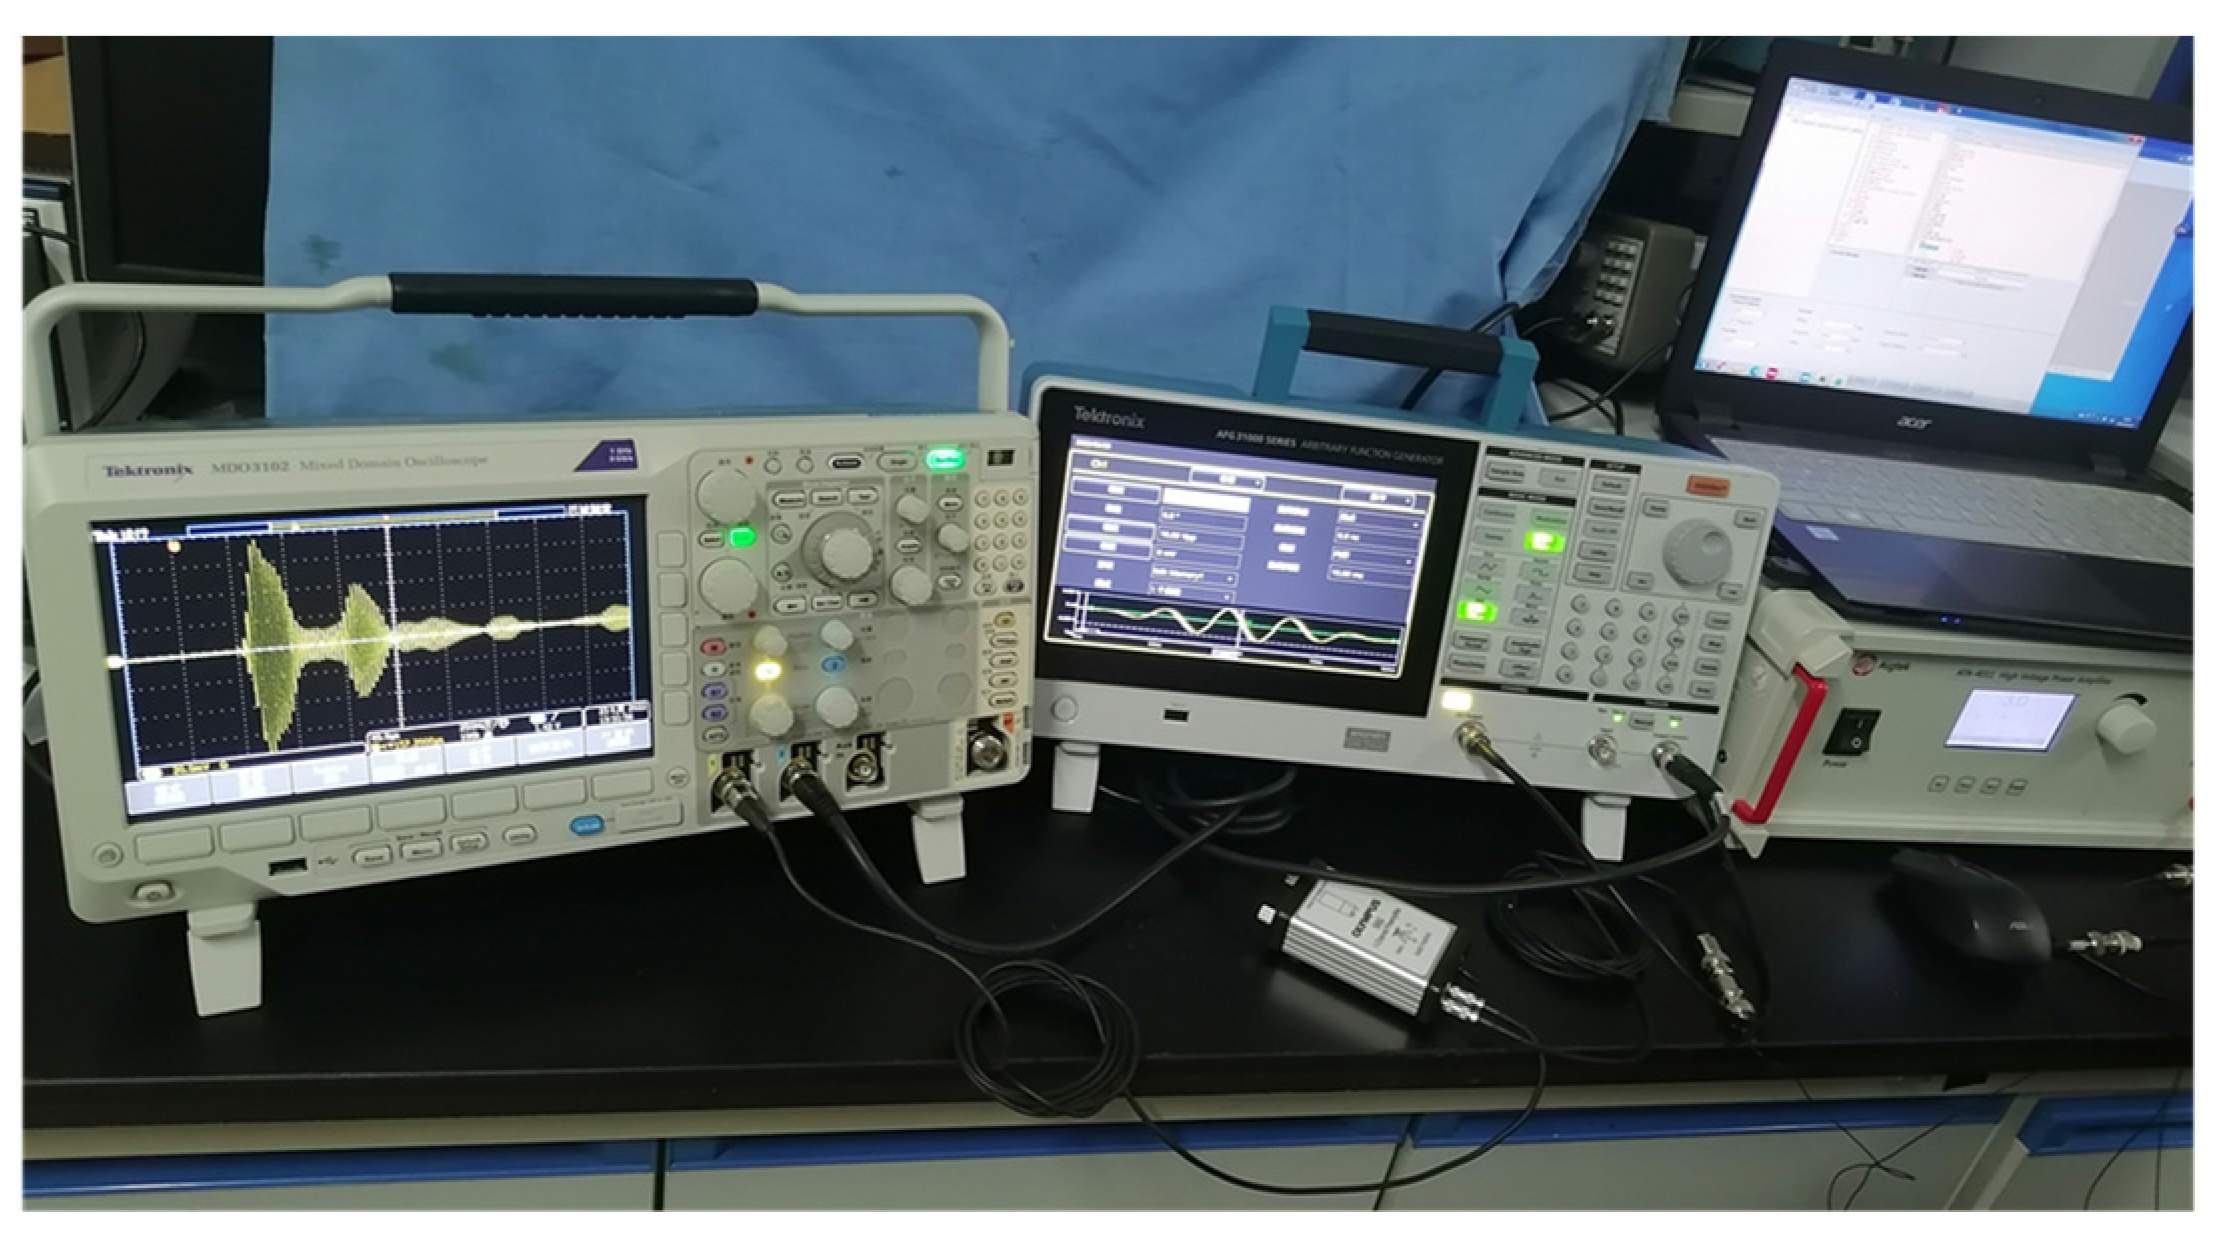
The experimental procedure system is shown in Figure 6. In the figure, the red line represents the excitation signal, the blue line represents the received Lamb wave signal, and the pink line represents the trigger signal. The PC controls the arbitrary wave function generator (AFG−31000) through the software Tektronix ArbExpress (Version 3.6 2020.07.03) to generate a five-cycle narrowband Tone–Burst signal modulated by the Hanning window [47], with a signal voltage amplitude of 10 Vpp. The excitation frequency f varies from 220 kHz to 320 kHz in a step of 10 kHz. The excitation signal was amplified three times by the power amplifier (ATA−4011), and then a PZT transducer was excited to generate Lamb waves in the CFRP curved plate. Other PZT transducers were used to receive the Lamb wave signals. In the experiment, honey was used as the couplant to paste the PZT transducer onto the CFRP curved plate, and the PZT transducer was fixed to the CFRP curved plate with insulating tape (BULL ET6). The received Lamb wave signals were amplified by a preamplifier (OLYMPUS−5682) and then saved by an oscilloscope No. 1 channel (Tektronix MDO3102) with a sampling rate of 250 MS/s. At the same time, the trigger signal output by the arbitrary wave function generator was transmitted to the No. 2 channel of the oscilloscope, which was used as the trigger source signal of the oscilloscope to calibrate the time reference. In this way, the waveform of the Lamb wave was displayed and saved synchronously with the trigger signal, so the complete time information of the Lamb wave signal from excitation to receipt by the oscilloscope could be obtained. Throughout the experiment, the Lamb wave signals for each detection condition were gathered on 16 occasions and averaged to mitigate the influence of noise interference. The gathered Lamb wave signals were processed according to the signal processing method in Section 2. The experimental system is shown in Figure 7.

Figure 6.
The experimental procedure system.
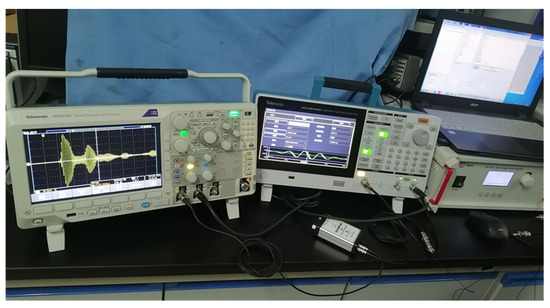
Figure 7.
The experimental system.
4. Results and Discussion
4.1. DaS Algorithm Localization Results
The DaS algorithm requires the Lamb wave group velocity as prior knowledge. The Lamb wave group velocity of the CFRP obtained by theoretical calculation differs from that of the CFRP under actual situations. The equation for calculating the Lamb wave group velocity is defined as
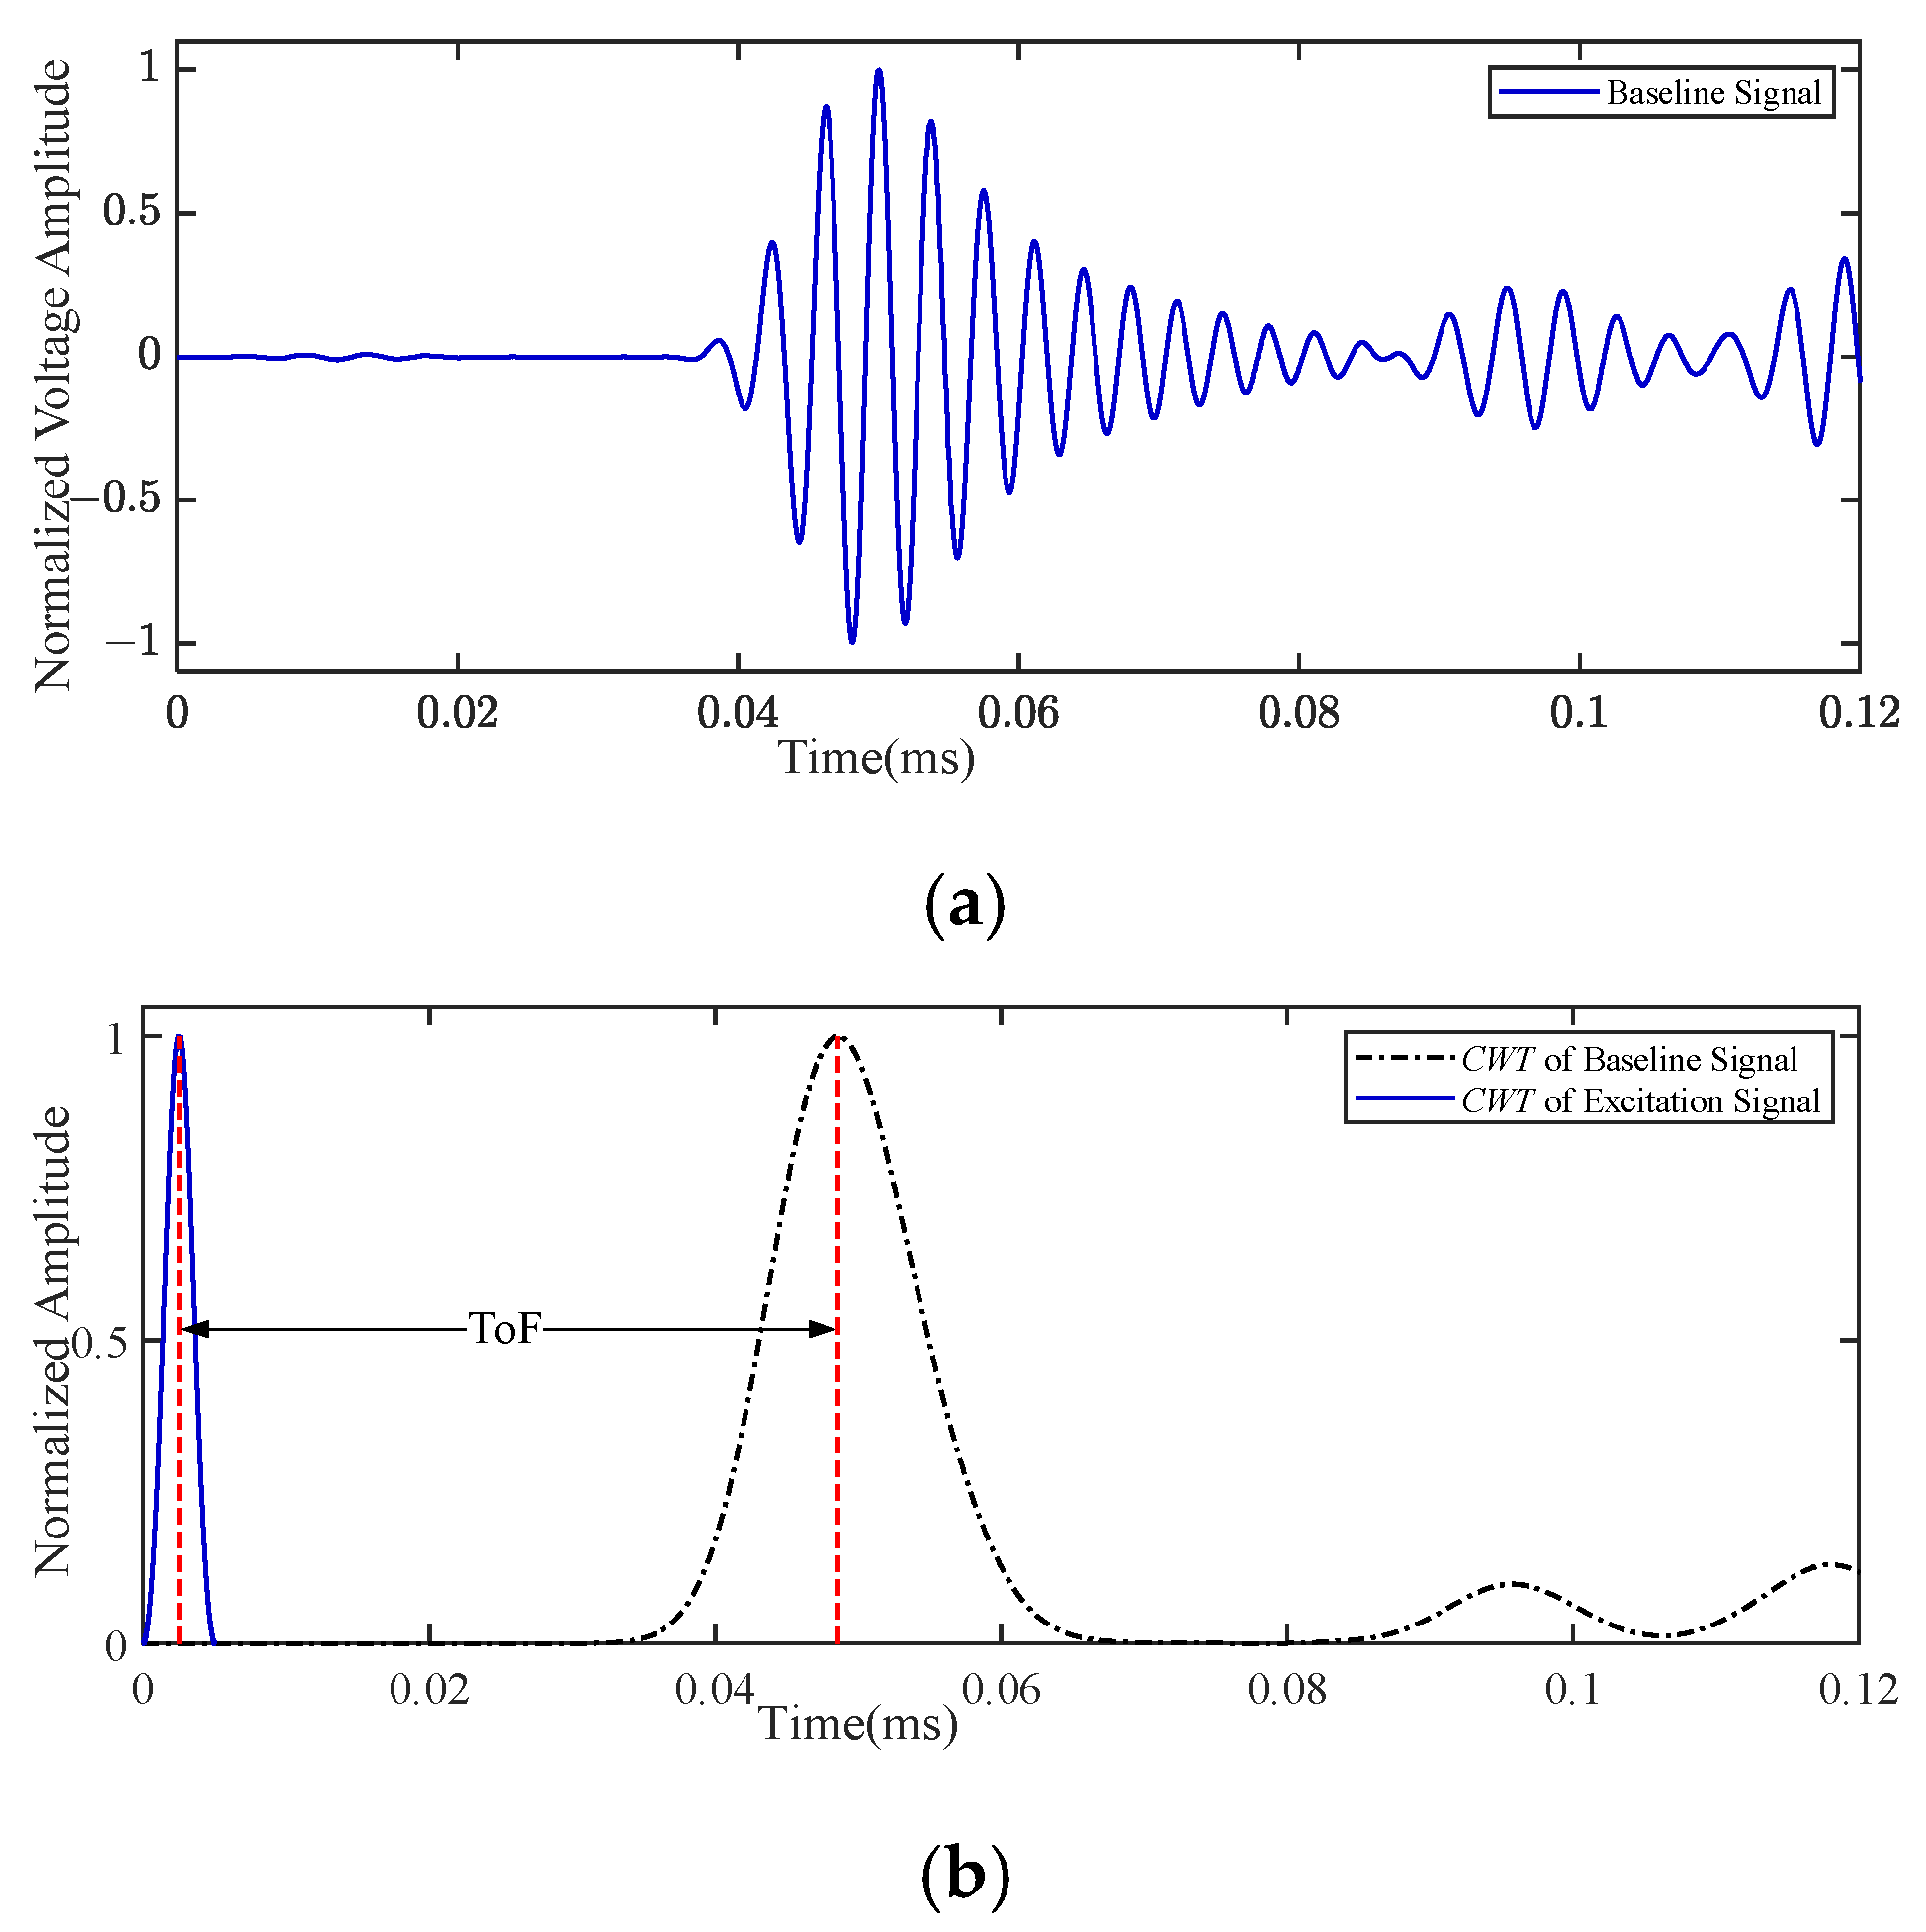
where D is the distance between the actuator and the sensor. To obtain ToF, the CWT was applied to both the excitation and baseline signals. In Equation (11), ToF represents the time elapsed from the peak of the excitation signal’s CWT to the first peak of the baseline signal’s CWT. Figure 8a shows the baseline signal of path P1–P2 at a frequency of 220 kHz, with D = 200 mm. Figure 8b shows the CWT of the baseline signal and excitation signal. It can be seen from the figure that there are additional modes other than the incident mode at around 0.1 ms and 0.12 ms. The edge reflections of the specimen cause the additional modes. The group velocities of Lamb waves at various frequencies are shown in Table 2.
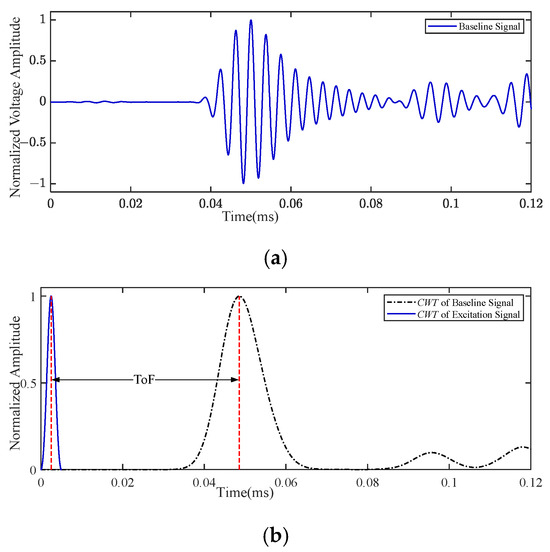
Figure 8.
The baseline signal and its CWT of the P1–P2 path at a frequency of 220 kHz: (a) baseline signal; (b) the CWT of baseline signal and excitation signal.
Table 2.
The group velocities of Lamb waves at various frequencies.
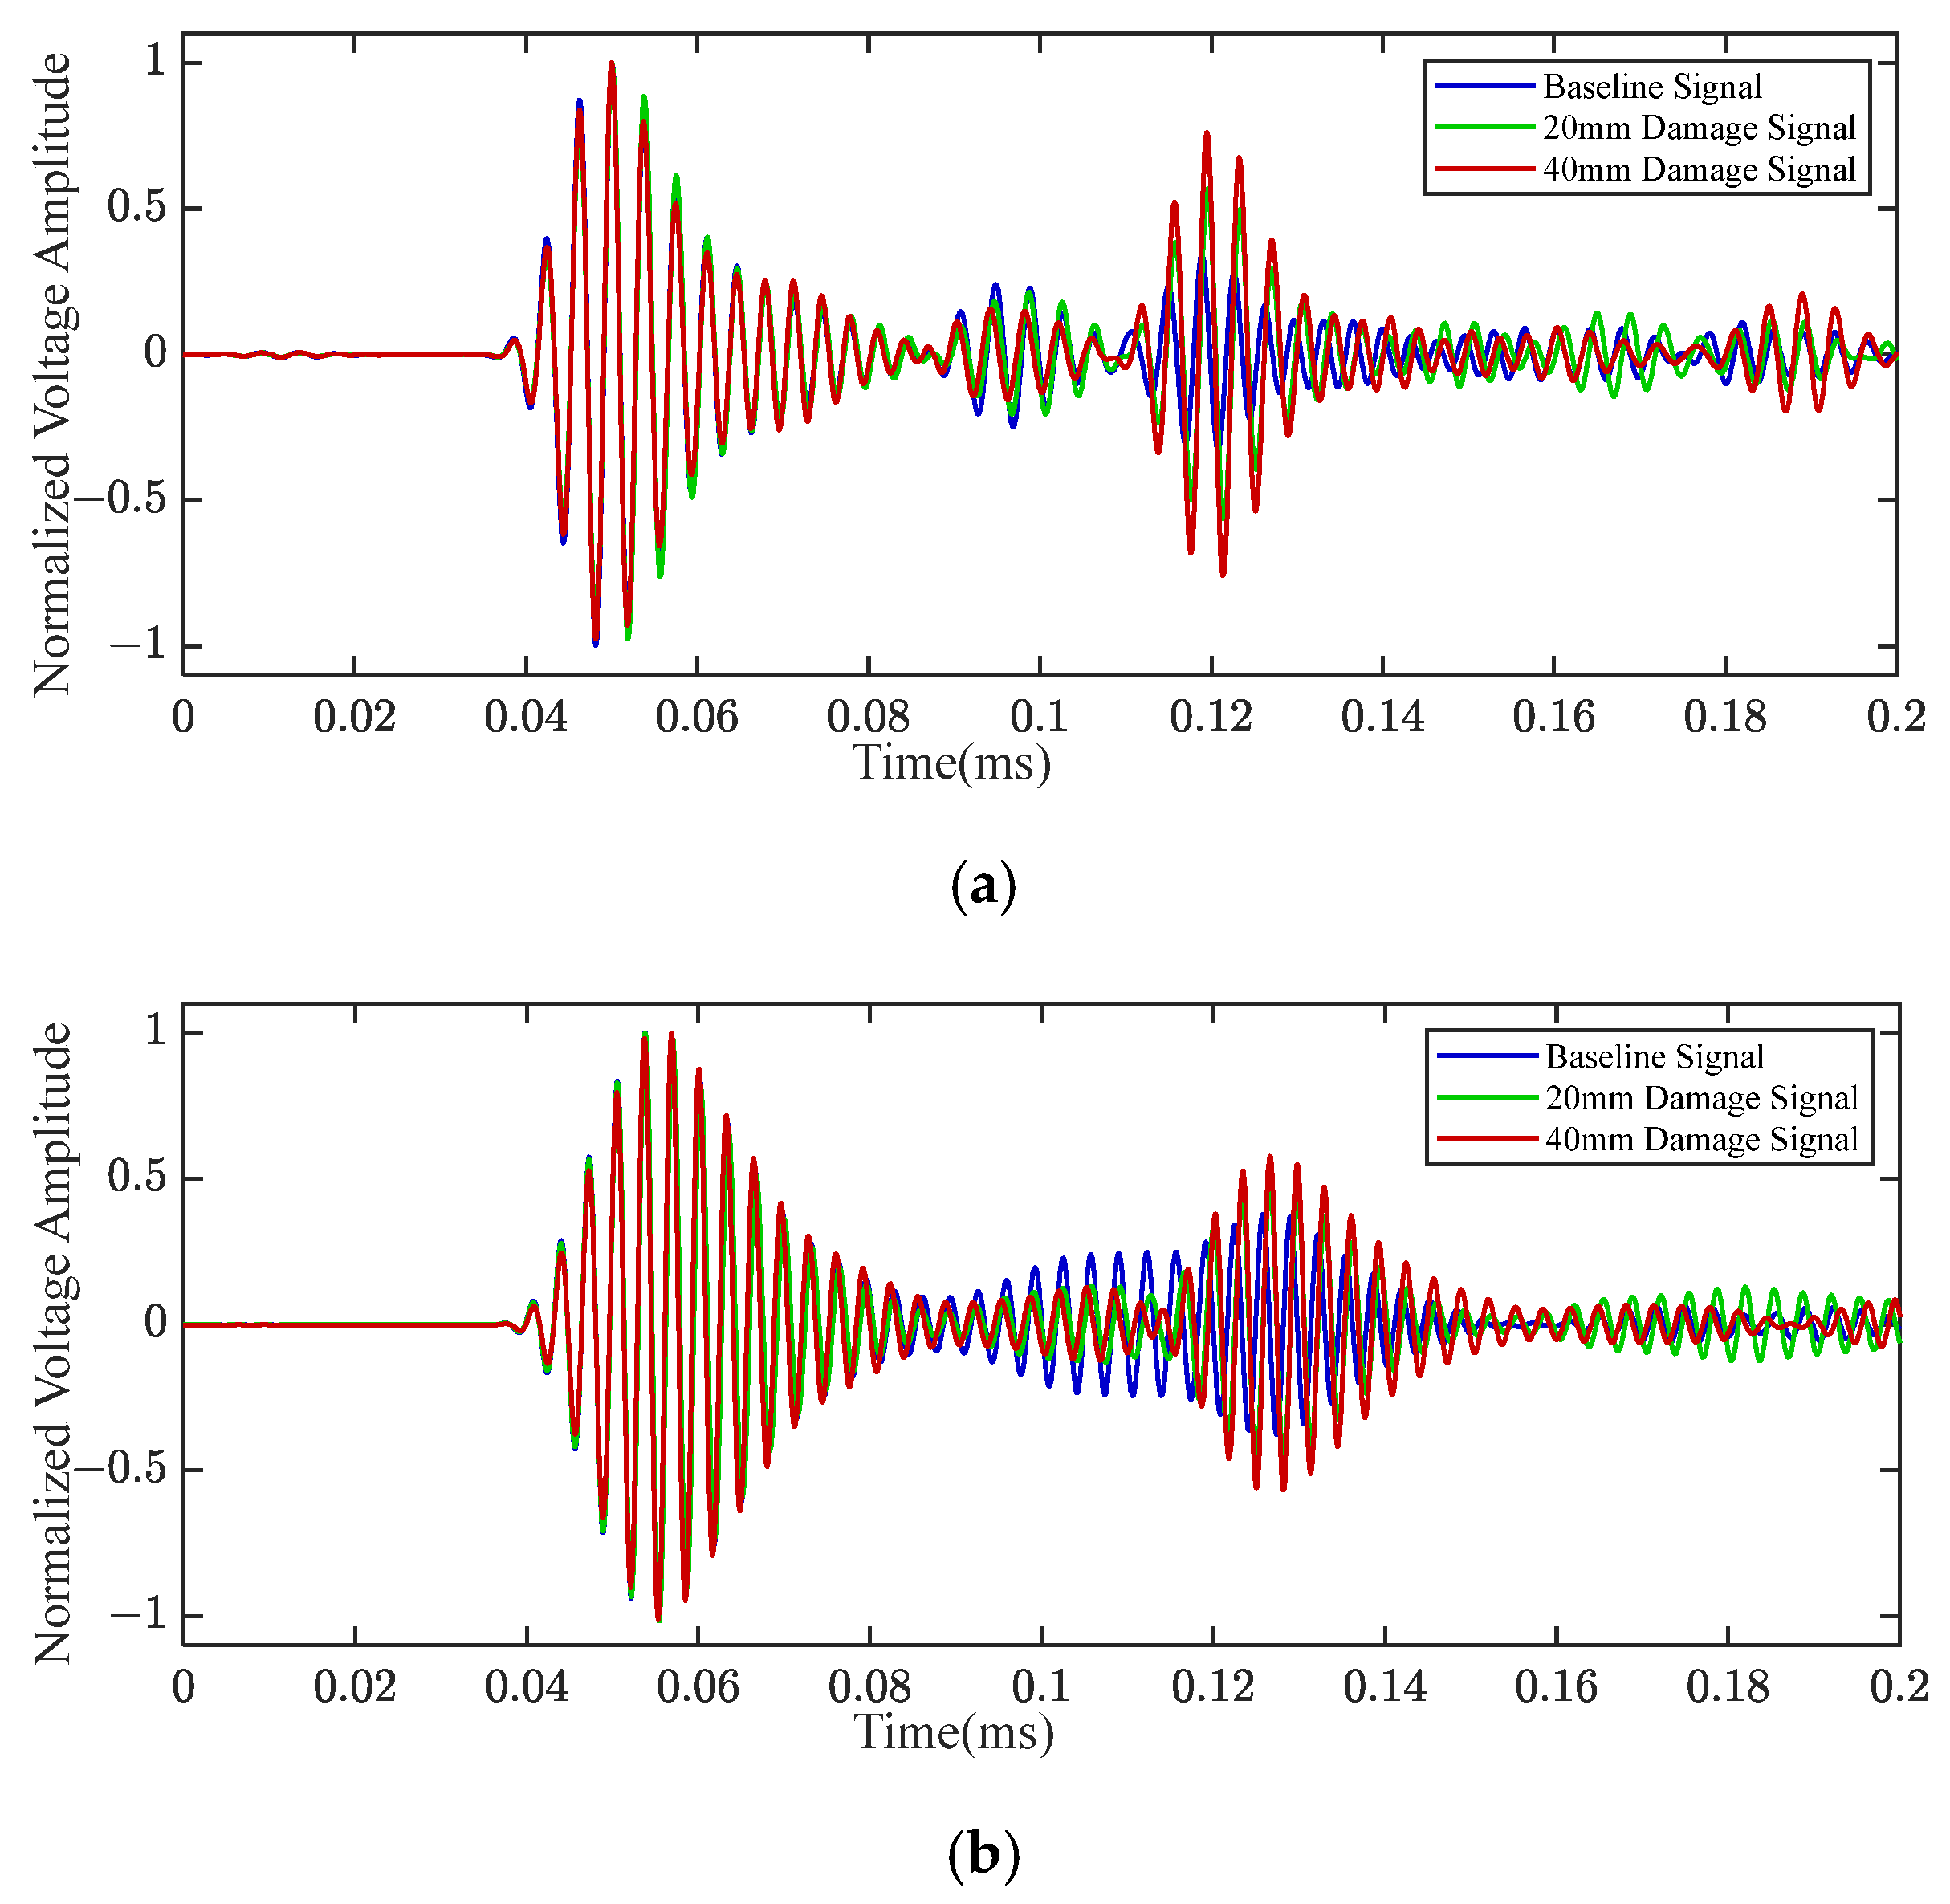
At the frequencies of 220 kHz and 320 kHz, the Lamb wave signals of the P1–P2 path are shown in Figure 9. The moving average value was used to smooth the Lamb wave signal. The smoothing method was ‘gaussian’, and the moving smoothing window size was 60. The direct Lamb wave of the P1–P2 path did not propagate through the delamination damage and curved structure. As can be seen from Figure 9, the amplitude and phase of the Lamb wave signal changed due to the existence of delamination damage, and the influence of Φ40 mm delamination damage on the Lamb wave signal was more obvious than that of Φ20 mm delamination damage. In addition, with the increase in frequency, the impact of delamination damage on Lamb wave signals became more significant.
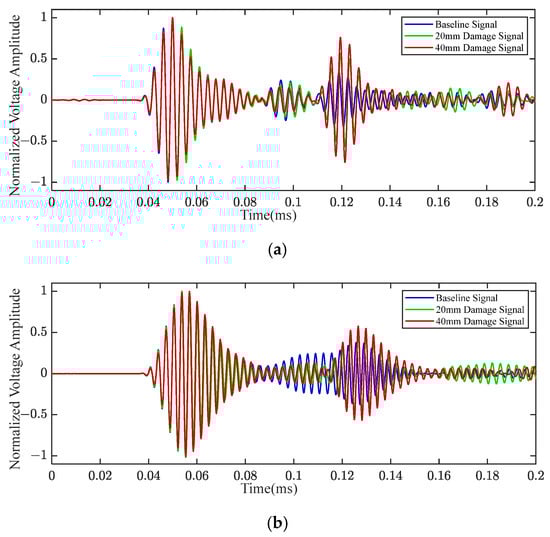
Figure 9.
The Lamb wave signals at various frequencies of the P1–P2 path: (a) 220 kHz; (b) 320 kHz.
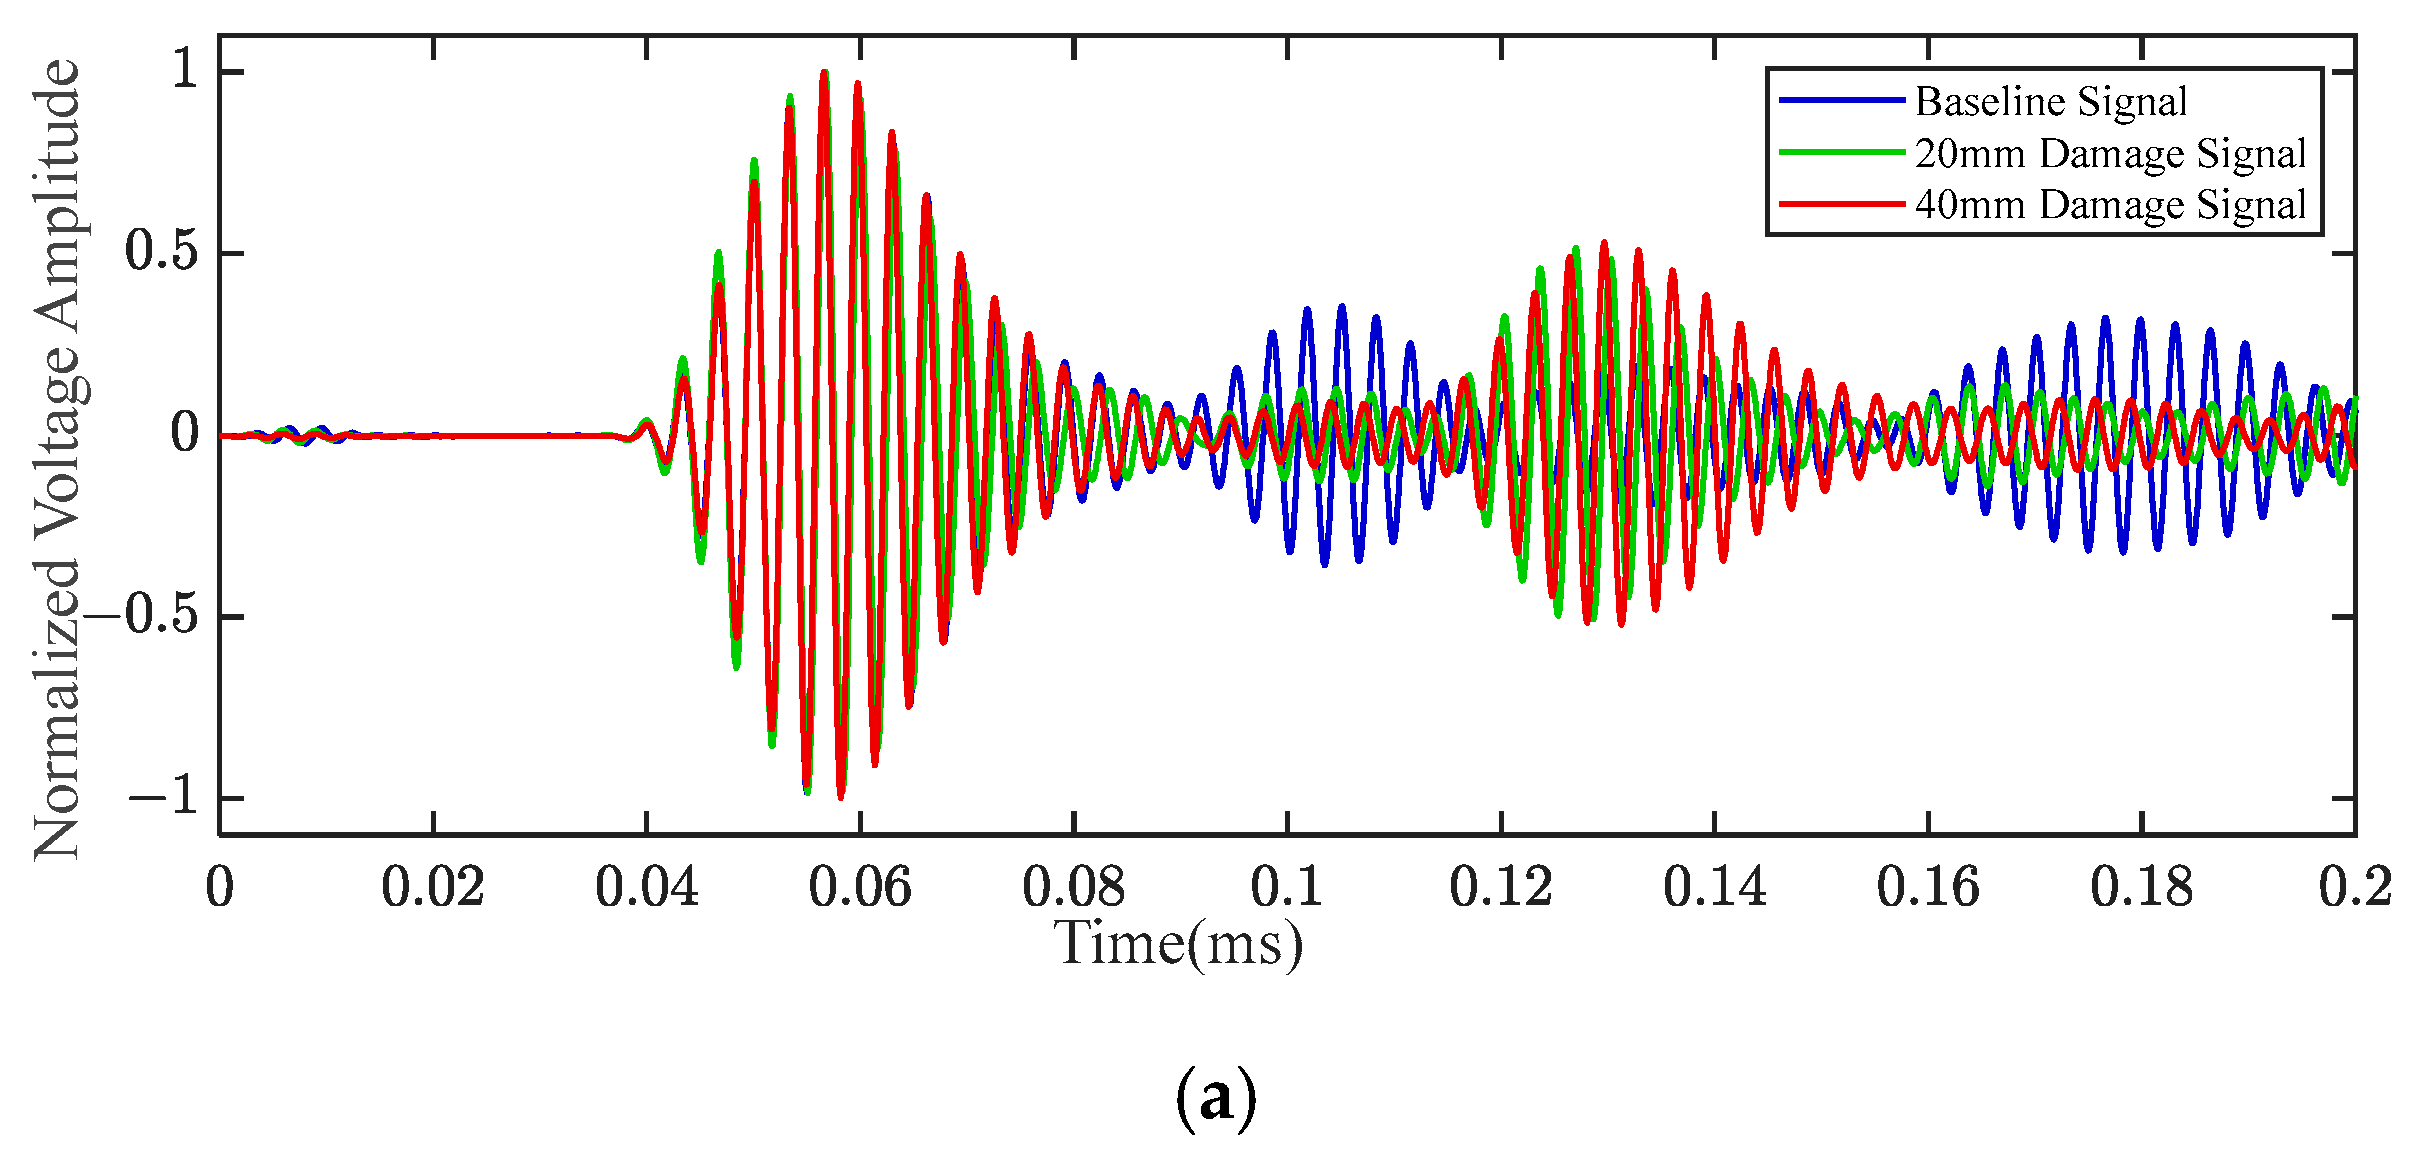
At the frequency of 320 kHz, the Lamb wave signals of the P2–P3 path and P2–P4 path are shown in Figure 10. The direct Lamb wave of the P2–P3 path propagates through the curved structure, and the direct Lamb wave of the P2–P4 path propagates through the delamination damage and the curved structure. As can be seen from Figure 10a, the energy distribution of the Lamb wave in the time domain is changed due to the existence of delamination damage. Similarly, the energy value of the Lamb wave is changed due to the existence of delamination damage, as illustrated in Figure 10b. Furthermore, by comparing with the Lamb wave waveforms depicted in Figure 9, it is evident that there are notable distinctions in the Lamb wave signals for the P1–P2, P2–P3, and P2–P4 paths at the same frequency. These distinctions primarily arise from whether the Lamb wave propagates through the curved part of the specimen, as the Lamb wave propagates through and directly interacts with the curved part of the specimen. Moreover, the change in energy caused by Φ40mm delamination damage is greater than that caused by Φ20 mm delamination damage. It can be concluded that the Lamb wave signal is affected differently by delamination damage under various frequencies and propagation paths.
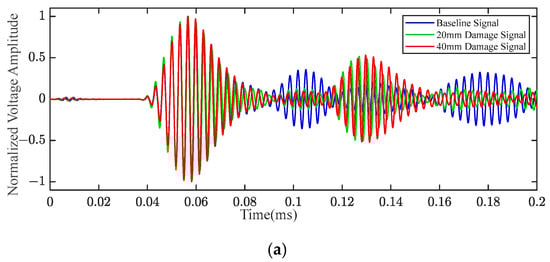
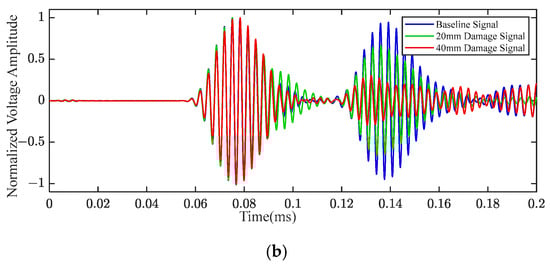
Figure 10.
The Lamb wave signal of different paths under a frequency of 320 kHz: (a) P2–P3 path; (b) P2–P4 path.
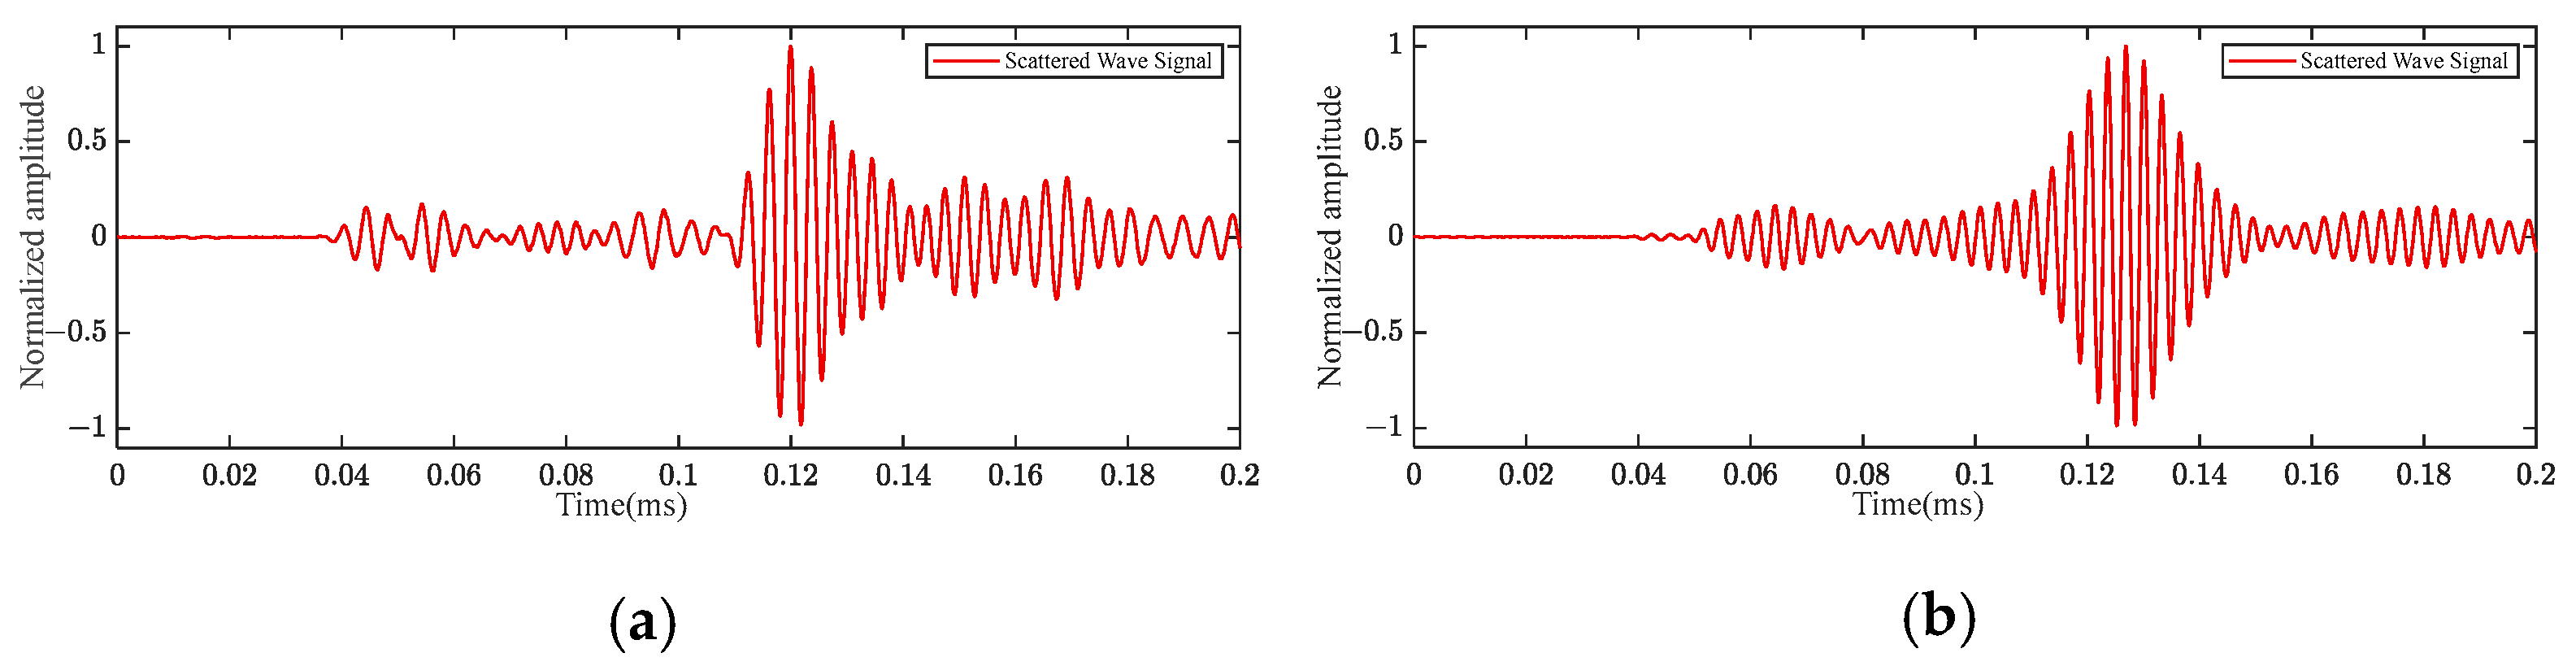
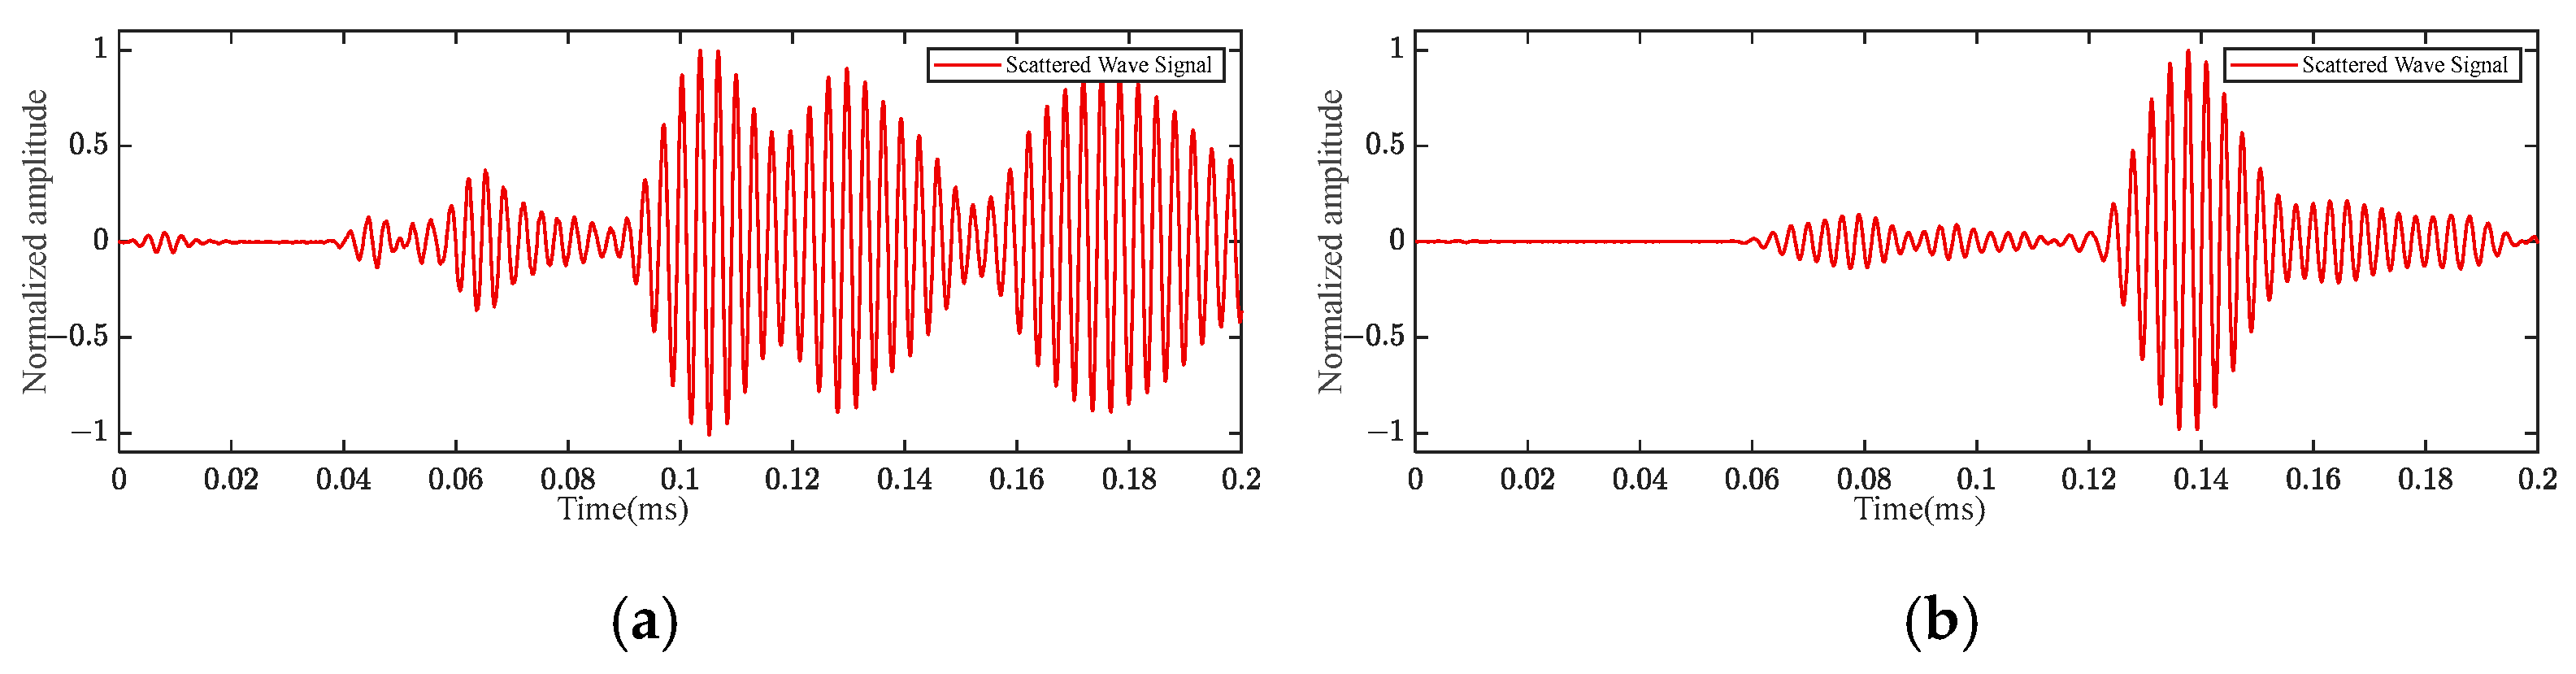
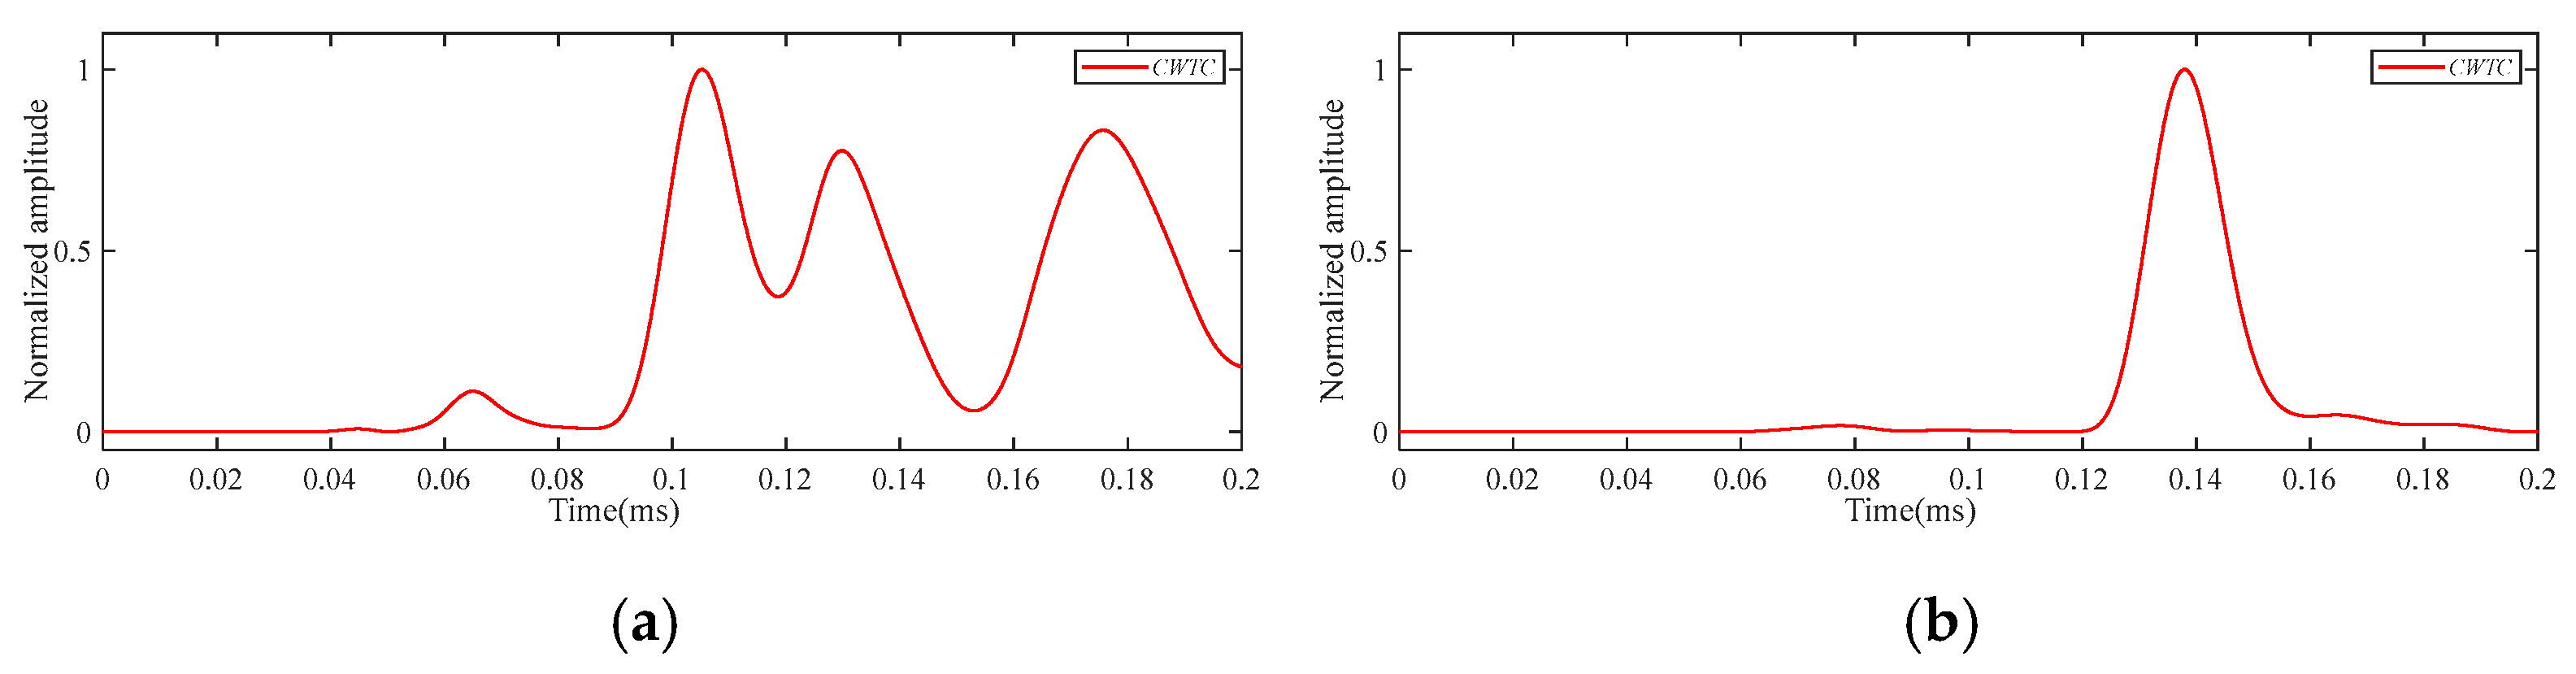
For the case where the delamination damage size is Φ20 mm, the scattered wave signals of the P1–P2 path at frequencies of 220 kHz and 320 kHz are shown in Figure 11. The CWTC was obtained by processing the scattered wave signal with CWT, and CWTC is shown in Figure 12. At the frequency of 320 kHz, the scattered wave signals of Φ20 mm delamination damage under different paths are shown in Figure 13, and their CWTC are shown in Figure 14. As can be seen from Figure 11 to Figure 14, by utilizing the CWT to process the scattered wave signals, we can accurately obtain their time–frequency information, which is beneficial to the localization of delamination damage.
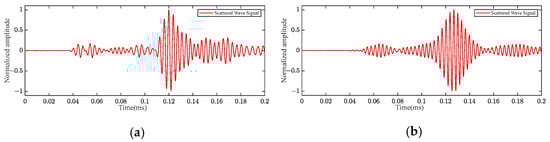
Figure 11.
The scattered wave signals of Φ20 mm delamination damage under the P1–P2 path: (a) 220 kHz; (b) 320 kHz.
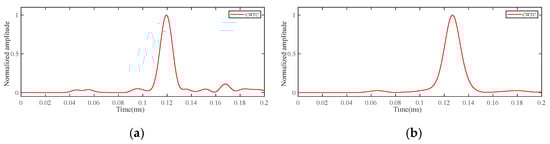
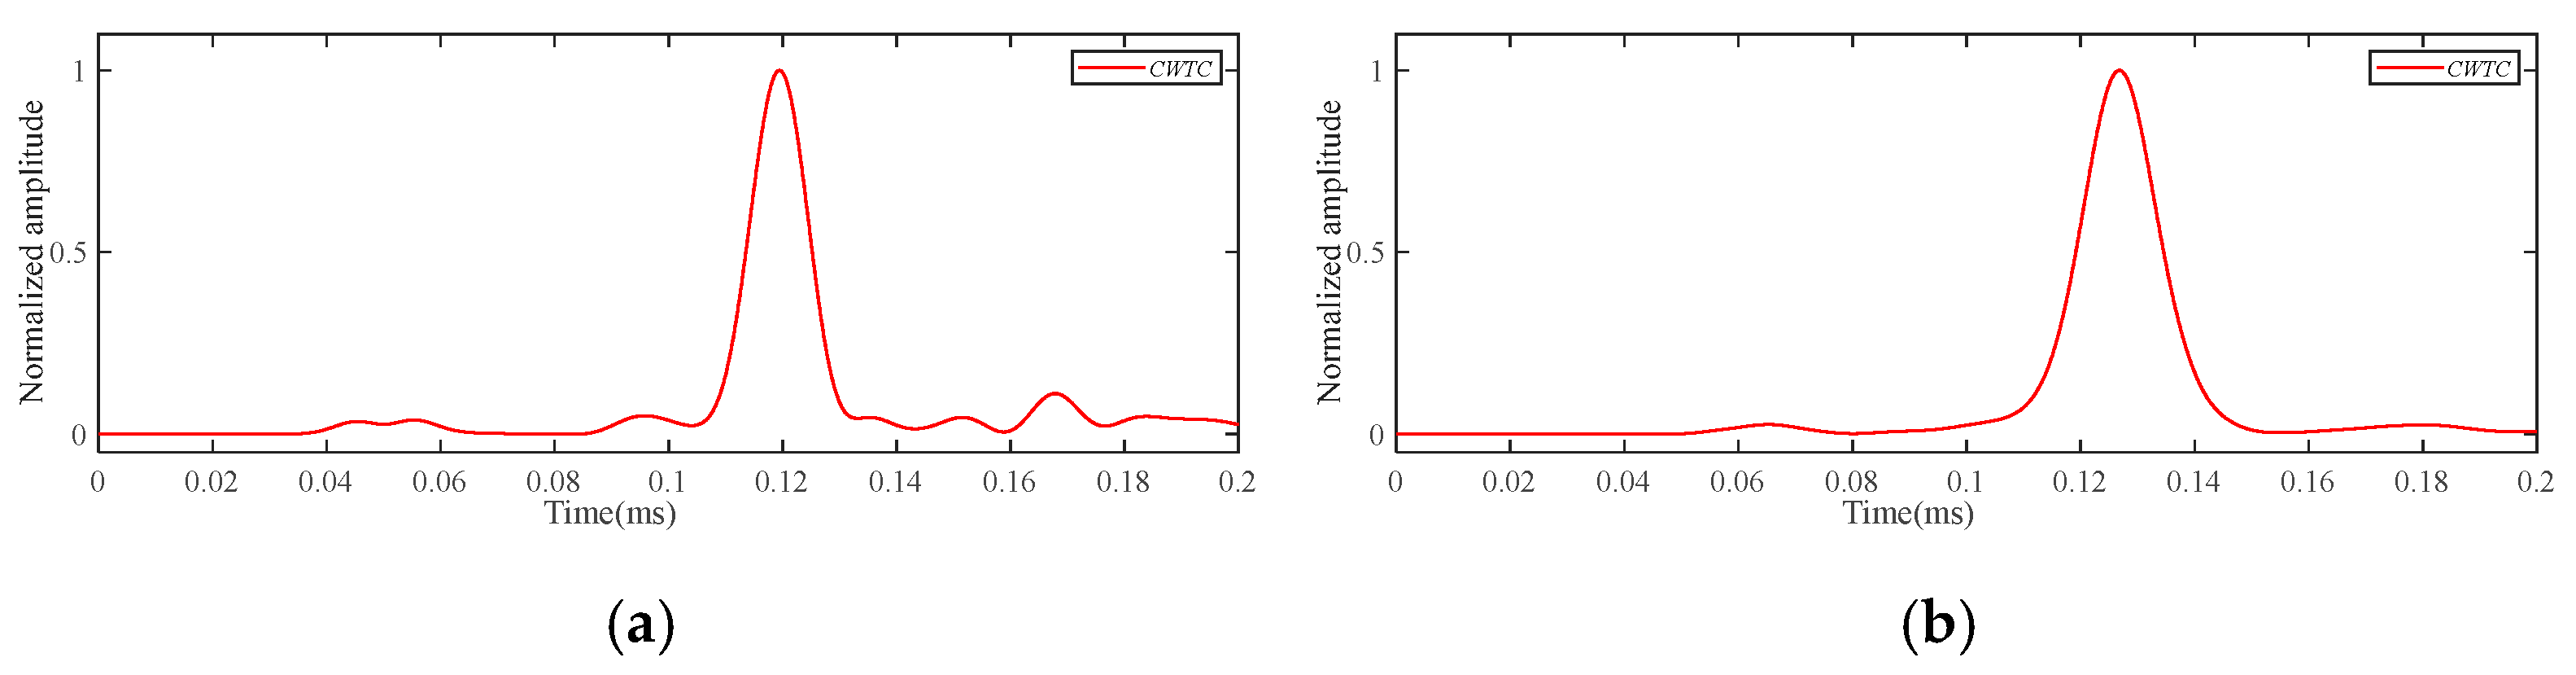
Figure 12.
The CWTC of Φ20 mm delamination damage under the P1–P2 path: (a) 220 kHz; (b) 320 kHz.
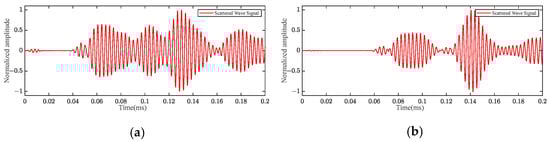
Figure 13.
The scattered wave signals of Φ20 mm delamination damage under the frequency of 320 kHz: (a) P2–P3 path; (b) P2–P4 path.
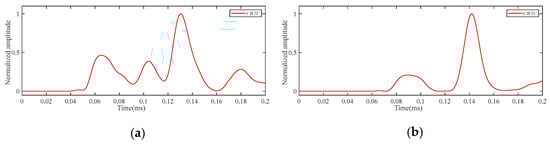
Figure 14.
The CWTC of Φ20 mm delamination damage under the frequency of 320 kHz: (a) P2–P3 path; (b) P2–P4 path.
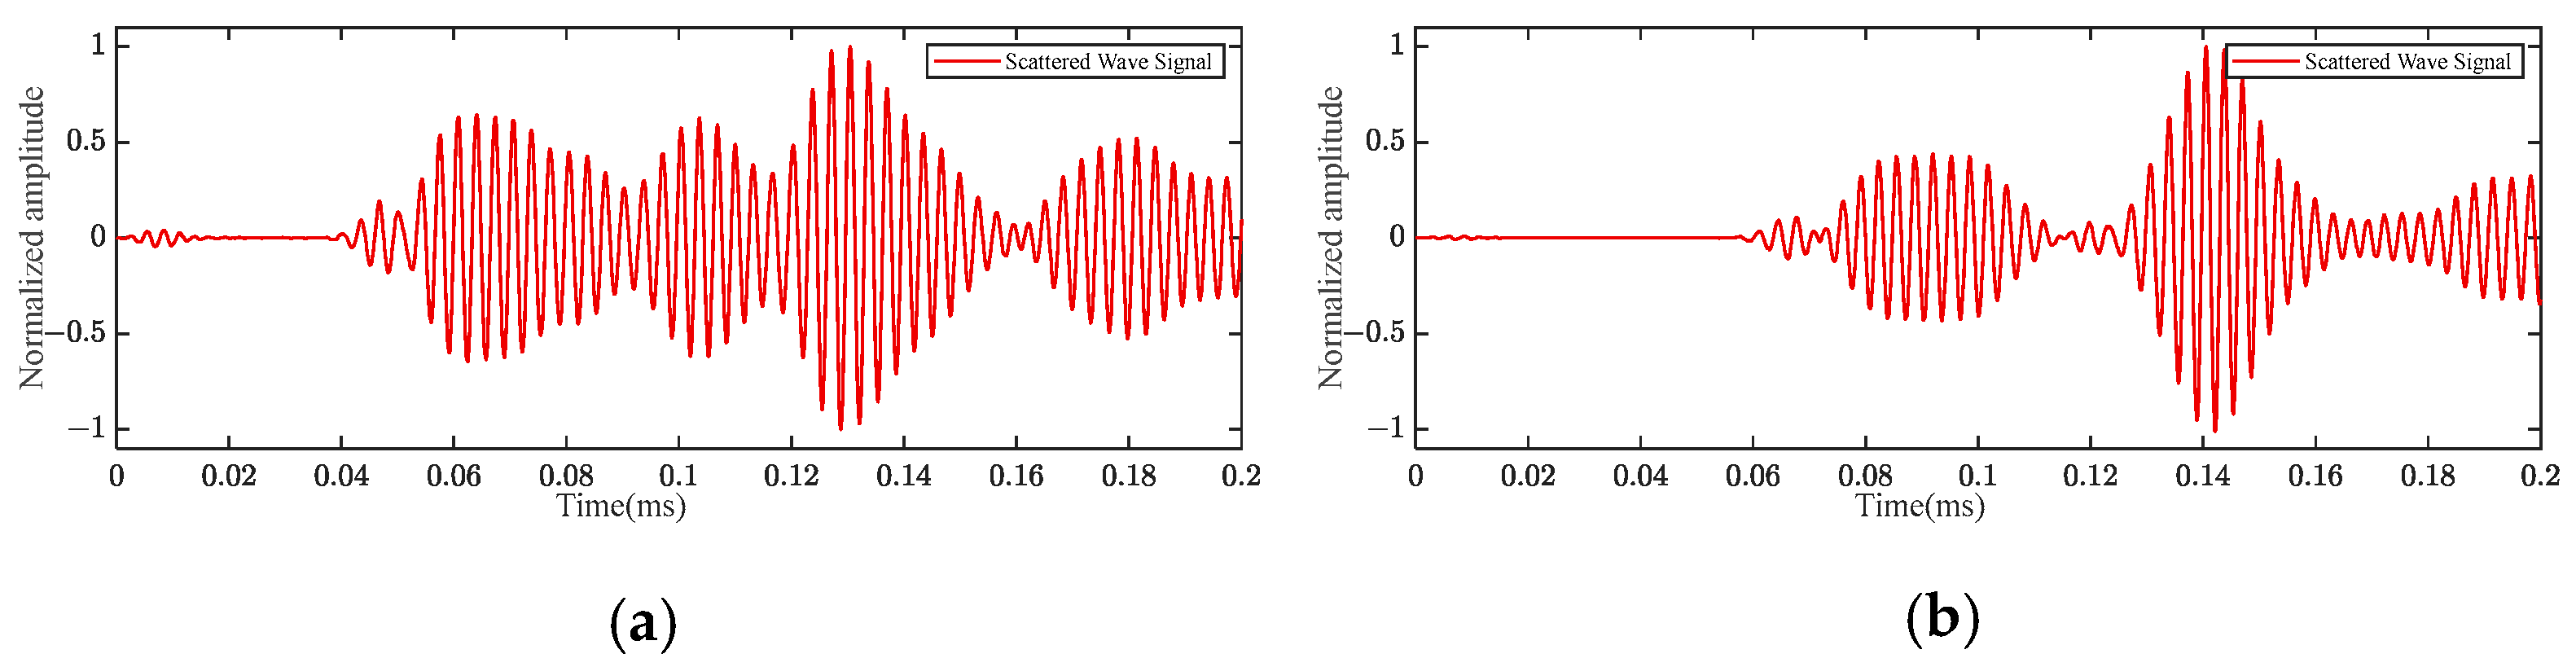
For the case where the delamination damage size is Φ40 mm, the scattered wave signals of the P1–P2 path at frequencies of 220 kHz and 320 kHz are shown in Figure 15, and their CWTC are shown in Figure 16. At the frequency of 320 kHz, the scattered wave signals of Φ40 mm delamination damage under different paths are shown in Figure 17, and their CWTC are shown in Figure 18. As can be seen from Figure 15 to Figure 18, the scattered wave signals of the P2–P3 and P2–P4 paths are more complex in waveform than those on the P1–P2 path. This may be due to the scattering of Lamb waves during their propagation in CFRP, which was caused by the existence of curved structures and delamination damage. It can be observed that the scattered wave signal for the P2–P4 path shown in Figure 17b, which encountered the delamination head-on, exhibits fewer features or modes compared to the scattered wave signal for P1–P2 in Figure 15b and the scattered wave signal for P2–P3 in Figure 17a. From the Lamb wave signals in Figure 9b and Figure 10, it can be explained that the distinctions between the baseline signal and the damage signal of the P2–P4 path are too obvious near 0.14 ms, which obscures the display of the features or modes of the scattered wave signal (encountered the delamination head-on).
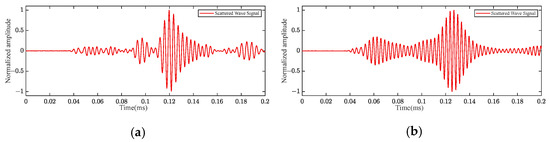
Figure 15.
The scattered wave signals of Φ40 mm delamination damage under the P1–P2 path: (a) 220 kHz; (b) 320 kHz.
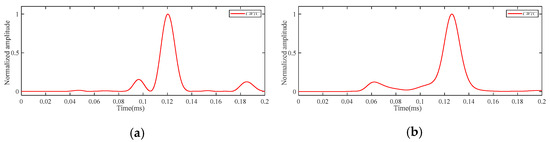
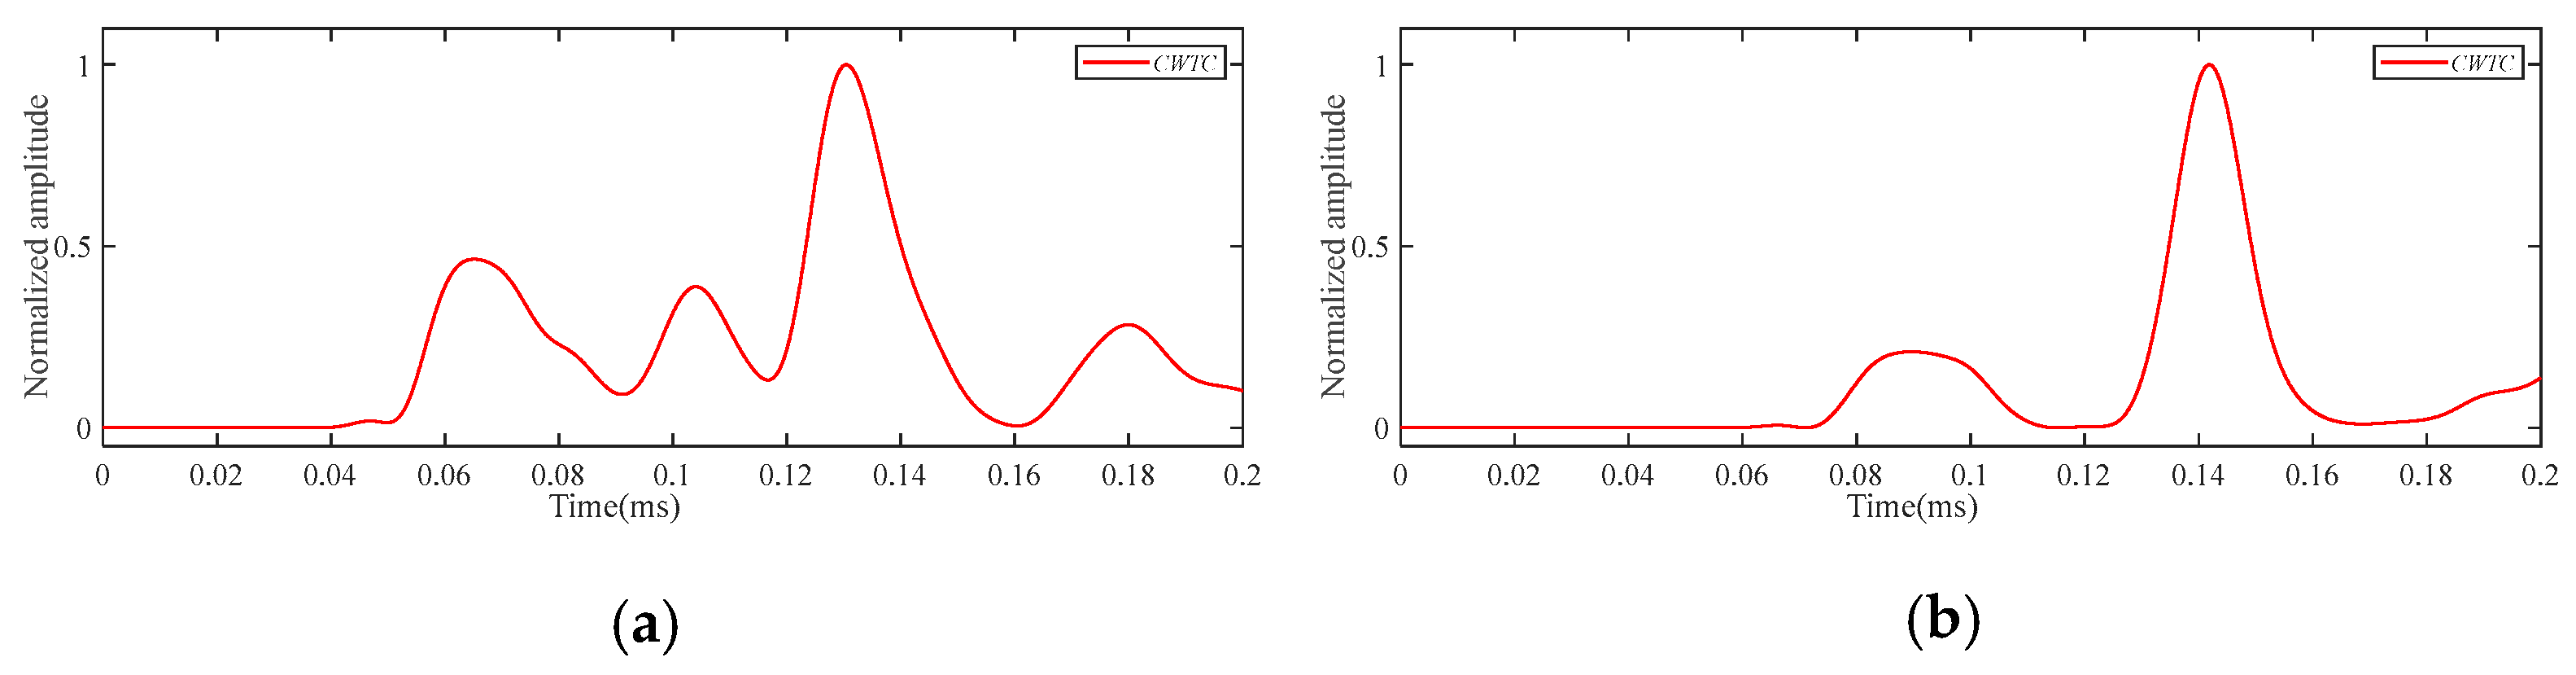
Figure 16.
The CWTC of Φ40 mm delamination damage under the P1–P2 path: (a) 220 kHz; (b) 320 kHz.
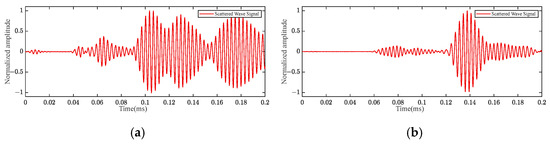
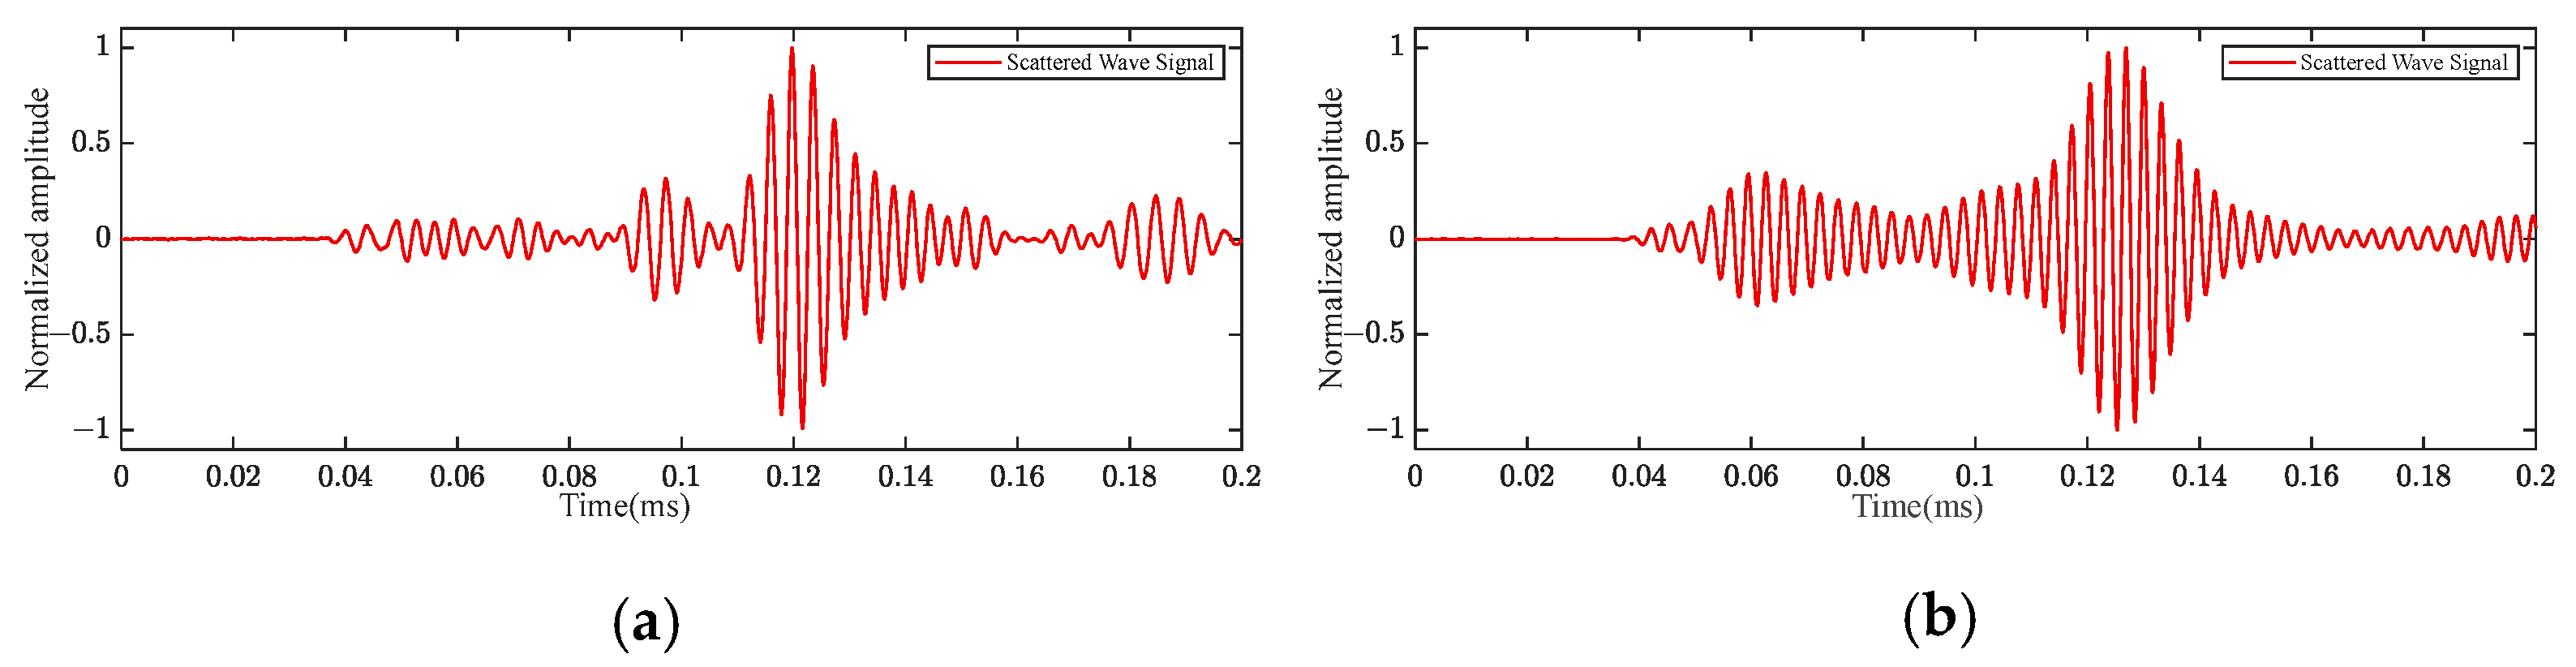
Figure 17.
The scattered wave signals of Φ40 mm delamination damage under the frequency of 320 kHz: (a) P2–P3 path; (b) P2–P4 path.
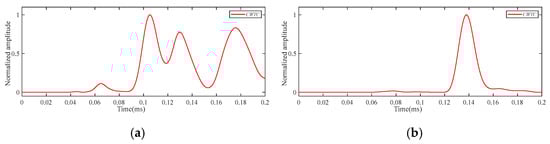
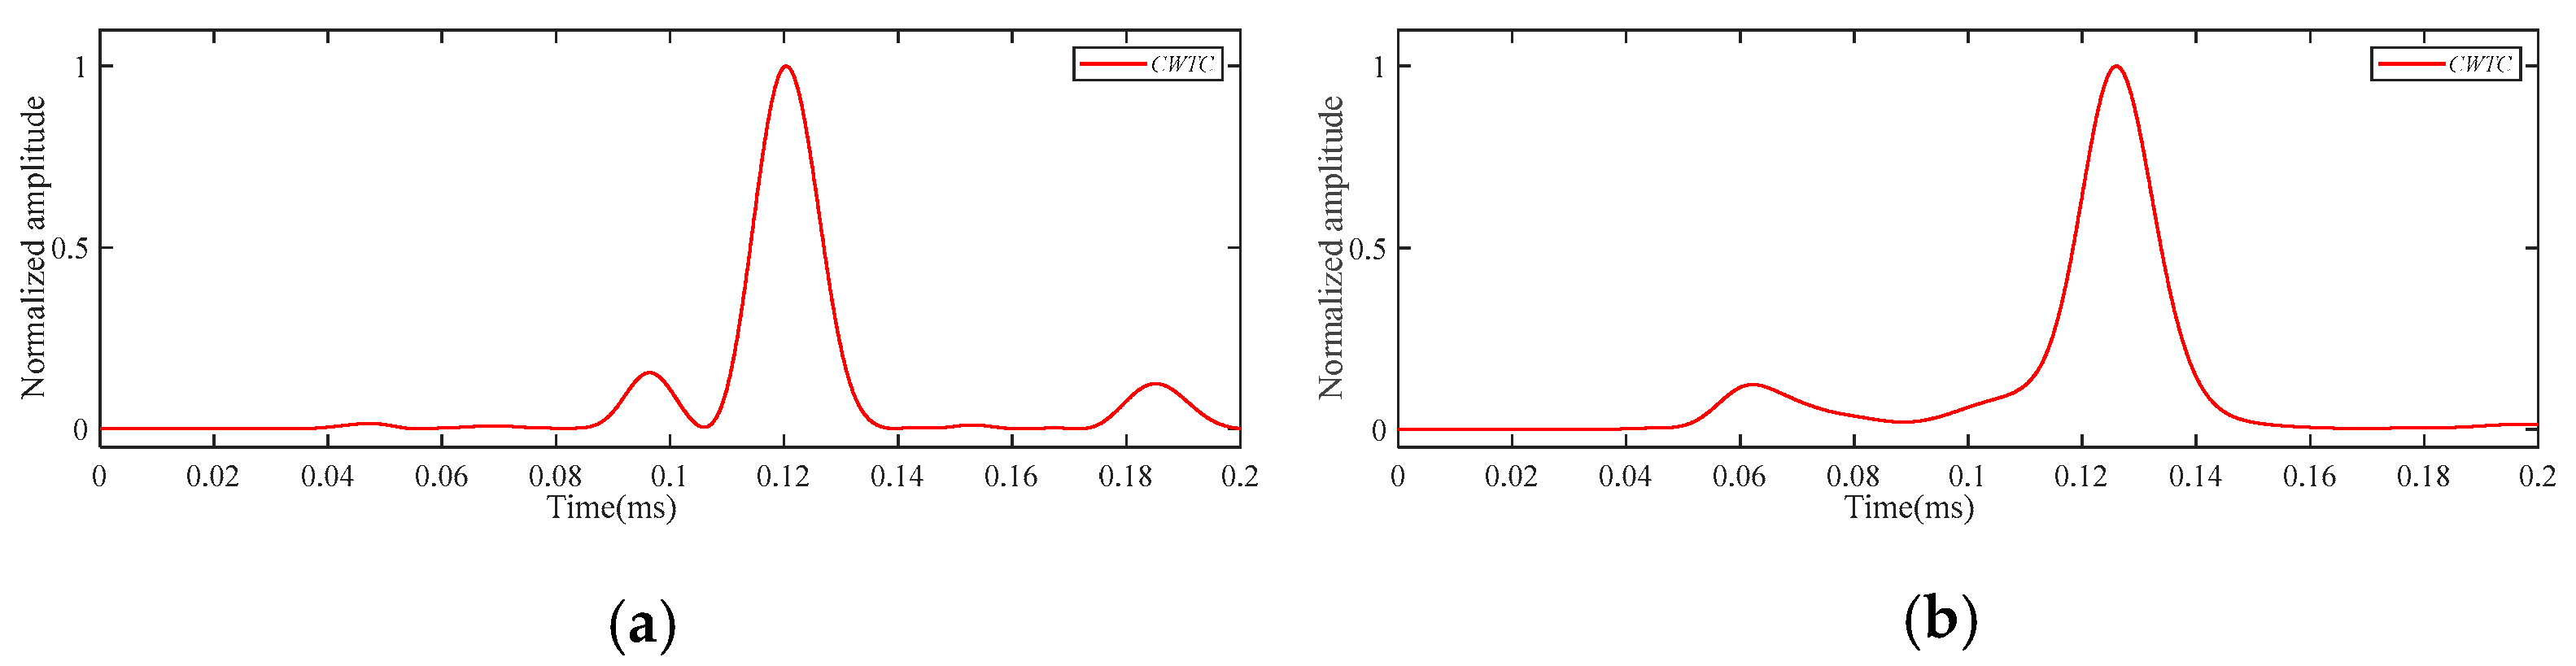
Figure 18.
The CWTC of Φ40 mm delamination damage under the frequency of 320 kHz: (a) P2–P3 path; (b) P2–P4 path.
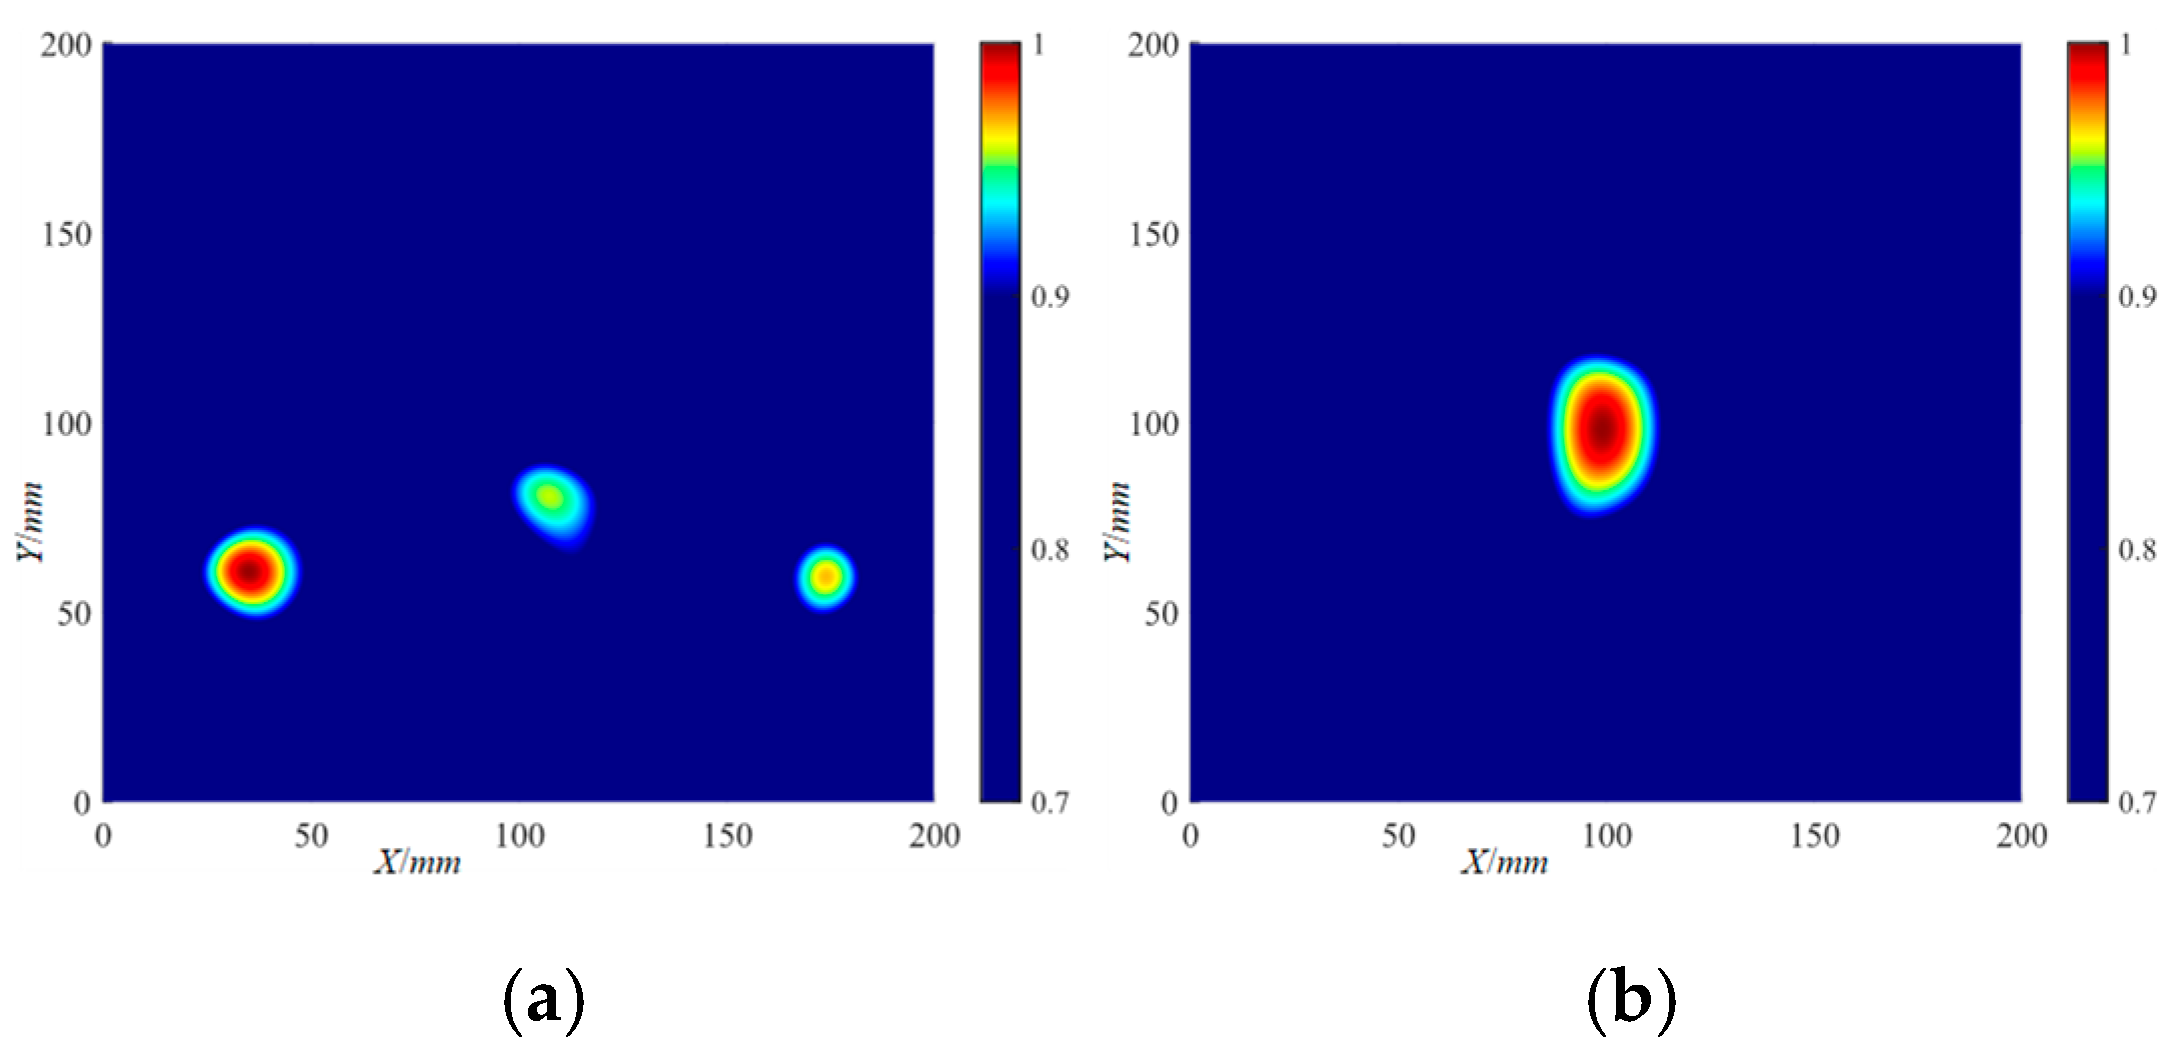
According to the CWTC obtained from the scattered wave signal of the delamination damage, the DaS algorithm was used to locate the delamination damage, and the delamination damage localization imaging results can be obtained. The localization imaging results of the Φ20 mm delamination damage by the DaS algorithm are shown in Figure 19. With a set threshold of 0.7 (the threshold below is consistent with this), the localization imaging results of the Φ20 mm delamination damage by the DaS algorithm are shown in Figure 20. The determination of the figure threshold values was based on the fact that the damage localization can be displayed clearly. The localization imaging results of the Φ40 mm delamination damage by the DaS algorithm and the localization imaging results under the set threshold are shown in Figure 21 and Figure 22, respectively. The peak amplitude of the localization imaging results was selected as the damage coordinates. The localization imaging results of the DaS algorithm for the X and Y axes are shown in Table 3, where represents the frequency-averaged localization imaging results. As can be seen from the figures, more accurate delamination damage localization results can be obtained with higher-frequency Lamb waves. The frequency-averaged localization imaging results of delamination damage were obtained by superimposing and averaging the delamination damage localization results at all frequencies. The frequency-averaged localization imaging results of Φ20 mm delamination damage by the DaS algorithm are shown in Figure 23, and the frequency-averaged localization imaging results of Φ40 mm delamination damage are shown in Figure 24. From the frequency-averaged localization imaging results, it can be seen that by superimposing and averaging the delamination damage localization results at all frequencies, the errors in the localization of delamination damage at some frequencies can be eliminated, and the reliability of delamination damage localization can be improved.
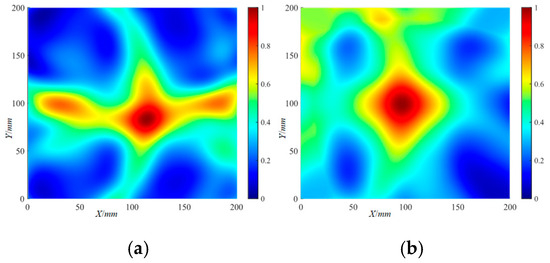
Figure 19.
The localization imaging results of the Φ20 mm delamination damage by the DaS algorithm: (a) 220 kHz; (b) 320 kHz.
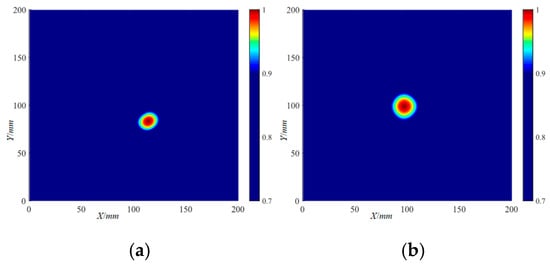
Figure 20.
The localization imaging results of the Φ20 mm delamination damage by the DaS algorithm under a threshold setting: (a) 220 kHz; (b) 320 kHz.
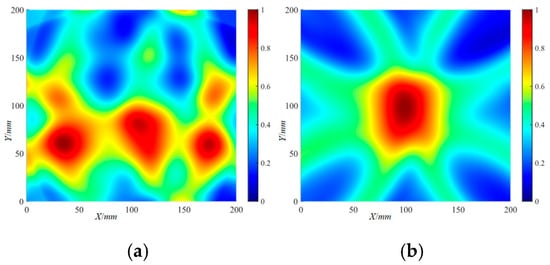
Figure 21.
The localization imaging results of the Φ40 mm delamination damage by the DaS algorithm: (a) 220 kHz; (b) 320 kHz.
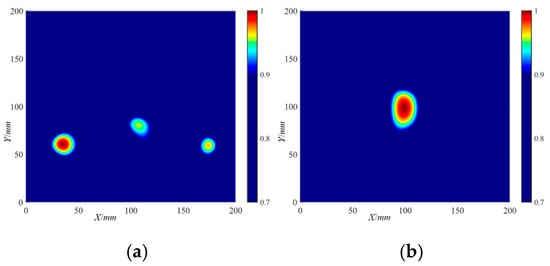
Figure 22.
The localization imaging results of the Φ40 mm delamination damage by the DaS algorithm under a threshold setting: (a) 220 kHz; (b) 320 kHz.
Table 3.
The localization imaging results of the X and Y axes by the DaS algorithm.

Figure 23.
The frequency-averaged localization imaging results of the Φ20 mm delamination damage by the DaS algorithm: (a) frequency-averaged localization imaging results; (b) frequency-averaged localization imaging results with a threshold.
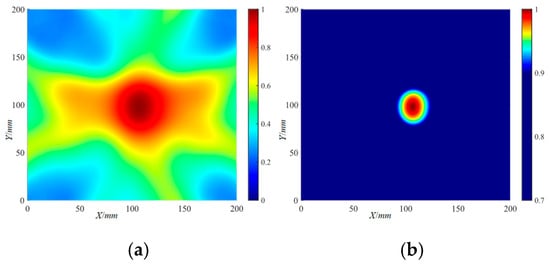
Figure 24.
The frequency-averaged localization imaging results of the Φ40 mm delamination damage by the DaS algorithm: (a) frequency-averaged localization imaging results; (b) frequency-averaged localization imaging results with a threshold.
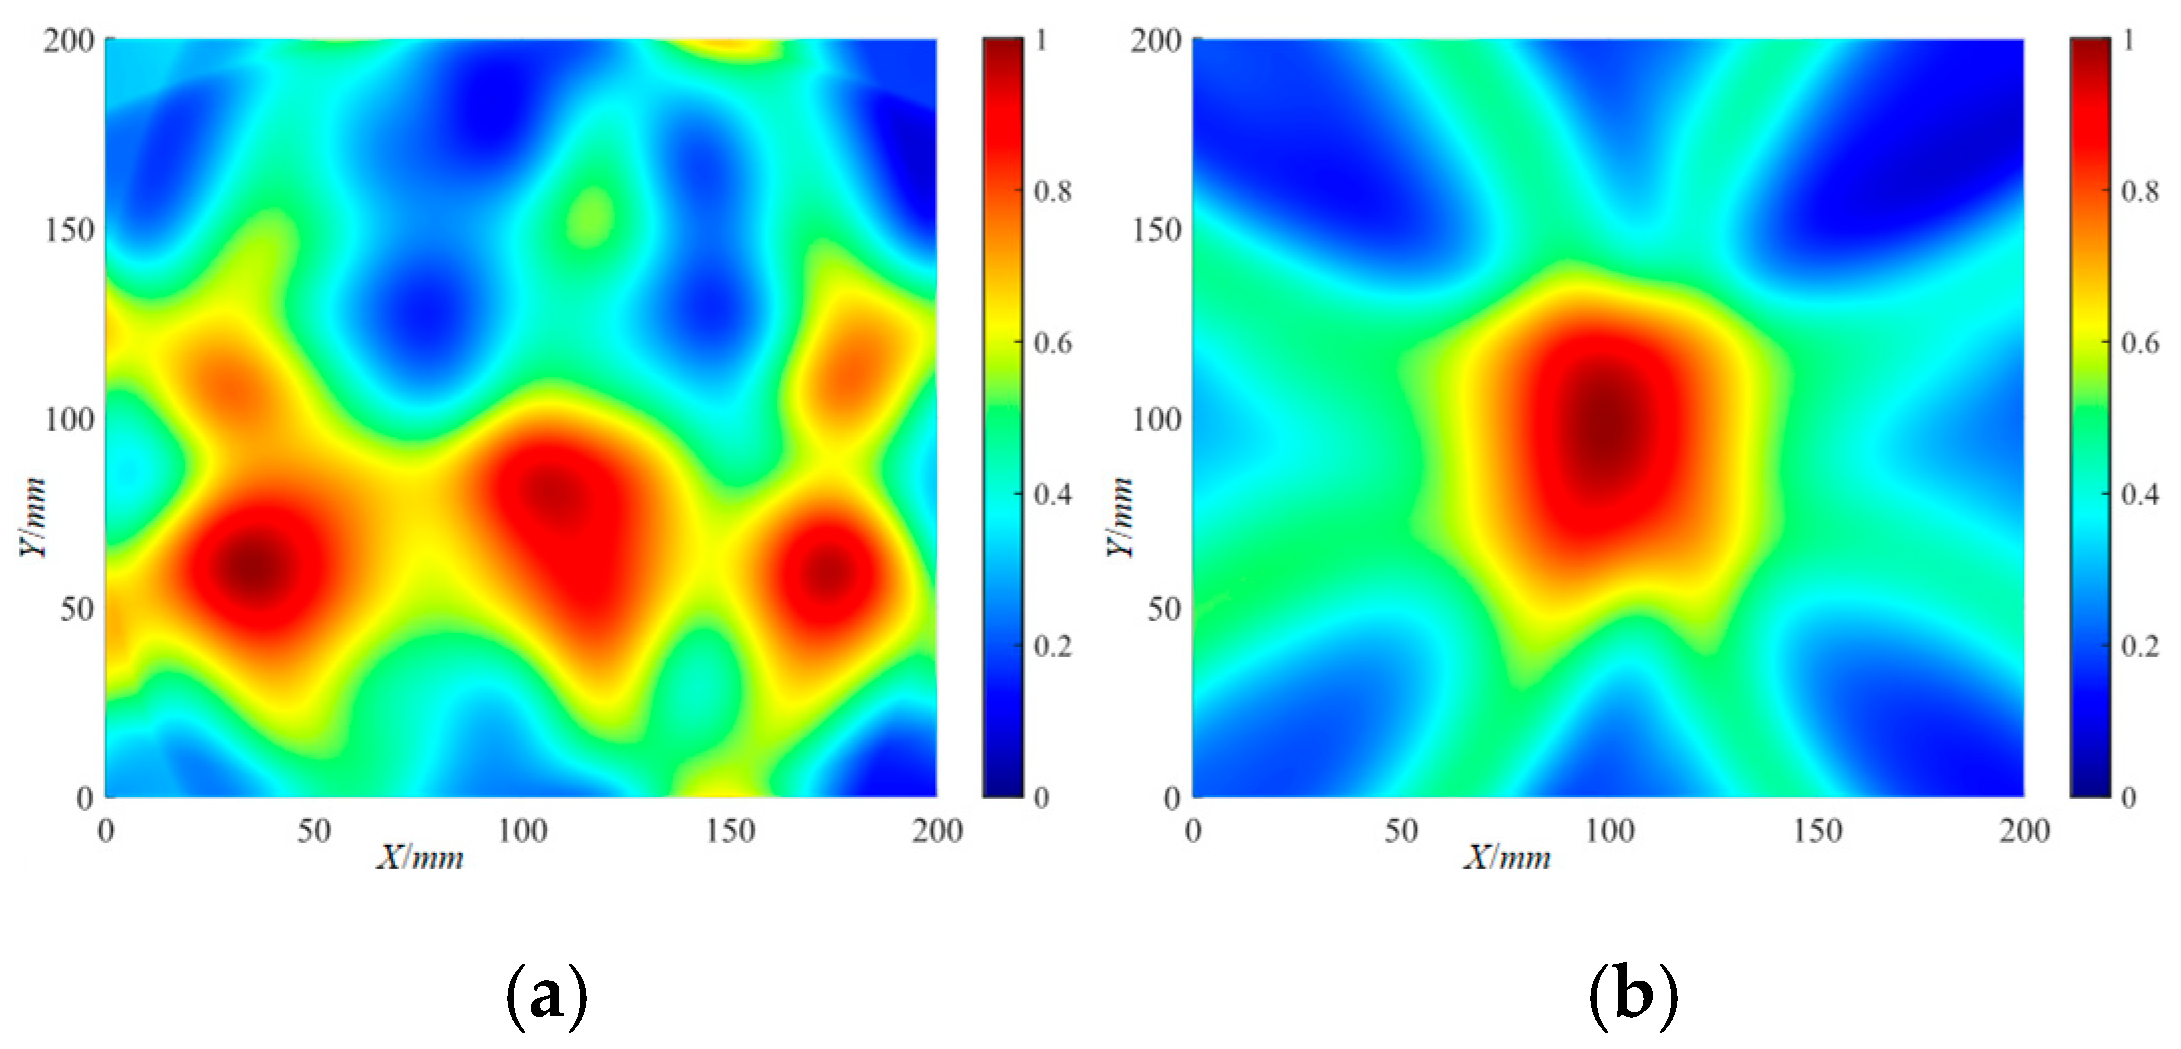
4.2. RAPID Algorithm Localization Results
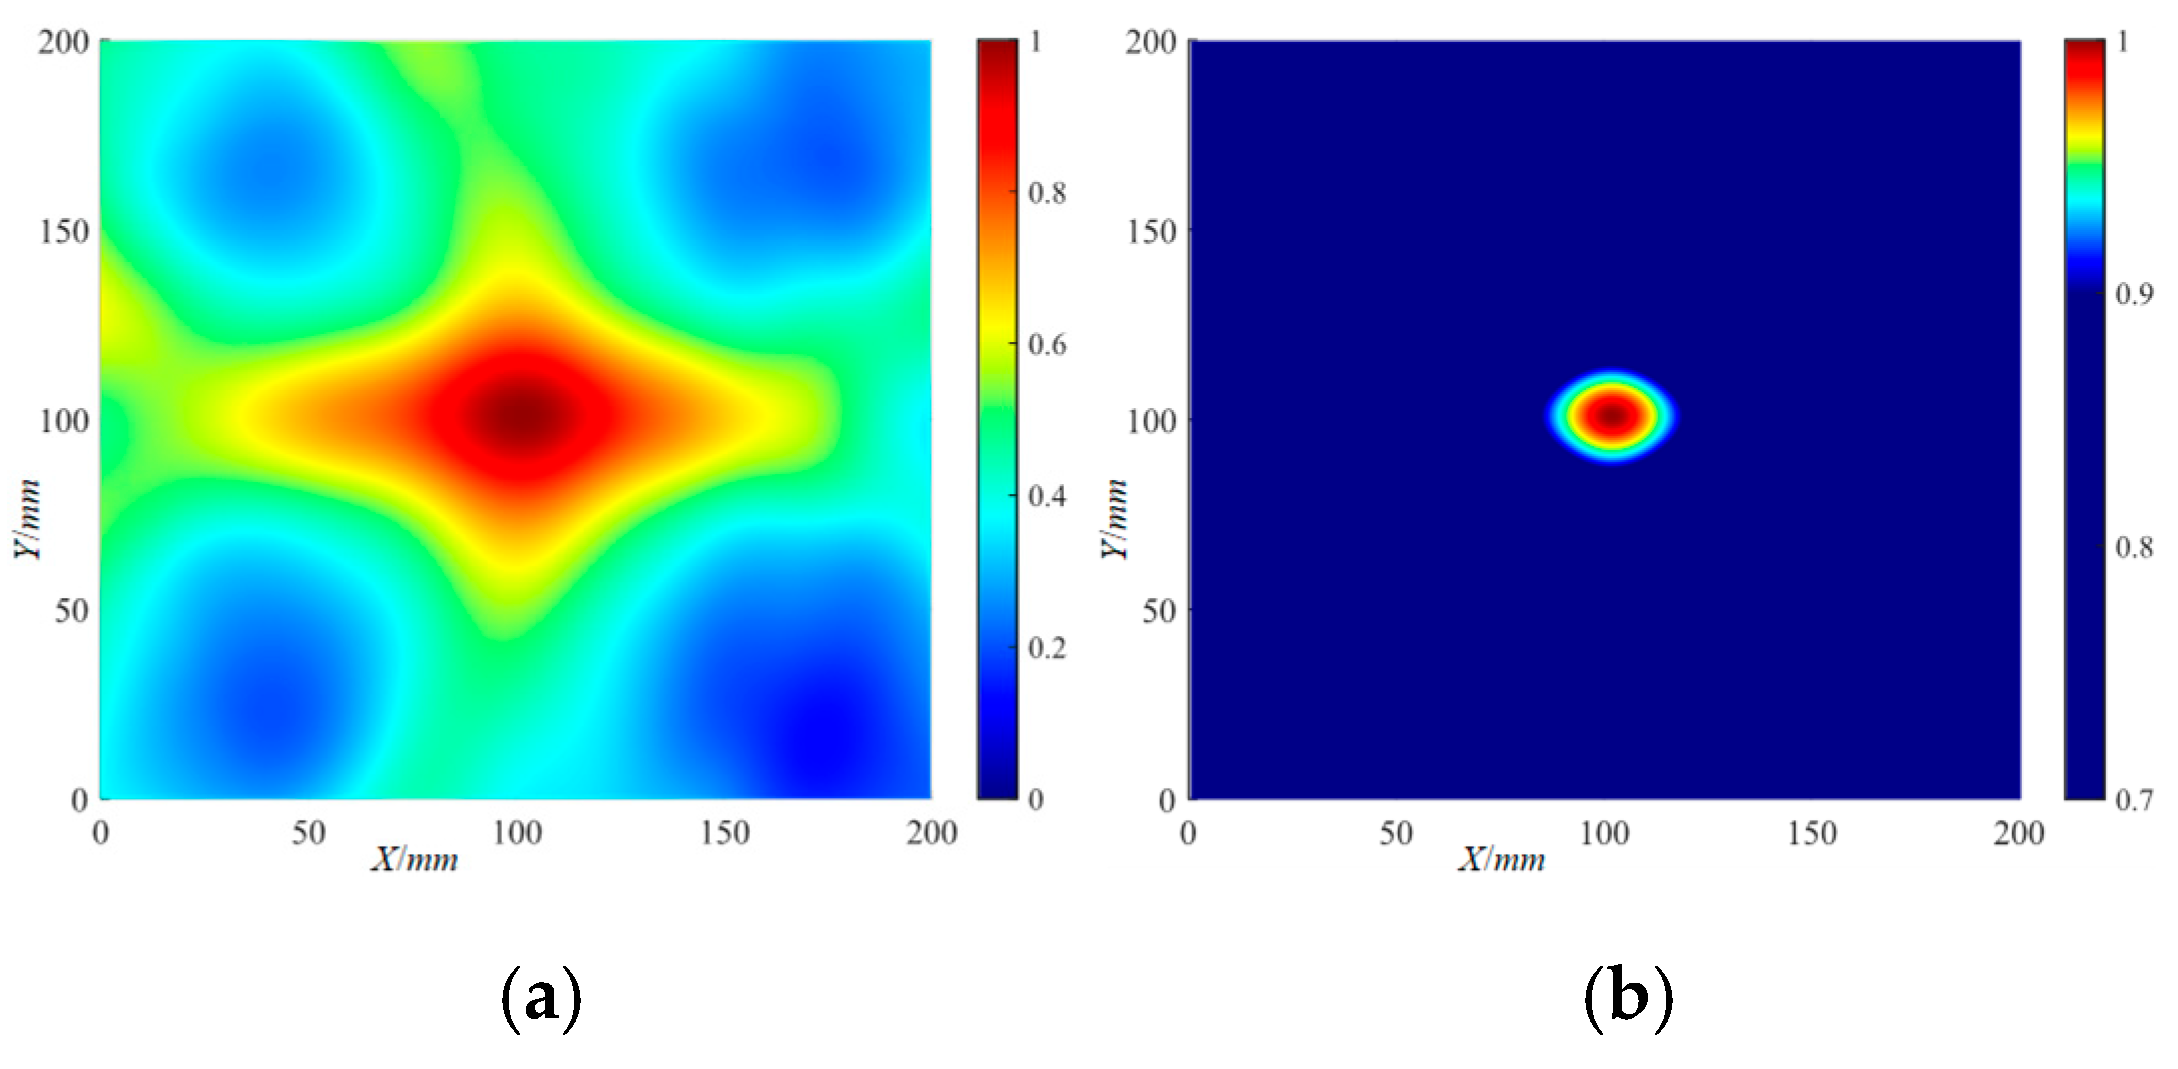
According to the obtained Lamb wave signal, the SCC of the damage signal and the baseline signal was calculated using Equation (4), and the RAPID algorithm and IRAPID algorithm were used to locate the delamination damage, respectively. The localization imaging results of the Φ20 mm delamination damage by the RAPID algorithm are shown in Figure 25. With a set threshold, the localization imaging results of the Φ20 mm delamination damage by the RAPID algorithm are shown in Figure 26. The localization imaging results of the Φ40 mm delamination damage by the RAPID algorithm and the localization imaging results under the set threshold are shown in Figure 27 and Figure 28, respectively. The localization imaging results of the RAPID algorithm for the X and Y axes are shown in Table 4.

Figure 25.
The localization imaging results of the Φ20 mm delamination damage by the RAPID algorithm: (a) 220 kHz; (b) 320 kHz.
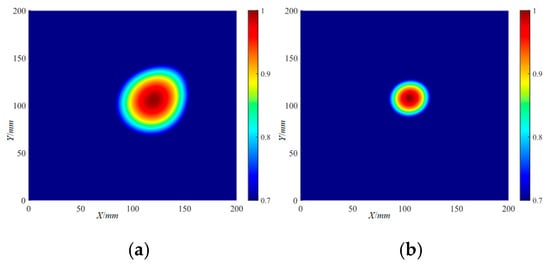
Figure 26.
The localization imaging results of the Φ20 mm delamination damage by the RAPID algorithm under a threshold setting: (a) 220 kHz; (b) 320 kHz.

Figure 27.
The localization imaging results of the Φ40 mm delamination damage by the RAPID algorithm: (a) 220 kHz; (b) 320 kHz.
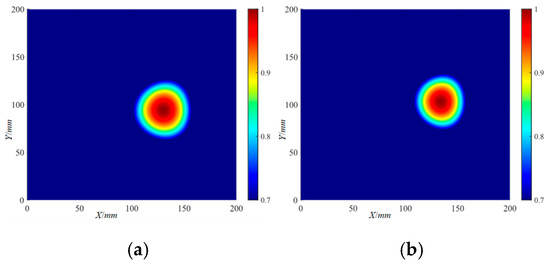
Figure 28.
The localization imaging results of the Φ40 mm delamination damage by the RAPID algorithm under a threshold setting: (a) 220 kHz; (b) 320 kHz.
Table 4.
The localization imaging results of the X and Y axes by the RAPID algorithm.
It can be seen from the figure that the use of higher-frequency Lamb waves for detection can obtain more accurate delamination damage localization results. The localization imaging results of the Φ20 mm delamination damage by the RAPID algorithm are superior to those of the Φ40 mm delamination damage by the same algorithm.
The delamination damage localization results at all frequencies were superimposed and averaged to obtain the frequency-averaged localization imaging results of delamination damage. The frequency-averaged localization imaging results of Φ20 mm and Φ40 mm delamination damage by the RAPID algorithm are shown in Figure 29 and Figure 30, respectively. It can be seen from the frequency-averaged localization imaging results that the superimposing and averaging of the localization results at all frequencies do not significantly improve the accuracy of delamination damage localization.

Figure 29.
The frequency-averaged localization imaging results of the Φ20 mm delamination damage by the RAPID algorithm: (a) frequency-averaged localization imaging results; (b) frequency-averaged localization imaging results with a threshold.

Figure 30.
The frequency-averaged localization imaging results of the Φ40 mm delamination damage by the RAPID algorithm: (a) frequency-averaged localization imaging results; (b) frequency-averaged localization imaging results with a threshold.
4.3. IRAPID Algorithm Localization Results
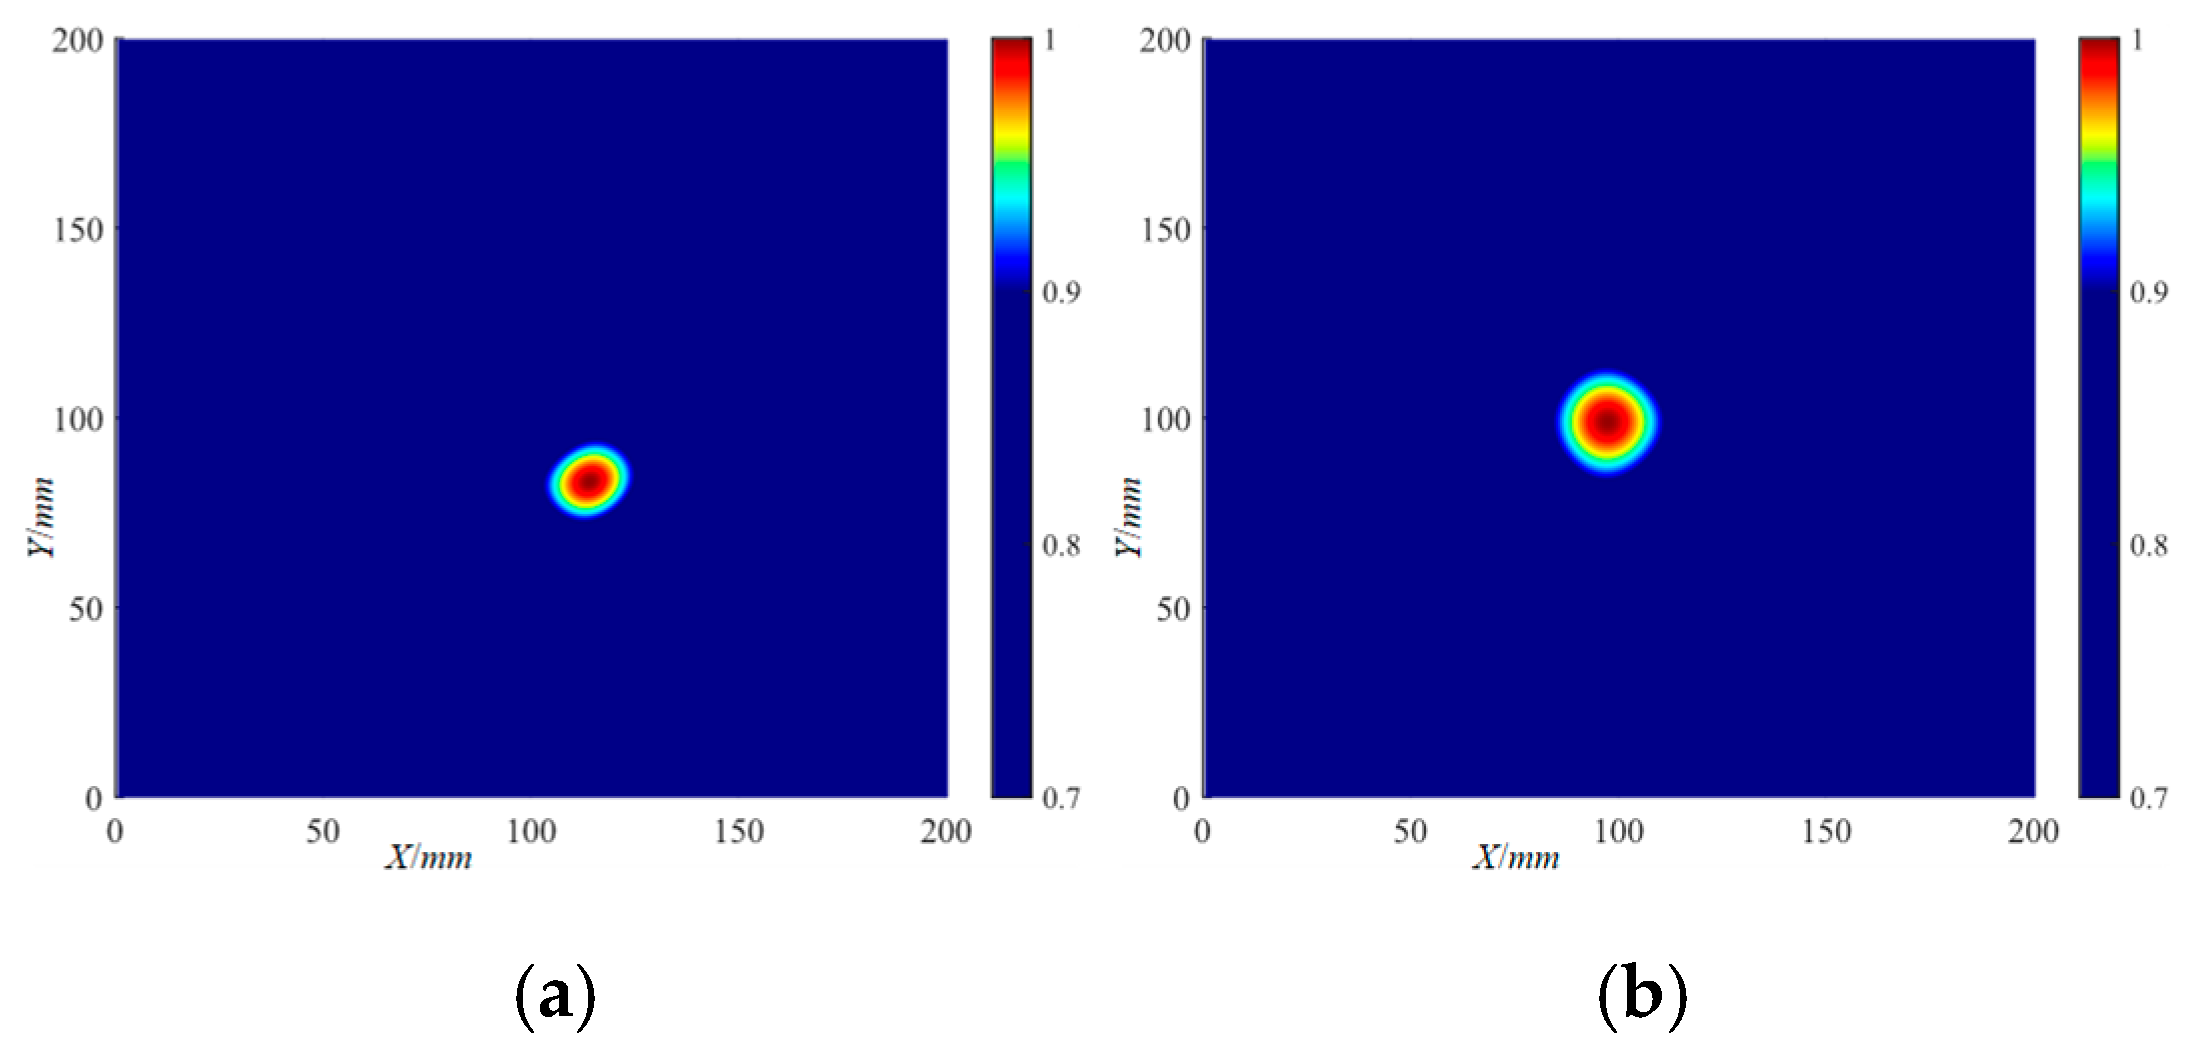
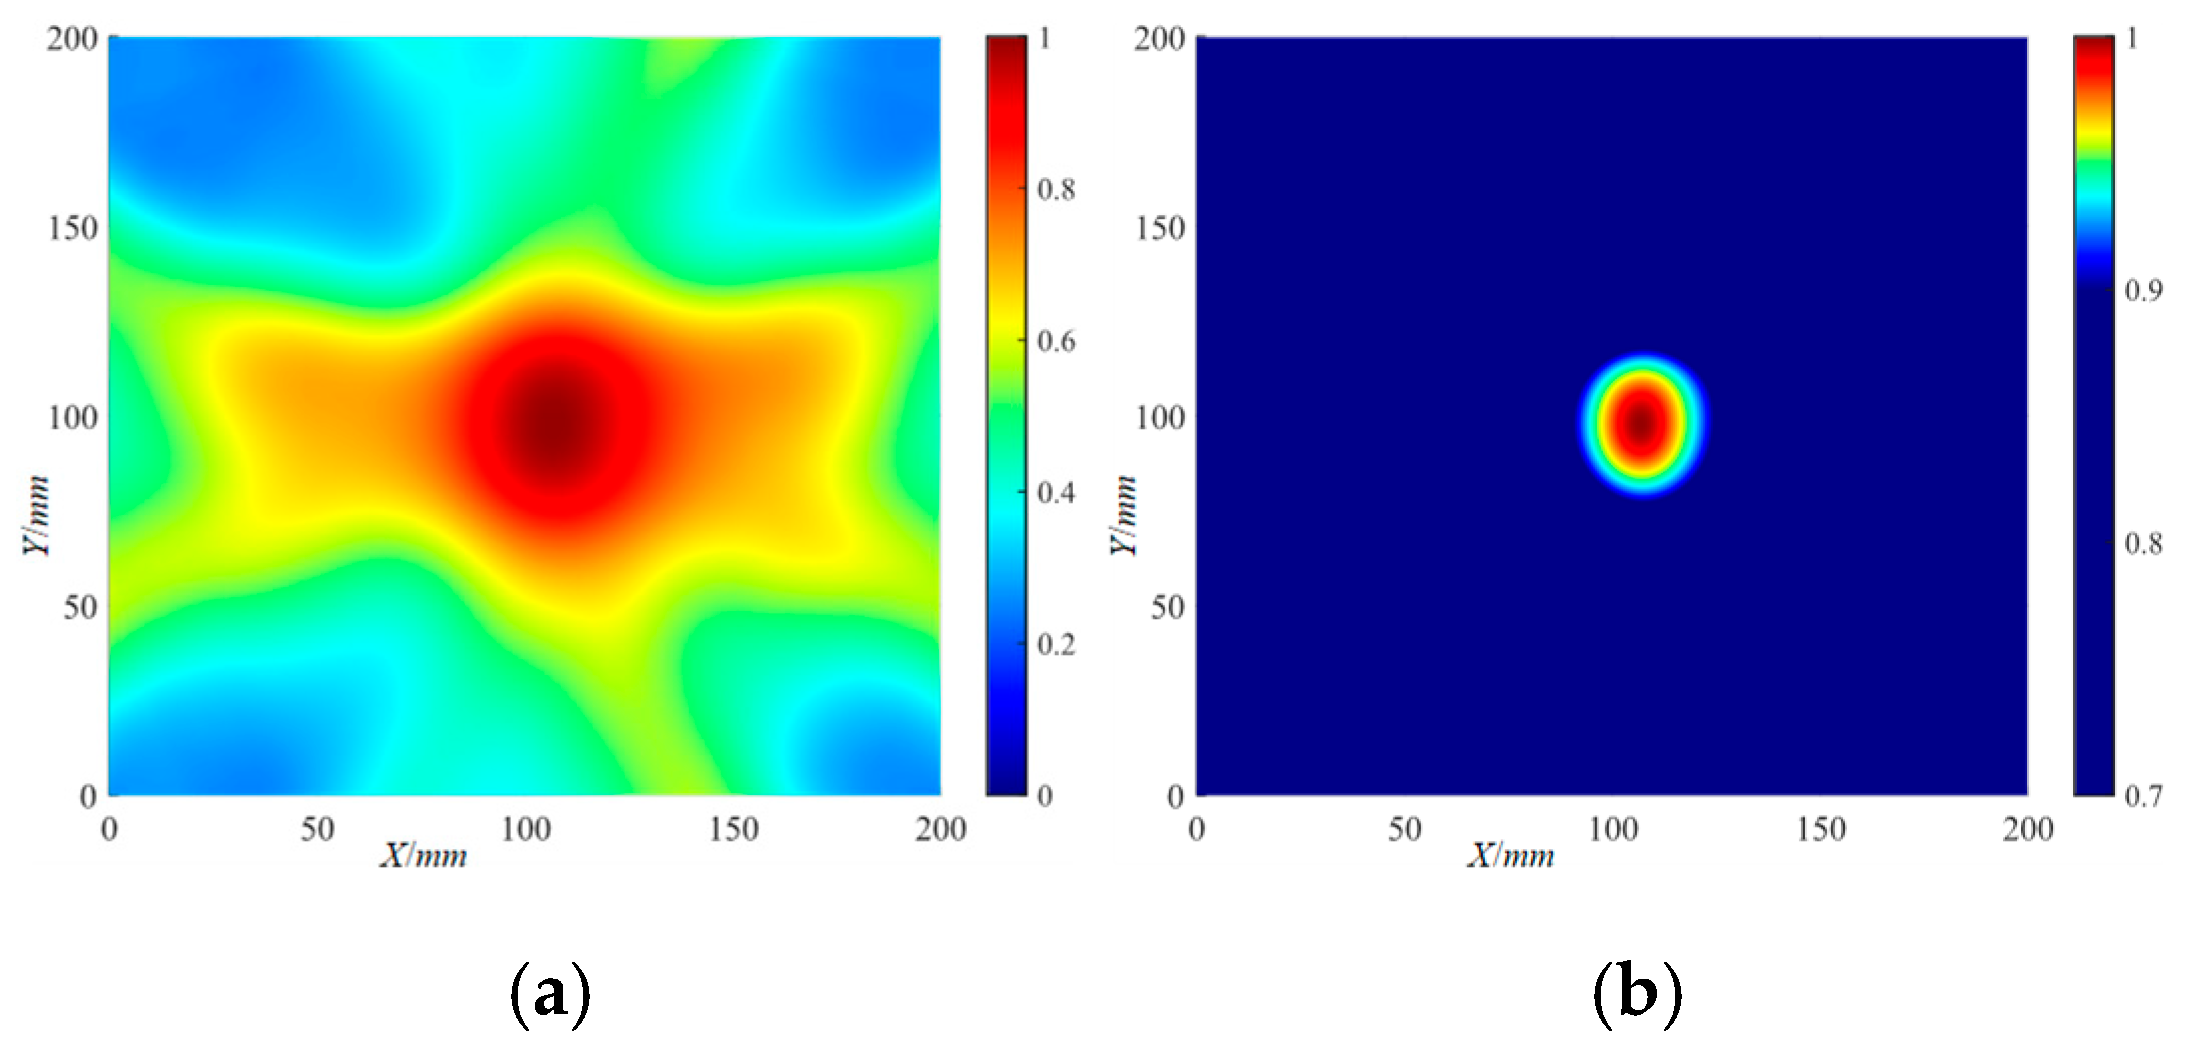
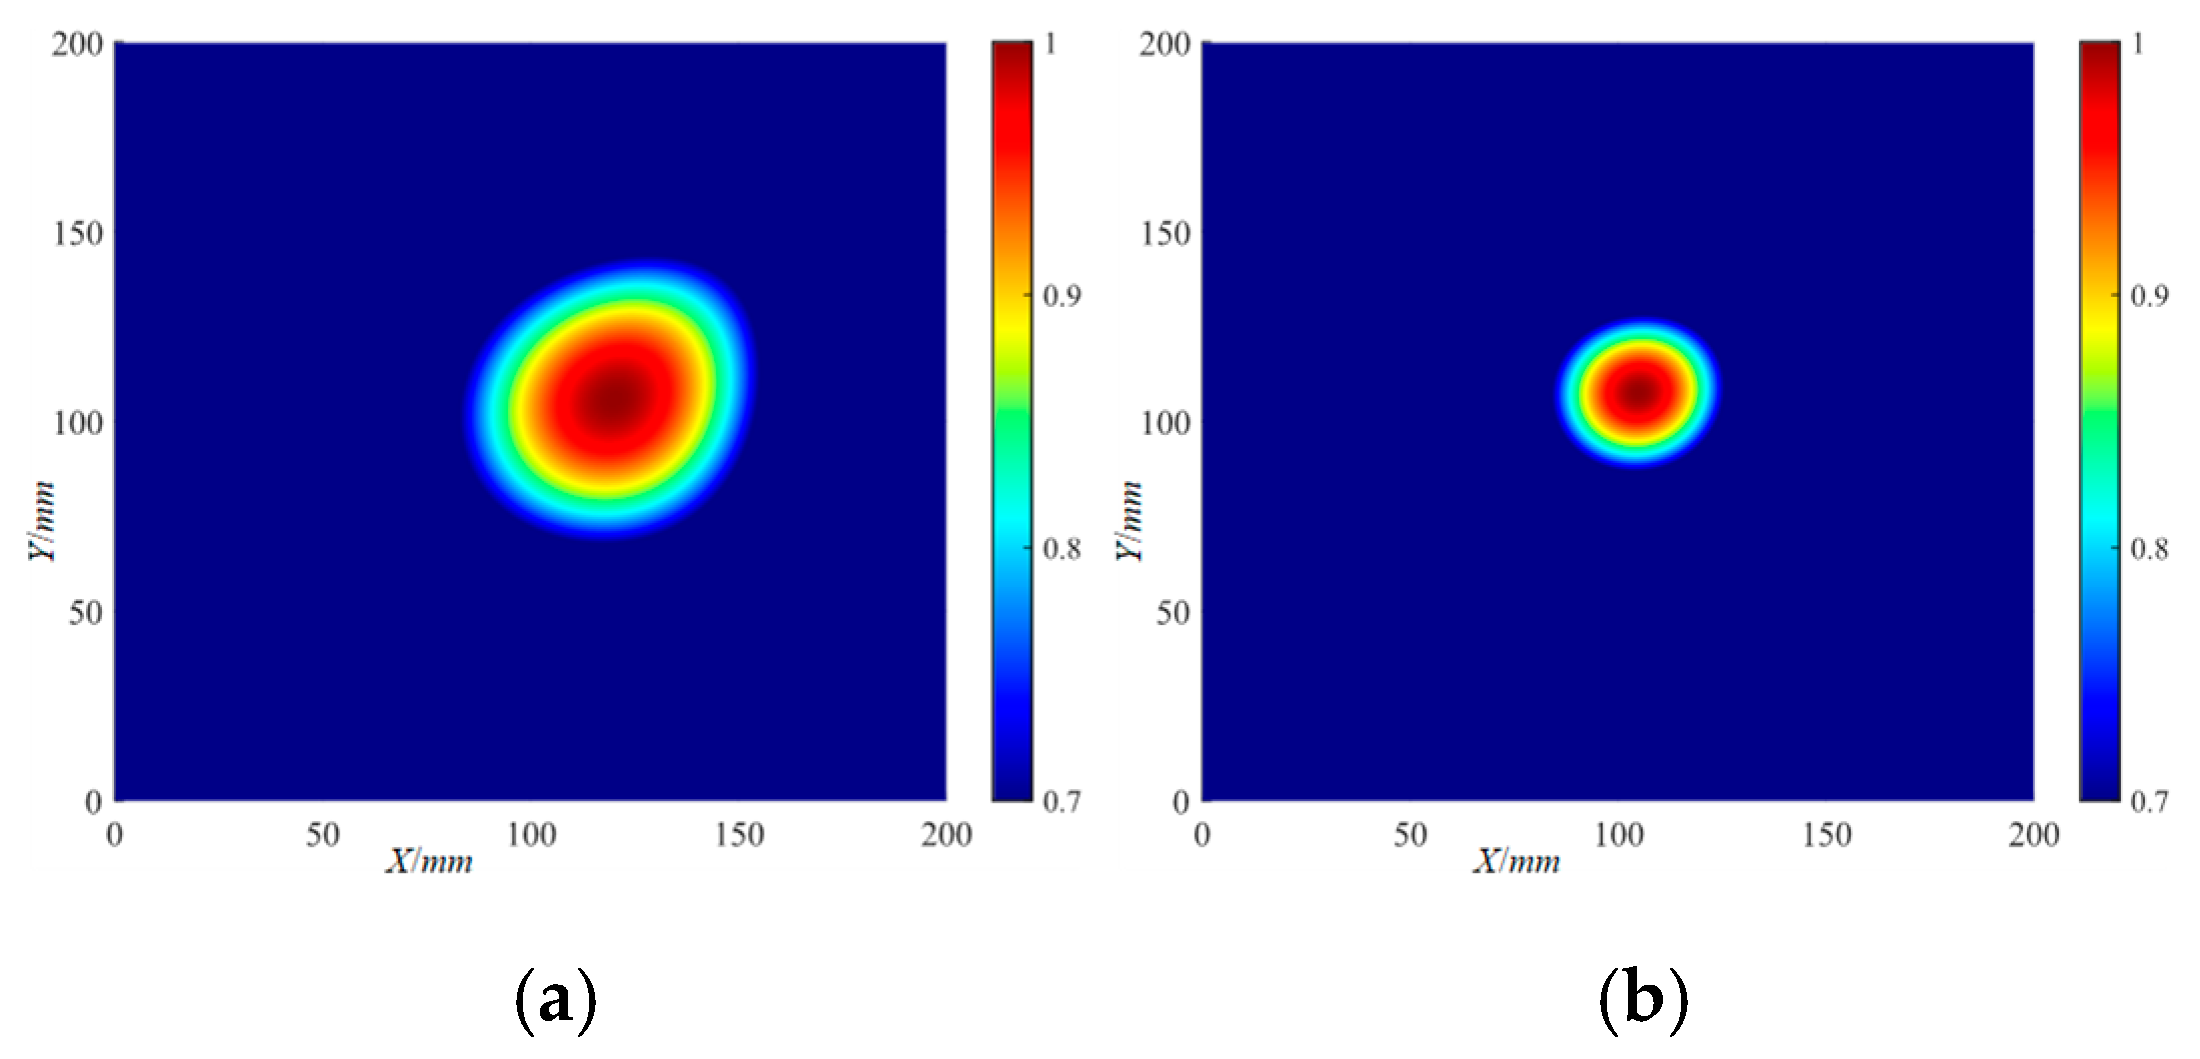
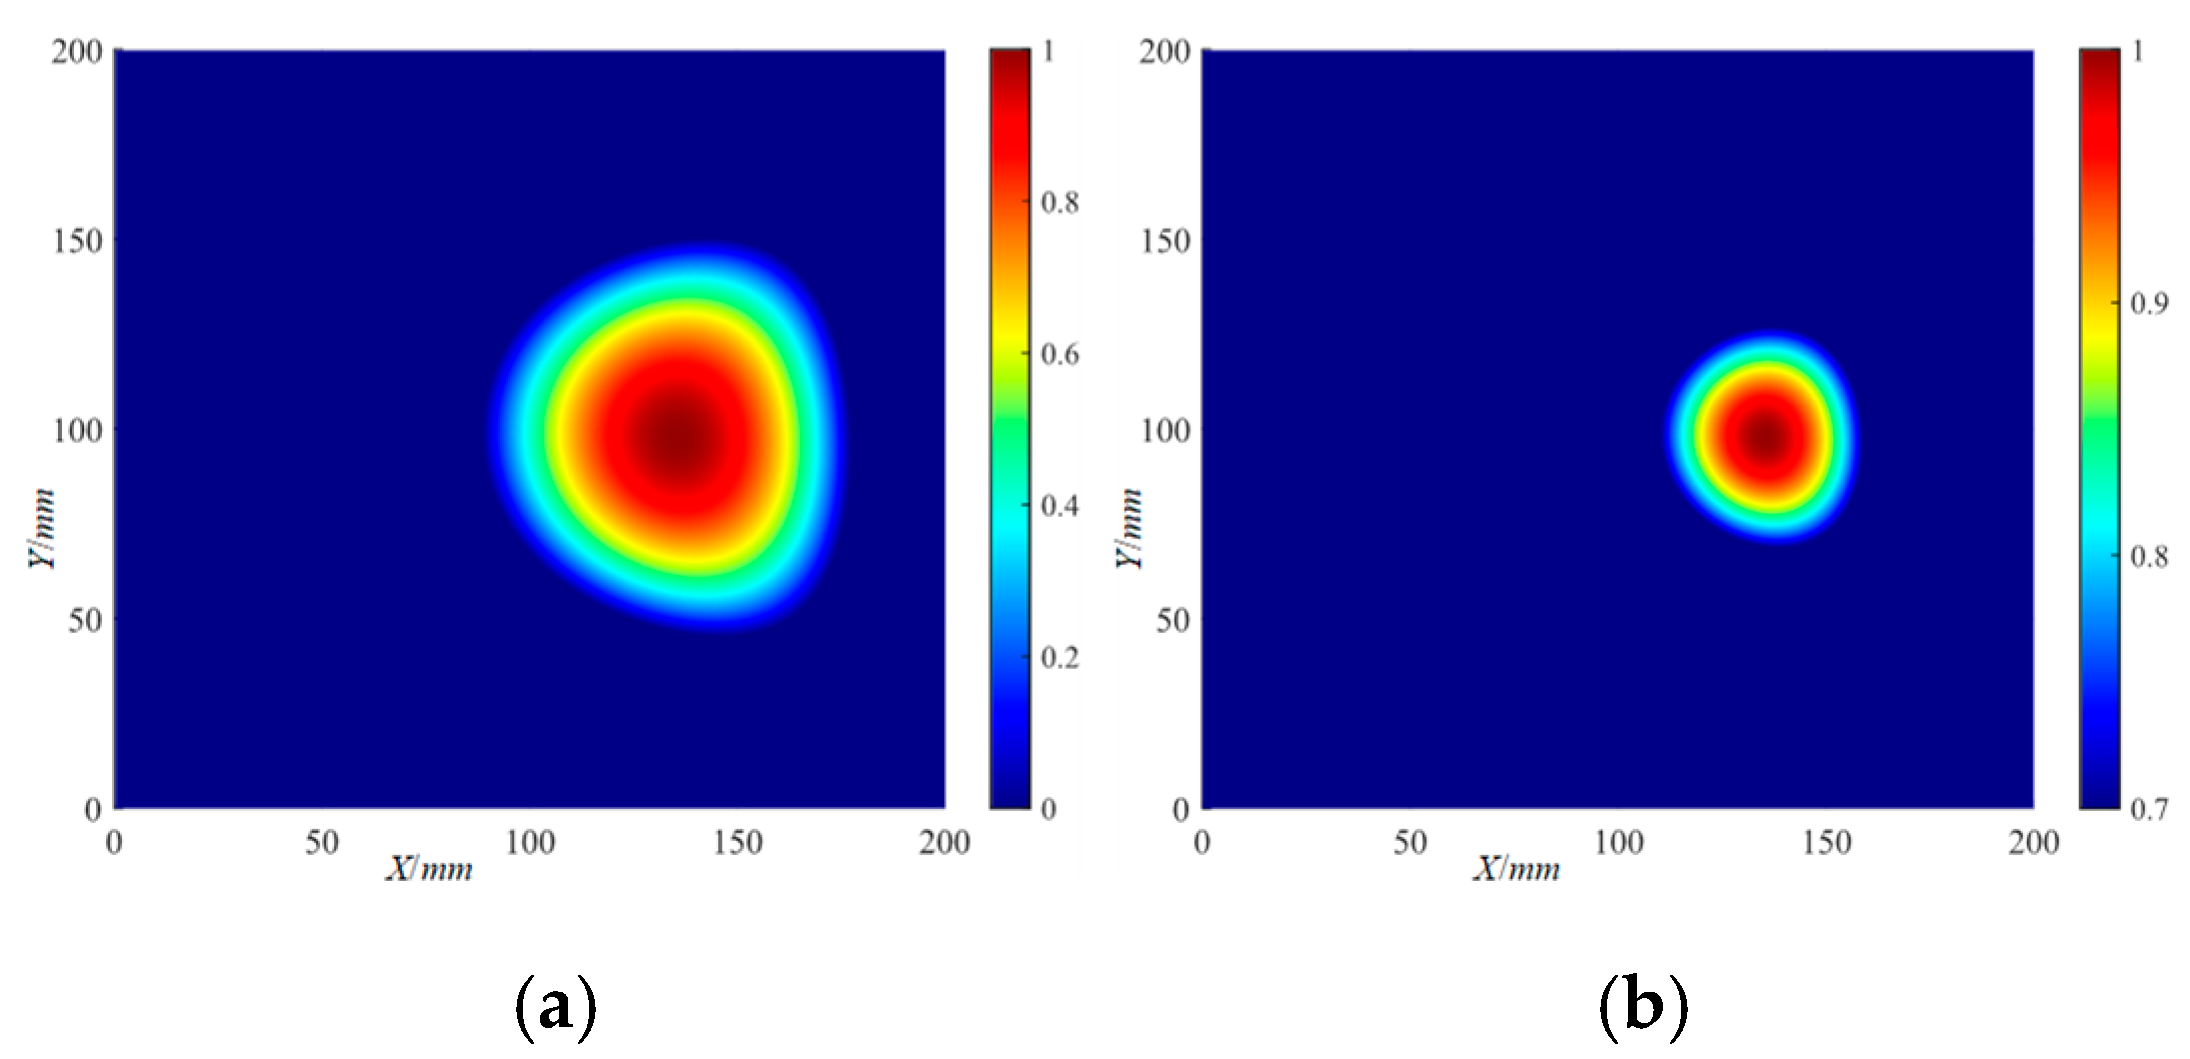
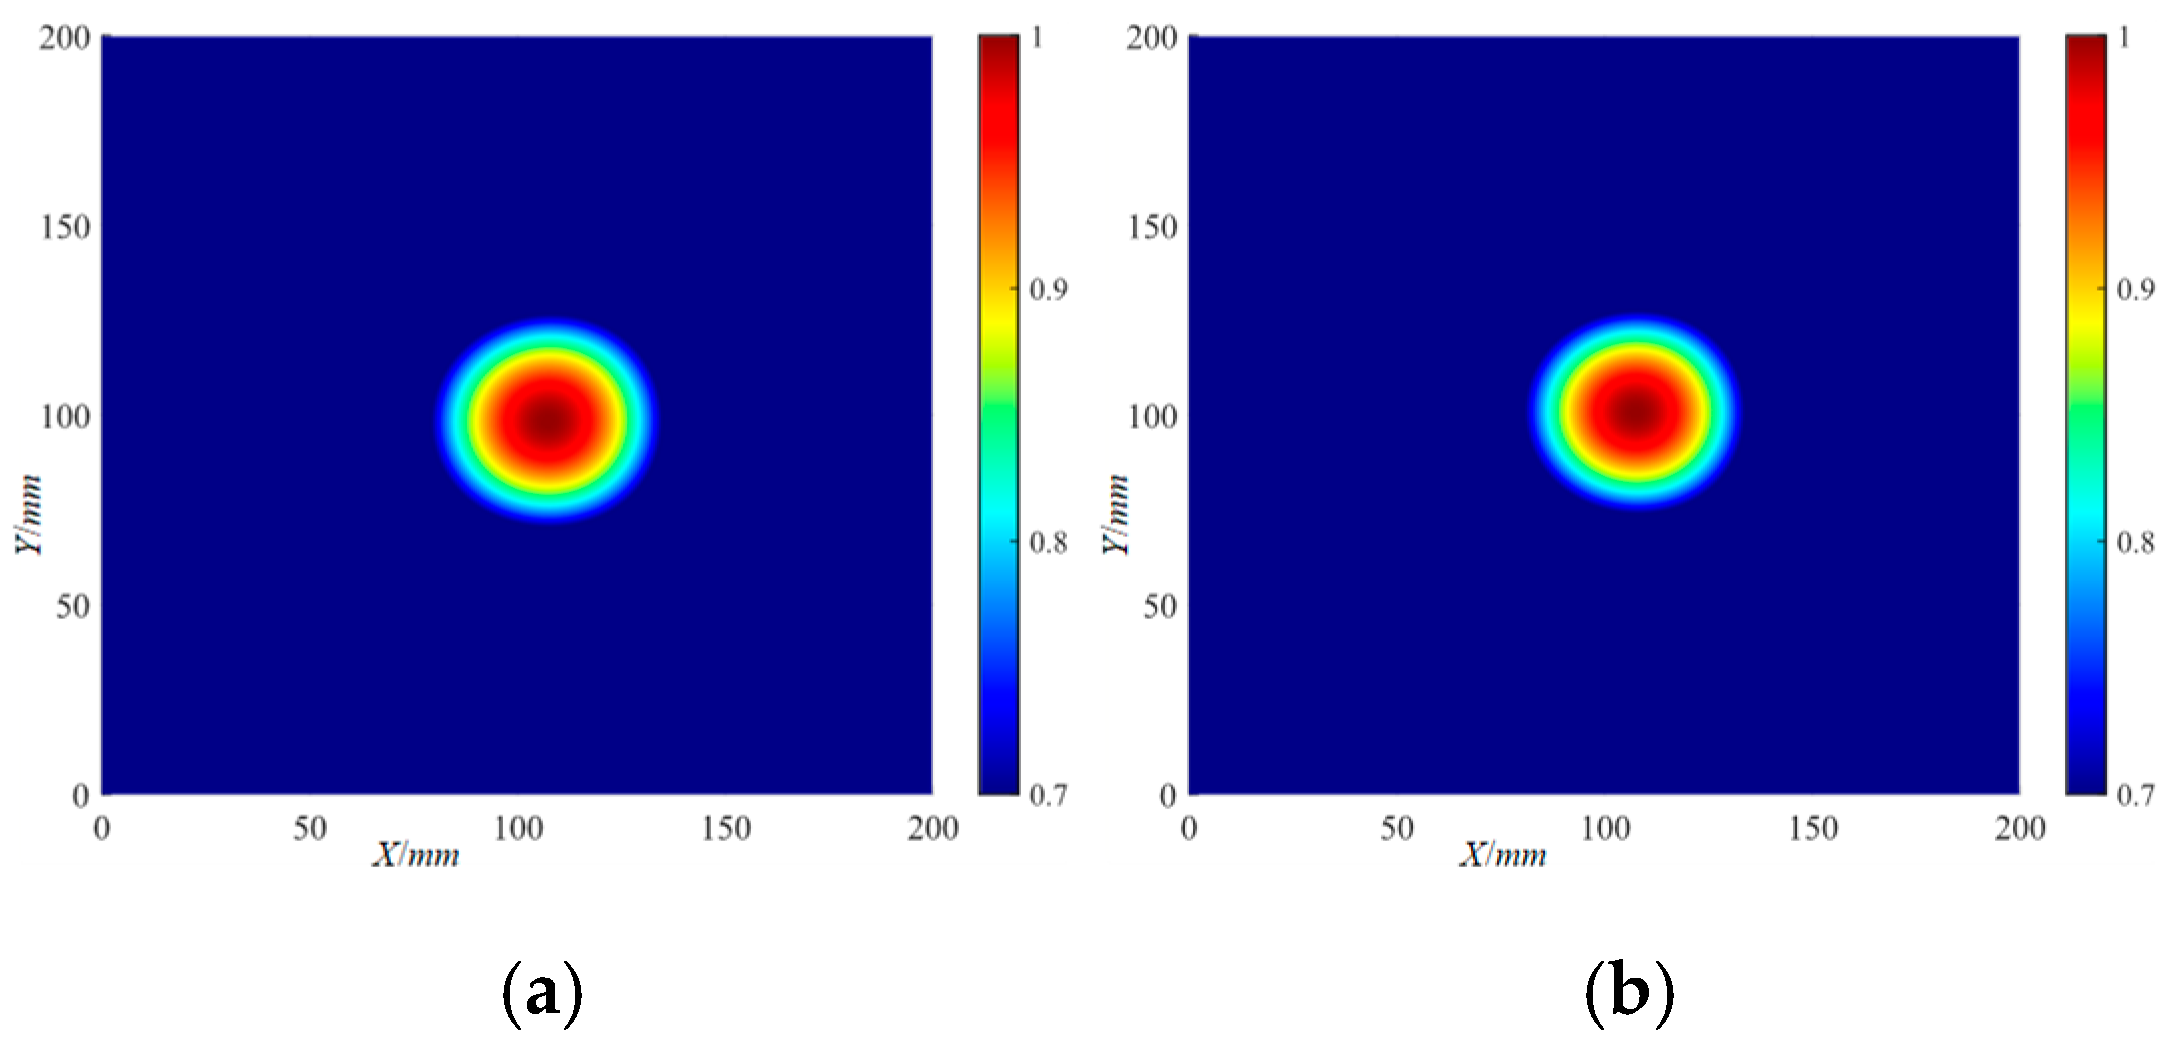
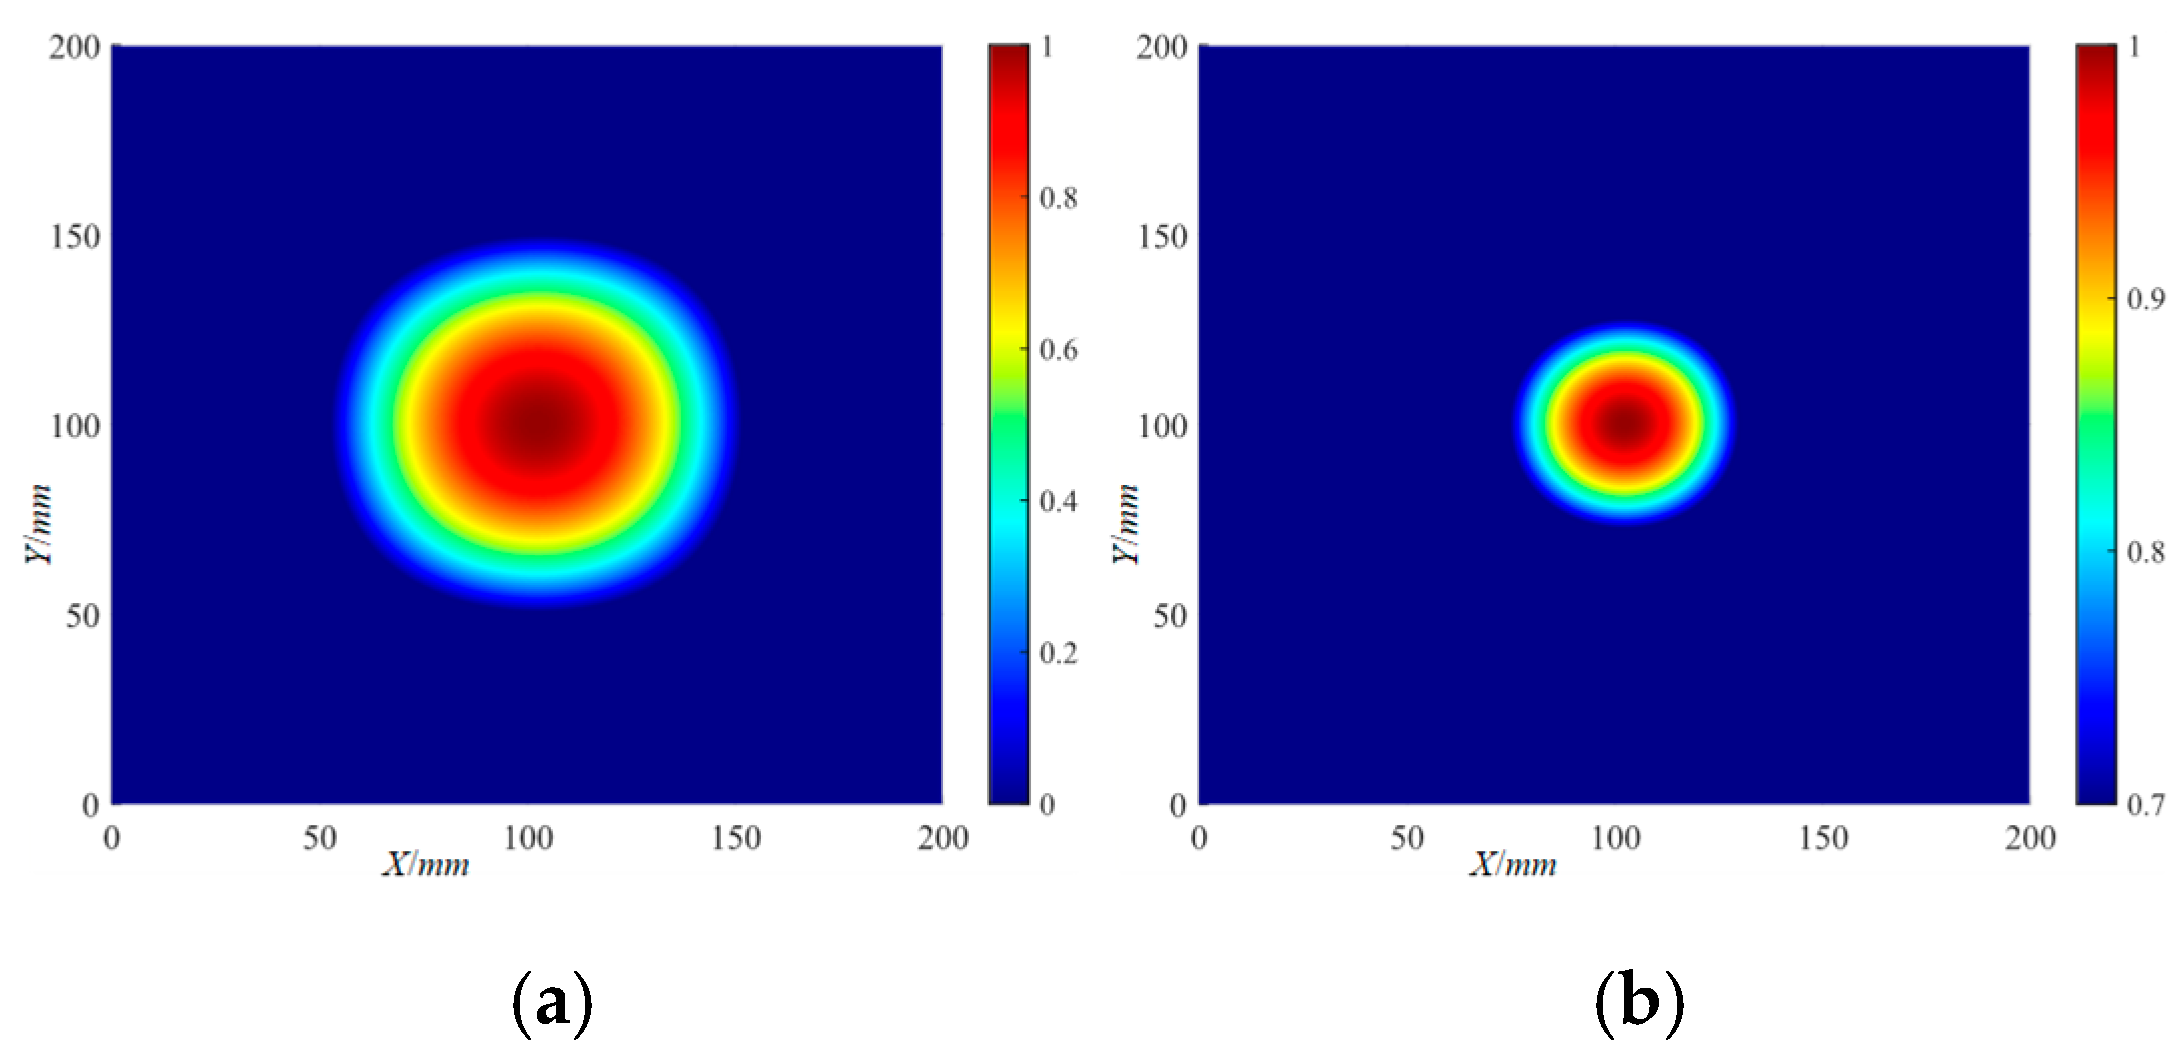
The localization imaging results of the Φ20 mm delamination damage by the IRAPID algorithm are shown in Figure 31. With a set threshold, the localization imaging results of the Φ20 mm delamination damage by the IRAPID algorithm are shown in Figure 32. The localization imaging results of the Φ40 mm delamination damage by the IRAPID algorithm and the localization imaging results under the set threshold are shown in Figure 33 and Figure 34, respectively. The localization imaging results of the IRAPID algorithm for the X and Y axes are shown in Table 5.

Figure 31.
The localization imaging results of the Φ20 mm delamination damage by the IRAPID algorithm: (a) 220 kHz; (b) 320 kHz.
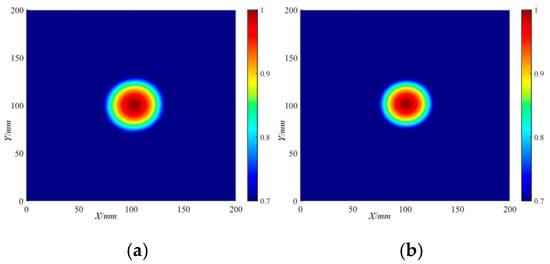
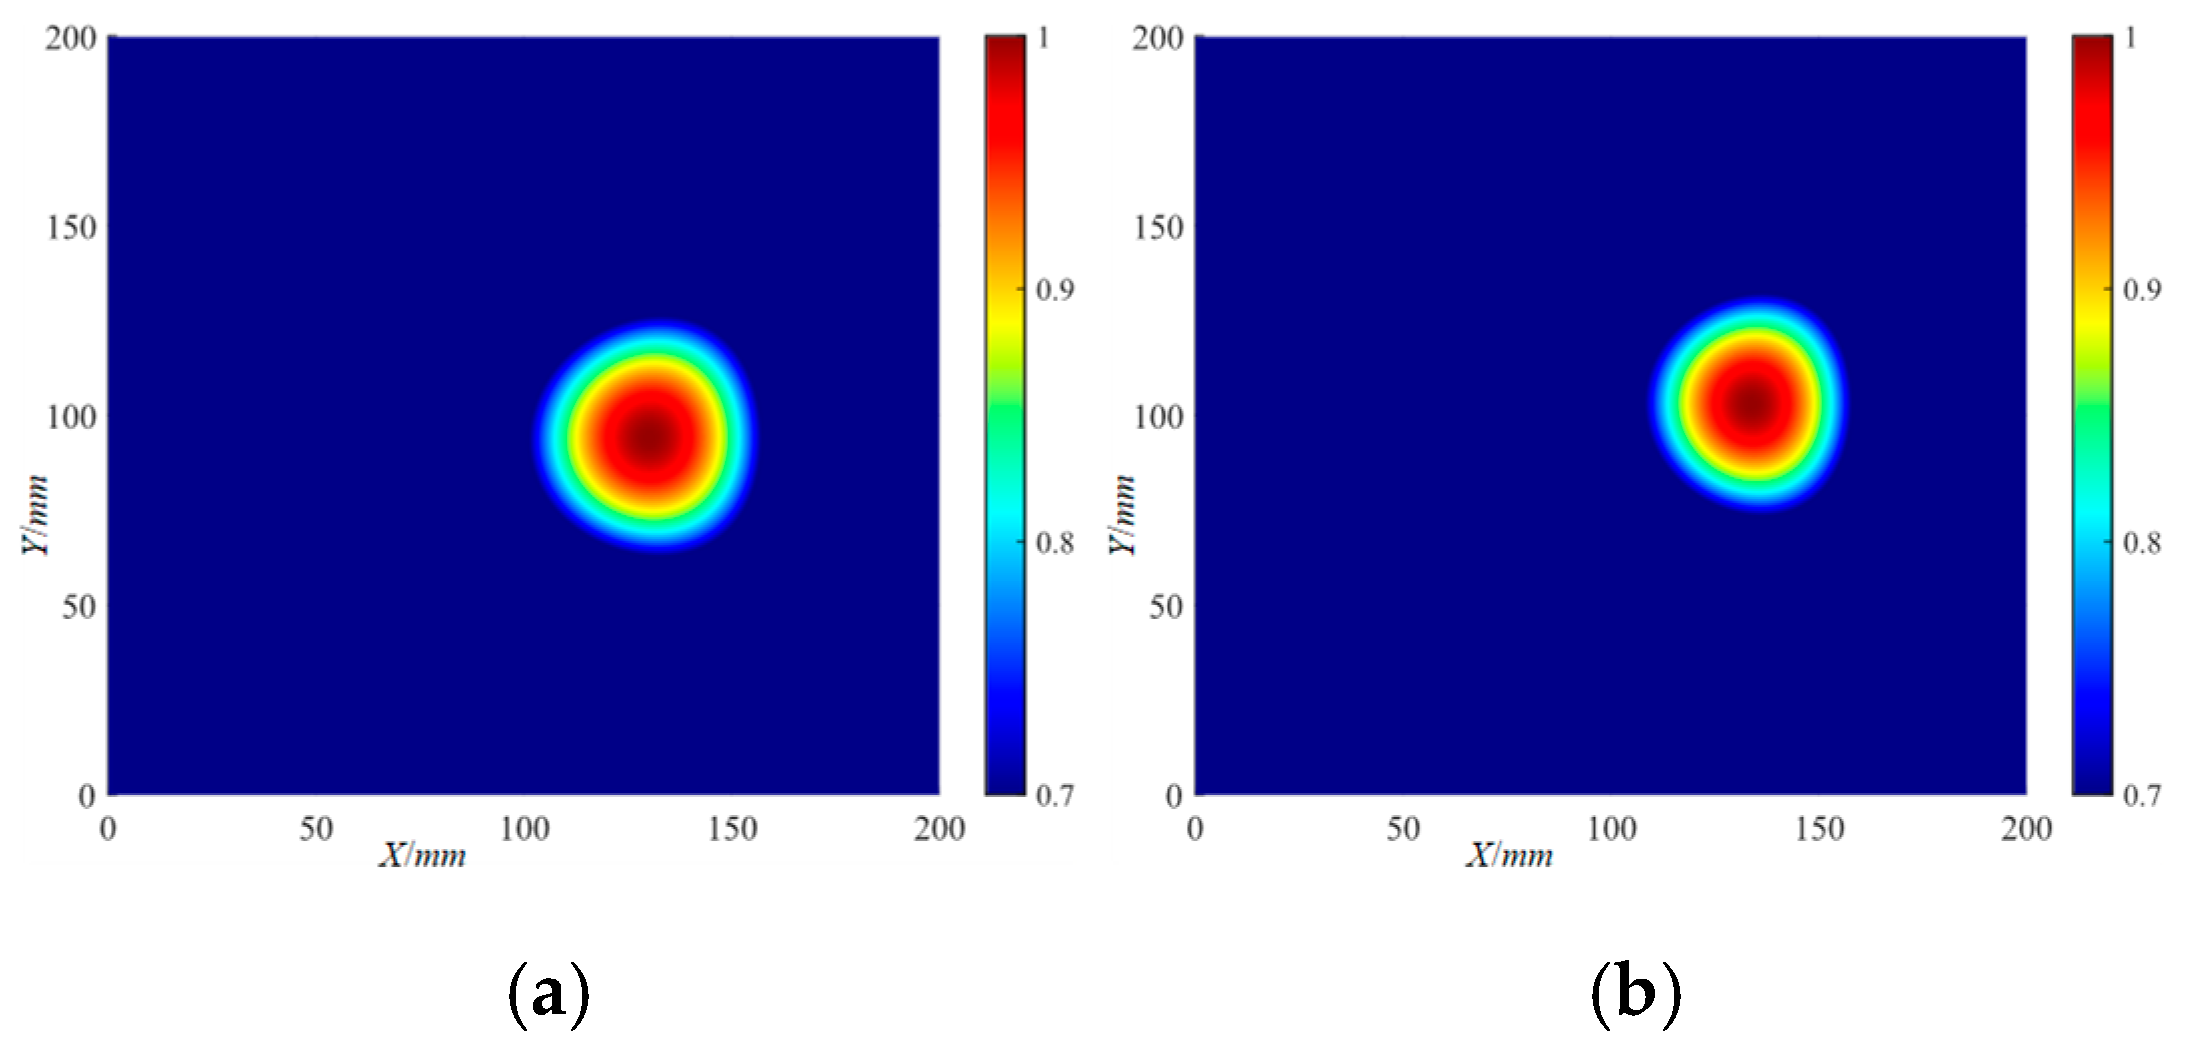
Figure 32.
The localization imaging results of the Φ20 mm delamination damage by the IRAPID algorithm under a threshold setting: (a) 220 kHz; (b) 320 kHz.
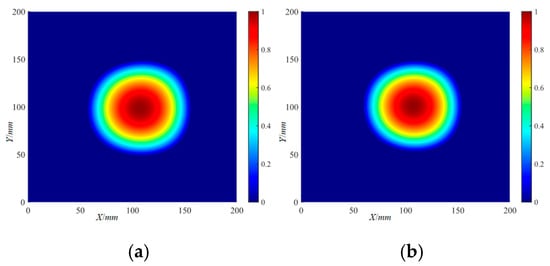
Figure 33.
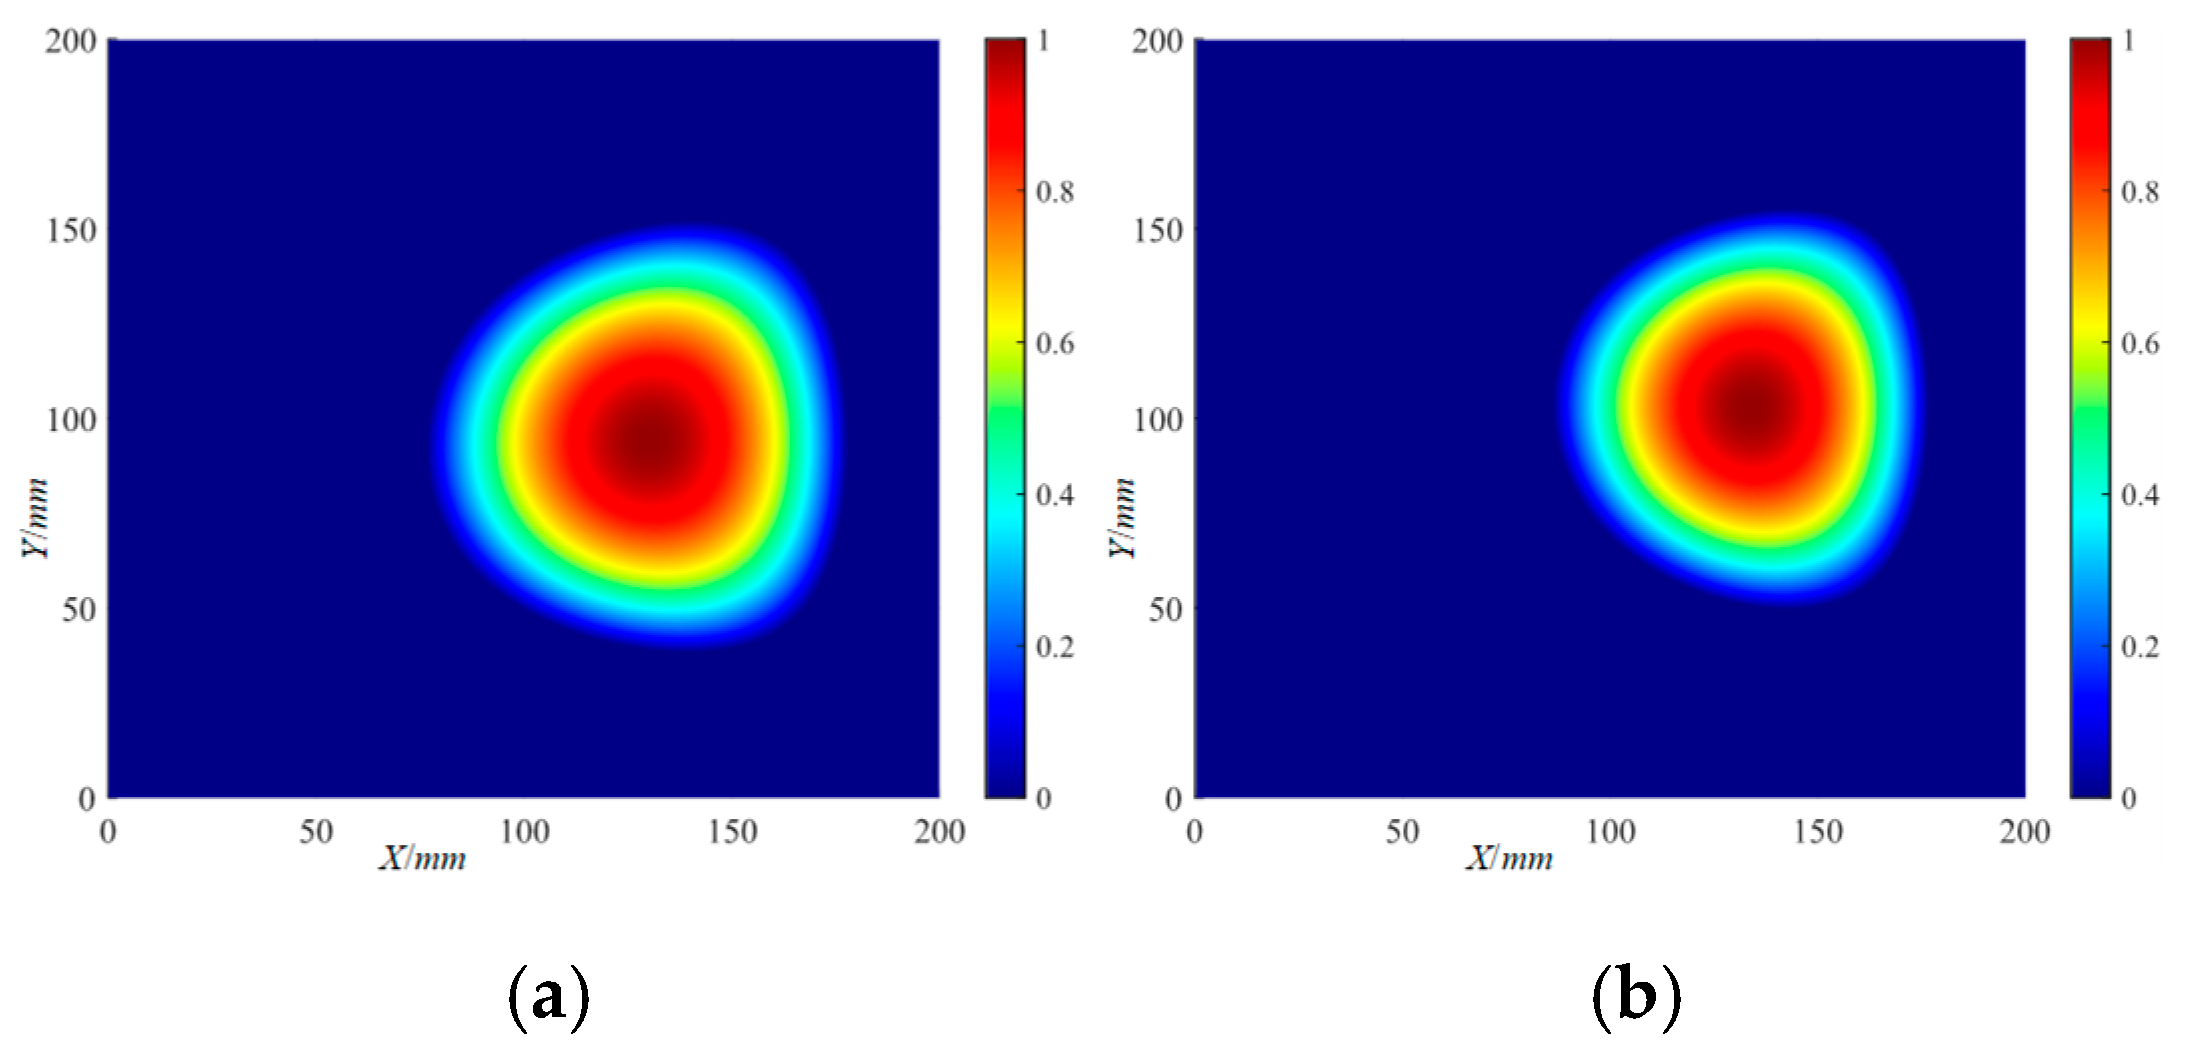
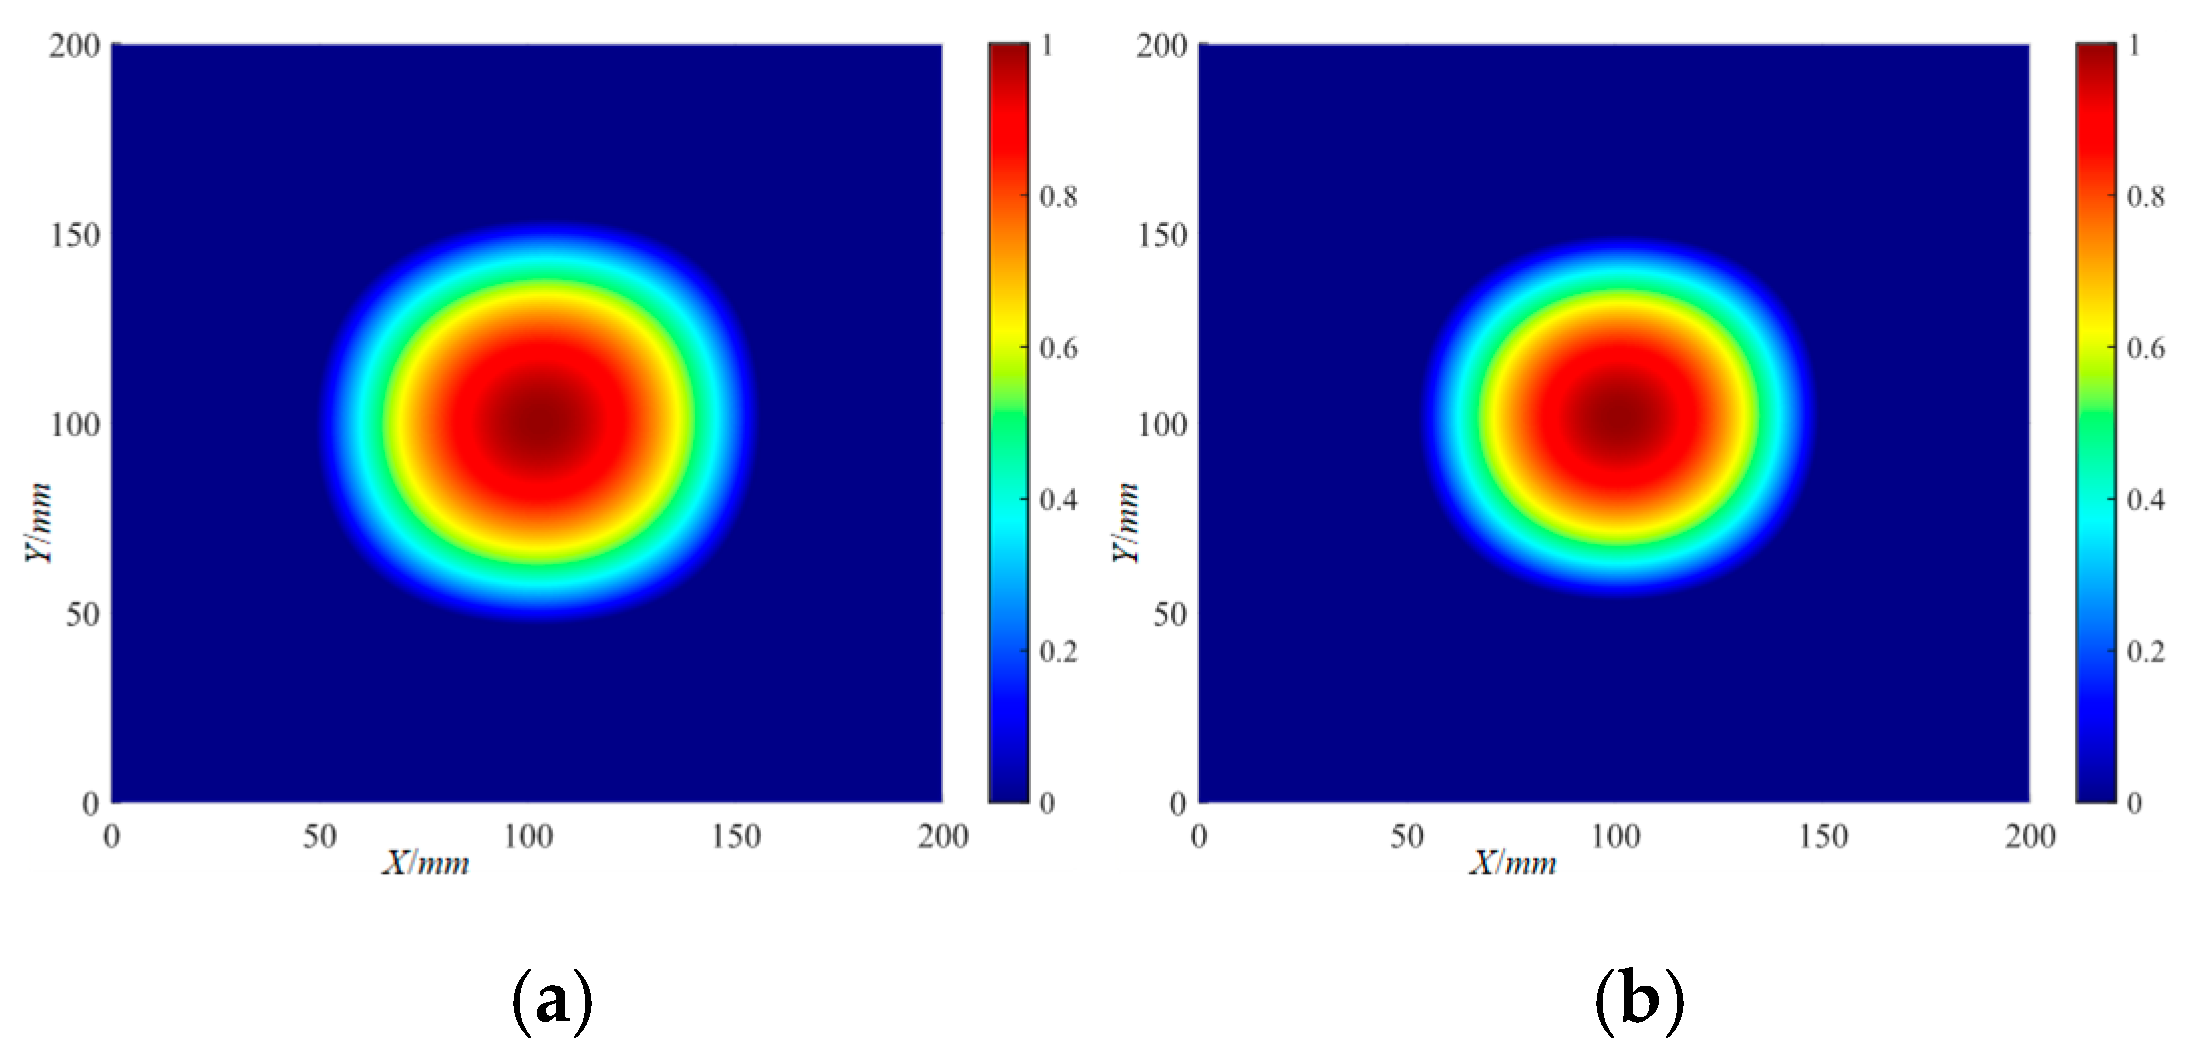
The localization imaging results of the Φ40 mm delamination damage by the IRAPID algorithm: (a) 220 kHz; (b) 320 kHz.
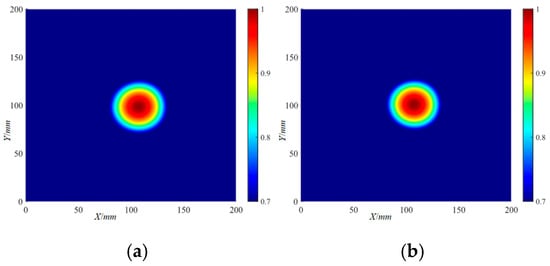
Figure 34.
The localization imaging results of the Φ40 mm delamination damage by the IRAPID algorithm under a threshold setting: (a) 220 kHz; (b) 320 kHz.
Table 5.
The localization imaging results of the X and Y axes by the IRAPID algorithm.
It is evident from the localization imaging results that there is a weak correlation between the delamination damage localization results and frequency. The localization imaging results of the Φ20 mm delamination damage by the IRAPID algorithm are more accurate than that of the Φ40 mm delamination damage.
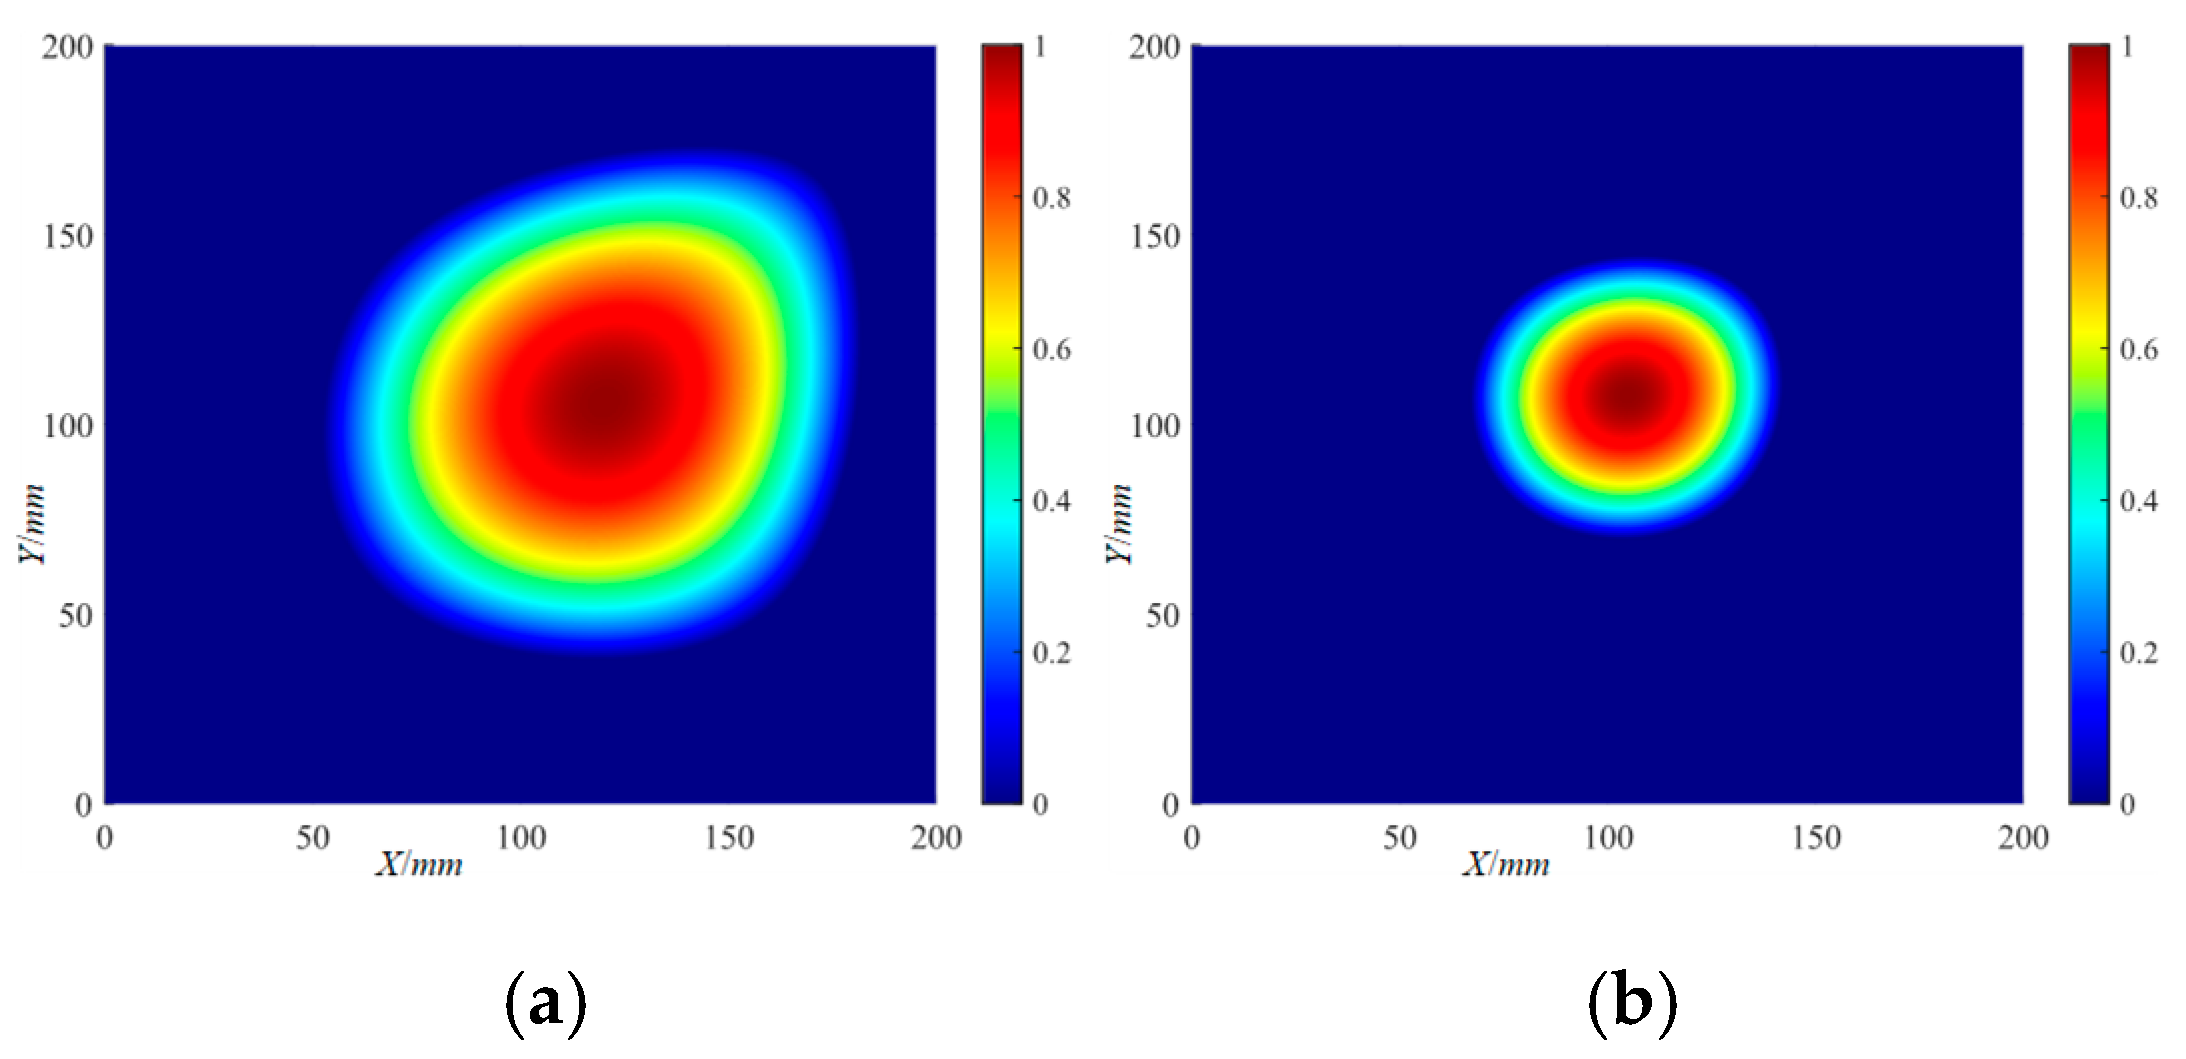
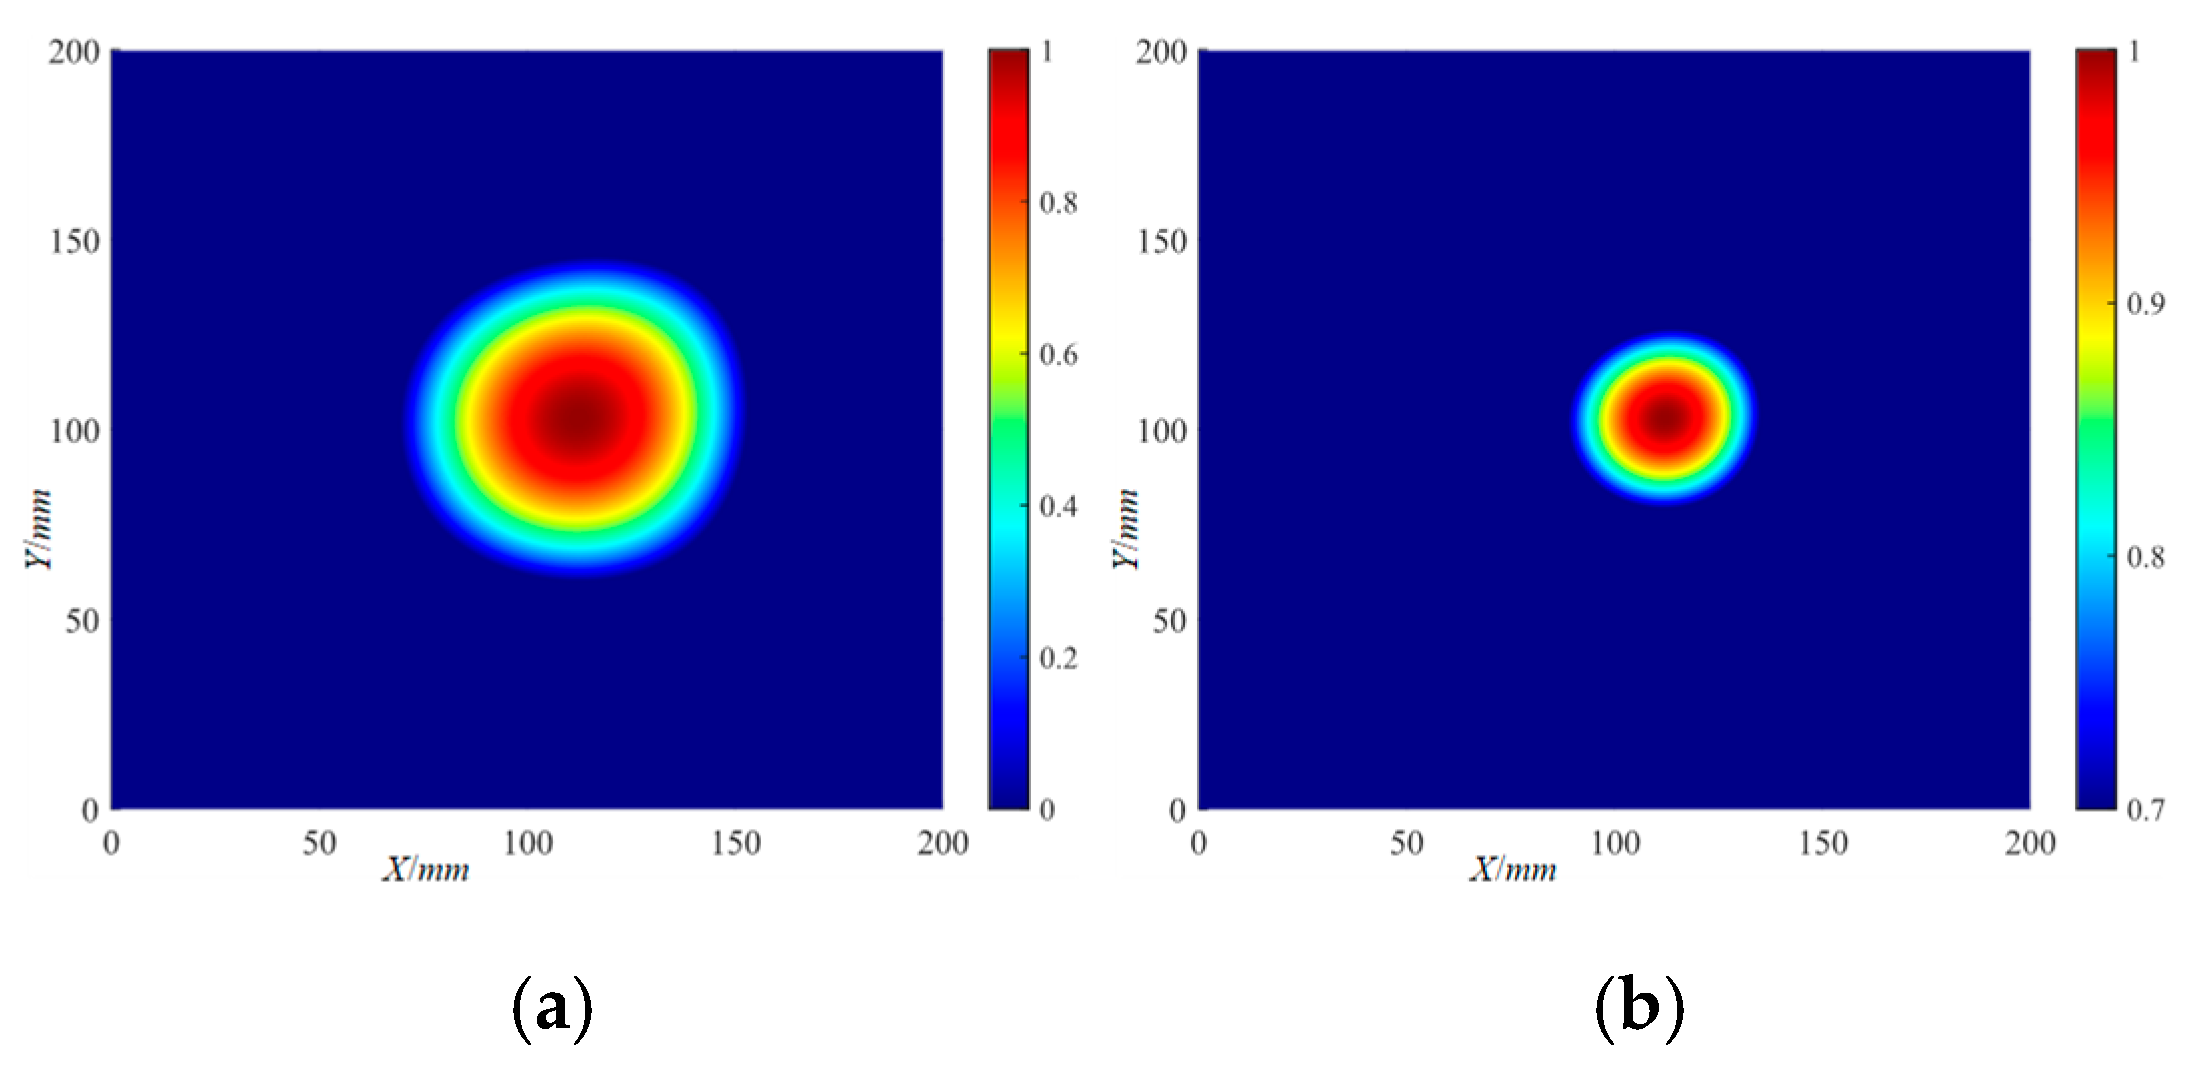
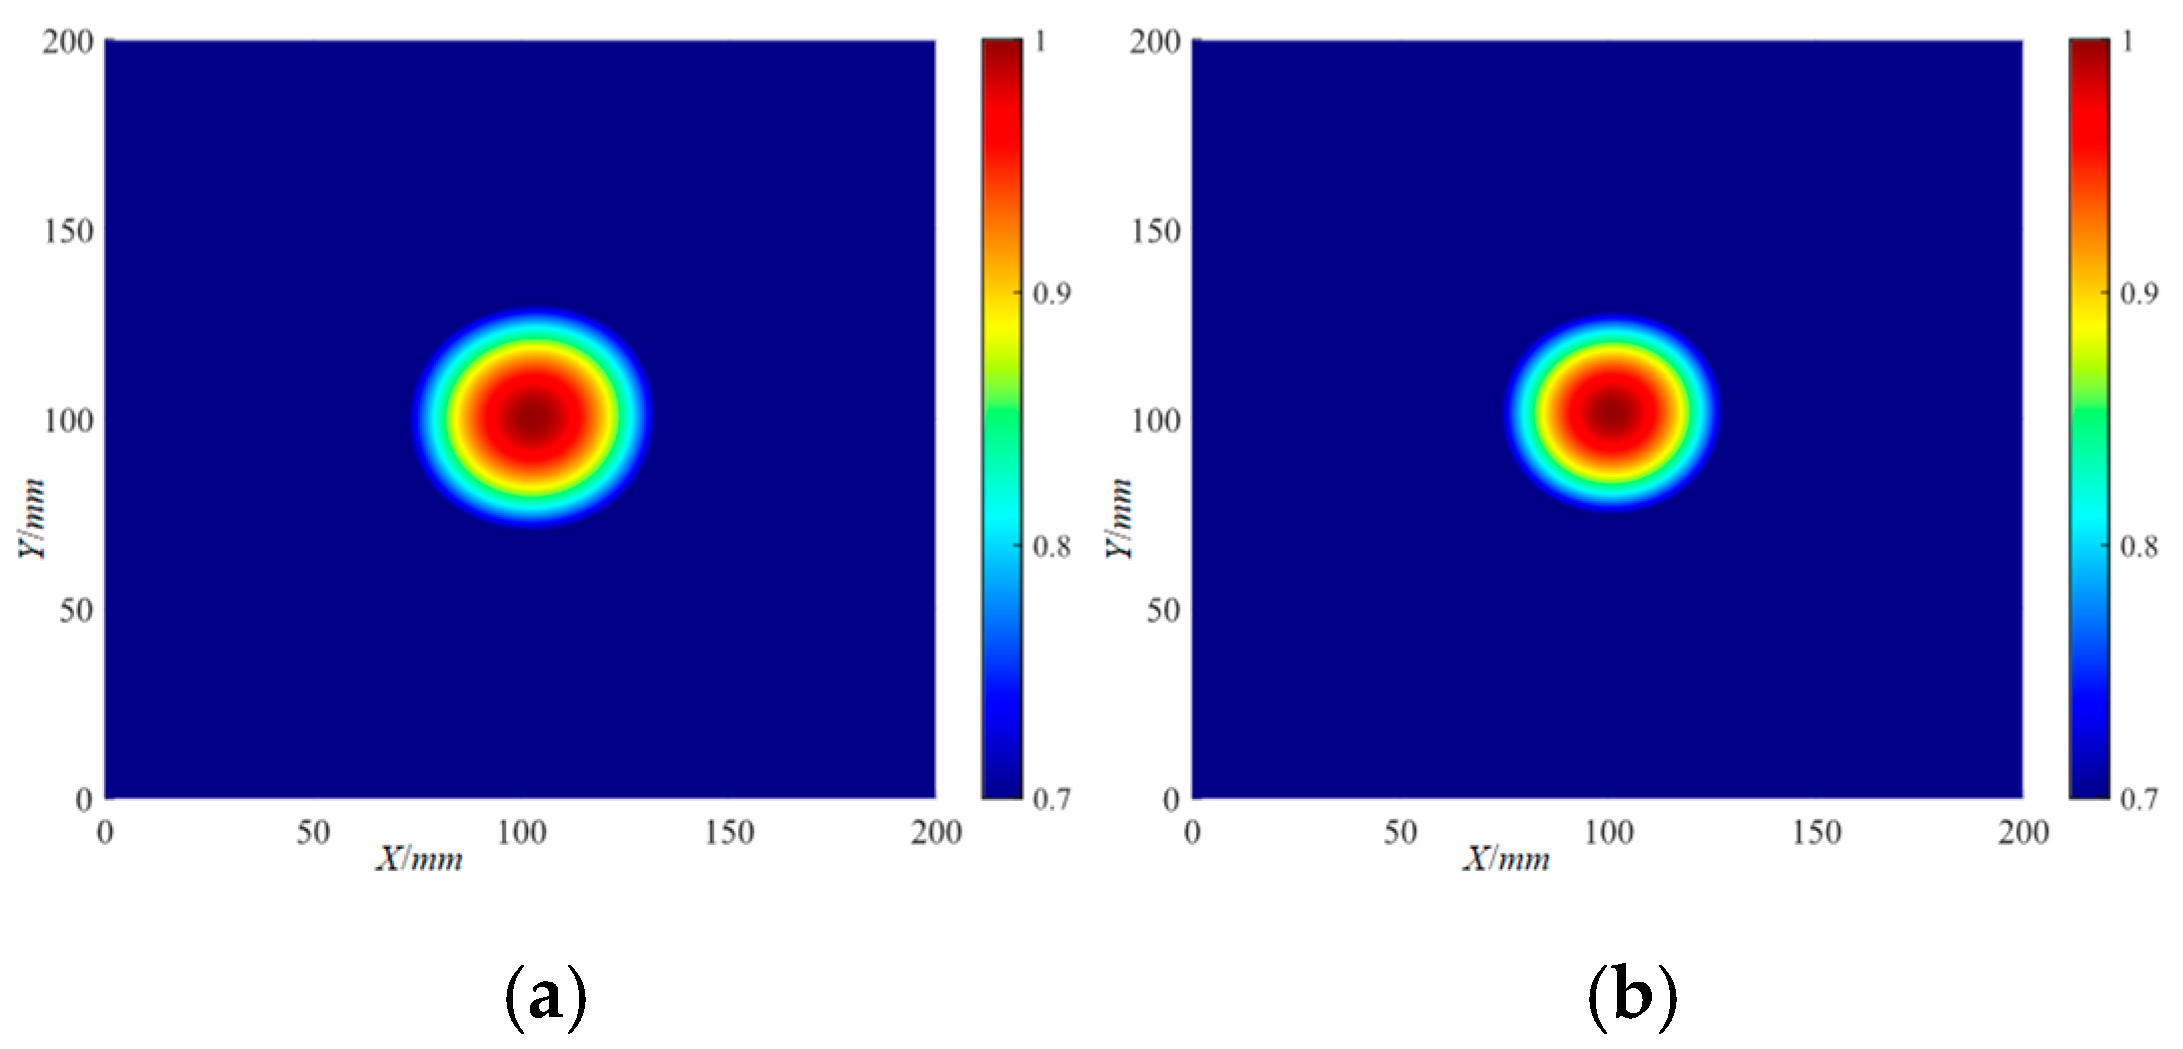
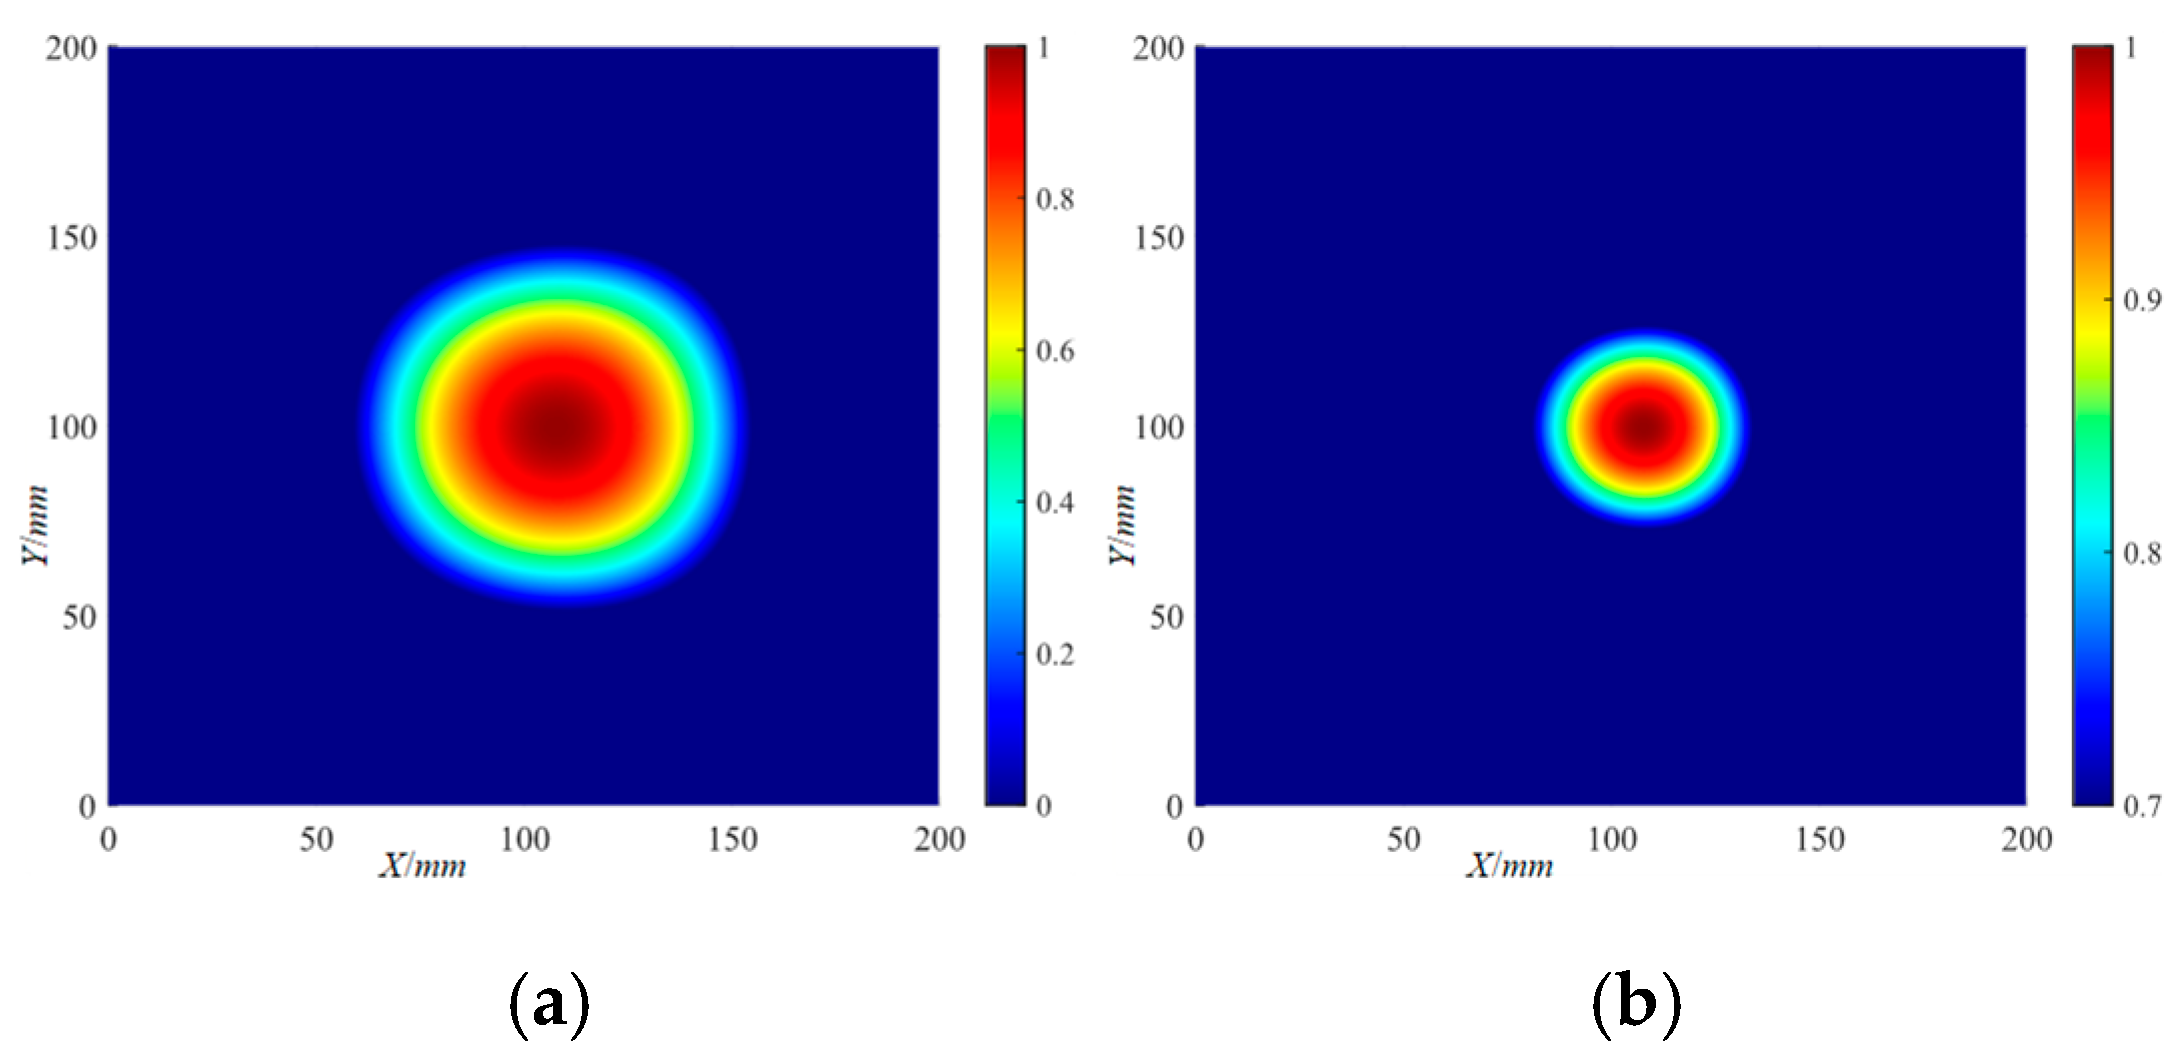
The frequency-averaged localization imaging results of Φ20 mm and Φ40 mm delamination damage by the IRAPID algorithm are shown in Figure 35 and Figure 36, respectively. It can be seen from the frequency-averaged localization imaging results that, similar to the RAPID algorithm, the IRAPID algorithm does not significantly improve the accuracy of delamination damage localization by superimposing and averaging the localization results at all frequencies.
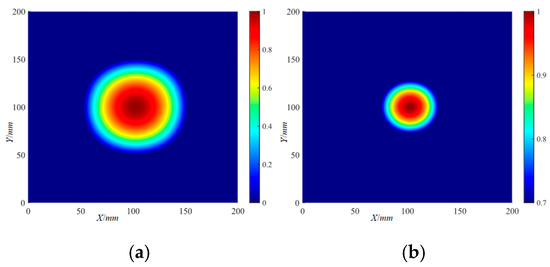
Figure 35.
The frequency-averaged localization imaging results of the Φ20 mm delamination damage by the IRAPID algorithm: (a) frequency-averaged localization imaging results; (b) frequency-averaged localization imaging results with a threshold.
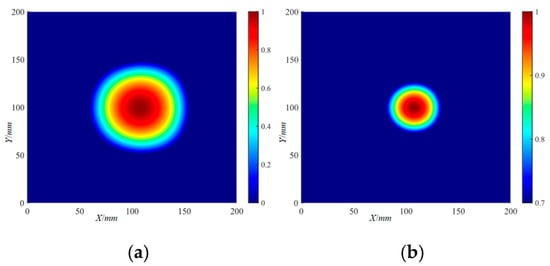
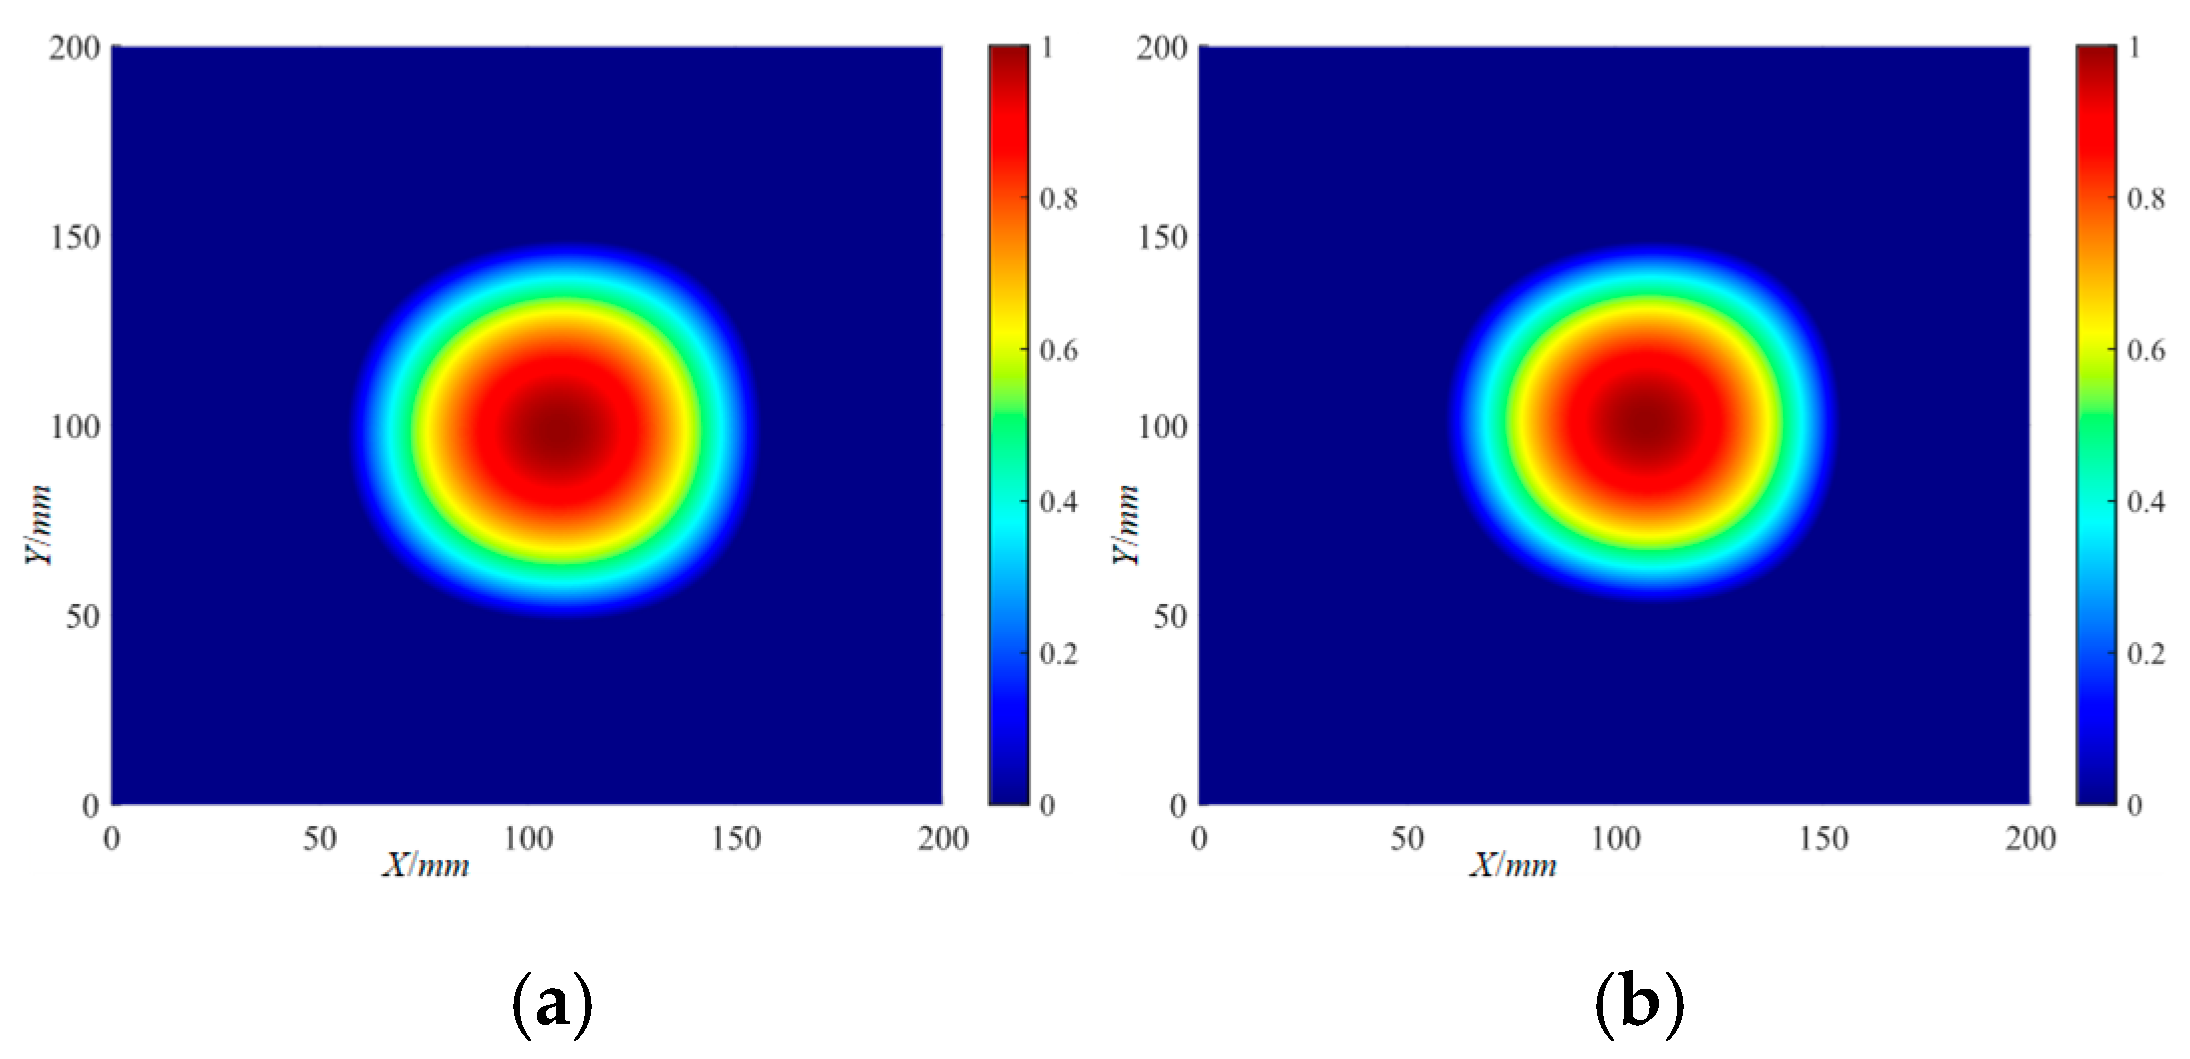
Figure 36.
The frequency-averaged localization imaging results of the Φ40 mm delamination damage by the IRAPID algorithm: (a) frequency-averaged localization imaging results; (b) frequency-averaged localization imaging results with a threshold.
4.4. Comparison of Localization Algorithms
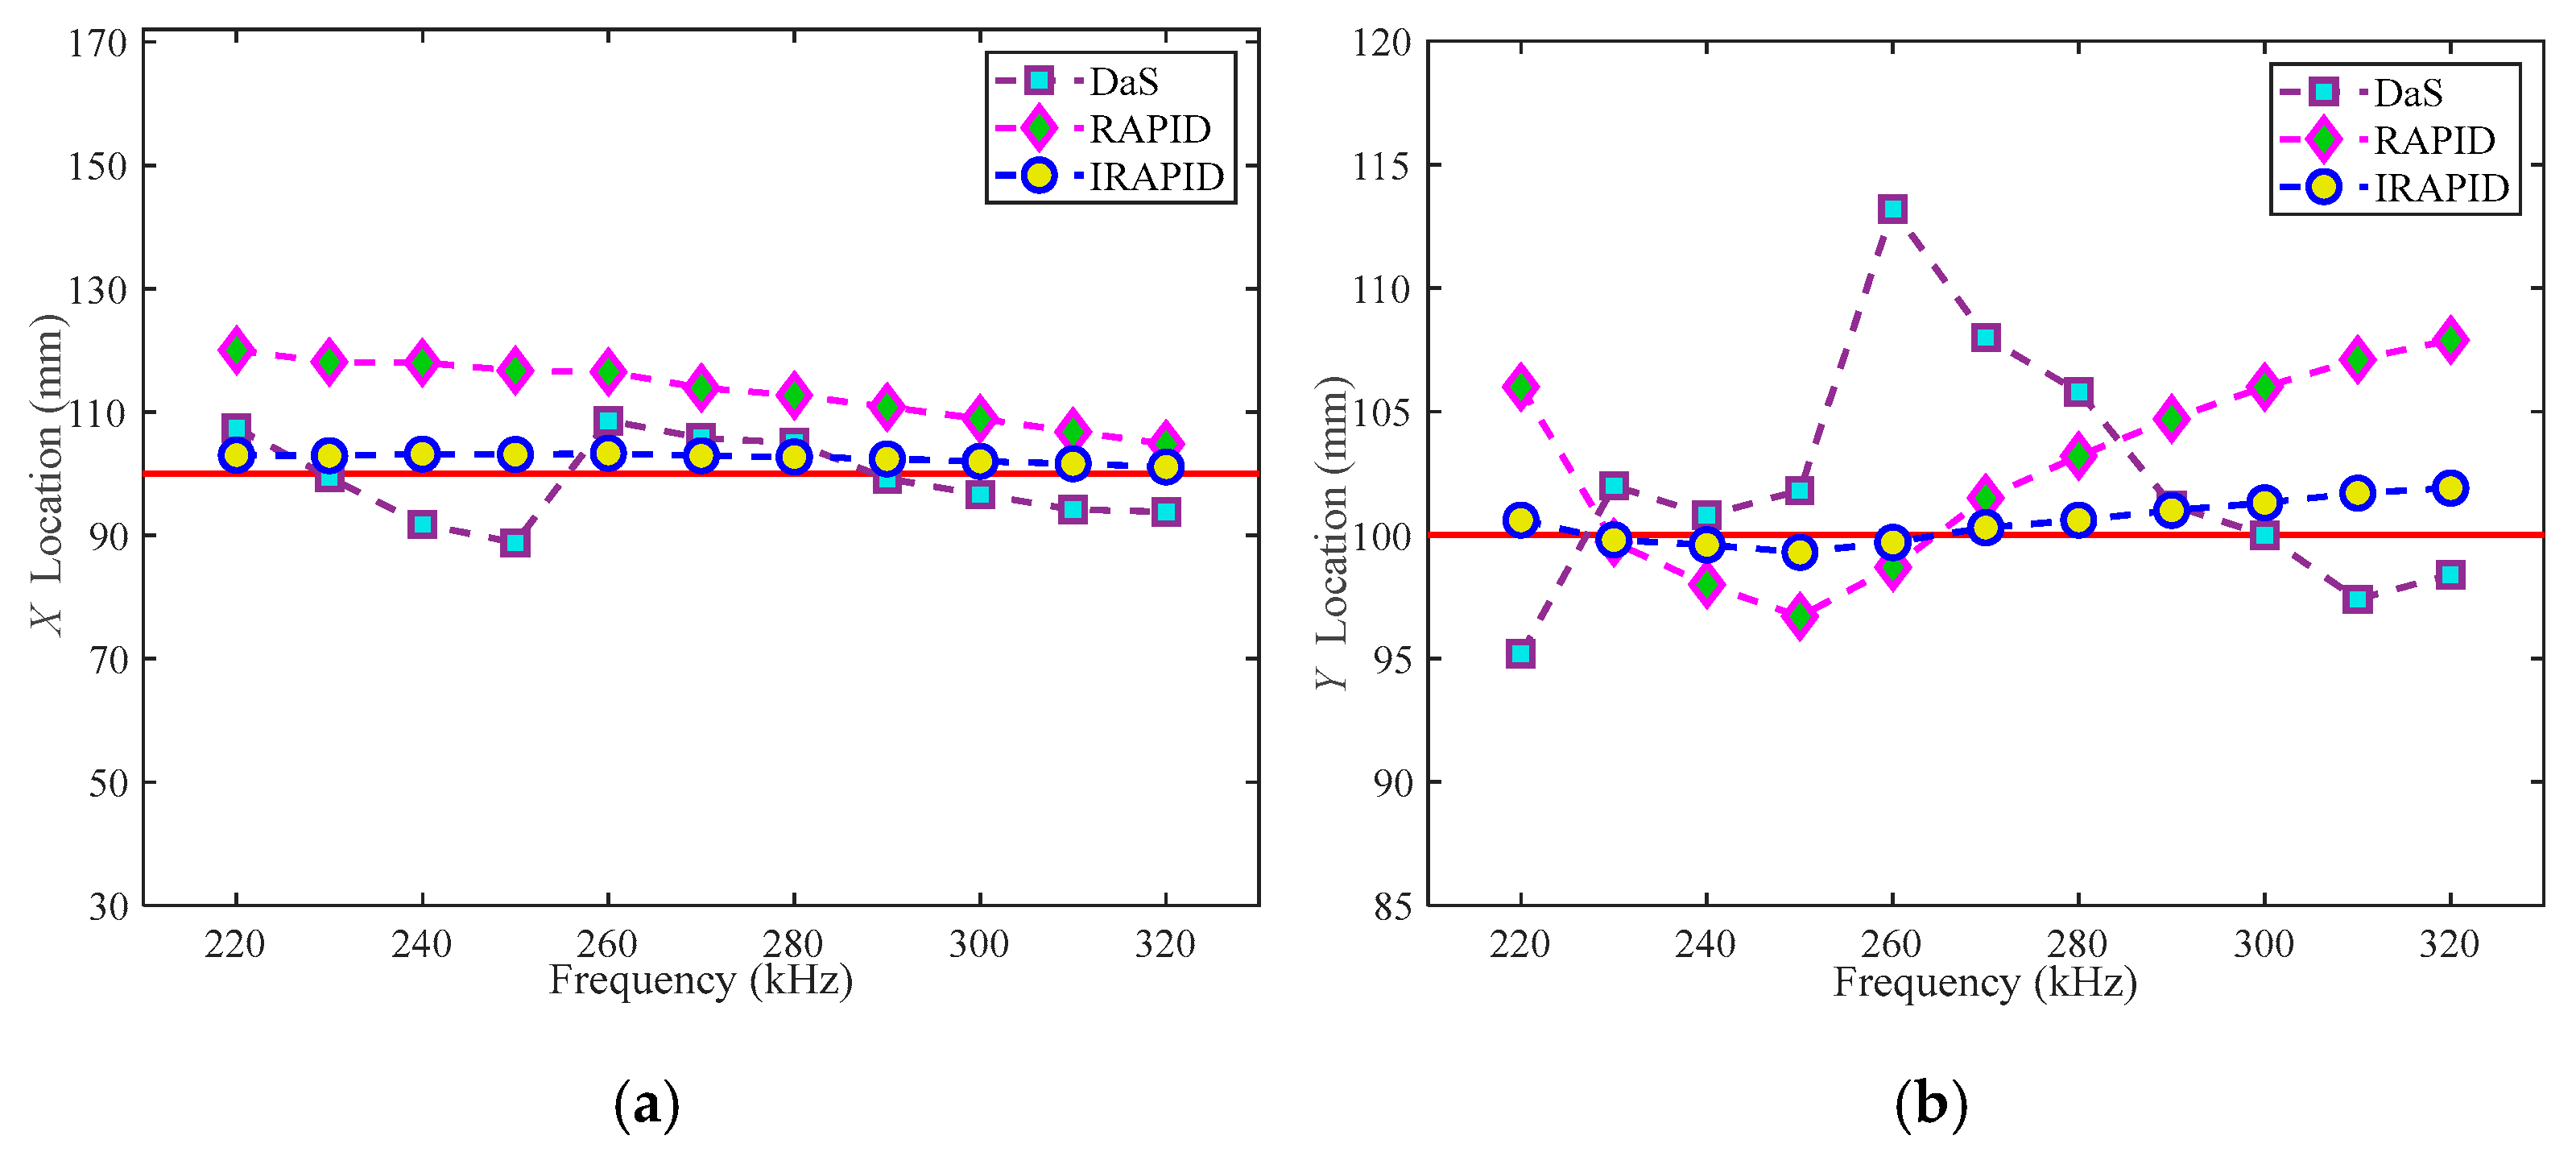
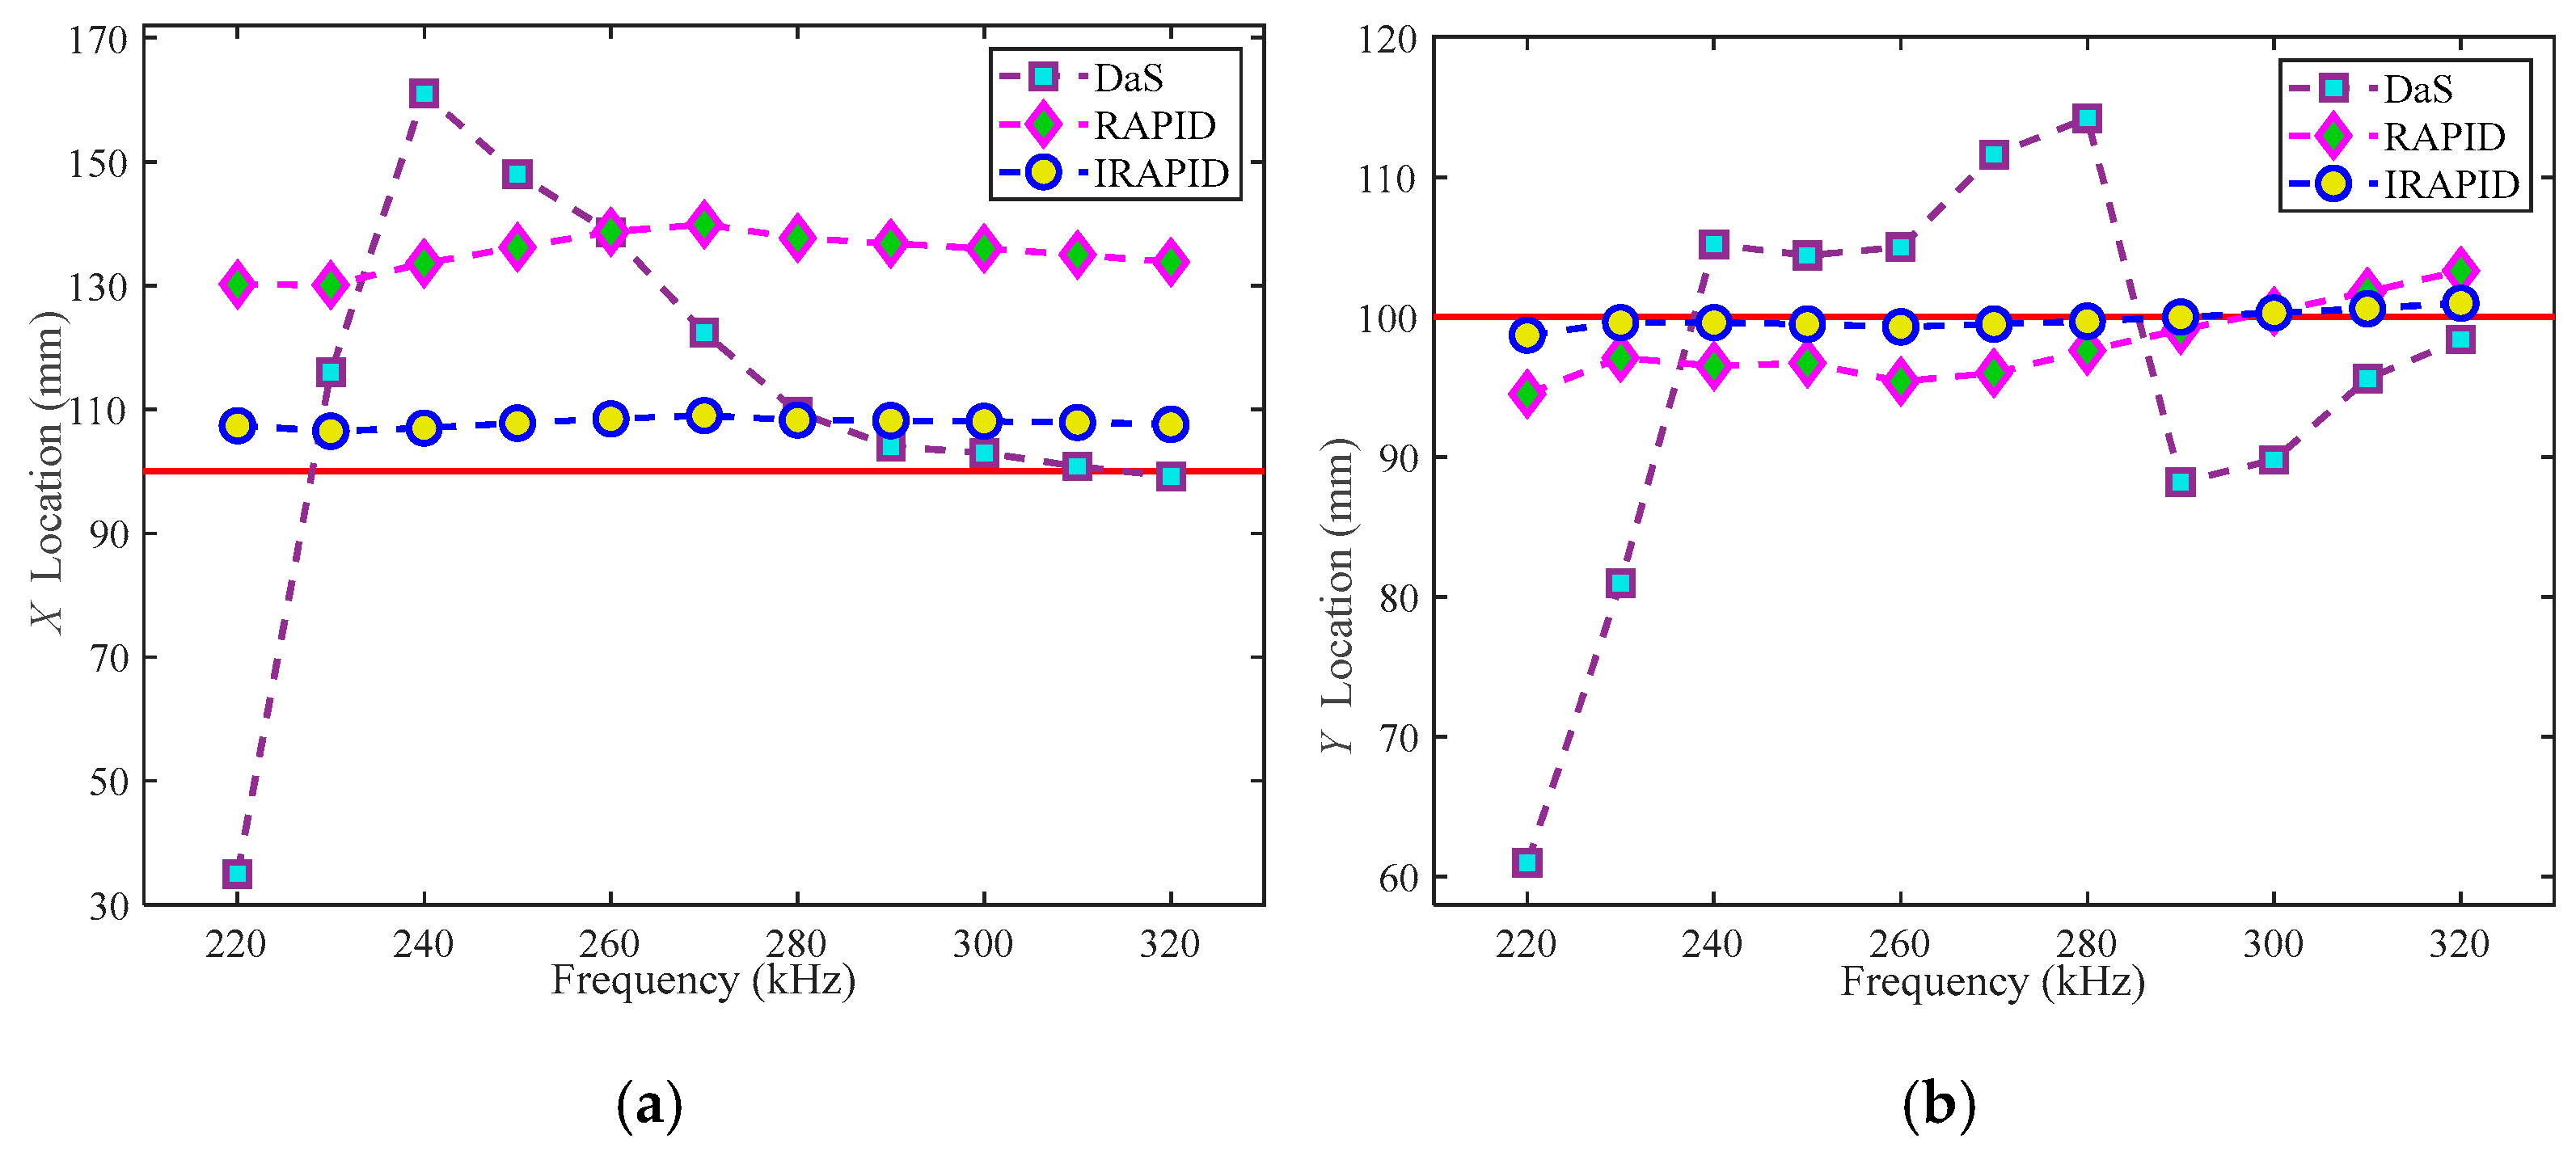
At each frequency, the results of every algorithm for Φ20 mm and Φ40 mm delamination damage localization are shown in Figure 37 and Figure 38, respectively. It can be seen from the figure that with the change in frequency, the DaS algorithm and the RAPID algorithm exhibit significant fluctuations in their accuracy of delamination damage localization, and the IRAPID algorithm shows better stability in the delamination damage localization. The IRAPID algorithm outperforms the DaS and the RAPID algorithm in delamination damage localization within the frequency range under consideration. The IRAPID algorithm can achieve satisfactory results for the delamination damage localization at various frequencies.
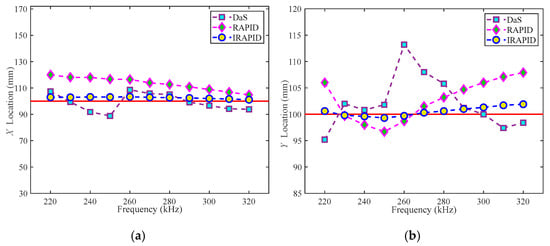
Figure 37.
Φ20 mm delamination damage localization results: (a) X-axis localization results; (b) Y-axis localization results (the red horizontal line represents the real delamination damage localization).
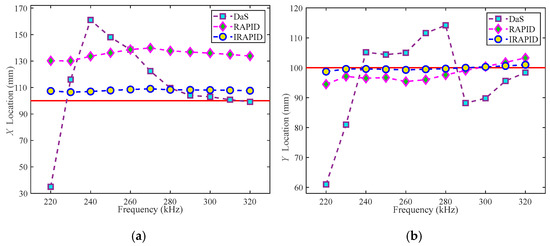
Figure 38.
Φ40 mm delamination damage localization results: (a) X-axis localization results; (b) Y-axis localization results (the red horizontal line represents the real delamination damage localization).
The localization errors of every algorithm for the Φ20 mm and Φ40 mm delamination damage are shown in Table 6 and Table 7, respectively. It can be found from Table 6 and Table 7 that, when the frequency-averaged localization results are used as the evaluation criteria, the localization error of the IRAPID algorithm for delamination damage is significantly lower than that of the DaS algorithm and the original RAPID algorithm. The localization accuracy of each algorithm for delamination damage in the X-axis direction is lower than that in the Y-axis direction. This may be due to the delamination damage at the CFRP curved structure, and the curved structure is along the X-axis direction. The curved structure aggravates the complexity of the Lamb wave signal and increases the localization error in the X-axis direction.
Table 6.
The localization error of Φ20 mm delamination damage.
Table 7.
The localization error of Φ40 mm delamination damage.
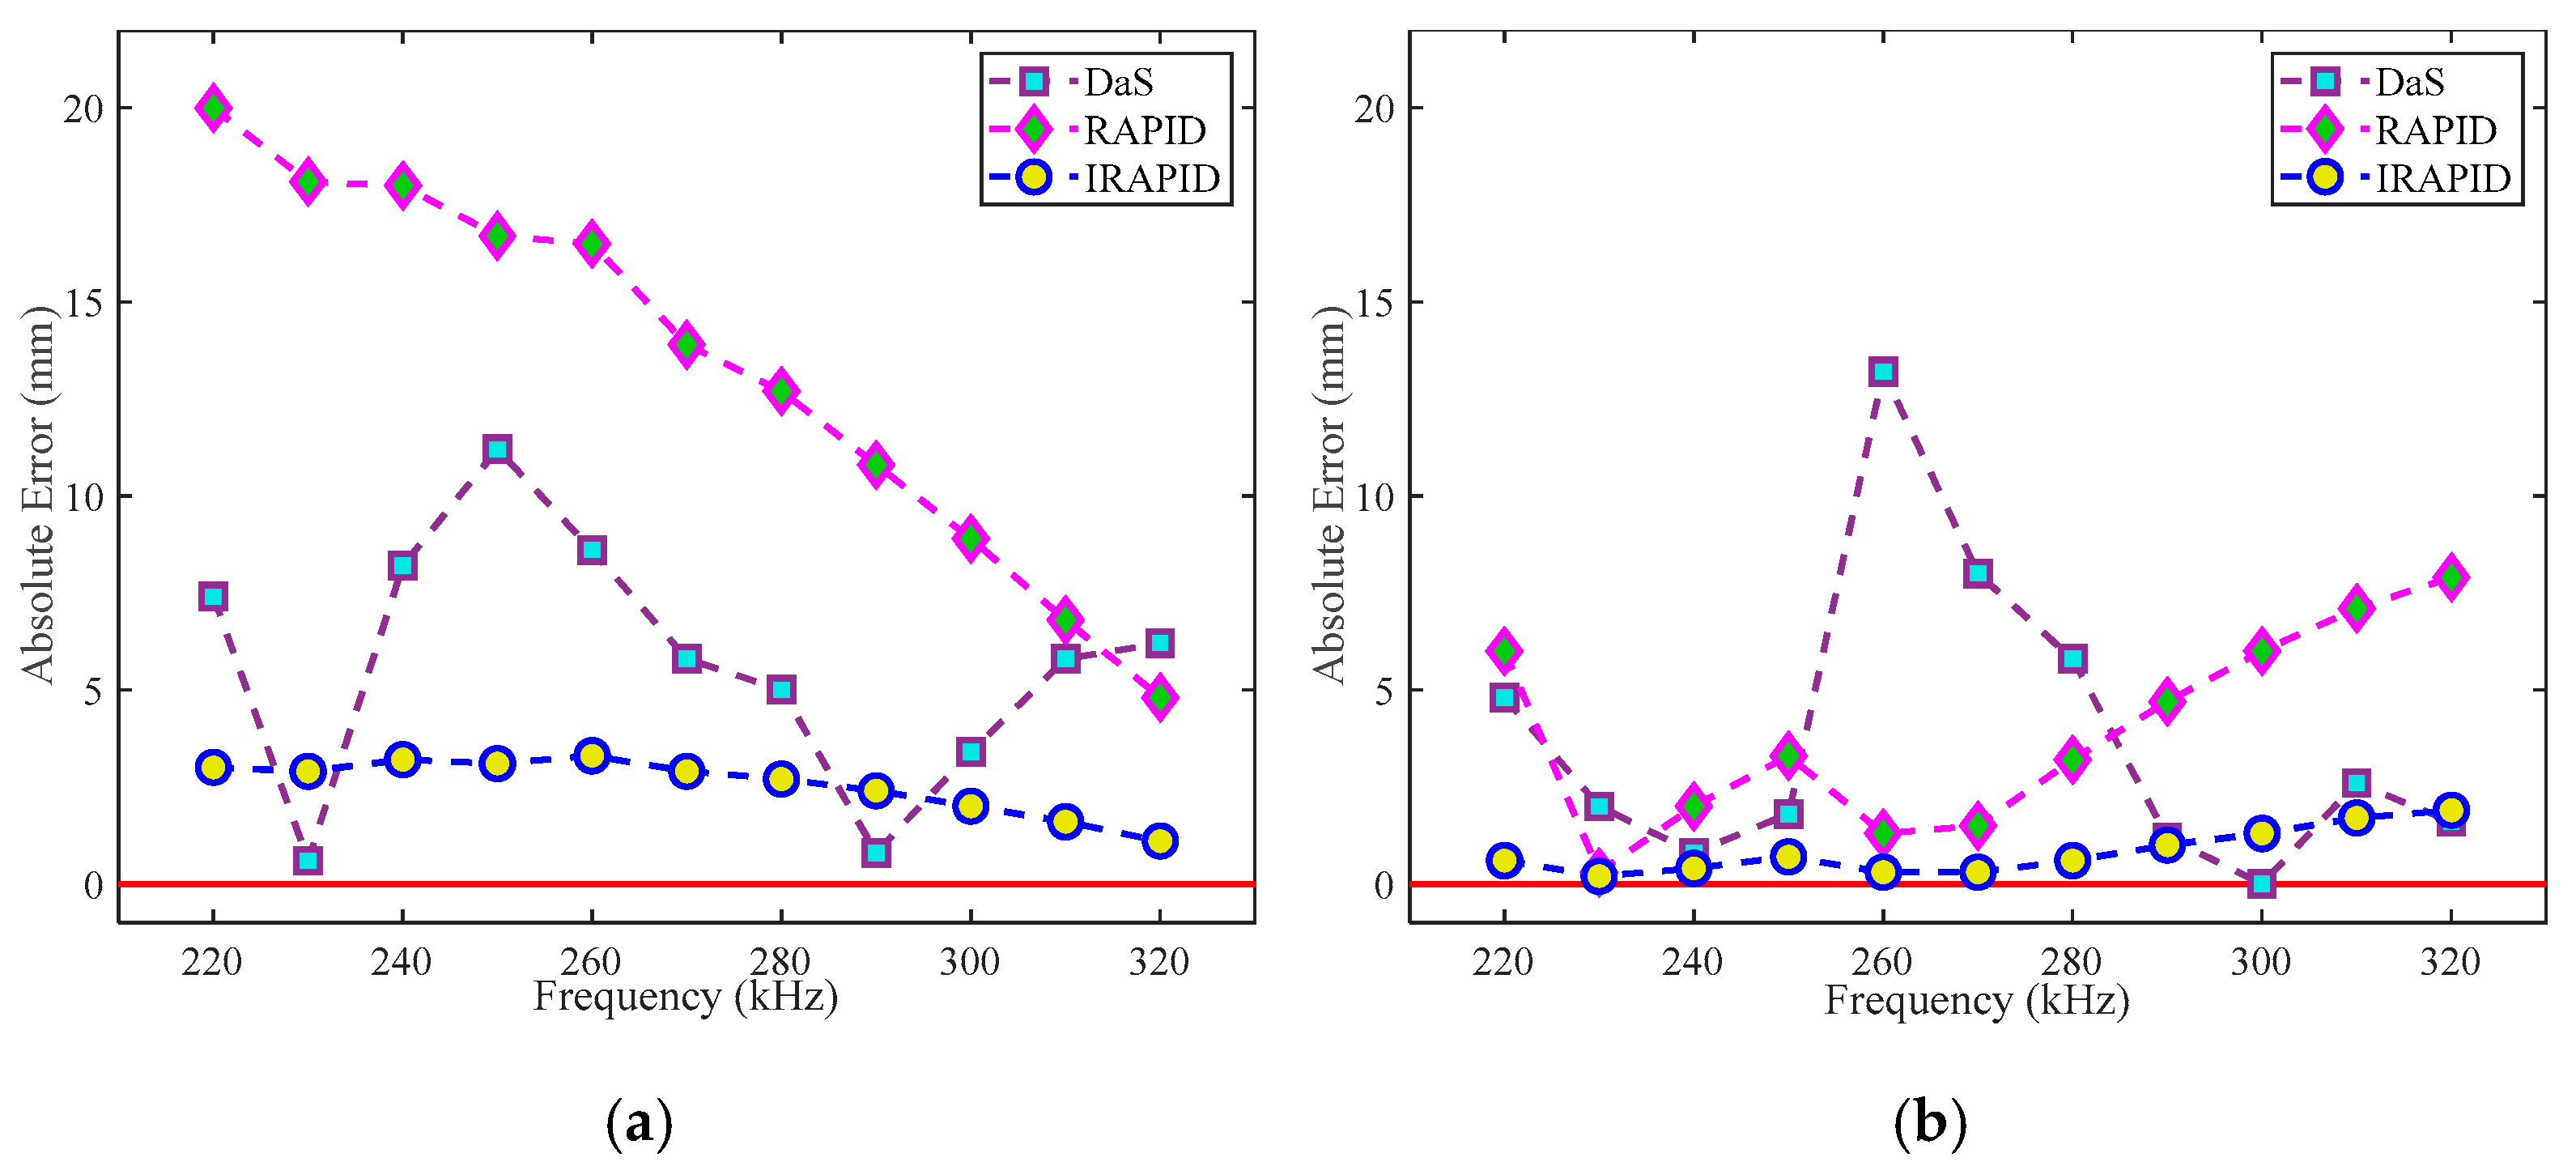
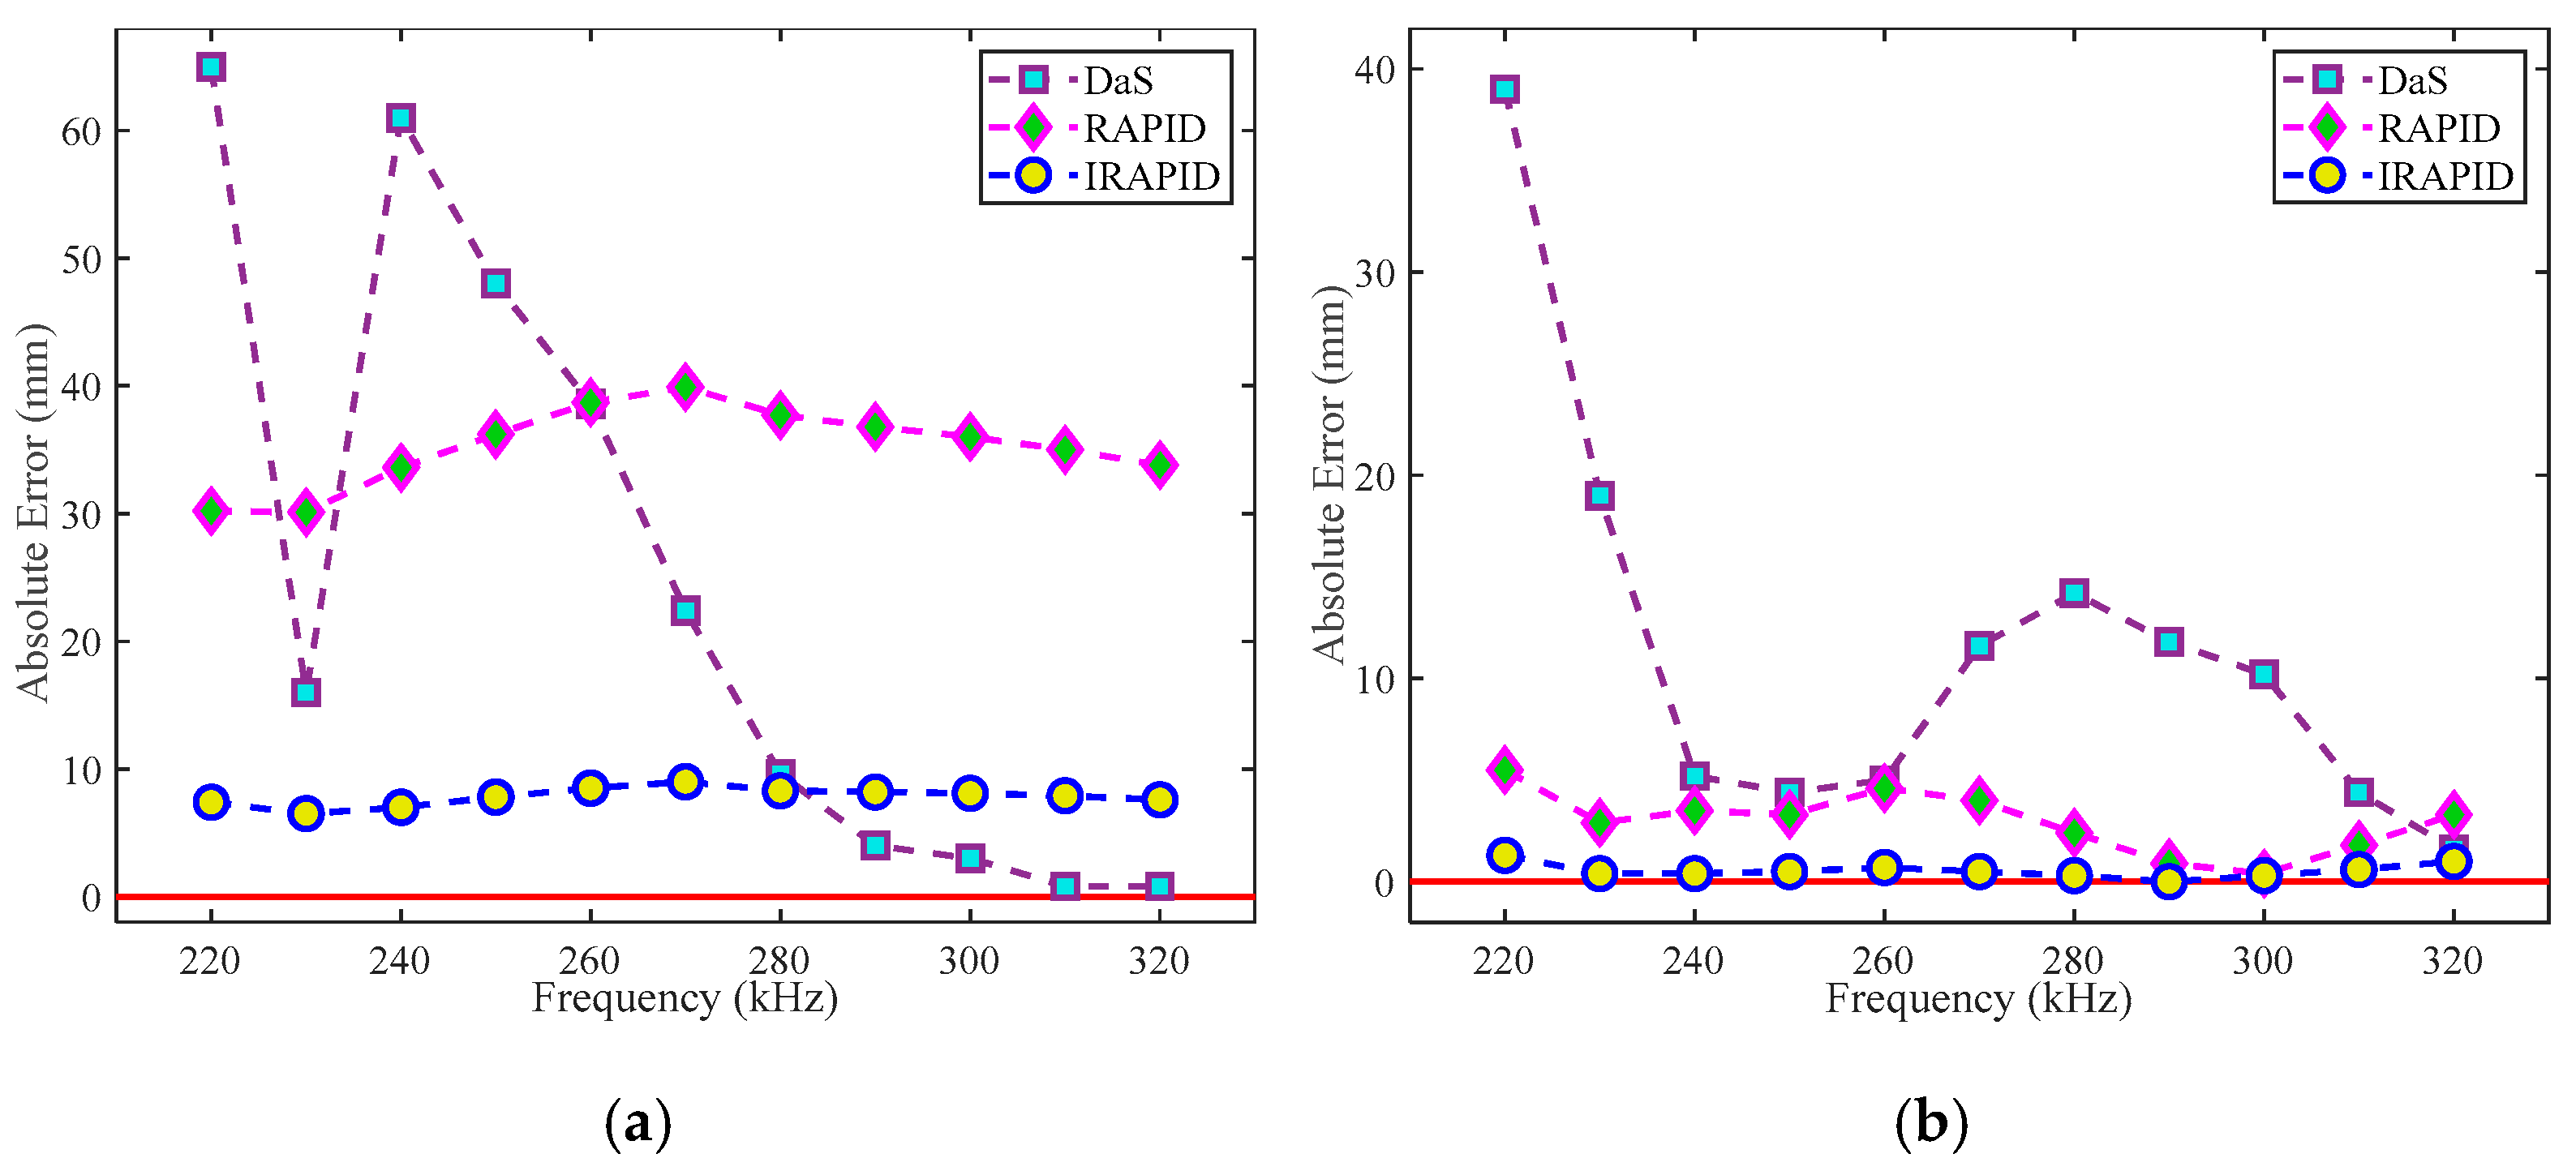
The variation in the localization errors of the Φ20 mm and Φ40 mm delamination damage on the X-axis and Y-axis with frequency is shown in Figure 39 and Figure 40, respectively. As can be seen from Figure 39 and Figure 40, compared with the Φ40 mm delamination damage, the localization results of the Φ20 mm delamination damage are more accurate. In addition, the localization results of Φ40 mm delamination damage by each algorithm fluctuate greatly with the change in frequency. This may be due to the scattering of Lamb waves encountering the boundaries of delamination damage. As the size of delamination damage increases, the error in ToF obtained from scattered waves increases due to the increase in the boundary of delamination damage, ultimately making delamination damage localization increasingly challenging.
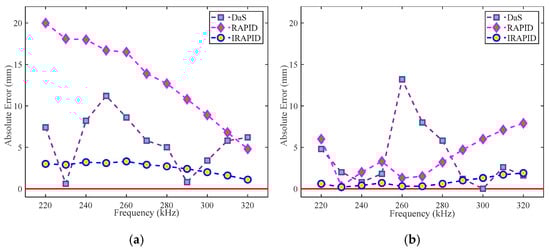
Figure 39.
Φ20 mm delamination damage localization errors: (a) X-axis localization errors; (b) Y-axis localization errors (the red horizontal line represents the baseline of delamination damage localization error).
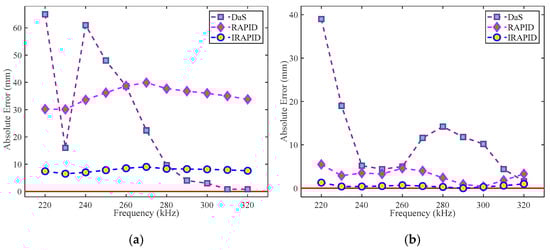
Figure 40.
Φ40 mm delamination damage localization errors: (a) X-axis localization errors; (b) Y-axis localization errors (the red horizontal line represents the baseline of delamination damage localization error).
5. Conclusions
An IRAPID method was proposed in this paper to conduct experimental research on the delamination damage localization of CFRP curved plates using Lamb waves. In the experiment, three CFRP curved plates were prepared, including one healthy curved plate and two curved plates with delamination damage sizes of Φ20 mm and Φ40 mm, respectively. The conclusions are as follows:
- (1)
- Compared with the DaS algorithm and the RAPID algorithm, the IRAPID algorithm has achieved more accurate results in the localization of delamination damage at each frequency.
- (2)
- In the range of frequency variation considered, the stability of the IRAPID algorithm for delamination damage localization is superior to that of the DaS algorithm and the RAPID algorithm.
- (3)
- The localization of delamination damage will become increasingly challenging due to the increase in its size.
- (4)
- The accuracy of delamination damage localization in different axial directions will vary due to the existence of curved structures. The accuracy of delamination damage localization is higher in the Y-axis direction than in the X-axis direction.
- (5)
- To a certain extent, it mitigates the potential localization errors associated with single-frequency detection by averaging the localization results across various frequencies. Lamb waves with multiple frequencies can be employed for delamination damage localization detection, and the detection results at each frequency are averaged to enhance the reliability of localization.
The case study of this paper has achieved satisfactory results. Nevertheless, the proposed method cannot determine how small a size of the delamination damage can be located. This is an issue to be investigated in the future. In addition, considering that the delamination damage is caused by the accumulation of small damage from scratch and from small to large, future work will focus on monitoring the expansion of delamination damage.
Author Contributions
Conceptualization, Q.Y. and S.Z.; methodology, Q.Y.; validation, Q.Y. and Y.C.; formal analysis, Q.Y. and S.Z.; investigation, Q.Y. and Y.C.; resources, S.Z.; data curation, Q.Y., Y.C. and Y.D.; writing—original draft preparation, Q.Y.; writing—review and editing, Q.Y. and S.Z.; visualization, Q.Y.; supervision, S.Z. All authors have read and agreed to the published version of the manuscript.
Funding
This research received no external funding.
Data Availability Statement
Data are contained within the article.
Conflicts of Interest
The authors declare no conflicts of interest.
References
- Bin Mohamed Rehan, M.S.; Rousseau, J.; Fontaine, S.; Gong, X.J. Experimental Study of the Influence of Ply Orientation on DCB Mode-I Delamination Behavior by Using Multidirectional Fully Isotropic Carbon/Epoxy Laminates. Compos. Struct. 2017, 161, 1–7. [Google Scholar] [CrossRef]
- Hegde, S.; Satish Shenoy, B.; Chethan, K.N. Review on Carbon Fiber Reinforced Polymer (CFRP) and Their Mechanical Performance. Mater. Today Proc. 2019, 19, 658–662. [Google Scholar] [CrossRef]
- Huo, R.; Chen, L.; Liu, J.; Peng, D. The Application of Transfer Matrix Method in Acoustic Performance Analysis of Composite Materials and Acoustic Protection Design of Ship. IOP Conf. Ser. Mater. Sci. Eng. 2019, 544, 012047. [Google Scholar] [CrossRef]
- Wang, Z.W.; Zhao, J.P.; Zhang, X. Finite Element Analysis of Composite Laminates Subjected to Low-Velocity Impact Based on Multiple Failure Criteria. Mater. Res. Express 2018, 5, 065320. [Google Scholar] [CrossRef]
- May, M.; Rupakula, G.D.; Matura, P. Non-Polymer-Matrix Composite Materials for Space Applications. Compos. Part C Open Access 2020, 3, 100057. [Google Scholar] [CrossRef]
- Langat, R.K.; De Luycker, E.; Cantarel, A.; Rakotondrabe, M. Integration Technology with Thin Films Co-Fabricated in Laminated Composite Structures for Defect Detection and Damage Monitoring. Micromachines 2024, 15, 274. [Google Scholar] [CrossRef] [PubMed]
- Singh, A.P.; Sharma, M.; Singh, I. A Review of Modeling and Control during Drilling of Fiber Reinforced Plastic Composites. Compos. Part B Eng. 2013, 47, 118–125. [Google Scholar] [CrossRef]
- Vishwakarma, A.; Behera, A.; Thawre, M.M.; Ballal, A.R. Effect of Thickness Variation on Static Behaviour of Carbon Fiber Reinforced Polymer Multidirectional Laminated Composite. Mater. Res. Express 2019, 6, 115312. [Google Scholar] [CrossRef]
- Shyha, I.; Soo, S.L.; Aspinwall, D.; Bradley, S. Effect of Laminate Configuration and Feed Rate on Cutting Performance When Drilling Holes in Carbon Fibre Reinforced Plastic Composites. J. Mater. Process. Technol. 2010, 210, 1023–1034. [Google Scholar] [CrossRef]
- Singh, T.J.; Samanta, S. Characterization of Kevlar Fiber and Its Composites: A Review. Mater. Today Proc. 2015, 2, 1381–1387. [Google Scholar] [CrossRef]
- McConnell, V.P. Ballistic Protection Materials a Moving Target. Reinf. Plast. 2006, 50, 20–25. [Google Scholar] [CrossRef]
- Ameri, B.; Moradi, M.; Mohammadi, B.; Salimi-Majd, D. Investigation of Nonlinear Post-Buckling Delamination in Curved Laminated Composite Panels via Cohesive Zone Model. Thin-Walled Struct. 2020, 154, 106797. [Google Scholar] [CrossRef]
- Cairns, D.S.; Nelson, J.W.; Woo, K.; Miller, D. Progressive Damage Analysis and Testing of Composite Laminates with Fiber Waves. Compos. Part A Appl. Sci. Manuf. 2016, 90, 51–61. [Google Scholar] [CrossRef]
- Mehdikhani, M.; Gorbatikh, L.; Verpoest, I.; Lomov, S.V. Voids in Fiber-Reinforced Polymer Composites: A Review on Their Formation, Characteristics, and Effects on Mechanical Performance. J. Compos. Mater. 2019, 53, 1579–1669. [Google Scholar] [CrossRef]
- Woo, K.; Nega, B.F.; Cairns, D.S.; Lua, J. Delamination Behavior of L-Shaped Composite Beam with Manufacturing Defects. J. Mech. Sci. Technol. 2020, 34, 3709–3720. [Google Scholar] [CrossRef]
- Li, J.G.; Liu, P.F.; Chu, J.K. Finite Element Analysis of Delamination Behaviors of Composite Laminates under Hygrothermal Environment Using Virtual Crack Closure Technique. J. Fail. Anal. Prev. 2019, 19, 147–153. [Google Scholar] [CrossRef]
- Kharghani, N.; Guedes Soares, C. Behavior of Composite Laminates with Embedded Delaminations. Compos. Struct. 2016, 150, 226–239. [Google Scholar] [CrossRef]
- Yamanaka, T.; Heidari-Rarani, M.; Lessard, L.; Feret, V.; Hubert, P. A New Finite Element Method for Modeling Delamination Propagation without Additional Degrees of Freedom. Compos. Struct. 2016, 147, 82–98. [Google Scholar] [CrossRef]
- Jin, F.; Xu, P.; Xia, F.; Liang, H.; Yao, S.; Xue, J. Buckling of Composite Laminates with Multiple Delaminations: Part I Theoretical and Numerical Analysis. Compos. Struct. 2020, 250, 112491. [Google Scholar] [CrossRef]
- Higuchi, R.; Warabi, S.; Ishibashi, W.; Okabe, T. Experimental and Numerical Investigations on Push-out Delamination in Drilling of Composite Laminates. Compos. Sci. Technol. 2020, 198, 108238. [Google Scholar] [CrossRef]
- Geng, D.; Liu, Y.; Shao, Z.; Lu, Z.; Cai, J.; Li, X.; Jiang, X.; Zhang, D. Delamination Formation, Evaluation and Suppression during Drilling of Composite Laminates: A Review. Compos. Struct. 2019, 216, 168–186. [Google Scholar] [CrossRef]
- Hocheng, H.; Chen, C.C.; Tsao, C.C. Prediction of Critical Thrust Force for Tubular Composite in Drilling-Induced Delamination by Numerical and Experimental Analysis. Compos. Struct. 2018, 203, 566–573. [Google Scholar] [CrossRef]
- Ouyang, T.; Sun, W.; Bao, R.; Tan, R. Effects of Matrix Cracks on Delamination of Composite Laminates Subjected to Low-Velocity Impact. Compos. Struct. 2021, 262, 113354. [Google Scholar] [CrossRef]
- Sivakumar, V.; Gautham Barathwaj, P.; Santosh Kumar, M.; Srikar, D. Delamination Propagation Study on Aircraft Composite Rib Subjected to Fatigue Loading. J. Fail. Anal. Preven. 2020, 20, 1351–1363. [Google Scholar] [CrossRef]
- Gong, Y.; Zhao, L.; Zhang, J.; Hu, N. A Novel Model for Determining the Fatigue Delamination Resistance in Composite Laminates from a Viewpoint of Energy. Compos. Sci. Technol. 2018, 167, 489–496. [Google Scholar] [CrossRef]
- Gong, Y.; Zhao, L.; Zhang, J.; Hu, N.; Zhang, C. Development of a Standardized Test Procedure and an Improved Data Reduction Method for the Mixed-Mode I/II Delamination in Composite Laminates. Compos. Sci. Technol. 2021, 201, 108488. [Google Scholar] [CrossRef]
- Carrino, S.; Maffezzoli, A.; Scarselli, G. Active SHM for Composite Pipes Using Piezoelectric Sensors. Mater. Today Proc. 2021, 34, 1–9. [Google Scholar] [CrossRef]
- Raišutis, R.; Kažys, R.; Žukauskas, E.; Mažeika, L.; Vladišauskas, A. Application of Ultrasonic Guided Waves for Non-Destructive Testing of Defective CFRP Rods with Multiple Delaminations. NDT E Int. 2010, 43, 416–424. [Google Scholar] [CrossRef]
- Cantero-Chinchilla, S.; Malik, M.K.; Chronopoulos, D.; Chiachío, J. Bayesian Damage Localization and Identification Based on a Transient Wave Propagation Model for Composite Beam Structures. Compos. Struct. 2021, 267, 113849. [Google Scholar] [CrossRef]
- De Luca, A.; Perfetto, D.; De Fenza, A.; Petrone, G.; Caputo, F. Guided Waves in a Composite Winglet Structure: Numerical and Experimental Investigations. Compos. Struct. 2019, 210, 96–108. [Google Scholar] [CrossRef]
- Munian, R.K.; Roy Mahapatra, D.; Gopalakrishnan, S. Ultrasonic Guided Wave Scattering Due to Delamination in Curved Composite Structures. Compos. Struct. 2020, 239, 111987. [Google Scholar] [CrossRef]
- Hunten, K.A.; Barnard Feeney, A.; Srinivasan, V. Recent Advances in Sharing Standardized STEP Composite Structure Design and Manufacturing Information. Comput.-Aided Des. 2013, 45, 1215–1221. [Google Scholar] [CrossRef] [PubMed]
- Seeger, J.; Wolf, K. Multi-Objective Design of Complex Aircraft Structures Using Evolutionary Algorithms. Proc. Inst. Mech. Eng. Part G J. Aerosp. Eng. 2011, 225, 1153–1164. [Google Scholar] [CrossRef]
- Rao, J.; Ratassepp, M.; Lisevych, D.; Hamzah Caffoor, M.; Fan, Z. On-Line Corrosion Monitoring of Plate Structures Based on Guided Wave Tomography Using Piezoelectric Sensors. Sensors 2017, 17, 2882. [Google Scholar] [CrossRef] [PubMed]
- He, J.; Huo, H.; Guan, X.; Yang, J. A Lamb Wave Quantification Model for Inclined Cracks with Experimental Validation. Chin. J. Aeronaut. 2021, 34, 601–611. [Google Scholar] [CrossRef]
- Shoja, S.; Berbyuk, V.; Boström, A. Delamination Detection in Composite Laminates Using Low Frequency Guided Waves: Numerical Simulations. Compos. Struct. 2018, 203, 826–834. [Google Scholar] [CrossRef]
- Sha, G.; Xu, H.; Radzieński, M.; Cao, M.; Ostachowicz, W. Wavelet-Aided Guided Wavefield Imaging of Delaminations in Laminated Composite Plates. Smart Mater. Struct. 2020, 29, 105029. [Google Scholar] [CrossRef]
- Michalcová, L.; Hron, R. Quantitative Evaluation of Delamination in Composites Using Lamb Waves. IOP Conf. Ser. Mater. Sci. Eng. 2018, 326, 012006. [Google Scholar] [CrossRef]
- Feng, B.; Ribeiro, A.L.; Ramos, H.G. Interaction of Lamb Waves with the Edges of a Delamination in CFRP Composites and a Reference-Free Localization Method for Delamination. Measurement 2018, 122, 424–431. [Google Scholar] [CrossRef]
- Abbas, S.; Li, F.; Zhu, Y.; Tu, X. Experimental Investigation of Impact of Environmental Temperature and Optimal Baseline for Thermal Attenuation in Structural Health Monitoring Based on Ultrasonic Guided Waves. Wave Motion 2020, 93, 102474. [Google Scholar] [CrossRef]
- Ren, F.; Giannakeas, I.N.; Sharif Khodaei, Z.; Aliabadi, M.H.F. Theoretical and Experimental Investigation of Guided Wave Temperature Compensation for Composite Structures with Different Thicknesses. Mech. Syst. Signal Process. 2023, 200, 110594. [Google Scholar] [CrossRef]
- Perfetto, D.; Sharif Khodaei, Z.; De Luca, A.; Aliabadi, M.H.; Caputo, F. Experiments and Modelling of Ultrasonic Waves in Composite Plates under Varying Temperature. Ultrasonics 2022, 126, 106820. [Google Scholar] [CrossRef] [PubMed]
- Li, G.; Chattopadhyay, A. Multi-Dimensional Signal Processing and Mode Tracking Approach for Guided Wave Based Damage Localization in X-COR Sandwich Composite. Mech. Syst. Signal Process. 2018, 109, 134–149. [Google Scholar] [CrossRef]
- Lan, Z.; Saito, O.; Okabe, Y. Delamination Detection in CFRP Laminates Using a Chirp Guided Wave Mixing Technique. NDT E Int. 2024, 144, 103086. [Google Scholar] [CrossRef]
- Shan, S.; Qiu, J.; Zhang, C.; Ji, H.; Cheng, L. Multi-Damage Localization on Large Complex Structures through an Extended Delay-and-Sum Based Method. Struct. Health Monit. 2016, 15, 50–64. [Google Scholar] [CrossRef]
- Sharif-Khodaei, Z.; Aliabadi, M.H. Assessment of Delay-and-Sum Algorithms for Damage Detection in Aluminium and Composite Plates. Smart Mater. Struct. 2014, 23, 075007. [Google Scholar] [CrossRef]
- Zhang, H.; Hua, J.; Gao, F.; Lin, J. Efficient Lamb-Wave Based Damage Imaging Using Multiple Sparse Bayesian Learning in Composite Laminates. NDT E Int. 2020, 116, 102277. [Google Scholar] [CrossRef]
- De Fenza, A.; Sorrentino, A.; Vitiello, P. Application of Artificial Neural Networks and Probability Ellipse Methods for Damage Detection Using Lamb Waves. Compos. Struct. 2015, 133, 390–403. [Google Scholar] [CrossRef]
- Gao, D.; Wu, Z.; Yang, L.; Zheng, Y. Guide Waves-Based Multi-Damage Identification Using a Local Probability-Based Diagnostic Imaging Method. Smart Mater. Struct. 2016, 25, 045009. [Google Scholar] [CrossRef]
- De Luca, A.; Perfetto, D.; De Fenza, A.; Petrone, G.; Caputo, F. Guided Wave SHM System for Damage Detection in Complex Composite Structure. Theor. Appl. Fract. Mech. 2020, 105, 102408. [Google Scholar] [CrossRef]
- Wang, C.H.; Rose, J.T.; Chang, F.-K. A Synthetic Time-Reversal Imaging Method for Structural Health Monitoring. Smart Mater. Struct. 2004, 13, 415–423. [Google Scholar] [CrossRef]
- Lu, G.; Li, Y.; Wang, T.; Xiao, H.; Huo, L.; Song, G. A Multi-Delay-and-Sum Imaging Algorithm for Damage Detection Using Piezoceramic Transducers. J. Intell. Mater. Syst. Struct. 2017, 28, 1150–1159. [Google Scholar] [CrossRef]
- Nokhbatolfoghahai, A.; Navazi, H.M.; Groves, R.M. Using the Hybrid DAS-SR Method for Damage Localization in Composite Plates. Compos. Struct. 2020, 247, 112420. [Google Scholar] [CrossRef]
- Yu, Y.; Liu, X.; Wang, Y.; Wang, Y.; Qing, X. Lamb Wave-Based Damage Imaging of CFRP Composite Structures Using Autoencoder and Delay-and-Sum. Compos. Struct. 2023, 303, 116263. [Google Scholar] [CrossRef]
- Yue, J.; Hong, X.; Zhang, B. A Damage Imaging Method Based on Particle Swarm Optimization for Composites Nondestructive Testing Using Ultrasonic Guided Waves. Appl. Acoust. 2024, 218, 109878. [Google Scholar] [CrossRef]
- Gao, H.; Shi, Y.; Rose, J.L. Guided Wave Tomography on an Aircraft Wing with Leave in Place Sensors. AIP Conf. Proc. 2005, 760, 1788–1794. [Google Scholar] [CrossRef]
- Hay, T.R.; Royer, R.L.; Gao, H.; Zhao, X.; Rose, J.L. A Comparison of Embedded Sensor Lamb Wave Ultrasonic Tomography Approaches for Material Loss Detection. Smart Mater. Struct. 2006, 15, 946–951. [Google Scholar] [CrossRef]
- Zhao, X.; Royer, R.L.; Owens, S.E.; Rose, J.L. Ultrasonic Lamb Wave Tomography in Structural Health Monitoring. Smart Mater. Struct. 2011, 20, 105002. [Google Scholar] [CrossRef]
- Huang, L.; Zeng, L.; Lin, J.; Luo, Z. An Improved Time Reversal Method for Diagnostics of Composite Plates Using Lamb Waves. Compos. Struct. 2018, 190, 10–19. [Google Scholar] [CrossRef]
- Huang, L.; Zeng, L.; Lin, J.; Zhang, N. Baseline-Free Damage Detection in Composite Plates Using Edge-Reflected Lamb Waves. Compos. Struct. 2020, 247, 112423. [Google Scholar] [CrossRef]
- Wang, S.; Wu, W.; Shen, Y.; Liu, Y.; Jiang, S. Influence of the PZT Sensor Array Configuration on Lamb Wave Tomography Imaging with the RAPID Algorithm for Hole and Crack Detection. Sensors 2020, 20, 860. [Google Scholar] [CrossRef] [PubMed]
- Huo, H.; He, J.; Guan, X. A Bayesian Fusion Method for Composite Damage Identification Using Lamb Wave. Struct. Health Monit. 2021, 20, 2337–2359. [Google Scholar] [CrossRef]
- Guo, J.; Zeng, X.; Liu, Q.; Qing, X. Lamb Wave-Based Damage Localization and Quantification in Composites Using Probabilistic Imaging Algorithm and Statistical Method. Sensors 2022, 22, 4810. [Google Scholar] [CrossRef] [PubMed]
- De Luca, A.; Perfetto, D.; Polverino, A.; Minardo, A.; Caputo, F. Development and Validation of a Probabilistic Multistage Algorithm for Damage Localization in Piezo-Monitored Structures. Smart Mater. Struct. 2023, 32, 085015. [Google Scholar] [CrossRef]
- Teng, F.; Wei, J.; Lv, S.; Geng, X.; Peng, C.; Zhang, L.; Ju, Z.; Jia, L.; Jiang, M. Damage Localization in Carbon Fiber Composite Plate Combining Ultrasonic Guided Wave Instantaneous Energy Characteristics and Probabilistic Imaging Method. Measurement 2023, 221, 113443. [Google Scholar] [CrossRef]


Disclaimer/Publisher’s Note: The statements, opinions and data contained in all publications are solely those of the individual author(s) and contributor(s) and not of MDPI and/or the editor(s). MDPI and/or the editor(s) disclaim responsibility for any injury to people or property resulting from any ideas, methods, instructions or products referred to in the content. |
© 2024 by the authors. Licensee MDPI, Basel, Switzerland. This article is an open access article distributed under the terms and conditions of the Creative Commons Attribution (CC BY) license (https://creativecommons.org/licenses/by/4.0/).