Abstract
In the realm of high-speed precision broadcasting, the existing seeder opener proves inadequate for the speed of the seeding operation. We focus on the duckbill opener and employ the quadratic regression orthogonal rotation combination test design method to optimize the structural parameters of the opener. Throughout the experiment, the primary performance metrics encompassed the opener’s working resistance and the side dumping distance. The selected experimental factors comprised the penetration angle, the angle of soil entry gap, the shovel body width, and the shovel length. The optimal arrangement of structural parameters has been determined: a penetration angle, a soil entry gap angle, a shovel body width of 21 mm, and a shovel length of 142 mm. These parameters contribute to increased velocity, reduced operational resistance, and minimal soil disturbance. Under this combination, the relative deviations between the recorded measurements and the theoretical outcomes for working resistance and the side dumping distance stand at 4.24% and 1.06%, respectively; these confirm the credibility of the optimization results. We performed adaptability testing and conducted a comparative analysis under various operational conditions to assess the innovative opener’s ability to reduce force, minimize soil disruption, and maintain depth stability. The findings are as follows: At a depth of 5 cm and velocities ranging from 6 km/h to 8 km/h, an average working resistance reduction of 19.73%, a 5.64% decrease in the side dumping distance, and an average depth stability of 89.5% were observed. When operated at a speed of 7 km/h with a depth ranging from 3 cm to 5 cm, an average reduction of 19.66% in operational resistance, a 2.59% decrease in the side dumping distance, and an average depth stability of 91.1% were recorded. These results illustrate the innovative opener’s capacity to significantly reduce working resistance and side dumping distance while satisfying the depth stability requisites.
1. Introduction
Conservation tillage technology represents a sophisticated, advanced, and mature fusion of agricultural machinery and expertise. A no-tillage planter is a pivotal tool in implementing conservation tillage, culminating in heightened field yield efficiency while enhancing aeration, transparency, and the utilization rate of organic matter. The core of conservation tillage development is to adopt no-tillage technology, which can enhance the planter’s seeding operation uniformity, diminish tractor working resistance, and carry a significant commitment to promoting related technologies. As a critical device in the seeding process, the performance of the opener directly determines the quality of the ditch it creates, subsequently having the potential to impact the outcomes of both the seeding and the growth of crops [1,2]. With the rapid progress in seeding techniques, characterized by high speed, precision, and automation, the alignment between the exceptional operational velocity of the opener and the seeding speed becomes a pivotal factor that constrains planter development.
Currently, the operational speeds of planters in China typically range from 5 km/h to 9 km/h [3]. The disc-type ditcher is commonly employed as a trenching component [4,5,6]. Although it exhibits robust adaptability and blockage resistance, challenges such as limited soil return and the potential for creating dry soil coverage exist. Additionally, increased weight is often necessary to ensure the stability of ditch depth, thereby limiting its practicality. Zhao et al. [7] discovered through their research that an increase in the diameter and angle of the double disc opener disc leads to a linear increase trend in trenching resistance. Other commonly employed openers include sliding blade openers, core share openers, and duckbill openers. The sliding blade openers [8,9,10,11] exhibit effective speed synchronization (6.28 km/h~8.28 km/h), can create V-shaped seed ditches, ensure sowing accuracy, maintain high seed bed quality, compact the seedbed, and foster favorable seed germination conditions. However, their design and manufacturing display substantial arbitrariness, resulting in inadequate soil penetration and blockage susceptibility. The core plow-type opener features a simple structure and commendable soil penetration performance, forming a neat seed furrow. However, the lateral width of the furrow is substantial, leading to increased resistance during trenching. The front end exhibits a symmetrically curved surface (employing a one-way plowing method), contributing to significant lateral soil displacement. Its appropriate speed range is constrained (3 km/h~5 km/h) and inadequate to meet the demands of sowing after speed augmentation. Cao [12] improved the core plow’s design by changing its surface from concave to convex, significantly reducing soil disturbance while promoting both seed germination and growth. Duckbill openers [13,14,15,16,17] exhibit minimal soil disturbance, facilitate easy penetration, effectively resist blockages, and demonstrate relatively low resistance. However, these openers are currently most suitable for operation at relatively low speeds (4 km/h), rendering them incompatible with sowing speeds. Consequently, a compelling demand exists to design seeder openers that combine high speed and low resistance. Research has demonstrated that openers with a narrow width and no turning angle [18,19,20,21] can significantly diminish the working resistance of the opener, decrease soil disturbance, and enhance trenching and soil returning benefits. Furthermore, these openers can maintain effective operating performance even after speed augmentation, thereby enhancing sowing speed [22,23,24,25].
After a comprehensive analysis of the structure and performance of the openers above, we select the duckbill opener for trenching and sowing operations due to its distinct advantages. However, current research on duckbill openers is predominantly centered on employing biomimetic technology to reduce drag under low-speed (1.8 km/h) conditions. Nevertheless, a conspicuous deficiency exists in the research concerning the opener’s ability to reduce drag and soil disturbance at higher speeds.
The duckbill ditcher is suitable for wheat flat crop planting patterns with a planting depth of 3 to 5 cm. It provides loose seed bed conditions for crop growth, ensuring that the soil is loose underneath and on both sides of the seed. The duckbill ditcher mainly comprises a shovel body and handle, as shown in Figure 1. The shovel handle is a hollow rectangular tube, matching the width of the shovel body while additionally functioning as a guide for seeds and fertilizers. The shovel body constitutes a crucial opener component, inserting, cutting through the soil, and creating the seed trench. Its construction primarily encompasses the shovel blade, the upper and lower surfaces of the shovel body, and the two cheek surfaces.
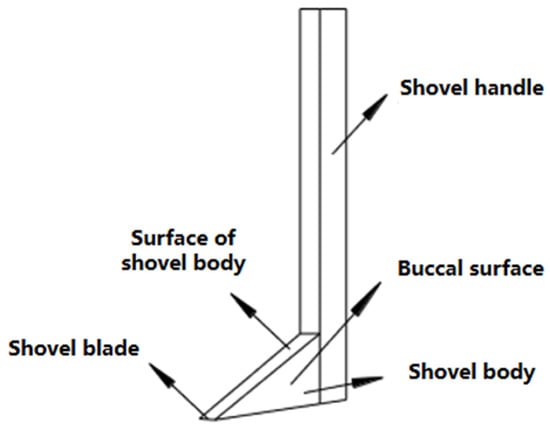
Figure 1.
Structure diagram of the opener.
This study focuses on a duckbill ditcher as the subject and employs a quadratic orthogonal regression rotation combination test at an operating speed range of 6 to 8 km/h. The leading performance indicators encompass the working resistance and the side dumping distance of the ditcher. Experimental factors encompass the ditcher’s penetration angle, clearance angle, shovel body width, and shovel length. The structural parameters of the ditcher are then optimized, and the performance in terms of resistance reduction, soil disturbance, and depth stability of the new ditcher is validated.
2. Analysis of the Speed Increase Performance of the Trencher
2.1. Test Platform
We experimented with the Intelligent Soil Machine Plant System Laboratory of China Agricultural University, as shown in Figure 2, to optimize the structural parameters of the opener. The experimental equipment mainly involved a soil tank (specification: 46 m × 2.0 m × 1 m, with a soil depth of 0.6 m), a TC2.0-45 test bench, a traction part (capable of infinitely variable speed within the range of 0–10 km/h), a power output shaft, a six-component suspension part, a hydraulic suspension part, and an electronic control system. The tested unit interfaced with the trolley using a six-component gantry, with sensors recording the opener’s three-dimensional force and torque during operation. The hydraulic suspension component provided three operational modes—raised, lowered, and floating—thereby facilitating depth adjustment.
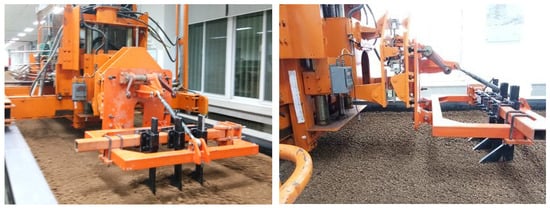
Figure 2.
Soil bin test.
During the assessment of the opener’s operational resistance, a reduction in trolley stability was noted with the escalation of operating speed while employing a single suspension system (the sensor and door panel in the gantry are actively connected). However, an increase in opener suspensions demonstrated that the simultaneous suspension of three openers yielded positive testing outcomes (Figure 2). To enhance measurement precision, optimizing the opener’s structural parameters incorporated the simultaneous suspension of three openers, each featuring identical structural specifications.
2.2. Preparation of Soil Conditions
Soil moisture and compactness relate to the adhesion properties of soil and ploughing components as well as the soil’s anti-destructive strength. These factors are crucial in determining the working resistance of the furrow opener, making it necessary to maintain consistent environmental conditions, including soil compactness, during sub-testing.
We employed a rotary tiller to treat the soil one day before the experiment, simulating actual operating conditions and enhancing the comparability of results. Subsequently, a trolley-mounted watering device was utilized to sprinkle water evenly and moisten the soil. Finally, the soil underwent compaction using a roller to guarantee uniformity in soil moisture content and compactness.
At the start of the experiment, ten distinct sites were selected in the soil trench, evenly spaced along the working direction and measured several times with the American SPECTRUM TDR300 portable soil moisture tester (10.5 cm × 7 cm × 1.8 cm, with four different lengths of measuring probes, 3.8 cm, 7.5 cm, 12 cm, and 20 cm, with ±3.0% accuracy) and SPECTRUM SC900 soil firmness meter (measurement range 0~7000 kPa, accuracy ±103 kPa) to assess moisture content and soil firmness. The results of the soil condition measurements are shown in Table 1. When the soil’s moisture content and firmness conditions were in concurrence, the trench test commenced.

Table 1.
The result of soil moisture content and compaction.
As indicated by the table, there was no significant difference of more than 5% between the soil moisture content and compactness values, suggesting that the experiment was conducted with consistency and agreement. Therefore, it can be concluded that the soil moisture content and compactness were suitable for conducting the experiment.
2.3. Test Indicators
- (1)
- Working resistance
The operational resistance of the opener is correlated with the power consumption and influences the power consumption of the traction component. Therefore, the operational resistance of the opener serves as a crucial parameter that indicates the performance of the opener.
- (2)
- Side dumping distance
Soil disturbance is correlated with the amount of soil after employing the trenching device, which impacts the thickness of soil cover for crop seeds, subsequently influencing the seed germination rate. Thus, soil disturbance is essential as an indicator of ditch quality.
The side dumping distance indicates the span between the dispersed soil on either side of the seed ditch and the center of the seed ditch during the trenching phase of the opener. As shown in Figure 3. The opener can be simplified as a dual-sided wedge structure. The trenching process spreads soil in a fan-shaped pattern ahead of the shovel body. Consequently, the side dumping distance denotes the magnitude of soil disturbance caused by the opener during trenching.
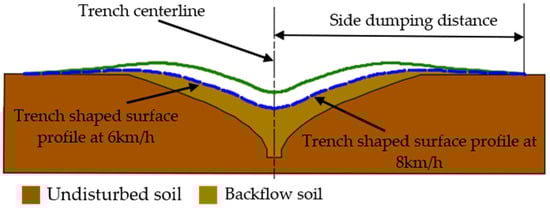
Figure 3.
The diagram of lateral spill throwing distance.
2.4. Analysis of the Speed Increase Performance of the Trencher
The initial structural parameters of the opener consist of a penetration angle of 30°, a soil entry gap angle of 6°, a width of 30 mm, and a length of 180 mm. We undertook a comparative analysis concerning the operational resistance and lateral soil scattering distance across varying operating speeds to evaluate the performance of the original opener under increased speed. These evaluations were conducted at a depth of 5 cm.
We illustrate the change in operational resistance of the opener concerning speed. Then, employ quadratic polynomial nonlinear fitting, obtaining a fitting coefficient that reaches 0.97856. The functional relationship between them is obtained as follows:
The data presented in Figure 4 indicate a pronounced nonlinear upsurge in resistance as the working speed escalates, occurring within a working speed range of 5 km/h to 9 km/h.
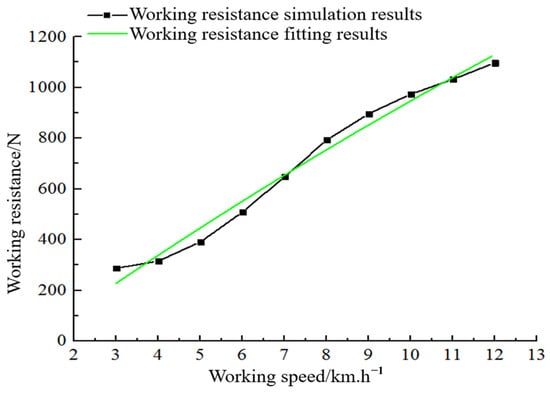
Figure 4.
The operation performance of the opener.
Table 2 shows the comparison between the opener’s resistance and soil disturbance before and after the speed increase. The data reveal that elevating the operational speed significantly increases both opener resistance and soil disturbance. This amplifies the traction mechanism’s power consumption, diminishes soil backflow during trenching, and ultimately leads to suboptimal performance and inadequate speed synchronization of the opener. Thus, optimizing opener parameters becomes a critical necessity to enhance operational efficiency.
Table 2.
Opener performance comparison.
3. Optimization Experimental Design of Trencher Parameters
3.1. Test Factor Level
During the experiment (with a depth of 5 cm and a speed of 7 km/h), it was observed that the penetration angle, the soil entry gap angle, shovel body width, and shovel length of the opener exhibit close correlations with the working resistance and the side dumping distance. The amount of the penetration angle influences the depth of soil penetration and the upward movement of soil along the upper surface of the shovel. The angle of the soil entry gap is linked to the support and reaction forces generated by the soil at the ditch bottom on the trencher, impacting soil reflux. The dimensions of the shovel’s width and length determine the contact area between the soil and the opener, consequently affecting soil flow behavior and the influence of the trenching region on the shovel handle. Consequently, considering all factors, the following were selected: the horizontal range of the penetration angle, 30°~50°; the horizontal range of the angle of soil entry gap, 3°~9°; the horizontal range of the shovel body length, 135 mm~165 mm; the horizontal range of the shovel body width, 20 mm~30 mm. See Figure 5.
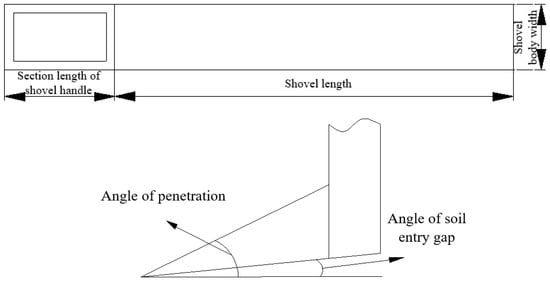
Figure 5.
Opener structure parameters.
3.2. Quadratic Regression Orthogonal Rotation Combination Experiment
With the condition of 5 cm depth and 7 km/h speed, employing the working resistance and the side dumping distance as the indicators, utilizing quadratic regression orthogonal rotation combination test method, optimizing the parameters group of the soil penetration angle, soil entry gap angle, shovel body width, and shovel length of the opener, and the levels of factors are indicated in Table 3.
Table 3.
Coding of factors and levels.
4. Parameter Optimization Test Results and Analysis
4.1. Regressive Analysis
We designed the experiment following the quadratic regression orthogonal rotating combination test criteria. The experimental design layout and results are shown in Table 4.
Table 4.
Experimental design layout and results.
4.1.1. Regression Equation
By performing multiple regression fitting on the experimental results, the regression equation for encoding work resistance of each factor can be obtained as follows:
Here, X1, X2, X3, and X4 are the penetration angle, soil entry gap angle, shovel body width, and shovel length, respectively.
4.1.2. Regression Model Analysis of Variance
The results of the variance analysis for the regression equation are shown in Table 5, and , (both values are more significant than ), indicating that each factor significantly influences the indicators, establishing a distinct relationship with working resistance. We observe that any poorly fitting items are not remarkable, because , (both values are less than ). This phenomenon illustrates the efficacy of the established equation, rendering it suitable for indicator analysis.
Table 5.
Variance analysis of regression equation.
4.2. Analysis of the Primary and Secondary Impacts of Various Factors
We analyze the regression model again after removing insignificant elements from the equation. The resulting regression equation of working resistance encoded by the factors is as follows:
Here, X1, X2, X3, and X4 have the same meanings as those in Formulas (2) and (3).
4.2.1. Intuitive Analysis
After encoding processing, each structural parameter has interval consistency, which can analyze the disturbance results of each parameter on the index under the same conditions.
In the regression model concerning work resistance, the order of the influence for the primary term is X4 > X1 > X3 > X2, while for the secondary term, it follows: X1 > X4 > X2 > X3. In the case of the regression model concerning side dumping distance, the order of influence for the primary term is X4 > X1 > X3 > X2, and for the secondary term, it is X4 > X2 > X3 > X1. However, the primary and secondary terms do not influence the indicators in a consistent order, and the monotonicity of the factors is not uniform within the coding intervals, so direct execution of the cumulative effects analysis is not feasible.
The variance analysis outcomes for working resistance and lateral soil throwing distance reveals the absence of interactions among the different factors. As shown in Figure 6. When the remaining factors are held constant at zero level, the disturbance curve for each structural parameter’s effect on the index can be derived. The curve’s slope signifies the extent of the impact that factor adjustments induce on the indicator. A steeper slope indicates a more pronounced influence, while a gentler slope signifies a less significant effect.
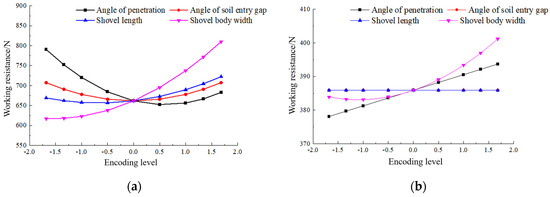
Figure 6.
Perturbation graphs of structure parameters; (a) working resistance disturbance diagram; (b) disturbance diagram of side dumping distance.
Fix other factors at the zero level and obtain the disturbance curve equation of the angle of penetration on the index as follows:
The disturbance curve equations of shovel body width on indicators are as follows:
The curvature of curve at the soil penetration angle coding level of 0.6 is zero, indicating minimal impact on the indicator around this point. The curvature of the curve at encoding level −1.56 is zero, and the curvature of curve at encoding level −1.13 is zero. Consequently, the disturbance caused by the shovel body width adjustment on the index remains relatively limited at these junctures.
Similarly, the disturbance curves for the shovel length and the angle of the soil entry gap can be obtained, facilitating an analysis of the index disturbance caused by the slope analysis factors.
As shown in Figure 6, our observations reveal that, for the angle of penetration values below the 0.6 horizontal, the resistance response exhibits a negative correlation with the angle of penetration, indicating a substantial disturbance on the indicator. Conversely, when the angle of penetration surpasses 0.6, the resistance response displays a positive correlation with a relatively minor disturbance. The angle of penetration demonstrates linear variation to the side dumping distance—greater angles correspond to increased side dumping distances. Shovel body width positively correlates with resistance response, with disturbance amplifying as the coding level rises. Soil disturbance response varying correlation relationship with shovel body width (confined within −1.13 levels). In contrast, the shovel body length and soil entry gap angle into the soil minimally disturbs the side dumping distance. Simultaneously, the working resistance exhibits a positive correlation with the shovel body length, whereas the angle of soil entry gap into the soil reveals both negative and positive correlations (restricted by the 0.1 level). The disturbance alteration remains comparatively slight. Despite the minimal disruption to indicators near coding levels of 0.6, −1.56, and −1.13, the penetration angle and shovel body width emerge as prominent disturbance sources across the entire coding level spectrum. The primary and secondary influence orders of these factors on indicators cannot be conclusively determined.
4.2.2. Main Effect Analysis
Considering the multiple nonlinear characteristics of the regression model, we employ the contribution rate to ascertain the relative importance of each factor, assessing the significance of different trencher parameters on working resistance. The results are shown in Table 6.
Table 6.
Importance of factors effecting the test indexes.
The data in Table 6 reveal a consistent influence of each factor on the two indicators, following the sequence: shovel body width, penetration angle, shovel length, and the angle of soil entry gap. Consequently, the effect of shovel body width on the index outweighs penetration angle, thereby establishing a foundation for optimizing trencher parameters.
4.3. Analysis of Factors Influencing Effects
4.3.1. Analysis of the Effect of Parameters on Resistance
We select three significant factors in the order of influence based on the regression model obtained above. Subsequently, a four-dimensional slice chart is employed to depict these factors’ effects on work resistance visually. Figure 7 illustrates the impact of penetration angle, shovel body width, and shovel length on the working resistance. The horizontal value aligned with the darker blue region represents the configuration of trencher structural parameters during the diminished working resistance.
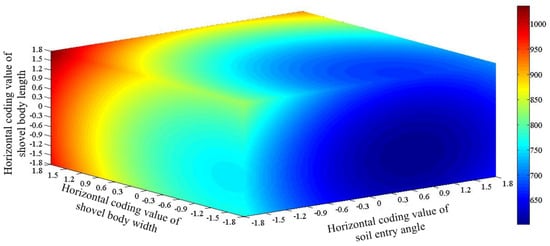
Figure 7.
The effect of test factors on working resistance.
Figure 7 reveals a consistent trend in the influence of the three factors on working resistance: as the penetration angle approaches the horizontal coding range of 0–1 significantly, the width and length of the shovel body decrease, leading to a reduction in working resistance. This can be attributed to reduced shovel body length, decreasing contact area between the ditch opener’s cheek surface and the soil, diminishing the friction and adhesion forces, and decreasing working resistance. A decrease in shovel body width diminishes the cutting resistance of the blade, shrinks the ditch’s area, amplifies the soil-building capability of the opener, reduces soil accumulation ahead of the shovel body, enhances soil fluidity, and reduces working resistance. With an increase in penetration angle, the upward movement of soil along the upper surface of the shovel body moderates, leading to reduced resistance. However, with a further increase in the angle, the initial cutting damage inflicted by the shovel body to the soil transforms into compression damage by the upper front surface of the shovel body. This transformation results in heightened resistance. Simultaneously, the impact of the soil on the shovel body increases, leading to an increase in working resistance.
4.3.2. Analysis of the Effect of Parameters on the Distance of Lateral Soil Throwing
Figure 8 illustrates the impact of the penetration angle and the shovel body width on the side dumping distance. The graph depicts a comprehensive trend regarding the influence of diverse parameters on the indicators: an escalation in the angle of penetration leads to an increase in lateral soil throwing distance. With an increase in the width of the shovel body, the side dumping distance undergoes a notable acceleration following a brief initial decrease. This phenomenon can be attributed to the diminishing cutting impact of the shovel blade as the penetration angle increases, causing a shift in soil damage from cutting failure to compression failure. This transformation intensifies the shovel’s impact on the soil and augments the side dumping distance. In the initial stage of widening the shovel’s body width, its effect on the side dumping distance remains relatively modest. Nevertheless, with further widening, the accumulation of soil in front of the shovel body escalates, leading to heightened soil expulsion after impact and subsequent augmentation of the side dumping distance.
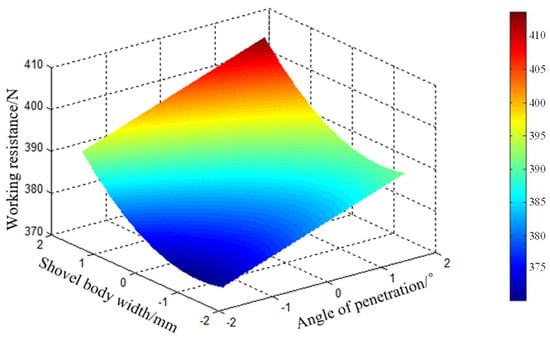
Figure 8.
The effect of test factors on side dumping distance.
4.4. Optimization of Structural Parameters of Ditch Opener
4.4.1. Parameter Optimization Analysis
In the context of sowing operations, it is imperative for the trencher to exhibit both low working resistance and minimal soil disturbance, ensuring an adequate volume of soil is restored during trenching. Consequently, we employ a comprehensive evaluation approach, overlaying the regression model of working resistance and side dumping distance based on a balanced weight ratio of 0.5:0.5 to derive the functional association between the comprehensive evaluation value and diverse structural parameters, as shown in Equation (10).
Setting the angle of penetration and the angle of soil to zero degrees horizontally yields response surfaces for each parameter with respect to the evaluation value, as shown in Figure 9.
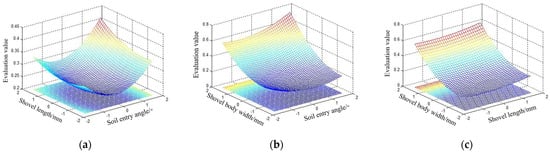
Figure 9.
Response surface of evaluation value. (a) Response surface of soil entry angle and shovel length; (b) response surface of soil entry angle and shovel body width; (c) response surface of shovel length and shovel body width.
4.4.2. Parameter Optimization Results
By adopting the minimum comprehensive evaluation value as the optimization objective, the response surface of the comprehensive evaluation value in Figure 9 is analyzed. We execute the conversion from the coding value to the actual value based on the correspondence between the coding value and the actual value during experimental design, refer to Equation (11). As shown in Table 7. It is feasible to obtain the optimal coding range and corresponding actual range for the trencher’s entry angle, shovel length, and shovel body width.
where is the actual value, is the encoded value, is the asterisk arm length, Xjr is the actual value of the factor upper limit, and is the actual value of the factor lower limit.
Table 7.
Opener structure parameters superior range.
The above comprehensive evaluation model was optimized and analyzed. The optimization constraints were minY1 (X1, X2, X3, X4), minY2 (X1, X2, X3, X4), and the variable interval was −1.682 X1 1.682, −1.682 X2 1.682, −1.682 X3 1.682, −1.682 X4 1.682. The optimal structural parameter combination of the trencher shovel body was obtained through optimization, as shown in Table 8.
Table 8.
Opener structure parameters optimal combination.
It is found from the table that the optimum values for shovel length and width fall within the horizontal coding range of each parameter linked to the least working resistance, which demonstrates strong consistency. Conversely, the optimal penetration angle does not match the obtained optimal range. To avoid excessive pursuit of the target optimum caused by the parameter value deviation from the actual, we fully consider the realistic factors and chose the penetration angle of 40° within the parameter’s optimal range, conducting multiple tests under identical conditions. The outcomes were compared with the test results attained under the optimal combination conditions, revealing relative errors of 3.67% and 1.2% for working resistance and side dumping distance, respectively, showcasing minimal disparity. Consequently, this study regards the optimal combination as the conclusive outcome in optimizing the trencher’s structural parameters.
Under the optimal combination conditions, the theoretically optimized result for the regression model on the working resistance of the ditch opener is 613.42 N, while the corresponding theoretical optimization result for the regression model regarding the lateral soil throwing distance stands at 389.12 mm.
4.5. Parameter Validation
As shown in Table 8, the parameter optimization test plan does not present the optimal parameter combination achieved through optimization. To verify the reliability of the response model and the derived optimal combination plan, the optimal parameter configuration obtained above (rounded to facilitate actual processing) is employed: penetration angle of 45°, soil entry gap angle of 6°, shovel body width of 21 mm, and shovel length of 142 mm. We executed three repeated tests and adopted the average outcome of these trials as the final test value. The experimental outcomes yielded a working resistance of 587.74 N and a side dumping distance of 385 mm. The relative deviations from the theoretical results of the regression model stood at 4.24% and 1.06%, respectively. This affirms the credibility of the derived theoretical regression model and the dependability of the optimal combination acquired through parameter optimization.
5. Performance Analysis of New Trencher
We conducted trenching experiments at various operating speeds and depths to assess the adaptability of the optimized new trenching device across diverse operational settings, facilitating the comprehensive comparison and analysis of the new trenching device’s drag reduction performance, soil disturbance impact, and trenching depth stability.
5.1. Analysis of Drag Reduction Performance of Trencher
The working resistance of the trencher, soil disturbance, and stability of the trenching depth are essential factors that affect the traction device’s power consumption and the trenching’s quality. Consequently, to authenticate the operational efficiency of the optimized trencher, trenching experiments were systematically executed across various operating speeds (6 km/h, 7 km/h, 8 km/h) and depths (3 cm, 4 cm, 5 cm). This comprehensive approach facilitated the evaluation and analysis of the trencher’s drag reduction capabilities, the impact of soil disturbance, and the stability performance.
5.1.1. Analysis of Drag Reduction Performance under Different Operating Speeds
At a depth of 5 cm and operating speeds of 6 km/h, 7 km/h, and 8 km/h, experiments were conducted on the original trencher and the optimized new trencher. Through a data collection and transmission system, the working resistance results of the two sets of trenchers at different operating speeds were obtained, as shown in Figure 10.
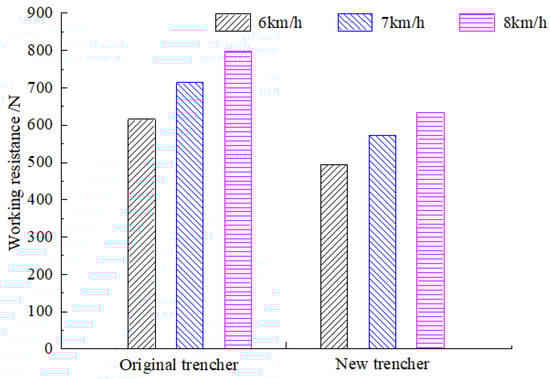
Figure 10.
The results of different operating speed on working resistance.
As shown in Figure 10. Experiments were conducted at a depth of 5 cm and operating speeds of 6 km/h, 7 km/h, and 8 km/h using both the original trencher and the optimized new trencher. The working resistance outcomes of the two sets of trenchers under diverse operating speeds were obtained through a data collection and transmission system.
When operating at 6 km/h, 7 km/h, and 8 km/h, the resistance of the new trencher decreased by 19.86%, 19.58%, and 19.76% compared to the original trencher. This finding suggests that the new trencher’s proficiency can significantly reduce working resistance compared to the original. A decrease in operating speed from 7 km/h to 6 km/h reduced working resistance by 14.05% and 13.72% for the new and original trenchers, respectively. Conversely, increasing the operating speed from 7 km/h to 8 km/h led to an elevation of the working resistance for the optimized trencher and the original trencher by 11.42% and 11.67%, respectively. This phenomenon can be attributed to the increased (decreased) operating speed, leading to a quicker (slower) loading velocity of the cutting force as the trencher interacts with the soil. As a result, there is a rapid increase (decrease) in load. Simultaneously, the increase (decrease) operating speed corresponds to an increase (decrease) in soil strength. Consequently, this leads to an increase (decrease) in the trencher’s working resistance. This observation underscores the commendable capacity of the new ditch opener in terms of drag reduction performance, particularly concerning operating speed.
5.1.2. Analysis of Drag Reduction Performance under Different Operating Depths
As shown in Figure 11, we conducted trenching tests with two sets of trenchers at a working speed of 7 km/h and depths of 3 cm, 4 cm, and 5 cm, acquiring the working resistance outcomes of the trenchers at varying depths.
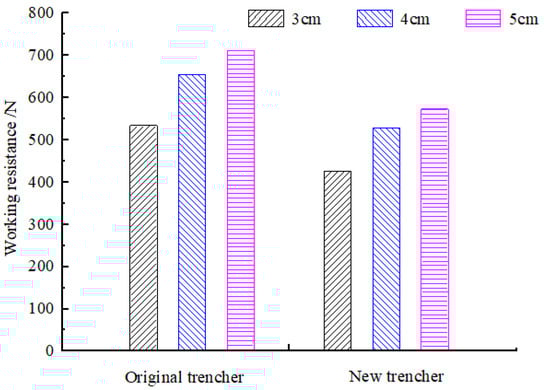
Figure 11.
The results of different operating depth on working resistance.
Under operating depths of 3 cm, 4 cm, and 5 cm, the new trencher demonstrated reductions in resistance of 20.24%, 19.29%, and 19.44%, respectively, compared to the original trencher. The new trencher experienced a relative reduction in working resistance by 25.72% and 7.94% as the operating depth decreased from 5 cm to 4 cm and 3 cm, respectively. In comparison, the original trencher displayed a relative reduction in working resistance by 24.61% and 7.77% under the same conditions. While the sensitivity of working resistance to operating depth remains relatively insignificant for the identical trencher type, the new trencher distinctly manages to reduce working resistance at equivalent depths when compared to the original trencher. This phenomenon can be attributed to multiple factors. The original trencher’s more considerable length and width primarily resulted in increased soil cutting and a larger trencher–soil contact area, consequently escalating resistance during trenching. However, the new trencher features an augmented soil penetration angle compared to the original. As the operating depth increases, the degree of shovel body sinking (or completely sinking) diminishes, weakening the soil’s upward movement along the shovel body’s upper surface. Additionally, the narrower width of the shovel body enhances the trencher’s soil-building capacity, leading to a reduction in working resistance.
5.2. Analysis of Soil Disturbance of Trencher
5.2.1. Analysis of Soil Disturbance at Different Operating Speeds
Different operating speeds have a certain impact on the distance of lateral soil throwing, as shown in Figure 12.
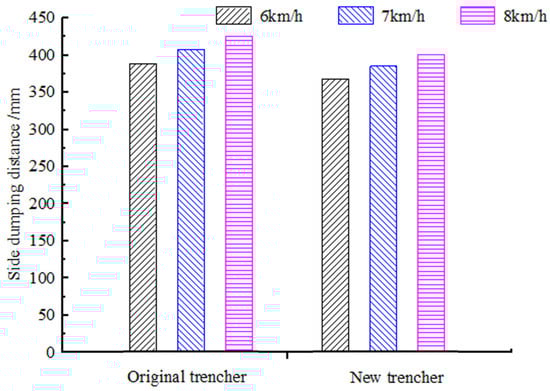
Figure 12.
Lateral soil throw under different working speeds.
At operating speeds of 6 km/h, 7 km/h, and 8 km/h, the new trencher reduces side dumping distance by 5.4%, 5.64%, and 5.87%, respectively, compared to the original trencher. Elevating the operating speed from 6 km/h to 7 km/h augments the side dumping distance by 4.62% and 4.88% for the new and original trenchers, respectively. Similarly, when the operating speed increases from 7 km/h to 8 km/h, the gap between the two side dumpings expands by 4.16% and 4.41%, respectively. Multiple factors can illustrate this phenomenon. Firstly, the increased operating speed intensifies the shovel’s impact on the soil, expanding the fan-shaped area and augmenting the side dumping distance. Additionally, the new trencher boasts a narrower width than the original trencher and has an increased penetration angle, promoting soil fluidity and mitigating soil blockage in front of the shovel body. Therefore, there is a relative decrease in the volume of impacted soil, reducing lateral soil throwing distance and mitigating soil disturbance.
5.2.2. Analysis of Soil Disturbance at Different Operating Depths
Different operating depths have a certain impact on the distance of lateral soil throwing. See Figure 13.
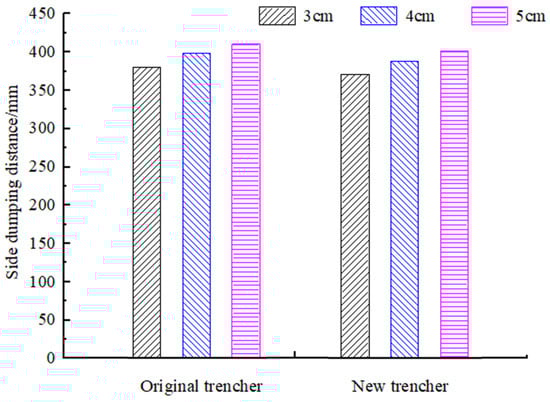
Figure 13.
Lateral soil throw under different working depths.
At operating speeds of 6 km/h, 7 km/h, and 8 km/h, the new trencher achieves reductions in the side dumping distances of 2.62%, 2.72%, and 2.43%, respectively, compared to the original trencher. Increasing the operating speed from 6 km/h to 7 km/h results in a 4.58% increase in the side dumping distance for the new trencher and a 4.72% increase for the original trencher. Similarly, the gap between the two side dumpings widens by 3.35% and 3.51%, respectively, as the operating speed escalates from 7 km/h to 8 km/h. Two primary factors can explain the observed phenomenon. Firstly, with the augmentation in trenching depth, the soil disturbance area expands horizontally and vertically, resulting in an amplified momentum of soil disturbance. Therefore, the impact of the shovel body triggers a wider fan-shaped spreading area, ultimately increasing lateral soil throwing distance. Secondly, the trencher’s optimized parameters, characterized by a narrower width than the original and increased soil entry angles, foster enhanced soil fluidity. In conjunction with the reduced soil rising along the upper surface of the shovel body and alleviating soil blockage in the front of the shovel body, this results in a relatively decreased volume of impacted soil. Consequently, this reduces lateral soil throwing distance and minimizes soil disturbance.
5.3. Stability Analysis of Trenching Depth
The stability coefficient of trench depth indicates the uniformity of trench depth, which affects the accuracy of seed placement during crop sowing and subsequently influences the growth and development of crops. Therefore, the stability coefficient of trench depth serves as a crucial parameter that highlights the trench opener’s efficacy and influences sowing quality. We remove the floating soil in the trench, select 10 measurement points at equal intervals along the working direction to measure the trench depth, and calculate the stability of the trench depth at the end of the experiment; refer to Equation (12). The stability of trench depth is shown in Table 9.
where is the stability of trench depth, is the mean value of trench depth, is the trench depth value for the ‘i’ measurement point, and is the measurement point.
Table 9.
Ditching depth stability analysis.
As shown in Table 9. The stability coefficient of trench depth diminishes with the increase in operating speed and depth across varying operating conditions. Notably, the stability coefficient of trench depth decreases significantly with heightened operating speed, indicating that changes in operating speed wield a substantial influence over trench depth. Under the same conditions, the stability coefficient of trench depth demonstrates minimal variance. This effect can be attributed to the narrower width of the new trench opener’s shovel body, which reduces soil cutting. Consequently, this diminishes the volume of failed soil blocks when subjected to stress wave effects. Such alterations influence the soil failure state within the stress concentration impact zone, thereby enhancing the overall stability of trench depth.
6. Conclusions
- (1)
- Through conducting a thorough examination of the trencher’s operational performance after a speed increment, a nonlinear escalation in working resistance became evident as the operating speed increased, notably within the range of 5 km/h to 9 km/h. Simultaneously, the heightened speed induced an expansion in the side dumping distance, consequently augmenting power consumption within the traction mechanism, diminishing the amount of soil replenished by the trencher, and resulting in poor matching between the trencher performance and speed.
- (2)
- Employing the quadratic regression orthogonal rotation combination test method, the optimal structural parameter combination for achieving low working resistance after the speed increase was determined using working resistance and side dumping distance as indicators. The resulting configuration comprised a soil penetration angle of 45°, soil entry gap angle of 6°, shovel body width of 21 mm, and shovel body length of 142 mm.
- (3)
- An assessment of the trencher’s drag reduction efficacy and soil disturbance across diverse operating speeds and depths revealed substantial reductions in working resistance and side dumping distance by the new trencher. Under different operating speeds, the drag reduction rate reached 19.86%, with a 5.87% relative reduction in the side dumping distance. Similarly, under distinct operating depths, the resistance reduction rate achieved 20.24%, coupled with a 2.72% decrease in the side dumping distance.
- (4)
- Examination of trench depth stability across various operating speeds and depths revealed that the change in the stability coefficient of trench depth is minor under the same conditions. Conversely, the stability coefficient of trench depth experiences a more pronounced decrease with heightened operating speeds across differing conditions, indicating the substantial influence of operating speed changes on trenching depth.
This study is still in the basic research stage, and the results of the study still have certain deficiencies:
- (1)
- When the operating speed is large, the soil disturbance is aggravated, and the side throwing distance is too large, which will affect the actual sowing effect. Therefore, it is necessary to continue to explore the problem of soil disturbance, and further optimize the structure of the opener to weaken the effect of soil disturbance on the basis of structural optimization.
- (2)
- Further research is needed on the physical characteristics of the seed bed created by the furrow opener, including soil water content, compactness, and crop growth characteristics at different periods of soil conditions.
Author Contributions
W.Z.: methodology, investigation, and writing—original draft. S.L.: investigation, methodology, and writing—review and editing. Y.J. and S.G.: writing—review and editing. L.Z. and Z.Q.: conceptualization and data curation. B.Z.: methodology and supervision. P.X., X.J. and Y.M.: conceptualization, data curation, methodology, and supervision. All authors have read and agreed to the published version of the manuscript.
Funding
This work was supported by the Xinjiang Uygur Autonomous Region Major Science and Technology Special Project (No. 2022A0200332).
Data Availability Statement
The original contributions presented in this study are included in the article, further inquiries can be directed to the corresponding authors.
Conflicts of Interest
The authors declare that the research was conducted in the absence of any commercial or financial relationships that could be construed as potential conflicts of interest.
References
- Song, W.; Jiang, X.; Li, L.; Ren, L.; Tong, J. Increasing the width of disturbance of plough pan with bionic inspired subsoilers. Soil Tillage Res. 2022, 220, 105356. [Google Scholar] [CrossRef]
- Jia, H.; Zhao, J.; Jiang, X.; Guo, M.; Zhuang, J.; Qi, J.; Yuan, H. Design and Optimization of a Double-Concave Rocker Seedmeter for Precision Seeding. AMA-Agric. Mech. Asia Afr. Lat. Am. 2015, 46, 29–34. [Google Scholar]
- Singh, K.P.; Agrawal, K.N.; Jat, D.; Kumar, M.; Kushwaha, H.L.; Shrivastava, P.; Tripathi, H. Design, development and evaluation of furrow opener for differential depth fertilizer application. Indian J. Agric. Sci. 2016, 86, 250–255. [Google Scholar] [CrossRef]
- Singh, S.; Tripathi, A.; Singh, A.K. Effect of Furrow Opener Design, Furrow Depth, Operating Speed on Soil Characteristics, Draft and Germination of Sugarcane. Sugar Tech. 2017, 19, 476–484. [Google Scholar] [CrossRef]
- Wang, Y.; Xue, W.; Ma, Y.; Tong, J.; Liu, X.; Sun, J. DEM and soil bin study on a biomimetic disc furrow opener. Comput. Electron. Agric. 2019, 156, 209–216. [Google Scholar] [CrossRef]
- Zhao, Y.; Wang, Y.; Yu, D. Study on the Effect of Double Discs Opener Structural Parameters on the Working Performance. J. Agric. Mech. Res. 2018, 40, 44–50. [Google Scholar]
- Jia, H.; Zheng, J.; Yuan, H.; Guo, M.; Wang, W.; Jiang, X. Design and experiment of profiling sliding-knife opener. Trans. Chin. Soc. Agric. Eng. 2017, 33, 16–24. [Google Scholar]
- Zhou, Z.; Dai, Y.; Qiu, W.; Hu, H.; Tao, Y.; Qin, Q.; Lei, X.; Ren, W. Design and experiment of a ditching device on the transplanting in ditch and seeding in ridge hybrid rice breeding machine. J. Hunan Agric. Univ. 2022, 48, 355–362. [Google Scholar]
- Jia, H.; Meng, F.; Liu, L.; Shi, S.; Zhao, J.; Zhuang, J. Biomimetic Design and Experiment of Core·share Furrow Opener. Trans. Chin. Soc. Agric. Mach. 2020, 51, 44–49. [Google Scholar]
- Zhao, J.; Lu, Y.; Wang, X.; Zhuang, J.; Han, Z. A bionic profiling-energy storage device based on MBD-DEM coupled simulation optimization reducing the energy consumption of deep loosening. Soil Tillage Res. 2023, 234, 105824. [Google Scholar] [CrossRef]
- Cao, X. Structural Optimization and Experimental Study of the Core Share Type Furrow Opener; Northwest A&F University: Xianyang, China, 2018. [Google Scholar]
- Zhao, S.; Tan, H.; Wang, J.; Yang, C.; Yang, Y. Design and experiment of multifunctional integrated seeding opener. Trans. Chin. Soc. Agric. Eng. 2018, 34, 58–67. [Google Scholar]
- Dilwar, S.; Baldev, D.; Mahesh, K.; Singh, S.K.; Rohinish, K. Development and evaluation of notched concave disc seed drill for direct seeding of wheat in paddy stubble field. J. Agric. Food Res. 2022, 10, 235–247. [Google Scholar]
- Aikins, K.A.; Antille, D.L.; Ucgul, M.; Barr, J.B.; Jensen, T.A.; Desbiolles, J.M.A. Analysis of effects of operating speed and depth on bentleg opener performance in cohesive soil using the discrete element method. Comput. Electron. Agric. 2021, 187, 106236. [Google Scholar] [CrossRef]
- Barr, J.; Desbiolles, J.; Ucgul, M.; Fielke, J.M. Bentleg furrow opener performance analysis using the discrete element method. Biosyst. Eng. 2020, 189, 99–115. [Google Scholar] [CrossRef]
- Qin, K.; Zhao, Y.; Zhang, Y.; Cao, C.; Shen, Z. Lateral stress and its transmission law caused by operation of a double-wing subsoiler in sandy loam soil. Front. Environ. Sci. 2022, 10, 986361. [Google Scholar] [CrossRef]
- Barr, J.B.; Desbiolles, J.M.A.; Fielke, J.M.; Ucgul, M. Development and field evaluation of a high-speed no-till seeding system. Soil Tillage Res. 2019, 194, 104337. [Google Scholar] [CrossRef]
- Solhjou, A.; Fielke, J.M.; Desbiolles, J.M.A.; Saunders, C. Soil translocation by narrow openers with various bent leg geometries. Biosyst. Eng. 2014, 127, 41–49. [Google Scholar] [CrossRef]
- Barr, J.B.; Desbiolles, J.M.A.; Fielke, J.M. Minimising soil disturbance and reaction forces for high speed sowing using bentleg furrow openers. Biosyst. Eng. 2016, 151, 53–64. [Google Scholar] [CrossRef]
- Solhjou, A.; Fielke, J.M.; Desbiolles, J.M.A. Soil translocation by narrow openers with various rake angles. Biosyst. Eng. 2012, 112, 65–73. [Google Scholar] [CrossRef]
- McLaughlin, N.B.; Campbell, A.J.; Owen, G.T. Performance of hoe and triple disc furrow openers on no-till grain drills in a fine sandy loam soil. Soil Tillage Res. 2019, 195, 104373. [Google Scholar] [CrossRef]
- Xi, X.; Gu, C.; Shi, Y.; Zhao, Y.; Zhang, Y.; Zhang, Q.; Jin, Y.; Zhang, R. Design and experiment of no-tube seeder for wheat sowing. Soil Tillage Res. 2020, 204, 104724. [Google Scholar] [CrossRef]
- Wang, L.; Liao, Y.; Zhang, Q.; Yao, L.; Yunkai, F.U.; Liao, Q. Design on Profiling Chisel Opener of Precision Broad Width No-tillage Planter for Rapeseed and Wheat. Trans. Chin. Soc. Agric. Mach. 2019, 156, 209–216. [Google Scholar]
- Liu, X.; Zhang, Q.; Liu, L.; Wei, G.; Xiao, W.; Liao, Q. Surface Optimization of Ship Type Ditching System Based on Differential Geometry and EDEM Simulation. Trans. Chin. Soc. Agric. Mach. 2019, 50, 59–69. [Google Scholar]
- Wei, G.; Jian, S.; Jianguo, W.; Fang, H. Current situation and prospect of conservation tillage technology in dry-farming areas of North China. J. Chin. Agric. Mech. 2019, 40, 195–200, 211. [Google Scholar]
Disclaimer/Publisher’s Note: The statements, opinions and data contained in all publications are solely those of the individual author(s) and contributor(s) and not of MDPI and/or the editor(s). MDPI and/or the editor(s) disclaim responsibility for any injury to people or property resulting from any ideas, methods, instructions or products referred to in the content. |
© 2023 by the authors. Licensee MDPI, Basel, Switzerland. This article is an open access article distributed under the terms and conditions of the Creative Commons Attribution (CC BY) license (https://creativecommons.org/licenses/by/4.0/).