Abstract
A new approach to model the motion of floating bushings in external gear pumps is presented in this article, where lubrication conditions have been introduced using dimensional analysis. This model is based on Bond Graph diagrams and has been experimentally validated in lab tests measuring the movement of the floating bushing inside the gear pump by means of laser micrometers. The novelty of this research is the creation of a simple and experimentally validated tool for the behaviour study of these types of pumps, which allows the simulation of a dynamic rigid solid in a fluid boundary with clearances of the order of microns, without using powerful CFD tools, with very short execution times, and using conventional computational tools. The qualitative behaviour of the model with respect to the experimental results is very similar, adjusting the numerical values with very acceptable accuracies by taking into account the precision of the experimental measurements, and allows us to use the model to interpret the volumetric and mechanical efficiency variations according the operating conditions.
1. Introduction
The behaviour of an external gear pump (EGP) is totally related to the movement of its floating bushing bearings (FBB). Therefore, a model is needed to understand these dynamics and explain the fluid dynamic phenomena which can be studied by means of ISO tests [1]. It can also be used to understand the motion of FBB in long real cycles, and hence, the fact that the simulation time would be fast is a great advantage to make it easily usable. For these reasons, the technique used to build the model is Bond Graph diagrams [2], which allow for the integration of the FBB model presented in this article within a pump model, creating a macro model, as was used in the work of Torrent et al. [3].
In Figure 1 the internal configuration of the reference EGP is shown. The FBBs are pressed against the gears by the outlet pressure acting on the rear area in red. In this way, the clearance between the gears and the FBBs decreases as the pressure increases, keeping the unit’s performance fairly high and constant. Lubrication studies in such complex domains are usually carried out using powerful CFD tools, with considerable computing equipment and very long simulation times. Examples include the work of Corvaglia et al. [4] on a three-dimensional model to measure pulsating flow, Thiagarajan et al. [5] on the effect of component surface roughness on lubrication, and Mithum et al. [6] on cavitation. A notable example of research on the complex interaction between fluid dynamics and the dynamics of the surrounding solid rigid under highly variable boundary conditions is the HYGESim software developed by Vacca and Guidetti [7].
However, this type of CFD simulation is not the route taken to create our FBB motion model. By applying dimensional analysis to the Reynolds equation, an analogy is made between the gear side gap lubrication and the sum of the effects of fixed-incline sliding bearing and parallel-surface thrust bearing. Undoubtedly, the originality of this work lies in this application of similarity. The calculation of lubrication in this domain obviously has no analytical solution, and powerful computational tools are required for detailed simulation. It is very difficult to solve the fluid dynamics when the contour is changing at high speed, with clearances in the order of microns. So, as in other similar cases in engineering, dimensional analysis is used to create a model. This is a method that makes it possible to reduce the number and complexity of the variables involved in describing a physical phenomenon, thus greatly facilitating its representation in experimental data, without losing relevant information. The application of this technique to gear pumps can be found in the study of the flow through very small grooves between curved surfaces in external and internal gear pumps by Rituraj and Vacca [8]. For example, solving the flow through two teeth in contact is difficult to address even with CFD tools. In this work, an identification of the dimensionless variables involved is carried out in order to create analytical models to be introduced in numerical studies.
As with any numerical model, and particularly in view of the hypotheses made during the model development, before using the model in real working cycles, it is necessary to validate it by comparing the results of the experimental tests in the laboratory (Figure 2) with the numerical simulation of identical working cycles. The pioneer of this type of measurement, Koç [9], used a capacitive transducer installed in a tooth to measure the clearance between the gear and the side plate. Based on the expertise of our laboratory, laser transducers are used to measure hydrodynamic film clearances by inserting small rods into the shaft and bearing bushing. This method, developed by Gutés [10] and Castilla et al. [11] to realise the journal bearing clearances, has been adapted to measure the lateral gap between the FBB and the gears, described in Torrent’s Ph.D. Thesis [12] and in the article by Torrent et al. [3].
In the experiments carried out, the thicknesses are always greater than 1 μm, an approximate value above which lubrication can be considered to be fully hydrodynamic, a hypothesis taken into account in the developed model. When working at very high pressures and low speeds, the minimum thickness between the FBB and the gears could be so small that it enters the area of elastohydrodynamic lubrication regime (order of 0.1 μm). In this case, it is necessary to take into account the superficial deformation of the lubricated surfaces. The film does not break and the load carrying capacity increases considerably with increasing oil viscosity. When the oil film breaks, partially or completely, it enters the boundary lubrication regime, creating contact between the asperities. Friction is independent of viscosity and depends on the chemical and physical properties at the molecular level of the surfaces. The wear caused by the fracture of these asperities is considerable, but the pump can operate for several milliseconds without total fracture. Eventually, as the load continues to increase, conditions of no lubrication are reached, causing the “metal-to-metal contact” and the consequent total failure of the unit. Good references for investigations beyond the purely hydrodynamic regime are Dhar et al. [13,14] and Thiagarajan and Vacca [15].
With respect to the previously published article of Torrent et al. [3], two notable novelties are introduced in this work. The first is to deepen into the dimensional analysis to consider the lubrication between gears and FBB as the sum of the effects of a sliding and a thrust bearing. The second is to include tilting modelling of the FBB in the Bond Graph instead of using experimental correlations.
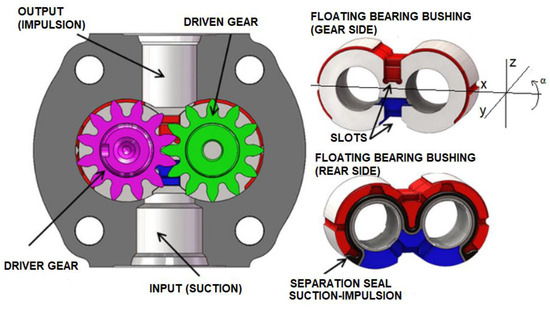
Figure 1.
Gear pump configuration (Source: Rundo [16]).

Figure 2.
Experimental setup of laser micrometres to measure the motion of the FBB (a) longitudinal position; (b) tilting position.
2. Solid Rigid Model
As can be seen in Figure 3, the floating bushings are balanced by the hydrostatic force due to the impulsion pressure on an effective surface Fp, the force due to the compression of the seal Fj and the force due to the viscous friction between the bushing and the housing Fr. In order to achieve equilibrium, the hydrodynamic forces due to the rotation of the gear face against the inclined face, named sliding force Wzhydr, and those due to the approach between the two surfaces, named thrust force Wzthrust, appear. In addition, there are the shaft forces supported by the journal bearings inserted in the bushing, which are not the same for the driver shaft Fe and the driven shaft Fe′.
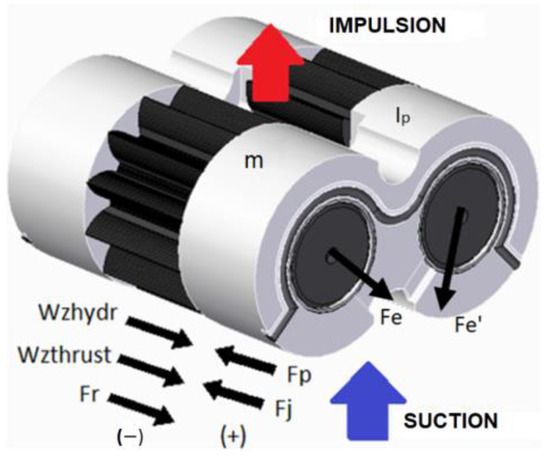
Figure 3.
Balance of forces in the floating bearing bushing.
The leakage of the pump is related to the clearance between the gear and the FBB, among others, and that this is defined by the longitudinal displacement of the plate and its inclination, as shown in Figure 4. Looking at Figure 5a, we can see that the movement of the FBB is completely three-dimensional. The hydrostatic force pushes the bushing towards the gear with a velocity uz and at the same time towards the suction zone with a velocity ux. As this force is not centred on the centre of gravity, it is tilted with respect to the y-axis, so that the clearance between the bushing and the gear is a priori smaller in the pressure zone than in the suction zone. Moreover, as the radial forces on the shafts are asymmetrical, the bushing tends to move in the direction of the y-axis at a speed uy, just as it tilts with respect to the z-axis at an angular speed ωz. Finally, the pressure distribution in the gap between the gear and the bushing is not symmetrical with respect to the x-axis, so it tends to tilt with an angular velocity ωx. Modelling this motion is therefore particularly complex.
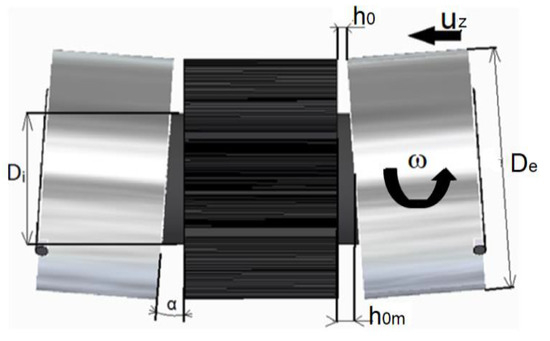
Figure 4.
Characteristic dimensions of the gear-bushing gap.
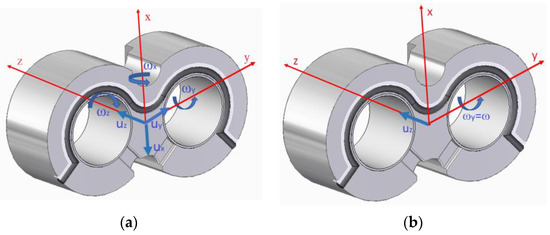
Figure 5.
(a) Real kinematics of the bushing; (b) simplified kinematics of the bushing.
Taking into account that it is often not necessary to consider any motion other than the tilting with respect to the y-axis (α) and the longitudinal movement with respect to the z-axis (h0m), the final kinematics to be studied are therefore shown in Figure 5b, the sum of a linear movement and a tilting, corresponding to those observed experimentally in the laboratory (described in Torrent et al. [3]). In fact, this simplification corresponds to most of the research on the subject.
The most interesting additional movement to include in the model in the future would be the movement of the FBB towards the suction zone as the pressure increases, this is the movement in the direction of the x-axis. Pressing the bushing against the housing causes an increase in the hysteresis of the movement of the plate in the direction of the z-axis, as explained by Thiagarajan et al. [5], and also the internal leaks in the unit are mostly in the turbulent regime at low temperatures, Torrent et al. [12]
Looking at Figure 2, the linear motion is determined by the balance of forces acting in the z-axis,
while the tilting movement is determined by the balance of torques
These are Mp (hydrostatic torque due to the hydrostatic force), Mj (torque due to the compressive force of the seal), Mr (torque due to the friction between the bushing and the casing), Mzhydr (hydrodynamic torque due to the force as a sliding bearing), and Mzthrust (hydrodynamic torque due to the force as a thrust bearing). If the face on the side of the gear is symmetrical to the y-axis, this torque is zero.
The model has been created using a Bond Graph diagram. This is a graphical representation of energy transfer and storage that can be applied to any physical system. Regarding hydraulic systems, which are basically treated with a model of concentrated parameters, a good summary can be found in De Las Heras and Codina [17]. A more comprehensive general work can be found in a complete classic such as Thoma [18].
Figure 6 shows the basic BG diagram of the bushing dynamics. As far as the balance of forces of the linear motion is concerned, all the elements of the upper node 1 share the flow variable, in this case the linear velocity, while the sum of all the efforts, in this case the acting forces, is equal to the product of the mass and the acceleration. The hydrostatic force is determined by the product of the impulsion pressure introduced by a modulated effort element MSe and the effective area Ae in the EfecArea transformer.
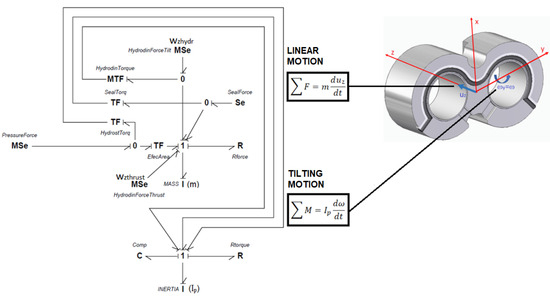
Figure 6.
Basic BG diagram of the FBB dynamics.
As far as the balance of torques is concerned, all the bonds of the lower node 1 share the flow variable, in this case the angular velocity, while the sum of all the efforts, in this case the acting torques, is equal to the product of the inertia with respect to the y-axis and the angular acceleration. It should be noted that all the torques are obtained by multiplying the forces by the distance from their centre of pressure to the axis passing through the bearing centres, operations carried out on the TF HydrostTorq, TF SealTorq and MTF HydrodinTorque transformers. The resistive torque due to the viscous friction between the bushing and the casing is represented by its own resistance Rtorque. Finally, a capacitive element C is considered to introduce into the system the tilting limitation due to the adjustment of the hydrodynamic bearings and shafts.
3. Forces and Moments Acting on the Rigid Solid
3.1. Hydrostatic Force and Torque Due to the Impulsion Pressure
Assuming that the suction pressure is zero, the areas directly affected by the impulsion pressure are analysed. The sum of all these areas gives us the so-called effective area Ae. Areas where the resulting force contributes to moving the FBB closer to the gears are considered positive, while areas where the resulting force contributes to moving it away are considered negative. Being that p is the pressure at the impulsion,
The zones to be considered are the following: the area above the seal that separates the output from the suction, shown as S1 in Figure 7a; the internal area between the teeth exposed to the impulsion pressure, shown as S2 in Figure 7b; the internal area between the teeth exposed to the pressure gradient, shown as S3 in Figure 7c; and finally, the area between the gears and the bushing side exposed to the pressure gradient, shown as S4 in Figure 7d. It is difficult to estimate the average pressure in this area, but in any case, the modelling carried out by Houzeaux and Codina [19] suggests that the average pressure may be of the order of a quarter of the working pressure. The resulting hydrostatic force on the FBB is therefore given by

Figure 7.
Areas and centres of pressure of the FBB under hydrostatic pressure: (a) S1 area above the seal that separates the output from the suction, (b) S2 internal area between the teeth exposed to the impulsion pressure, (c) S3 internal area between the teeth exposed to the pressure gradient, (d) S4 area between the gears and the bushing side exposed to the pressure gradient.
This effective area is completely determined by the design of the FBB. A design that maximizes the thrust against the gears will make a highly efficient pump by reducing the leakage, but at the same time may result in thickness values so low that the pump is very susceptible to oil film break-up due to pressure fluctuations, high temperatures, or the presence of dirt in the oil.
The calculation of this effective area is approximate because the areas S2, S3, and S4 vary as the gear point changes. A graphical calculation of these areas in different positions of the gears has shown that the variation is less than 5%. This variation of the internal surface also means that its centre of pressure is not on the x-axis, causing a tilt with respect to this axis that has not been taken into account as previously argued.
In order to calculate the hydrostatic torques, the centres of pressure of each of these areas (e1, e2, e3, e4) are taken into account. These distances have been calculated graphically, as shown in Figure 7. The resulting expression is therefore given by
3.2. Force and Torque Due to the Seal
It has been considered constant because the movement of the bushing (of the order of 30 μm at most) is negligible compared to the deformation of the seal during pump assembly (of the order of 0.5 mm). If the force required to compress the elastomer per unit length is 18 N/cm and the length of the seal is 108.4 mm, the resulting force is 195.1 N, as shown in Figure 8. The centre of pressure of this profile is 2.6 mm above the centre of the FBB. The torque is therefore positive, with a value of
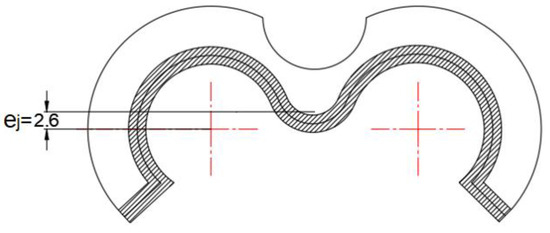
Figure 8.
Geometry of the suction-impulsion seal.
3.3. Friction Force and Torque Due the Bushing-Housing Clearance
Under normal lubrication conditions, the FBB floats in the housing and its movement is therefore damped by the corresponding viscous friction. Looking at Figure 9, the average clearance is approximately 15 μm, and the perimeter in red line has a length of 150.14 mm and a width of 20 mm. The surface S to be considered is therefore 3002.8 mm2. The linear resistance Rforce is always negative and can be calculated as follows
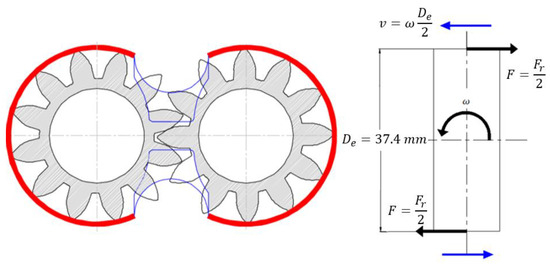
Figure 9.
Damping due at the friction bushing-casing.
With regard to the torque damping the tilting movement, the effect of two forces equal to half of Fr applied to the outer radius has been considered. Considering the outer radius De, the speed at the periphery when FBB is only tilting is
and the resistive torque is proportional to the angular velocity of the bushing.
This uniform gap around the circumference could be questionable as the FBB is pushed to the suction zone by the outlet pressure. This effect, not considered in this study, is discussed in detail by Thiagarajan et al. [20].
3.4. Hydrodynamic Forces and Torques
Both the hydrostatic and seal forces move the FBB towards the gears, with a minimum clearance in the output zone due to the inclination. Obviously, considering only the hypothesis of hydrodynamic lubrication, the load carrying forces must be generated by the pressurisation of the space between the FBB and the gears.
3.4.1. Reynolds Equations
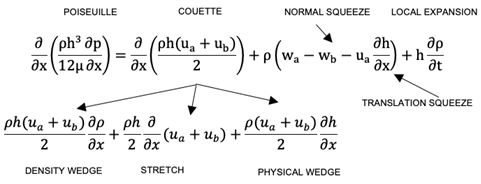
Equations developed by Reynolds [21] govern these types of phenomena and are derived by applying the principles of conservation of mass and momentum to a control volume. Figure 10 shows the two-dimensional motion of an inclined surface with respect to another plane. Neglecting flow perpendicular to the plane of the paper and assuming zero leakage, the Reynolds equation is expressed as Equation (13).

Figure 10.
Mass flow through rectangular section (Source: Hamrock et al. [22]).
A good explanation of these mechanisms can be found in Hamrock et al. [22]. Basically, the pressure within the film increases to maintain continuity of flow. The density wedge term and the local expansion in Equation (13) are not considered in this research as the density is assumed to be constant. However, the temperature variation within the film is taken into account when calculating the viscosity. When considering rigid solids, there are no changes in the surface velocity, and therefore the stretch term is not considered either. Therefore, the analogy leads to the dominant lubrication mechanisms at the gear-bushing interface being due to the motion of a flat surface relative to an inclined surface (physical wedge term) and the normal motion of both surfaces (normal squeeze term). Both cases have analytical solutions, termed the fixed-incline sliding bearing and the parallel-surface squeeze film bearing (thrust bearing), which are incorporated into the developed model.
3.4.2. Identification of Parameters
Looking at Figure 11a and taking into account an area differential dS of the flat side of the gear, the hydrodynamic pressure generated by the physical wedge is due to the relative speed with respect to the inclined side of the FBB. The calculation of the carrying capacity is obtained by integrating the product of the pressure and the area differential. Therefore, each dS can be treated as a sliding bearing between two flat surfaces with a relative inclination, as shown in Figure 11b. The lift force wz per unit width for a pad length l depends on the oil viscosity μ, the relative speed between the surfaces ub, the height of the wedge sh, and the minimum thickness h0. Then,
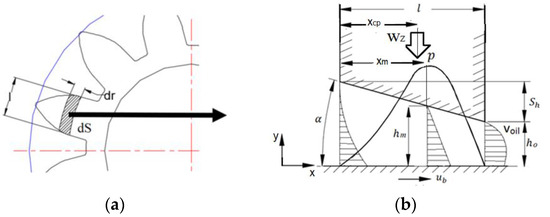
Figure 11.
(a) Sliding bearing formation in a gear tooth, (b) ideal sliding bearing.
Considering that the oil film is governed by this phenomenon, the similarity between this domain and two hydrodynamic sliding bearings is made as shown in Figure 12. The principle of dimensional homogeneity states that if f is a force per unit length, the variables involved must be combined to make it so. Buckingham [23] showed through the π theorem that the only way this can happen is if each term of f is a monomial formed by the product of the powers of the variables.
where the proportionality constant kd is dimensionless and a, c, d, and e are constants to be determined. Considering that the analytical study of the sliding bearing is usually carried out per unit width, and therefore wz has dimensions of {FL−1} = {MT−2}, the dimensioning of the equation must satisfy
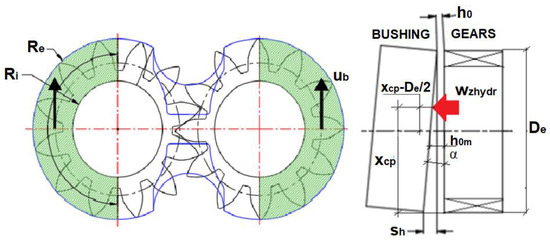
Figure 12.
Similarity between gear-bushing lubrication and two ideal sliding bearings.
The original problem is defined by five variables. Applying the π-theorem and considering that three fundamental quantities (M, L, T) are involved, it can be reduced to 5 − 3 = 2 dimensionless variables. This equation is solved by searching for the most common solutions in the tribology bibliography. The two dimensionless variables obtained are
where H0 is the minimum dimensionless thickness and Wz is the dimensionless load-bearing capacity.
Dimensional analysis does not determine the form of the function f, which will be found from the analytical solution of a fixed-incline plain bearing. Later, experimental laboratory data will be used to determine the constant Kd, which is called the sliding form factor.
The dimensional theory is not applied to the load bearing thrust bearing because there is a simple analytical solution. In any case, we also use a thrust form factor, Kt, which has a purely geometrical meaning.
3.4.3. Dimensionless Analytical Solution of Ideal Sliding Bearing
A carrying-load force acts as a physical wedge in the domain under consideration due to the relative speed of the flat face of the gears with respect to the inclined face of the bushing. An analogy is made between this phenomenon and an ideal sliding bearing, as shown in Figure 11. Therefore, hydrodynamic pressures are generated between the two surfaces, balancing the impulsion pressure on the effective surface and the compression of the back seal. Below is a simplified representation of the analytical solution taken from Hamrock et al. [22] which is used to calculate wz and determine the form of Equation (20).
The Reynolds Equation (13) can be simplified by taking the density constant into account, leaving only the term due to the physical wedge. Considering an average velocity between the surfaces ub
In order to be able to compare the results with other correlations, we will work with the following dimensionless terms derived in Section 3.4.2. This allows the use of much simpler expressions by minimizing the number of variables,
and Equation (21) can be written as
Solving it,
Then, the dimensionless carrying-load force is calculated as
with the following result
Taking into account that
the centre of pressure is calculated as
The variation of Wz with respect to H0 is shown in Figure 13a, where it can be seen that when H0 tends to 0, the bearing has a high capacity to support normal loads. This decreases when assumptions such as negligible lateral flow, very smooth surface, s and constant density are not perfectly met. The form factor Kd would take these effects into account in our case.
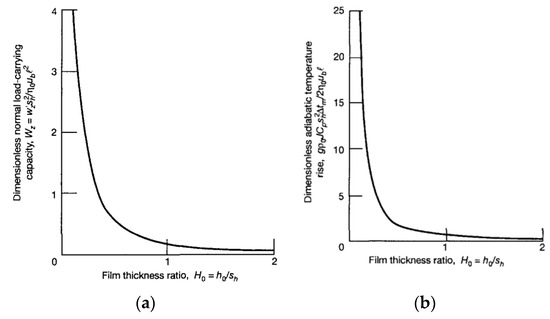
Figure 13.
(a) Dimensionless carrying-load force, (b) dimensionless centre of pressure, versus H0 (Source: Hamrock et al. [22]).
Figure 13b shows the effect of the dimensionless minimum thickness H0 on the dimensionless centre of pressure Xcp. It can be seen that for high dimensionless minimum thicknesses, i.e., with a wedge height reduced with respect to the minimum thickness, the centre of pressure is almost in the centre of the bearing. Translated to the case studied, if the bushing is slightly inclined, the tilting capacity of the oil film due to the hydrodynamic pressure generated as a plain bearing is minimal. The characteristic length of the equivalent bearing for calculating the centre of pressure is the outer diameter of the gear De.
3.4.4. Dimensionalization of Force and Torque as Sliding Bearing
From Equation (25), the dimensional load capacity can be calculated as
Assuming that the dimensionless force per unit length is uniform, Figure 14 shows different areas of the space between a gear and the side of the bushing. Zone 1, the annular surface between the shaft and the foot of the gear, and zone 2, the lateral surface of the teeth, contribute to the load carrying force because the surface of the gear moves in the convergent direction of the wedge. This does not happen in zone 3, which moves in a divergent direction, so it does not contribute to the load capacity, while in zone 4, located in the lateral grooves, there is no lubricating film. Not all the surfaces of zones 1 and 2 have the same inclination in the direction of speed, since near the impulsion and suction ports the relative speed of the gear is perpendicular to the direction of inclination, and therefore, no hydrodynamic pressure is generated. For example, teeth 1 and 7 do not generate any lift, while 4 generates the maximum load carrying force. In the drawing, the path of a surface differential dS in zone 1 and zone 2 is indicated with a black line, while the red line indicates the average inclination. The first behaves like a continuous bearing, while the second corresponds to a series of interlocking bearings.
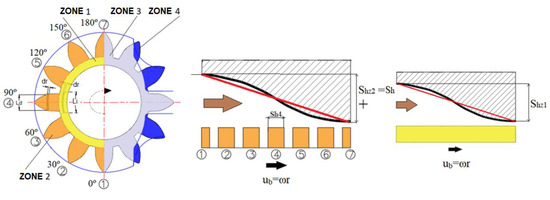
Figure 14.
Contribution of the different areas to load-carrying force.
For zone 1 in Figure 14, if the wedge height is varied as shown by the red line, the force differential made by the surface differential dSz1 is
where shz1 is the height of the wedge in zone 1. Considering a 180°, the length and speed of this bearing differential is
where ω is the angular velocity of the gears. So
The dimensionalized force generated by the two gears can be written as
where Rpeu is the gear foot radius and Ri is the shaft radius. Integrating it,
while the height of the wedge in zone 1 is given by
Therefore, if Equation (35) is substituted into Equation (34), the total load capacity in zone 1 is given by
Regarding zone 2 in Figure 15, the load carrying differential of force generated by the tooth 4 of zone 2 is
where for a radius r, Ldi, and ubi have the same value for any tooth. So
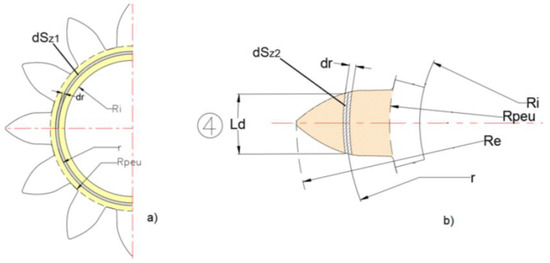
Figure 15.
Surface differentials considered: (a) zone 2, (b) tooth 4.
The wedge height of dSz2 could be determined by the ratio between the tooth thickness and the outside diameter of the gears multiplied by the wedge height of the similar bearing considered.
Equation (37) can then be written as
and integrating
Simplifying
Assuming that the load capacity is linearly dependent on the inclination,
The contribution of all the teeth in zone 2 of the two gears to the load capacity is
The final expression is therefore
Considering zone 1 and zone 2, and not taking into account the divergent film of zone 3, the total load capacity is given by
Considering that Re=18.7·10−3, Rpeu=14.09·10−3, and Ri=10·10−3 metres,
To apply the similarity with two ideal sliding bearings, a form factor Kd is considered according to Equation (20), which includes, for example, the effects of radial leakage. This factor allows the model to be defined on the basis of experimental results, a strategy used in engineering when dimensional analysis is applied. Therefore, in the final model, the load carrying force is calculated as
and the torque exerted by this force against the tilting tendency is
3.4.5. Hydrodynamic Force as a Thrust Bearing
As the FBB moves axially, hydrodynamic pressure is generated to force the fluid out of the film (normal squeeze in Equation (13)). Although this force does not exist in the equilibrium position, its effect makes it difficult both to approach the gear when the working pressure increases and to move away from it when it decreases, and it is therefore important to take it into account when studying the movement of the FBB. Applying a similar point of view to the sliding bearing, the analogy is shown in Figure 16. This is a bearing with parallel flat surfaces without lateral leakage, where surface A corresponds to the side of the stopped gears and surface B corresponds to the lateral surface of the FBB moving orthogonally. This configuration also has an analytical solution, which can be derived from the Reynolds equation.
where v is the relative axial speed and h0m is the distance between the two faces, taken at the centre of FBB. Taking into account
where wz′ is the carrying load capacity per unit width. Considering two gears and a width b is equal to the difference between the outer and inner radius,

Figure 16.
Analogy with a thrust bearing with parallel flat faces: (a) real thrust surface, (b) considered thrust surface, (c) sliding bearing analogy.
Therefore, a thrust form factor Kt is considered, taking into account only the real surface of the gear, the orange area in Figure 16a, and the surface ratio between the ideal bearing on which the analytical solution was based, the green area in Figure 16b. The final expression is
Due to the great symmetry of the lateral surface of the FBB with respect to the y-axis, the hydrodynamic torque generated by this thrust force is not taken into account. Considering that Re = 18.7 × 10⁻³ and Ri = 10 × 10−3 metres, the expression 7.86 remains as
It should be noted that this force only acts when the floating bushing moves towards the gear, either in a positive direction, reducing the thickness, or in a negative direction, increasing it. Therefore, in order to experimentally determine the percentage of the real thrust force with respect to the theoretical one, it is not sufficient to compare the position of the experimental position of the floating bushing with respect to the simulated one, as was performed in the case of the sliding shape factor as sliding bearing. It would be necessary, for example, to see how the movement of the floating bushing is damped in case of a sudden increase in pressure, by monitoring its position vs. time. These types of experimental results are not available and it would be very interesting in the future to carry them out in order to find the true value of the shape factor as a thrust bearing Kt, as this is the percentage of the real thrust force compared to the theoretical one.
4. Complete BG Diagram
Figure 17 shows the complete BG diagram of Figure 5, fully developed, taking into account equations presented in the previous sections. The data are entered via an EXPDATA file in .csv format, which the 20SIM software [24], a modelling package for mechatronic systems widely used in the simulation of oleohydraulic systems, reads by temporarily interpolating a working cycle of 3 s, in which the pressure is increased by 10 bar every 0.1 s until it reaches 150 bar, and then reduced until it reaches 0 bar. In this way, the numerical test corresponds to the experimental test carried out in the laboratory, making it possible to compare the average distance h0m and the minimum clearance h0, as well as the angle of inclination TILTgr1 (α) (in fact, the experimental cycle was not carried out so quickly, but a longer experimental cycle does not affect the final results).
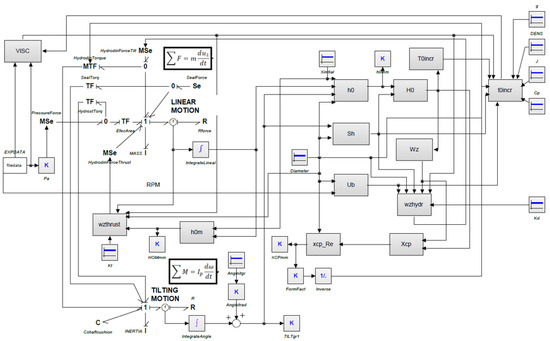
Figure 17.
Complete BG diagram of the FBB motion.
An initial separation and inclination between the plate and the gear is introduced into the model in the Xinitial and AnglinitGr constant blocks. Although the model will always end up in equilibrium if the initial values entered are of the same order of magnitude as the real ones, in order to make comparisons with the experimental results in each simulation from the first moment, we introduce initial values equal to those at the beginning of the experiment. In this way, the minimum clearance h0 is determined by means of the following expression
where x is the displacement of the FBB from its initial position (obtained by integration in the IntegrateLineal block) and α is the tilting angle (obtained by integrating the velocity of node 1 in the IntegrateAngle block). The wedge height Sh is given by
and the mean distance between the FBB and the gear as
4.1. Treatment of the Hydrodynamic Shaft Bearings
It should be noted that the inclination of the bushing also depends on the stiffness of the hydrodynamic journal bearings, and it is therefore necessary to introduce the influence of the corresponding oil cushion into the model. This motion is very complex and has been discussed in detail by Gutes [10]. In the first simulations carried out, it was found that this is the basic mechanism that limits the tilting of the plate, since the centre of pressure of the lifting force as a sliding bearing is quite close to the centre of the FBB, due to a small value of its inclination.
If we look at Figure 18, the clearance between the shafts and the journal bearings can be represented as an oil cushion that prevents tilting by means of two forces Fc, each caused by a compressibility between the radial hydrodynamic bearing of the FBB and the gear shaft. By solving for the effect of the compressibility of the oil trapped in this small clearance, it can be demonstrated that
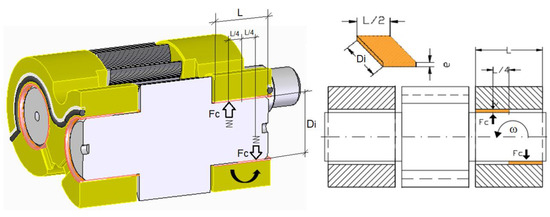
Figure 18.
Illustration of the hydraulic stiffness of the shafts.
Consequently, the compressibility introduced into the model is
Taking a compressibility coefficient β = 1.5 × 10⁹ Pa, a plate length L = 0.02 m, a shaft diameter of Di = 0.02 m, and an average film thickness of e = 30 μm, we obtain an equivalent compressibility of C= 6.6 × 10⁻⁷ s2/(kg·m2). In any case, considering that the complexity of the phenomenon is much greater than the one mentioned above, this value is only taken on as a reference, and can be modified by adjusting of the numerical and experimental test results.
4.2. Treatment of the Viscosity
The VISC block in Figure 17 calculates the dynamic viscosity within the film between the gear and the bushing. The oil is of type HM VG32 and a regression of its viscosity value as a function of temperature and pressure is carried out according to the following criteria proposed by Barus [25],
where A, B, C are the terms of the viscosity versus temperature and pressure regression fitted by minimizing the squared errors over the temperature and pressure range of our experiments, i.e., from 20 °C to 50 °C and from 0 to 150 bar, respectively.
To find the increase in temperature of the oil inside the film Δtm, the expression derived in Hamrock et al. [22] is used by calculating the dimensionless temperature T0incr in the sliding bearing, assuming that all the dissipated power is absorbed by the fluid in adiabatic conditions.
where ρ is the density of the oil (Kg/m3), Cp is the specific heat at constant pressure (1670 J/kg·°C), Sh is the height of the wedge (m), μ is the viscosity (Pa·s), ub is the sliding velocity of the bearing (m/s), and l is its length (m). Therefore, in the T0incr block of the BG diagram, the temperature rise in the film can be calculated as follows
Finally, in VISCblock, we have
5. Results
The first series of numerical experiments were carried out with the pump operating under the same conditions as the experimental tests, with the basic aim of optimizing the shape factor as a sliding bearing Kd. The minimum plate thickness h0 and its slope α were plotted against the pressure at constant speed and compared with the experimental results, in which data are entered in the EXPORT DATA file. The simulation is based on the continuous increase and decrease in the pressure during the cycle, whereas in the experimental test the pressure was varied in steps to allow the laser micrometers to stabilise, but it has been verified that the equilibrium points of the FBB are the same both with continuous variations and with steps, showing graphs without instabilities in the first case. For this reason, the reproduction of the test cycle was carried out with a continuous variation of the pressure. The tests are carried out at 1000, 1500, and 2000 rpm and at oil temperatures of 20 and 50 °C.
In the graphs of Figure 19, the dark blue line corresponds to the numerical results of the minimum thickness, while the red line corresponds to the experimental results. The pink line corresponds to the numerical results of the inclination, while the light blue line corresponds to the experimental results of it. The dimensionless minimum thickness and the height of the wedge are monitored, an example of which is shown in Figure 20. Finally, the forces and torques involved in the FBB balance can be observed in Figure 21.
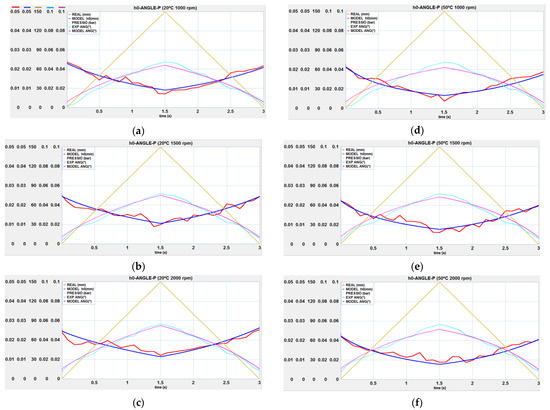
Figure 19.
Minimum thickness h0 and inclination α versus pressure: (a) 20 °C 1000 rpm; (b) 20 °C 1500 rpm; (c) 20 °C 2000 rpm; (d) 50 °C 1000 rpm; (e) 50 °C 1500 RPM; (f) 50 °C 2000 rpm.
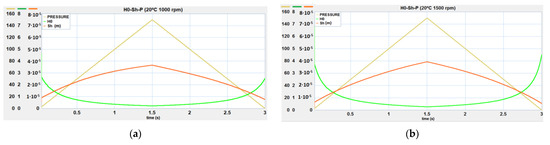
Figure 20.
Dimensionless minimum thickness H0 and the height of the wedge Sh versus pressure: (a) 20 °C 1000 rpm; (b) 20 °C 1500 rpm.
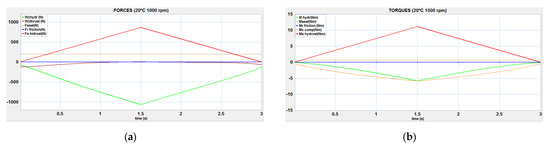
Figure 21.
Balance of forces and torques in the FBB: (a) 20 °C 1000 rpm; (b) 20 °C 1500 rpm.
The exercise of introducing the experimentally measured pulsating pressure into the model was also carried out, both at 50 and 100 bar, and the results of the numerical simulation at 70 °C are shown in Figure 22. The purpose of this analysis is to show that the pulsating motion of the FBB is damped to the point where it is almost negligible. It can be seen that the damping of the hydrodynamic thrust force, together with the viscous friction between the FBB and the casing, causes a damping in the conversion of pressure pulsation into vibration of the solid rigid.
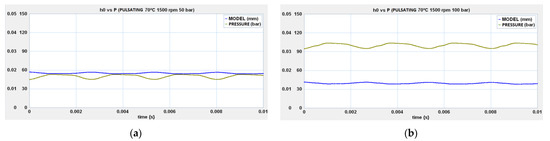
Figure 22.
Movement of the FBB in relation to pressure pulsation: (a) 70 °C 1500 rpm 50 bar; (b) 70 °C 1500 rpm 100 bar.
6. Discussion
An original solution has been presented for modelling the lubrication between the FBB and the gear, to monitor its movement in real time as the pump’s operating conditions change. Therefore, by applying parameter identification based on dimensional analysis, the analogy with the lubrication of a sliding bearing with inclined flat faces and that of a thrust bearing with parallel flat faces has been considered. Based on the analytical solution of these cases, a BG model has been created with the aim of making it work together with the pump model presented in Torrent et al. [26]. The model fits exactly (bearing in mind that the precision of the instruments used to experimentally measure the thickness of the oil film is +/− 2 μm) and, most importantly, is used to illustrate specific behaviours such as the hysteresis of the FBB motion observed in the experimental results, which translates into a volumetric efficiency of the pump also with hysteresis. Note, for example, that in the graphs of Figure 23, the value of the minimum thickness at P = 0 is not the same for increasing pressure (time t = 0 s) as for decreasing pressure (time t = 3 s).
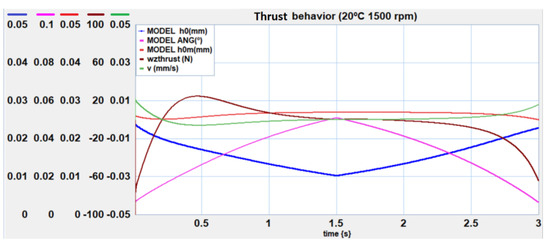
Figure 23.
Force behaviour as a thrust bearing.
For modelling, it is necessary to introduce two form factors. The thrust bearing form factor is basically geometrically justified and was left fixed in all the tests due to the lack of information to evaluate it. This lubrication mechanism operates only when there is a normal relative speed between the plate and the gear, so it does not affect the balance position. Figure 22 illustrates this behaviour, noting that at the beginning of the movement there is an approach of the centre of the FBB to the gear (h0m), at the same time as its inclination increases. Around the time of 1 s (50 bar), the position of the centre stabilises and the minimum thickness (h0) decreases due to the effect of the inclination. The FBB also tends to move its centre away from the gear as the inclination continues. From the time of 2.5 s (50 bar depressurized), the FBB loses its inclination by increasing the minimum thickness, but the mean thickness increases, creating a negative force that attaches the FBB to the gear. Therefore, the damping of the motion due to the thrust bearing behaviour occurs when there are pressure changes and these are not excessive, approximately below 100 bar. Above this pressure, the position of the FBB centre remains virtually constant and the minimum thickness varies only as a result of the change in slope. At high pressures, a very small thickness is not required because the inclination is greater, while at low pressures the FBB is almost parallel to the gear. This effect is perfectly illustrated by the evolution of the wedge height (Sh) and the dimensionless minimum thickness (H0) in the graphs of Figure 20.
The behaviour of the shape factor Kd as a sliding bearing is difficult to explain. Approximate values of 0.07 (real load-carrying force is 7% of that of the analogue bearing considered) correspond to the results of the tests at 20 °C, while values of 0.2 correspond to the tests at 50 °C. The model includes accurate correlations of viscosity with pressure, so that this dispersion can only be due to the fact that the viscosity inside the film is not accurately known. Everything seems to indicate that the rise of temperature rise inside the film is lower than the rise of temperature in the suction port.
Once the minimum thickness has been reduced as the pump is pressurized, small variations in this will result in significant increases in the load carrying capacity. It should be noted that the minimum thickness and the force as a sliding bearing show a remarkable proportionality, which means that the equilibrium position is undoubtedly determined by the lubrication in the area considered. This is not the case for the tilting of the FBB, since the torque resulting from the displacement of the centre of pressure as a sliding bearing cannot compensate for the torque exerted by the hydrostatic forces, so the tilting must be limited by adjusting the shaft inside the journal bearings, whose rigidity is taken into account in the model by means of a capacitor. Approximately 60% of the tilting lift is exerted by the hydrodynamic force and 40% by the stiffness of the journal bearings. At pressures up to approximately 120–140 bar at 20 °C and 70–80 bar at 50 °C, the lifting moment exerted by the stiffness of the axles is greater than that exerted by the hydrodynamic force as a sliding bearing.
The goodness of the model is confirmed by the good correlation between the measured and simulated values of the thickness in different operating conditions. Furthermore, the results are comparable with those obtained by other authors, although it must be taken into account that the pumps are not always of the same size and that the same type of oil is not used. The order of magnitude of the minimum thickness is approximately the same (6–12 µm depending on the operating conditions), referring to the works of Borghi and Zardin [27] and Koç [9]. While in the work of Borgui and Zardin the FBB is inclined towards the suction side, in the experimental tests and the simulation of the reference pump of this research, the inclination is towards the impulsion side, as in the study of Koç. This is essential for the correct operation of the hydrodynamic wedge that forms the side face of the gears with the FBB, since a decrease in the thickness of the film in the direction of movement is necessary for a lifting force to appear, which does not happen if the FBB is poorly compensated and the inclination is towards the suction side.
Similar to the experimental data, the model shows hysteresis in its behaviour. This phenomenon is also present in the volumetric performance of the pump. Although a possible explanation would be to attribute it to the well-known “stick-slip”, it is considered to be a new explanation. At the beginning of the movement, when the plate is flat, it tends to tilt rapidly at the same time as its centre approaches the gear, as early explained. Above a certain pressure value, this minimum thickness even begins to increase slightly as the FBB continues to tilt. The speed in Equation (56) is negative and the force generated in the lubricating film tends to cause the FBB to stick to the gear. The same phenomenon occurs when the maximum pressure is reached and therefore the tilt is maximum. This decreases as the FBB moves away from the gear, its centre remains approximately stationary and no force is generated by the thrust bearing action until a pressure of about 50 bar is reached (see Figure 22). Up to this pressure, the plate is supported only by the force generated as a sliding bearing, which keeps the average thickness approximately constant. Therefore, the inclination should be slightly greater and the minimum thickness smaller. The equilibrium position is different depending on whether the pressure is increasing or decreasing. This phenomenon would explain the fact that when the pump is suddenly depressurized, there is a peak flow (Torrent et al. [26]). Due to the hysteresis explained above, the FBB remains attached to the gear instead of separating, significantly reducing leakage and increasing the volumetric efficiency of the pump. In any case, as shown by Thiagarajan et al. [20], it also seems clear that the fit of the FBB to the casing generates frictional forces that create hysteresis in the axial compensation system. This is a phenomenon that should be evaluated in future extensions of this Bong Graph model.
7. Conclusions
A simple, accurate, and most importantly, very fast tool, has been constructed to determine the movement of the floating bushing bearings (FBB) in order to interpret the behaviour of an external gear pump in different working cycles. The theory of dimensional analysis has been used to make an analogy of the lubrication in the space between the FBB and the gears with the effects of a sliding bearing with inclined faces and a thrust bearing with parallel faces. The results of the numerical simulation were compared with the experimental results in order to validate the model, and the qualitative behaviour is very similar, adjusting the numerical values with accuracies between 5 and 10%, and thus more than acceptable taking into account the precision of the experimental measurements.
The usefulness of the proposed model has been widely demonstrated. The first example was to explain the hysteresis of the movement of the FFB due to the appearance of a force as a thrust bearing which cushions the separation or approach of the FFB to the gears in the event of a sudden depressurisation or pressurisation of the pump. Another notable example of its applicability has been the demonstration that the pulsating component of the working pressure has a minimal effect on its movement and does not cause it to vibrate. It has also been shown that a relative inclination between the side face of the gears and the FBB is necessary to create the hydrodynamic wedge required to generate the lifting force that keeps them apart. If there is no wedge, there is no load-carrying hydrodynamic capacity. Finally, it has also been shown that the centre of pressure of the hydrodynamic forces as a sliding bearing is very close to the line between the shaft centres, due to the small inclination of the FBB, as evidenced by the drastic reduction in the height of the hydrodynamic wedge as the pressure increases, and the corresponding hydrodynamic torque is not sufficient to prevent the FBB from tilting. It is necessary to take into account the stiffness of the shafts in their journal bearing to achieve the balance of the FBB. The simulation of specific operating conditions of interest to positive displacement pumps, such as cold starts, pressure peaks, or overheating, are a number of tasks to exploit the model.
The extensibility of the proposed model is one of its main advantages. For example, it could include the introduction of lubrication conditions that are not fully hydrodynamic. Although the orders of magnitude of the minimum thickness at 150 bar do not suggest mixed lubrication, they could make it necessary in the case of simulations at high temperatures and very high pressures. Although taking into account the two-dimensional translation of the FBB towards the gears and its tilting has been sufficient to adapt the behaviour of the model to the experimental results, it could also be very interesting to include the movement towards the suction zone when the working pressure is increased, since this movement can condition the hysteresis of the translation movement towards the gears. Another example of future extension could be the experimental monitoring of the movement of the FBB versus time as a result of a sudden increase in pressure. This would lead us to experimentally determine the real value of the shape factor as a thrust bearing. Finally, it has been shown that the calculation of the temperature of the film between the FBB and the gear may not be entirely accurate without experimental measurements of these data to verify the goodness of the model. A future line of research in this area should include this experiment.
Author Contributions
The investigation was led and supervised by E.C. Experimental works, bond graph simulation models, data processing, and illustrations were completed by M.T. The manuscript was finalized by M.T., P.J.G.-M. and E.C. All authors have read and agreed to the published version of the manuscript.
Funding
This research received no external funding.
Data Availability Statement
The data presented in this study are available on request from the corresponding author. The data are not publicly available due to privacy reasons.
Acknowledgments
The authors would like to thank ROQUET GROUP https://www.pedro-roquet.com (accessed on 17 July 2023) for the facilities used to perform the tests with the pump and machine, respectively.
Conflicts of Interest
The funding sponsors had no role in the design of the study; in the collection, analyses or interpretation of data; in the writing of the conclusions; and in the decision to publish the results. The authors declare no conflict of interest.
Nomenclature
| Symbol | Description | Units |
| F | Generic force | N |
| m | Mass | kg |
| u | Generic linear speed | ms−1 |
| t | Time | s |
| M | Generic torque | Nm |
| Ip | Inertia of the bushing | kgm |
| p | Pressure | Pa |
| P | Dimensionless pressure | - |
| Effective area | ||
| S | Generic surface | |
| e | Thickness of the oil film between bushing and casing | m |
| Sh | Wedge height | m |
| R | Generic resistance | |
| h | Thickness of the oil film | |
| H | Dimensionless thickness of the oil film | - |
| Minimal thickness of oil film | m | |
| Dimensionless minimal thickness of oil film | - | |
| Mean thickness of oil film | m | |
| m | ||
| Specific heat at constant pressure, | ||
| External diameter of the gear | m | |
| Diameter of the shaft | m | |
| l | Length of the bearing | m |
| T | Oil temperature | °C |
| Slide speed in a fixed-incline slide bearing | ||
| v | Relative speed between bushing and side face of gear | |
| Load carrying capacity as slide bearing per unit width | Nm−1 | |
| Dimensionless load carrying capacity as slide bearing per unit width | - | |
| Theoretical load carrying capacity as slide bearing | N | |
| Real load carrying capacity as slide bearing | N | |
| Load carrying capacity as thrust bearing per unit width | Nm−1 | |
| Theoretical load carrying capacity as thrust bearing | N | |
| Real load carrying capacity as thrust bearing | N | |
| x | Displacement of bushing from initial position | m |
| Initial position of bushing | m | |
| m | ||
| - | ||
| Shape factor of fixed-incline slide bearing | - | |
| Shape factor of parallel-surface squeeze film bearing | - | |
| T0incr | Dimensionless temperature raise inside the lubricating gap | - |
| (Greek letters) | ||
| Tilt of the bushing | rad | |
| Temperature raise inside the lubricating gap | °C | |
| Pressure–viscosity coefficient of the lubricant | ||
| Dynamic viscosity | Pa s | |
| Mass densityof of oil | kgm−3 | |
| β | Bulk modulus | Pa |
| Rotational speed of the pump |
References
- ISO 4409:2019; Hydraulic Fluid Power—Positive Displacement Pumps, Motors and Integral Transmissions—Methods of Testing and Presenting Basic Steady State Performance. ISO: Geneva, Switzerland, 2019. Available online: https://www.iso.org/standard/68410.html (accessed on 17 July 2023).
- Available online: https://en.wikipedia.org/wiki/Bond_graph (accessed on 17 July 2023).
- Torrent, M.; Gámez-Montero, P.J.; Codina, E. Model of the Floating Bearing Bushing Movement in an External Gear Pump and the Relation to Its Parameterization. Energies 2021, 14, 8553. [Google Scholar] [CrossRef]
- Corvaglia, A.; Ferrari, A.; Rundo, M.; Vento, O. Three-dimensional model of an external gear pump with an experimental evaluation of the flow ripple. Proc. Inst. Mech. Eng. Part C J. Mech. Eng. Sci. 2021, 235, 1097–1105. [Google Scholar] [CrossRef]
- Thiagarajan, D.; Bratto, A.; Vacca, A. Influence of surface roughness effects on the lubrication performance of external gear machines. In Proceedings of the ASME/BATH 2017 Symposium on Fluid Power and Motion Control (FPMC 2017), Sarasota, FL, USA, 16–19 October 2017. [Google Scholar] [CrossRef]
- Mithun, M.G.; Koukouvinis, P.; Karathanassis, I.K.; Gavaises, M. Numerical simulation of three-phase flow in an external gear pump using immersed boundary approach. Appl. Math. Model. 2019, 72, 682–699. [Google Scholar] [CrossRef]
- Vacca, A.; Guidetti, M. Modelling and experimental validation of external spur gear machines for fluid power applications. Simul. Model. Pract. Theory 2011, 19, 2007–2031. [Google Scholar] [CrossRef]
- Rituraj, R.; Vacca, A. Investigation of flow through curved constrictions for leakage flow modelling in hydraulic gear pumps. Mech. Syst. Signal Process. 2021, 153, 107503. [Google Scholar] [CrossRef]
- Koç, E. End Plate Lubrication in External Gear Pumps. Ph.D. Thesis, Department of Mechanical Engineering, University of Birmingham, Birmingham, UK, 1983. [Google Scholar]
- Gutés, M.; Gámez Montero, P.J.; Castilla, R.; Codina Macià, E. Journal bearing performance in gear pumps. In Proceedings of the 1st International FPNI, Ph.D. Symposium on Fluid Power-Hamburg, Hamburg, Germany, 20–22 September 2000; pp. 259–269. [Google Scholar]
- Castilla, R.; Gutes, M.; Gamez-Montero, P.J.; Codina, E. Experimental Study of the Shaft Motion in the Journal Bearing of a Gear Pump. J. Eng. Gas Turbines Power 2009, 131, 052502. [Google Scholar] [CrossRef]
- Torrent, M. Parametrització d’una Bomba d’Engranatges Externs i Validació en Condicions Reals. Ph.D. Thesis, Department of Fluid Mechanics, Universitat Politècnica de Catalunya, Barcelona, Spain, 2023. Available online: https://futur.upc.edu/35680642 (accessed on 17 July 2023).
- Dhar, S.; Vacca, A. A fluid structure interaction—EHD model of the lubricating gaps in external gear machines: Formulation and validation. Tribol. Int. 2013, 62, 78–90. [Google Scholar] [CrossRef]
- Dhar, S.; Vacca, A.; Lettini, A. A Novel Fluid–Structure–Thermal Interaction Model for the Analysis of the Lateral Lubricating Gap Flow in External Gear Machines. In Proceedings of the ASME/BATH 2013 Symposium on Fluid Power and Motion Control (FPMC 2013), Sarasota, FL, USA, 6–9 October 2013. [Google Scholar] [CrossRef]
- Thiagarajan, D.; Vacca, A. Mixed Lubrication Effects in the Lateral Lubricating Interfaces of External Gear Machines: Modelling and Experimental Validation. Energies 2017, 10, 111. [Google Scholar] [CrossRef]
- Rundo, M. Models for Flow Rate Simulation in Gear Pumps: A Review. Energies 2017, 10, 1261. [Google Scholar] [CrossRef]
- De Las Heras, S.; Codina, E. Modelización de Sistemas Fluidos Mediante Bond Graph; Cardellach Còpies SA: Terrassa, Spain, 1997; ISBN 84-605-7035-5. [Google Scholar]
- Thoma, J. Introduction to Bond Graphs and their Applications; Elsevier: Pergamon, Turkey, 1975; ISBN 978-0-08-018881-2. [Google Scholar] [CrossRef]
- Houzeaux, G.; Codina, R. A finite element method for the solution of rotary pumps. Comput. Fluids 2007, 36, 667–679. [Google Scholar] [CrossRef]
- Thiagarajan, D.; Vacca, A.; Watkins, S. On the lubrication performance of external gear pumps for aerospace fuel delivery applications. Mech. Syst. Signal Process. 2019, 129, 659–676. [Google Scholar] [CrossRef]
- Reynolds, O. On the Theory of Lubrication and its Application to Mr. Beauchamp Tower’s Experiments Including an Experimental Determination of olive Oil. Proc. R. Soc. Lond. 1886, 40, 191–203. [Google Scholar]
- Hamrock, B.J.; Schmid, S.R.; Jacobson, B.O. Fundamentals of Fluid Film Lubrication, 2nd ed.; CRC Press: Boca Raton, FL, USA, 2004. [Google Scholar] [CrossRef]
- Buckingham, E. On physically similar systems; Illustrations of the use of dimensional equations. Phys. Rev. 1914, 4, 345–376. [Google Scholar] [CrossRef]
- 20SIM, Version 5.0; Controllab Products, B.V.: Enchede, The Netherlands, 2022. Available online: https://www.20sim.com(accessed on 11 August 2023).
- Barus, C. Isothermals, isopiestics and isometrics relative to viscosity. Am. J. Sci. 1893, 45, 87–96. [Google Scholar] [CrossRef]
- Torrent, M.; Gamez-Montero, P.J.; Codina, E. Parameterization, modeling, and validation in real conditions of an external gear pump. Sustainability 2021, 13, 3089. [Google Scholar] [CrossRef]
- Borghi, M.; Zardin, B. Axial Balance of External Gear Pumps and Motors: Modelling and Discussing the Influence of Elastohydrodynamic Lubrication in the Axial Gap. In Proceedings of the ASME International Mechanical Engineering Congress and Exposition, Houston, TX, USA, 13–19 November 2015; Volume 15. Advances in Multidisciplinary Engineering. V015T19A038. [Google Scholar] [CrossRef]
Disclaimer/Publisher’s Note: The statements, opinions and data contained in all publications are solely those of the individual author(s) and contributor(s) and not of MDPI and/or the editor(s). MDPI and/or the editor(s) disclaim responsibility for any injury to people or property resulting from any ideas, methods, instructions or products referred to in the content. |
© 2023 by the authors. Licensee MDPI, Basel, Switzerland. This article is an open access article distributed under the terms and conditions of the Creative Commons Attribution (CC BY) license (https://creativecommons.org/licenses/by/4.0/).