1. Introduction
The use of inspection robots for mass production has emerged as an innovative solution that is gaining widespread adoption in the manufacturing industry. In recent years, numerous studies have explored their potential benefits and applications. Tirkel, I.M. et al. [
1] present a model that enables the maximization of inspection benefits, highlighting the importance of the inline inspection capacity. Foumani, M. et al. [
2] present a methodology that maximizes the production rate of a multifunction robot. Wu, Z.G. et al. [
3] present a technique for inline inspection with an industrial robot and a 3D scanner. Overall, inspection robots have great potential for use in mass production.
The complex surface measurement is an essential aspect of quality control and manufacturing processes in various industries [
4,
5], including aerospace, automotive, and medical devices. Since there are many components with complex surfaces in large equipment [
6], the ability to accurately measure and analyze the surface characteristics of components is crucial for ensuring product quality, as well as for optimizing manufacturing processes. Articulated arm coordinate measuring machines (AACMMs) are essential tools for achieving reliable and precise complex surface measurements. They are typically composed of a serial mechanical arm and a probe system. By acquiring the data of the angle encoders inside each joint of the mechanical arm when the probe contacts the workpiece surface, and combining the rod geometric parameters and the probe system geometric parameters, the position at the end of the probe system in space, i.e., the spatial coordinate parameters of the measurement point, can be solved.
Compared to traditional three−axis coordinate measuring machine, the advantages of AACMMs include the following:
Portable: AACMMs typically weigh between 4 and 7 kg, making them easy to transport and suitable for movement between different production lines or factories.
Highly flexible: AACMMs generally have six or seven degrees of freedom, and the end joint is often capable of 360° rotation, making them highly flexible and suitable for measuring complex surface.
Cost effectiveness: Compared to traditional three−coordinate measuring instruments, AACMMs are cost effective and preferred by the users [
7].
Although AACMMs have many advantages in terms of measuring complex surfaces, the AACMMs that are currently available require manual operation. This introduces operator errors and leads to a lower measurement efficiency, which does not meet the demands of automated inspections in mass production. Therefore, the use of 6−DOF industrial robots to replace mechanical arms with non−driven joints of ACCMMs for measurement gradually emerged decades ago. However, due to the low positioning accuracy of 6−DOF industrial robots and the complexity of their control methods at that time, this method has not been put into practical use. With the continuous development of the industrial robot positioning accuracy, open controllers for robots, and contact probes, new opportunities and new problems have arisen for in situ measurement systems using a 6−DOF industrial robot holding a contact probe. Therefore, the study of the factors affecting the measurement errors of the measurement systems is of significant importance in achieving in situ measurements of complex components.
The aim of this study is to investigate the factors that affect the measurement errors of a 6−DOF industrial robot holding a contact probe by combining the latest developments in robot positioning accuracy, open−loop controllers, and contact probes. By analyzing the errors and conducting experiments from the perspectives of approaching velocity, contact angle, and measurement position, this study investigates the error variation under different measurement parameters. This study provides a foundation for selecting measurement parameters and error calibrations for similar measuring instruments in the future.
The innovation of this lies in the use of a 6−DOF industrial robot to hold a probe to realize the basic functions of an AACMM. Compared to traditional AACMMs, this system enables automated measurements through programming, thereby improving the efficiency and eliminating operator errors. The sources of error in the measurement system were analyzed from the perspective of measurement parameters. In addition, the measurement accuracy of the measurement system was calibrated through the experiments.
The paper is organized as follows:
Section 2 presents the related work;
Section 3 presents the composition and measurement process of the measuring device in this study;
Section 4 analyzes the main sources of error in the measuring device from the perspective of measurement parameters;
Section 5 conducts experiments and analyzes the results;
Section 6 provides discussions; and
Section 7 presents the conclusions.
2. Related Work
Reliability and validity are two important indicators of a measuring instrument [
8]. The reliability and validity of AACMMs are influenced by various sources of error, which can be classified into four main categories: mechanical, thermal, operator, and probe errors. Research on these errors has been extensively carried out. Miha Vrhovec et al. [
9] focus on elastic deformations as one of the main error sources and present a novel system, developed specifically for measuring link deflections. The results of their evaluation show that integration into a target device can improve the accuracy of ACCMMs. Santolaria et al. [
10] proposed a new empirical correction model for thermal errors, realizing an important accuracy improvement in the arm performance of typical arm operations at temperatures different from 20 °C. Daniel et al. [
11] presented a new methodology to calculate the operator contribution to AACMM errors, and provided a reasonable basis for performing operator qualifications. Brau et al. [
12] compared the accuracy and repeatability of four different probes, include passive spherical probes, active spherical probes, self−centering passive probes, and self−centering active probes, and found that active probes have the best performance in measurement. Cheng et al. [
13] proposed a simple approach for the probe parameters calibration of AACMM, and the Gauss–Newton method was adopted as an optimization method to figure out the probe parameters. Gao et al. [
14] developed a calibration technology using Particle Swarm Optimization (PSO), which utilizes single−point repeatability as the fitness function and kinematic parameters as the position vector. Experiments conducted on a 6−DOF AACMM showed that this technology greatly improves accuracy. Acero et al. [
15] used a laser tracker as the reference equipment and an indexed metrology platform for the verification of AACMM. Lin Cheng et al. [
16] found that high repeatability cannot guarantee the accuracy of the kinematic parameters and the measurement accuracy of the AACMM, and proposed a two−step novel kinematic parameters identification method for the AACMMs using repeatability and a scaling factor to achieve accurate parameters with a convenient operation. Wang et al. [
17] proposed a new type of AACMM that utilizes an indexing joint structure to improve the measurement accuracy. Gąska et al. [
18] presented a new gauge block−based methodology, which is useful for determining the task−specific accuracy of the AACMM.
In summary, reliability and validity are two significant issues in AACMMs, and several studies have been conducted to identify and improve them, including the use of novel systems, new models, and calibration technologies. Our study conducts an error analysis from the perspective of measurement parameters, which contributes to the selection of measurement parameters and facilitates the application of this measuring device.
3. Measuring Device
3.1. Reference Equipment
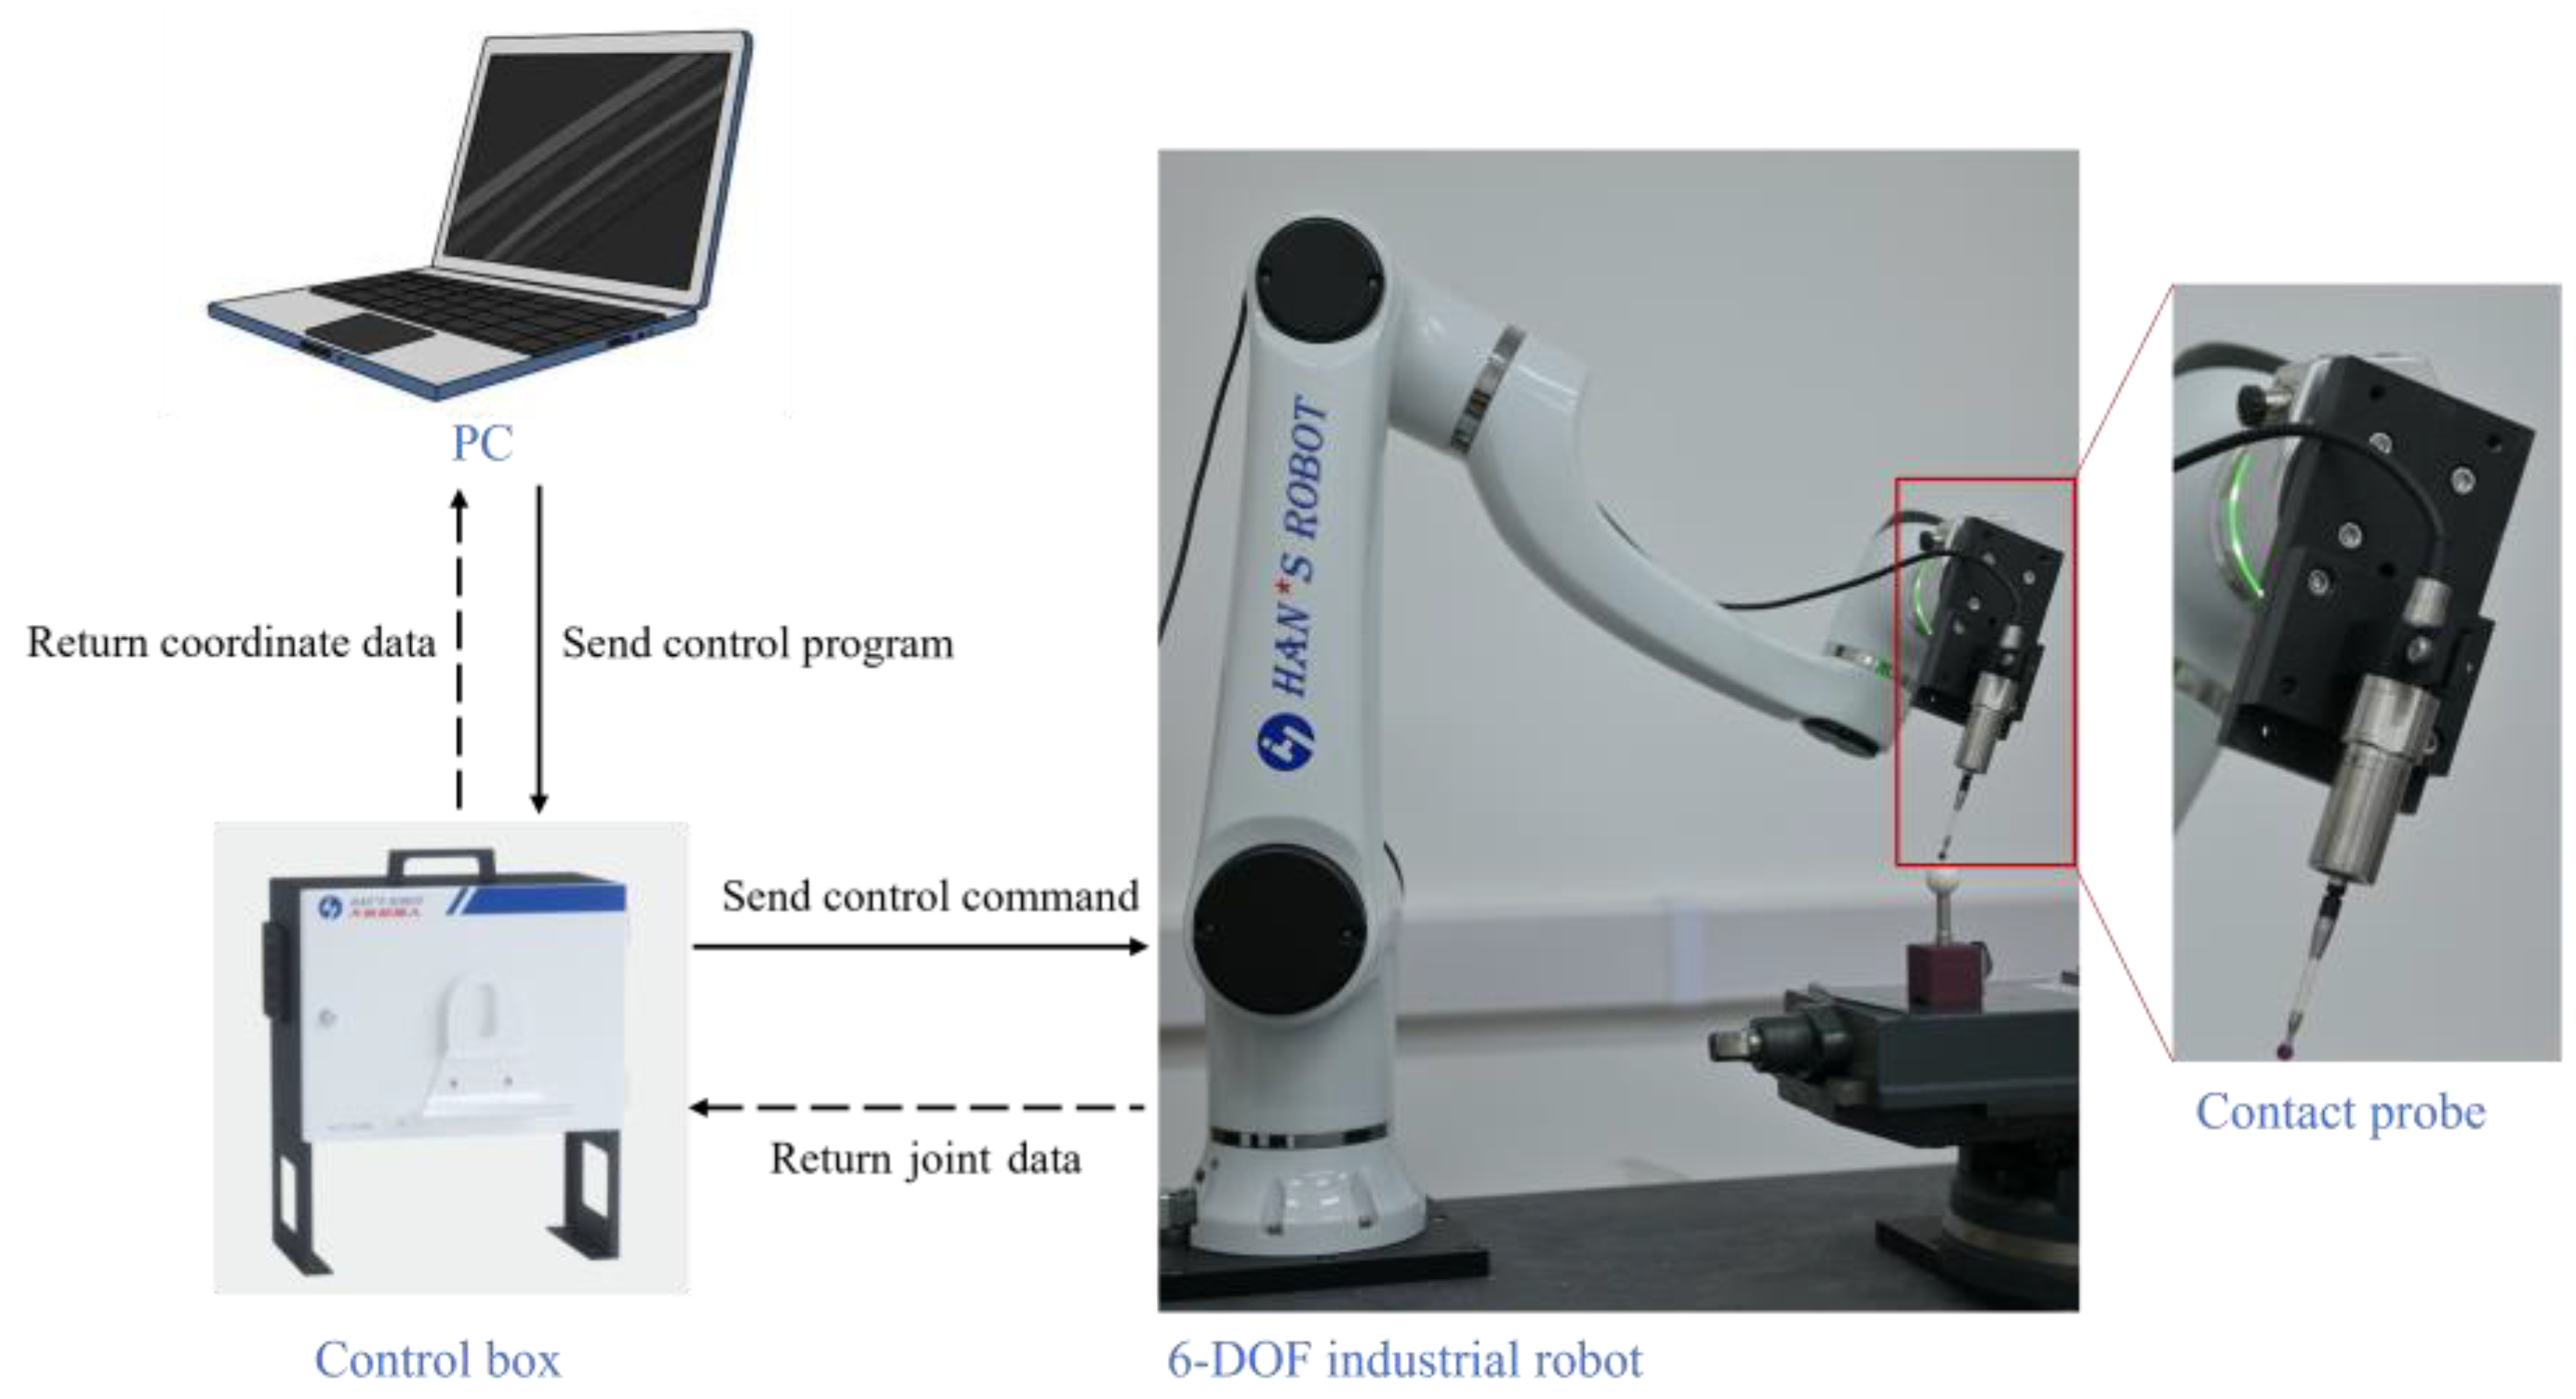
This study presents a measuring device with a 6−DOF industrial robot holding a contacting probe, which realizes the automation measurement of complex surfaces and eliminates operator errors compared with the traditional measurement process of an AACMM. The measurement system consists of a PC, a 6−DOF industrial robot and its control box, and a contact probe. The PC is responsible for sending control programs to the control box and receiving coordinate data sent by the control box. The control box controls the movement of the robot through control commands and converts the joint data returned by the robot into the coordinate data through transformation. The measurement system is shown in
Figure 1.
3.1.1. Industrial Robot
The industrial robot used in this study is the Elfin 10 robot from Han’s Robot. The body of the robot is shown in
Figure 2. The main technical parameters of the robot are shown in
Table 1:
3.1.2. Contact Probe
A Contact probe is a type of device that is used to initiate a measurement or a test. It typically consists of a probe and a trigger device that can be activated manually or automatically in response to a specific event or condition. Contact probes can provide high accuracy, repeatability in measurements [
19], and are commonly used in a variety of applications, including scientific research, manufacturing, and testing, to control the timing and execution of measurements or tests.
A PIONEER TP300 series of cable probe is used in this study. The shape of the probe is shown in
Figure 3; the main technical parameters of it are shown in
Table 2.
3.1.3. Mechanical Connection
The mechanical connection between the probe and the industrial robot is achieved by a special fixture. The special fixture consists of two parts. As shown in
Figure 4, the first part is connected to the end flange of the industrial robot, and the second part holds the probe. The two parts of the special fixture are connected by screws.
3.1.4. Electrical Connection
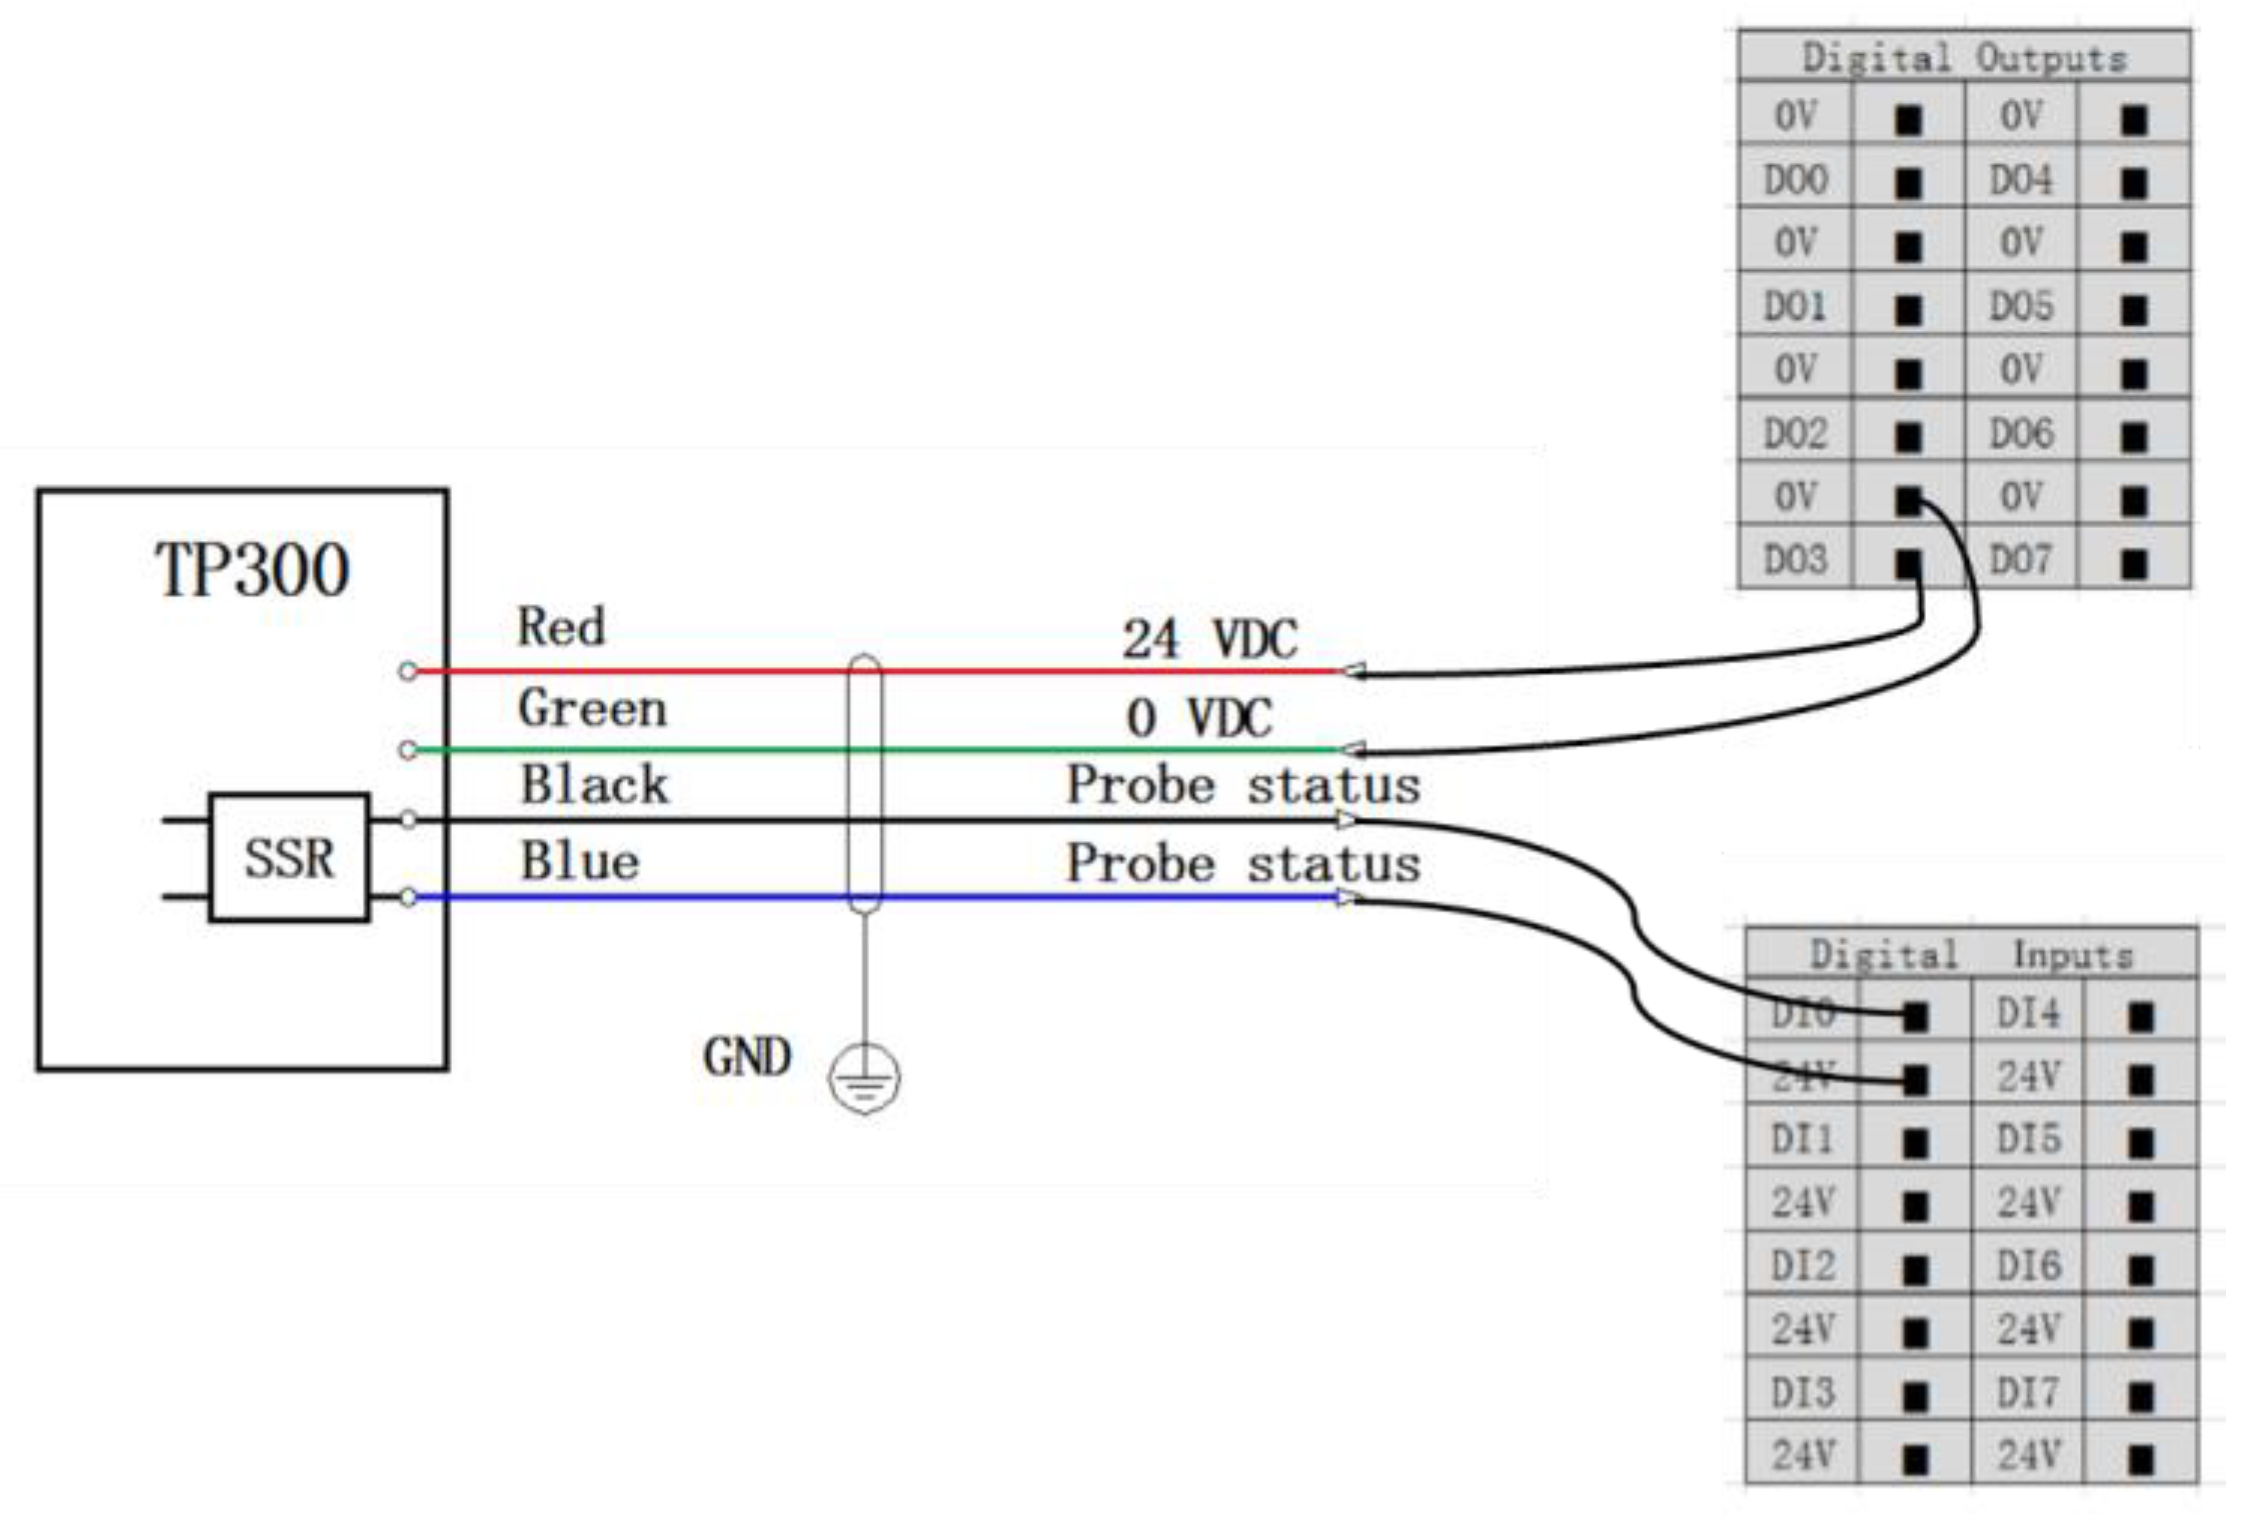
The electrical connection between the industrial robot and the probe mainly relies on the electrical box of the industrial robot. The electrical box of the Elfin 10 robot provides a wealth of electrical interfaces as shown in
Figure 5, among which the digital output can provide 24V voltage for the TP300 probe.
During the measurement process, the probe head touches the surface of the measured workpiece and generates a digital signal, and the digital signal passes to the host computer through the digital inputs. The electrical wiring diagram is shown in
Figure 6.
3.2. Programming
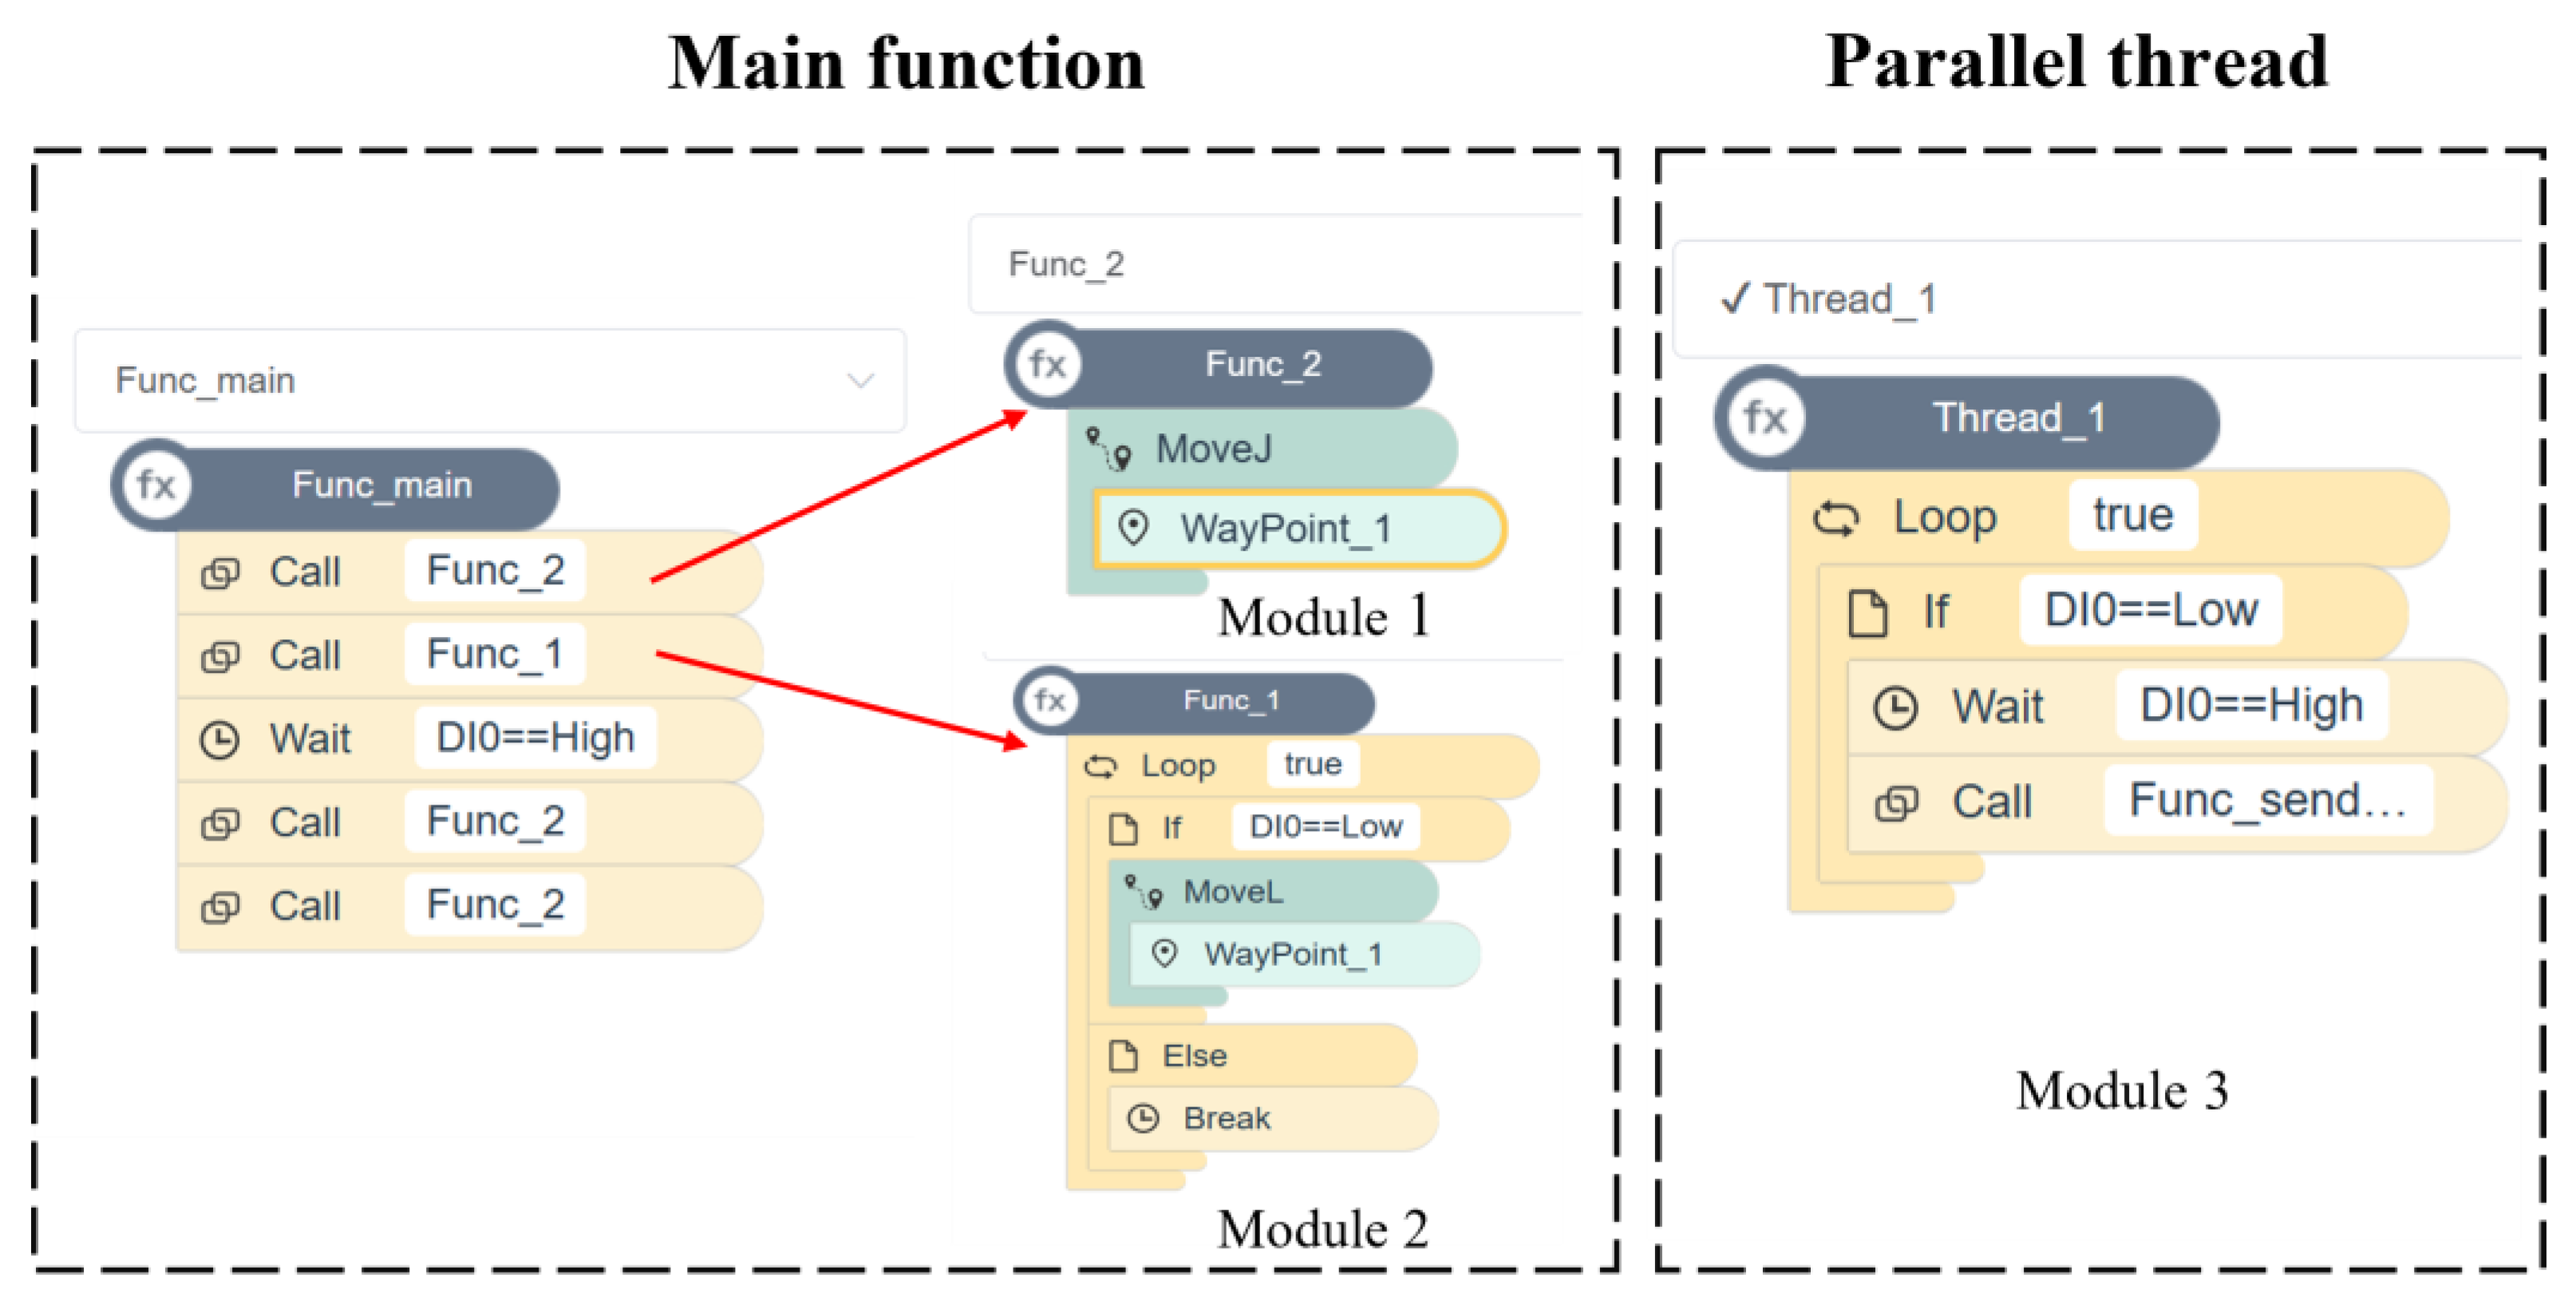
This study uses dedicated Elfin robot control software for programming. The advantage of this control software is that the programming is simple and fast, the communication delay with the robot is low, and it provides path planning and point calculation functions. The measurement program is mainly composed of three modules. Module 1 realizes the movement between the anchor points. Module 2 realizes the approach from the anchor point to the measurement point. Module 3 realizes the reading of the probe signal and point data upload. As shown in
Figure 7, Module 1 and Module 2 constitute the main function, and Module 3 work as a parallel thread.
3.3. Measurement Process
Prior to measurement, the measurement parameters, including approaching velocity, measurement angle, coordinates of the measured points, and number of measurements per single point, need to be input in the industrial robot‘s measurement program. The industrial robot will then automatically plan the movement path based on the measurement parameters.
During the measurement, the industrial robot holds the probe and first moves at a larger velocity to an anchor point near the measurement point, and then approaches the measurement point at a smaller velocity until the probe head touches the measured surface and generates a digital signal. After receiving the signal, the industrial robot stops moving and returns to the current position coordinates. The measurement process is shown in
Figure 8.
The robot configuration includes an initial pose, and after each measurement task is completed, the robot returns to the initial pose to ensure continuity in the robot’s motion when switching tasks.
4. Error Analysis from the Perspective of Measurement Parameters
Measurement accuracy is an important indicator for evaluating the performance of measuring devices. Measurement accuracy refers to the difference between the measured value and the actual value. In the measurement process, the existence of a measurement error is inevitable. For a measuring device with an unknown performance, it is necessary to carry out an error analysis and identify the influencing factors.
In this study, the automatic measurement of AACMM was implemented using a 6−DOF industrial robot to hold the probe. Therefore, all the parameters during the measurement process are predetermined. During the measurement process, there are three primary measurement parameters that have an impact on measurement accuracy: the approach velocity, the contact angle, and the measurement position.
4.1. Approaching Velocity
The accuracy of the measurement tasks performed by a measurement system consisting of an industrial robot holding a probe can be significantly affected by the approach velocity. If the approach velocity is too low, the measurement process may be unnecessarily prolonged, resulting in decreased efficiency [
20]. On the other hand, an excessively high approach velocity may result in large measurement errors and may impose potential damage to the probe system and the workpiece being measured. It is therefore important to properly set the approach velocity in order to optimize the measurement accuracy and efficiency.
The errors resulting from an excessively high approach velocity during the measurement tasks performed by the measurement system can be attributed to two factors. Firstly, as the velocity of the industrial robot increases upon contact with the workpiece, the interaction force between the probe and workpiece also increases, potentially causing the probe to vibrate or deform, resulting in larger measurement errors. Additionally, there is a waiting time for the industrial robots to monitor probe signals, which is at least 1 ms, due to their performance limitations. This waiting time results in a delay error. As the approach velocity increases, the delay error also increases.
4.2. Contact Angle
When measuring complex surfaces, the contact angle between the probe and the surface will be different, and the measurement error will be different, which is due to different compensation values.
During the measurement process, the value returned by the industrial robot is the coordinate position of the center of the probe sphere. In order to obtain the real value, the returned value needs to be compensated. The compensated value is the returned value plus the value of the radius of the sphere in the direction of the approach velocity. The actual value is the coordinate position of the center of the probe sphere plus the value of the radius of the sphere in the direction of the line connecting the contact point and the center of the sphere. If the direction of the approach velocity is not perpendicular to the surface of the workpiece, the compensated value will differ from the actual value, and the difference between the two is the perpendicularity error.
As shown in
Figure 9, if the angle between the direction of the probe velocity and the surface of the workpiece is
, the radius of the sphere is
, and the perpendicularity error is as follows:
It can be seen that the larger the angle between the direction of the probe velocity and the surface of the workpiece, the larger the perpendicularity error will be.
4.3. Measurement Position
In order to obtain the three−dimensional coordinates of the measurement points at different positions on the surface, the industrial robot holding the probe needs to move to different positions. The different measurement position will affect the measurement accuracy.
The effect of the measurement position on the measurement precision is primarily correlated with the encoders and the arm of the industrial robot. The three−dimensional coordinates of the measurement point in space are determined through data obtained from the intra−joint angle encoders of the mechanical arm. As the industrial robot measures points at various positions in the measurement space, the posture of the joint arm differs. Under various postures, errors stemming from the intra−joint angle encoders vary. Simultaneously, the arm of the industrial robot is inevitably subjected to elastic deformation due to the influence of gravity, and the elastic deformation of the connecting rod under different postures varies.
5. Experiment and Results
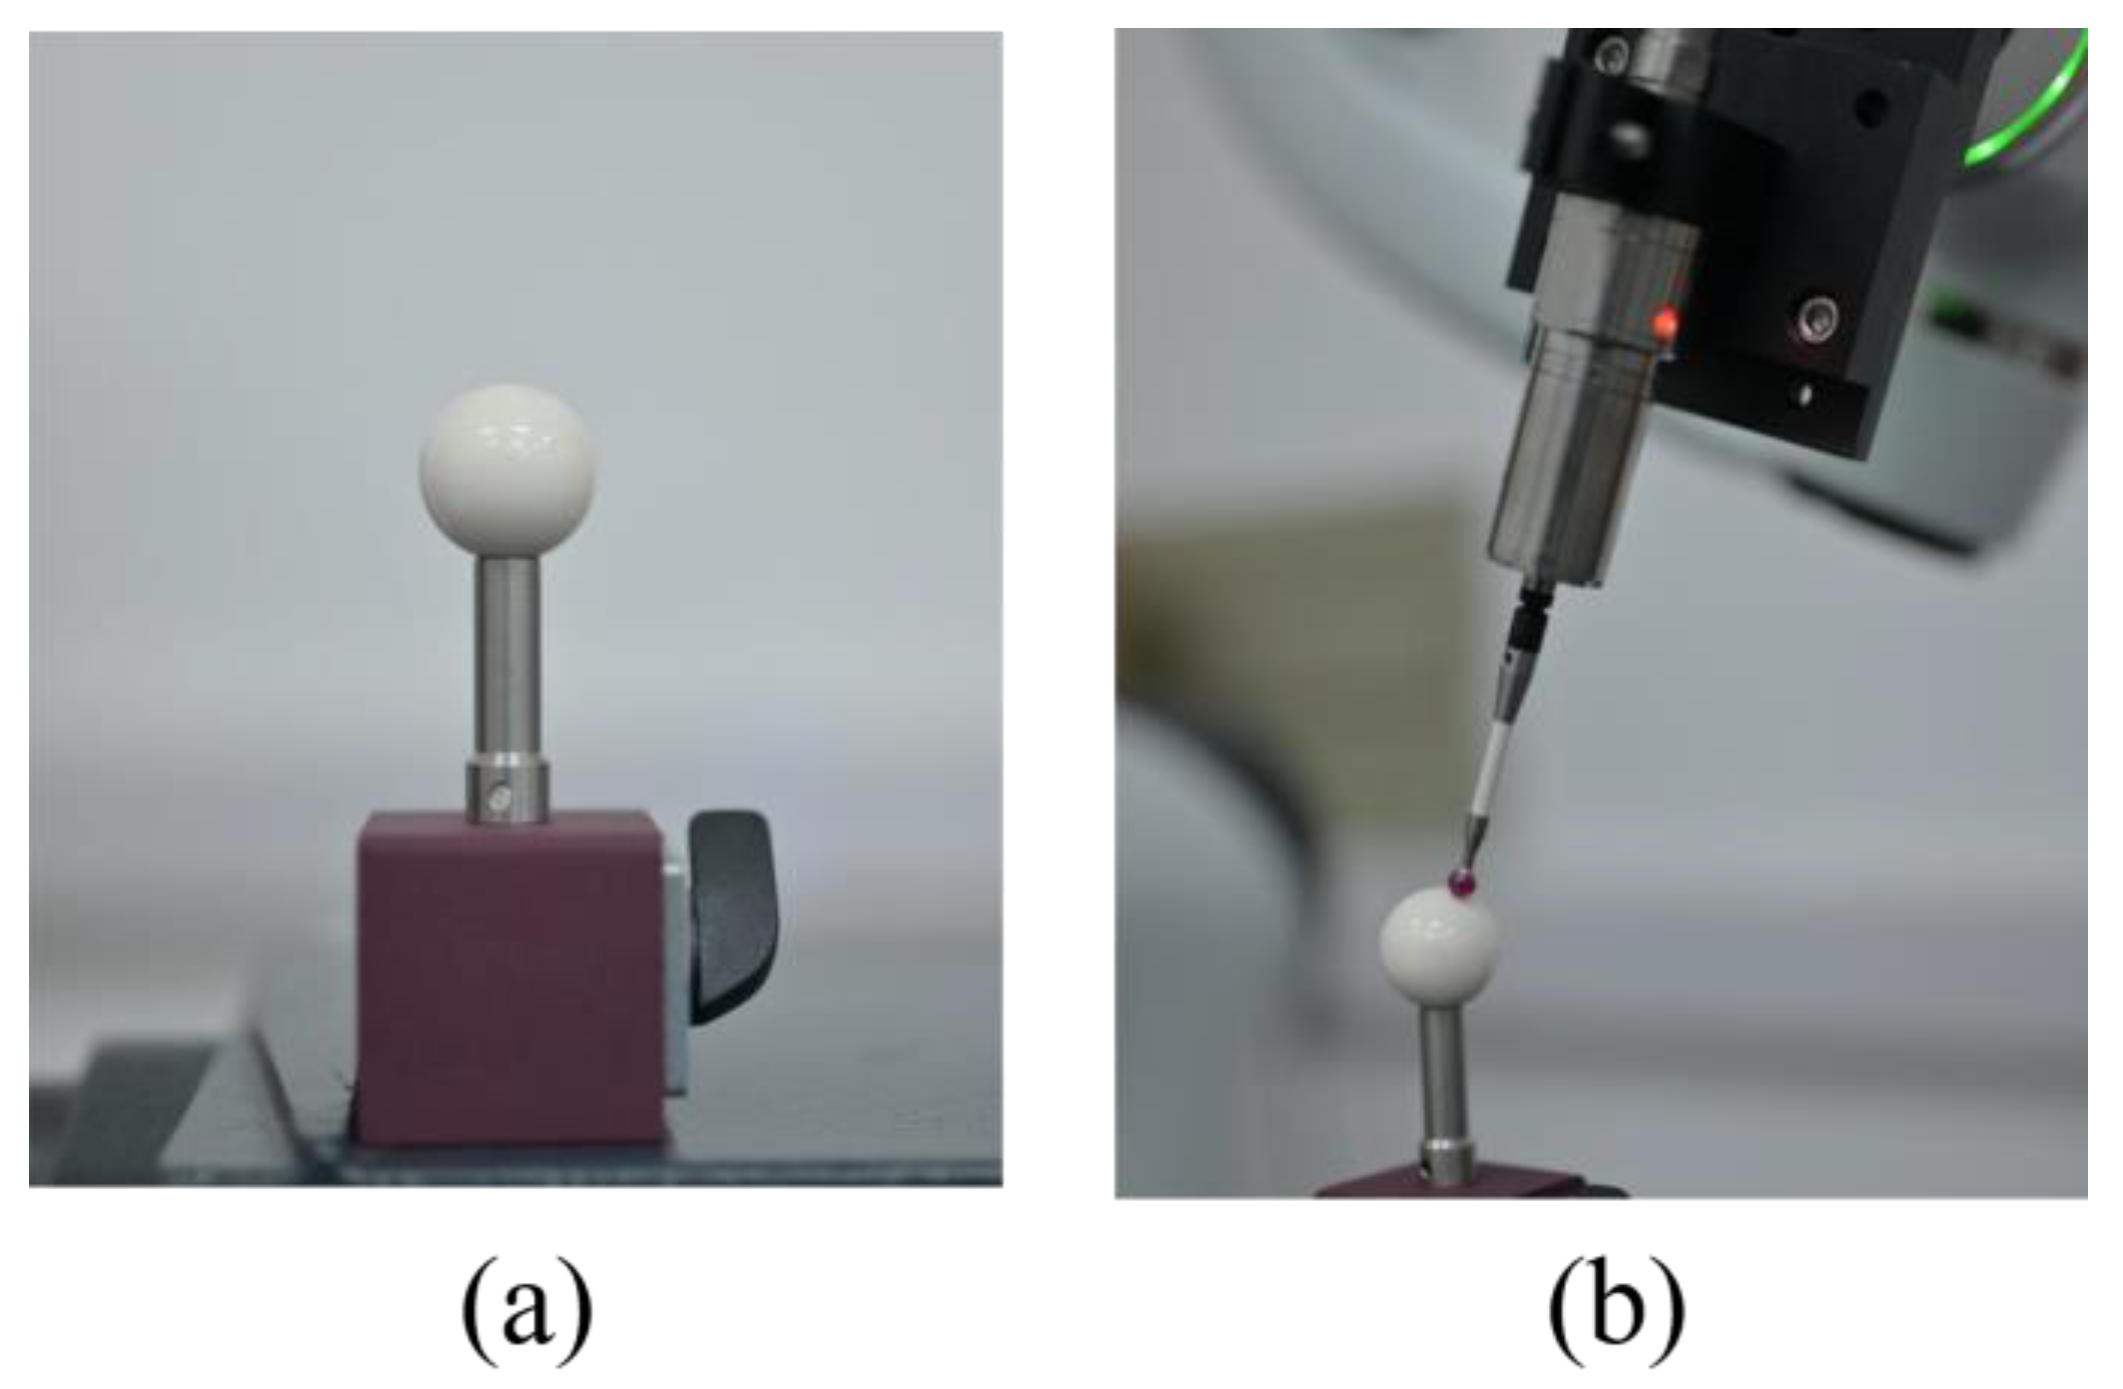
According to the guidelines outlined in ISO 10360−1:2016, the diameter of the test sphere used in the measurement should be no smaller than 10 mm and no greater than 51 mm [
21]. For our experiment, we used a calibration ball with a diameter of 24.9999 mm as the measuring object; a ruby probe with a diameter of 6 mm and a length of 45 mm is used as the probe. The calibration ball is shown in
Figure 10a, and how the measuring device measures the calibration ball is shown in
Figure 10b.
5.1. Approach Velocity Experiment
In this experiment, 16 measurement points are evenly selected on half of the surface of the calibration ball. The linear velocity at the end of the industrial robot is set to 10 mm/s, 8 mm/s, 6 mm/s, 4 mm/s, 2 mm/s, and 1 mm/s, respectively. The measurements are taken at the 16 measurement points on the calibration ball using these velocities at the same angle. The data of the 16 measurement points obtained each time are fitted into the sphere using the least squares method in MATLAB, and the radius R of the fitted sphere is calculated. It should be noted that
is not the radius of the calibration ball, but rather the sum of the radius of the calibration ball and the radius of the probe ruby ball head. Therefore, the radius of the calibration ball is denoted as follows:
Measurements are taken at each velocity 10 times, and the mean of the radius, error, and repeatability error are calculated. The results are shown in
Table 3.
As depicted in
Figure 11b, it is evident that an increase in velocity results in a corresponding increase in both the error and repeatability of the measurement results as the dynamic error and delay error increase, which is mainly influenced by the dynamic error and delay error. However, at velocities of 1 mm/s and 2 mm/s, there are minimal changes in the error and repeatability of the measurement outcomes. Taking into account the efficiency of the measurement process, it is advisable to select a measurement velocity of 2 mm/s in order to achieve a lower measurement error and higher measurement efficiency.
5.2. Contact Angle Experiment
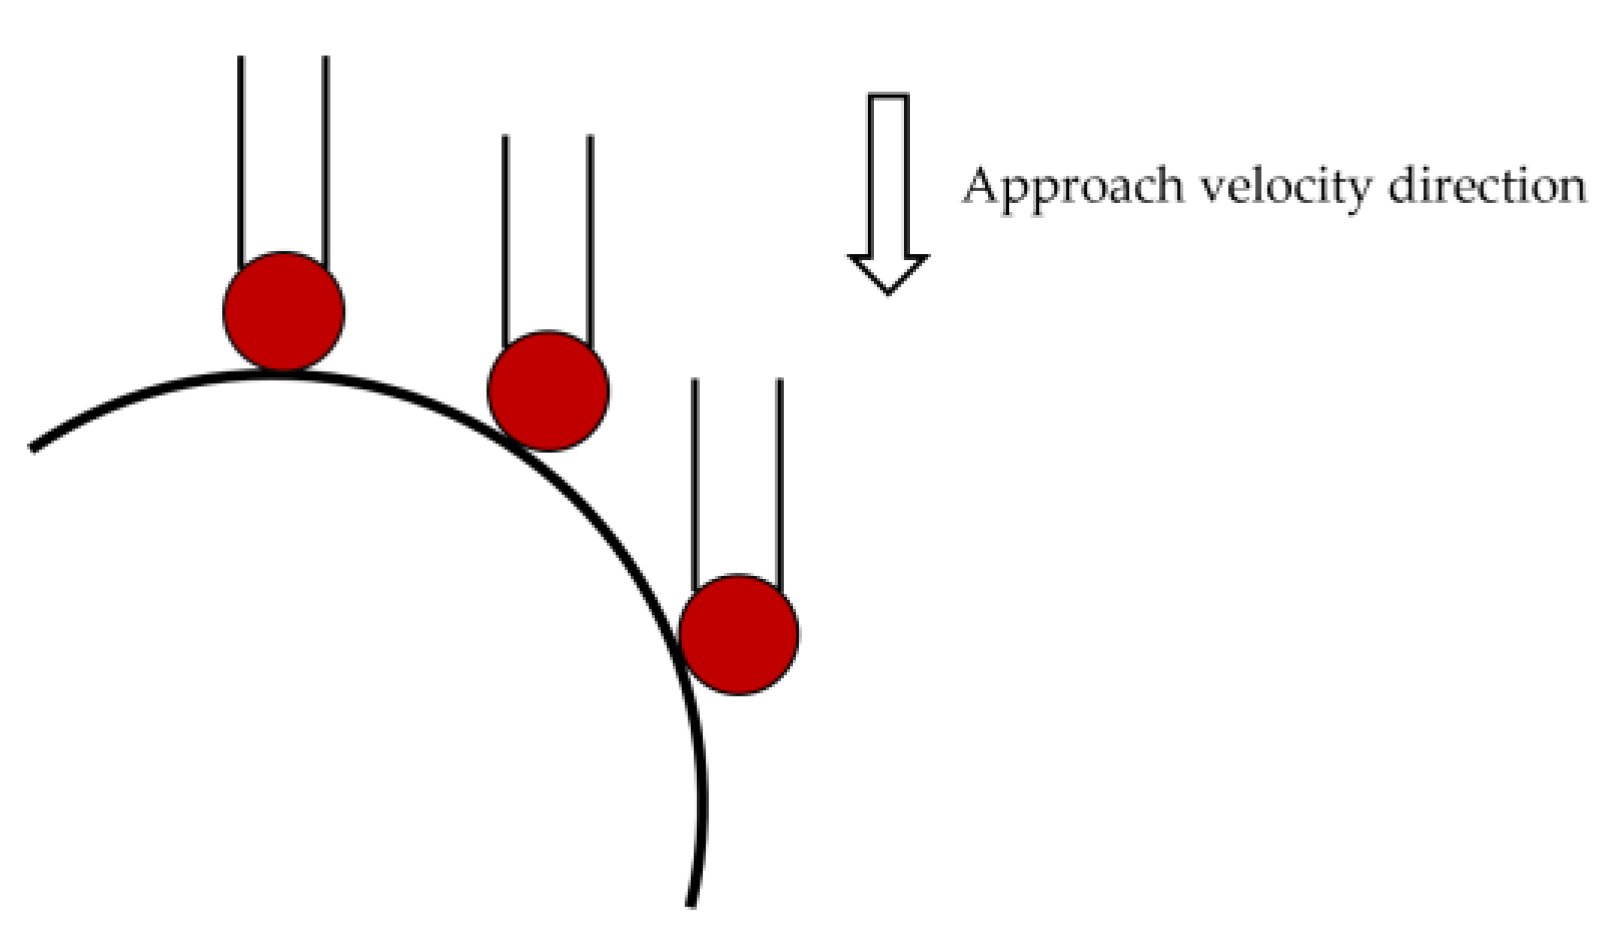
In the contact angle experiment, the approach velocity direction is maintained constant while different measurement points on the calibration ball are chosen bidirectionally across the ball to alter the angle between the probe and the cross−sectional plane of the measurement point on the surface of the calibration ball. The schematic diagram is shown in
Figure 12. This allows for the manipulation of the contact angle while keeping the position of the calibration ball unchanged and minimizing changes in the posture of the industrial robot. The coordinates of the center of the calibration ball were ascertained through a preliminary measurement.
The coordinate of the selected measurement points on the calibration ball and the corresponding contact angles are provided in
Table 4.
Ten measurements were taken at each measurement point, and the
x and
y coordinates were held constant due to the direction of the velocity of the probe being aligned with the
z axis of the collaborative robot coordinate system. The mean of the
z coordinates from the ten measurements is compared to the theoretical value. The results are as presented in
Table 5.
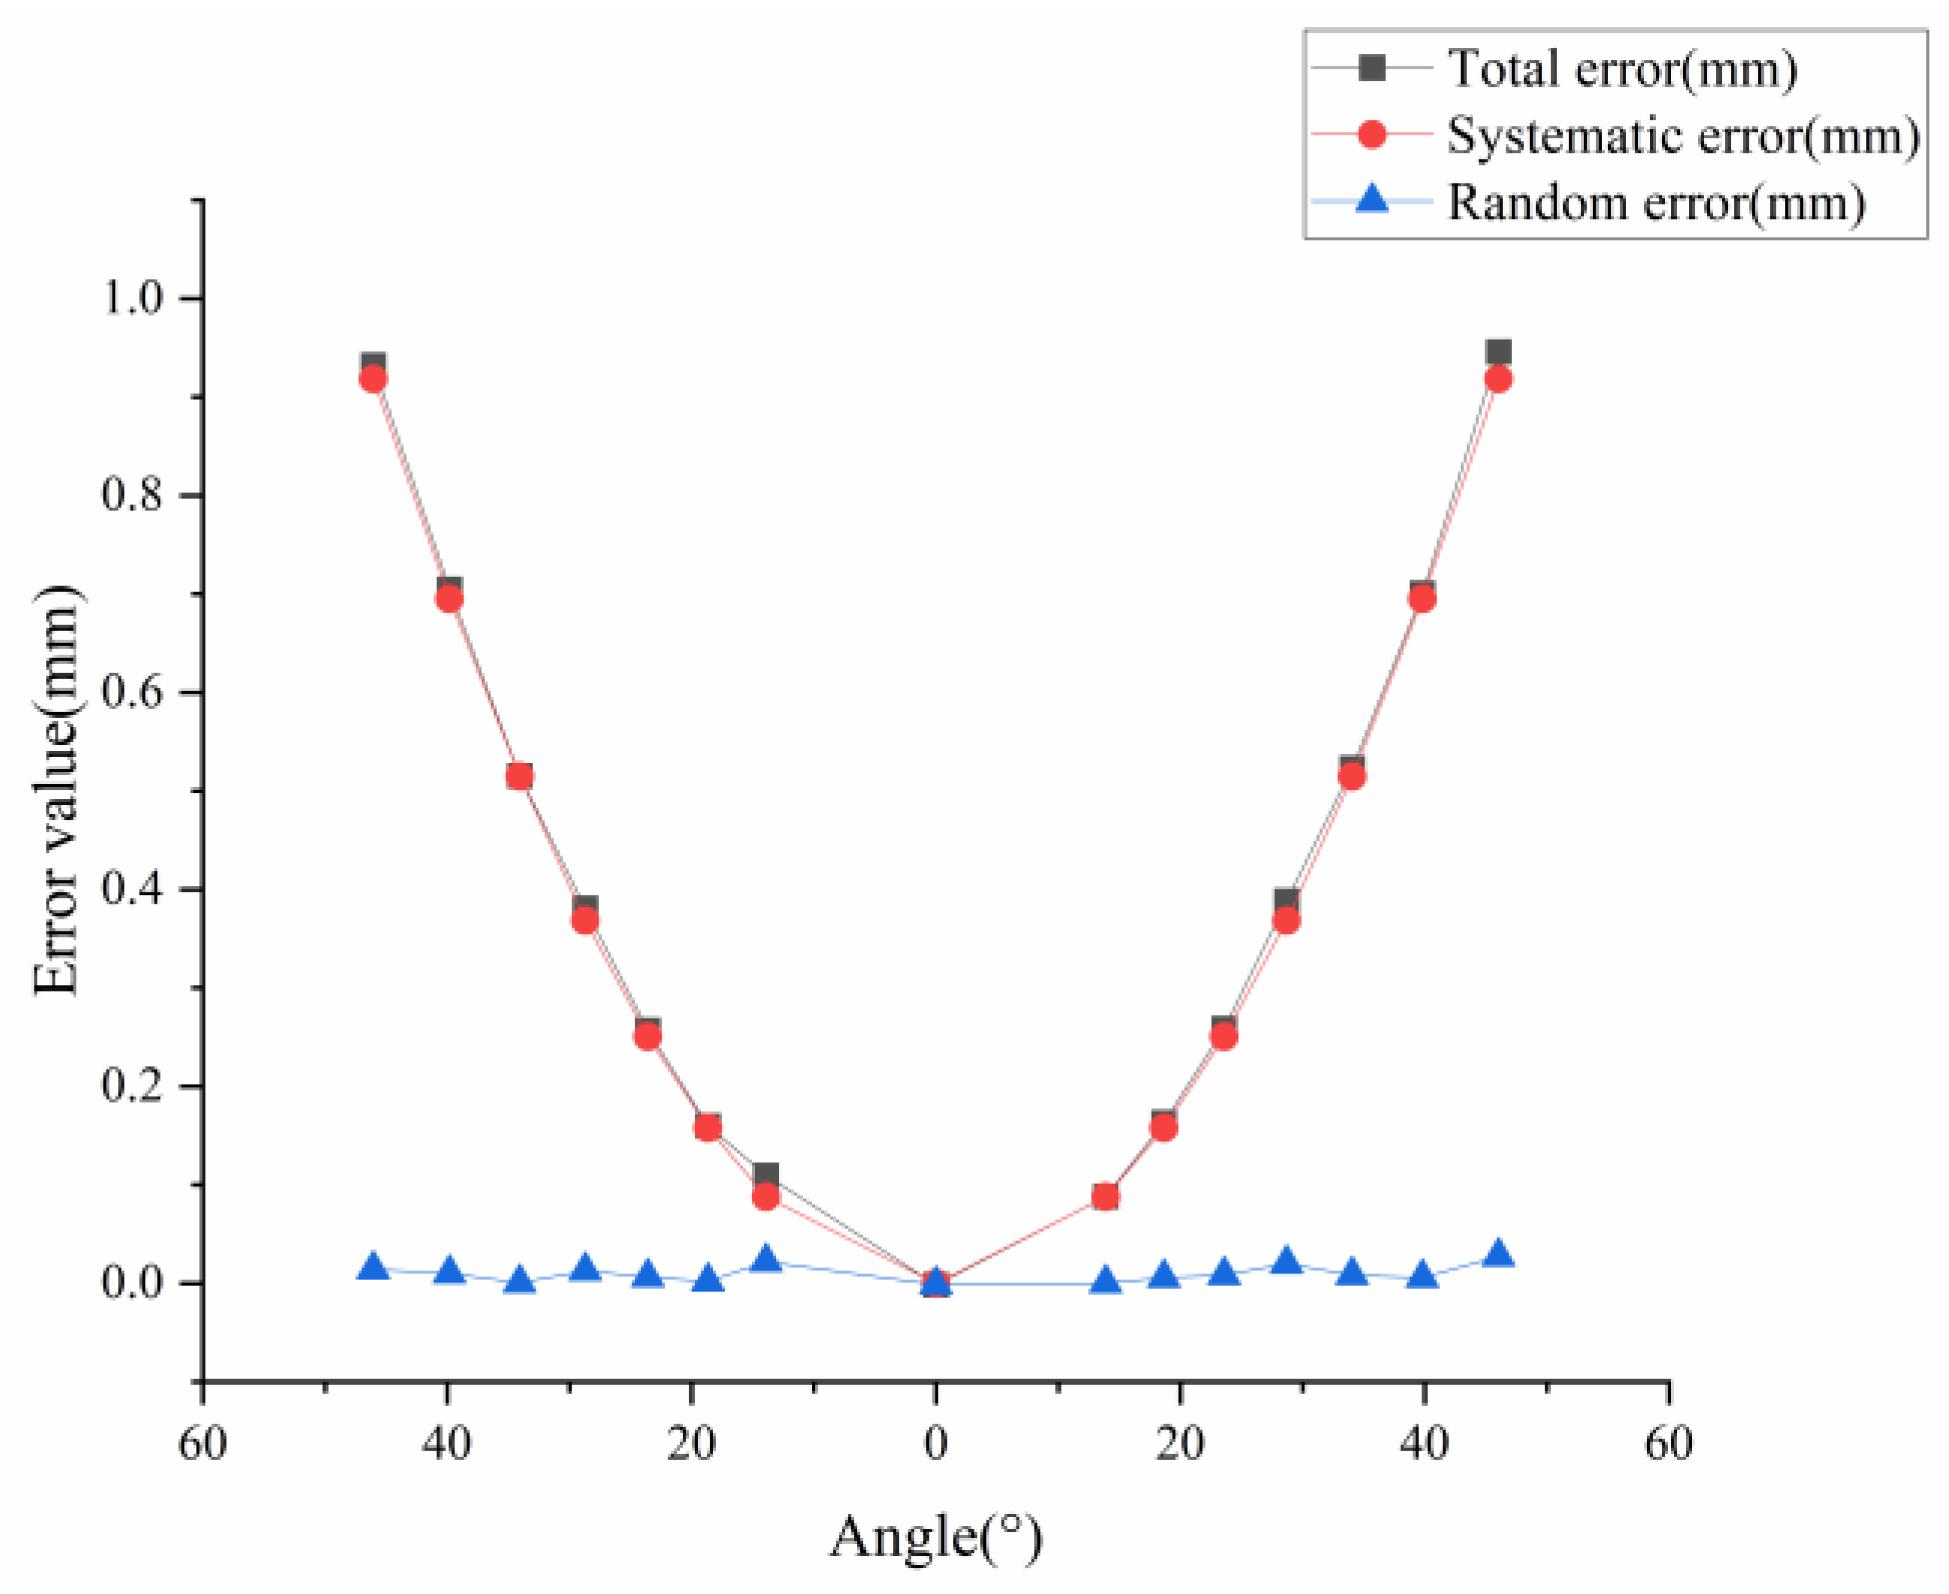
The results of the experiment depicted in
Figure 13 show that the error resulting from variations in the measurement angles primarily stems from a systematic error. Therefore, in order to mitigate this error during the measurement process, it is crucial to align the approaching velocity direction of the probe as closely as possible with the normal direction of the measurement point.
5.3. Measurement Position Experiment
On a plane, a 3 × 3 square dot matrix is selected, with the distance between the two points farthest apart being 320 mm. The calibration ball is placed on the nine points in turn, and the linear velocity of the end of the industrial robot is set to 2 mm/s. The calibration ball on each point is measured at the same angle, and the measurement process and data processing method at a single position are the same as in the approaching velocity experiment.
The measurement results are shown in
Table 6.
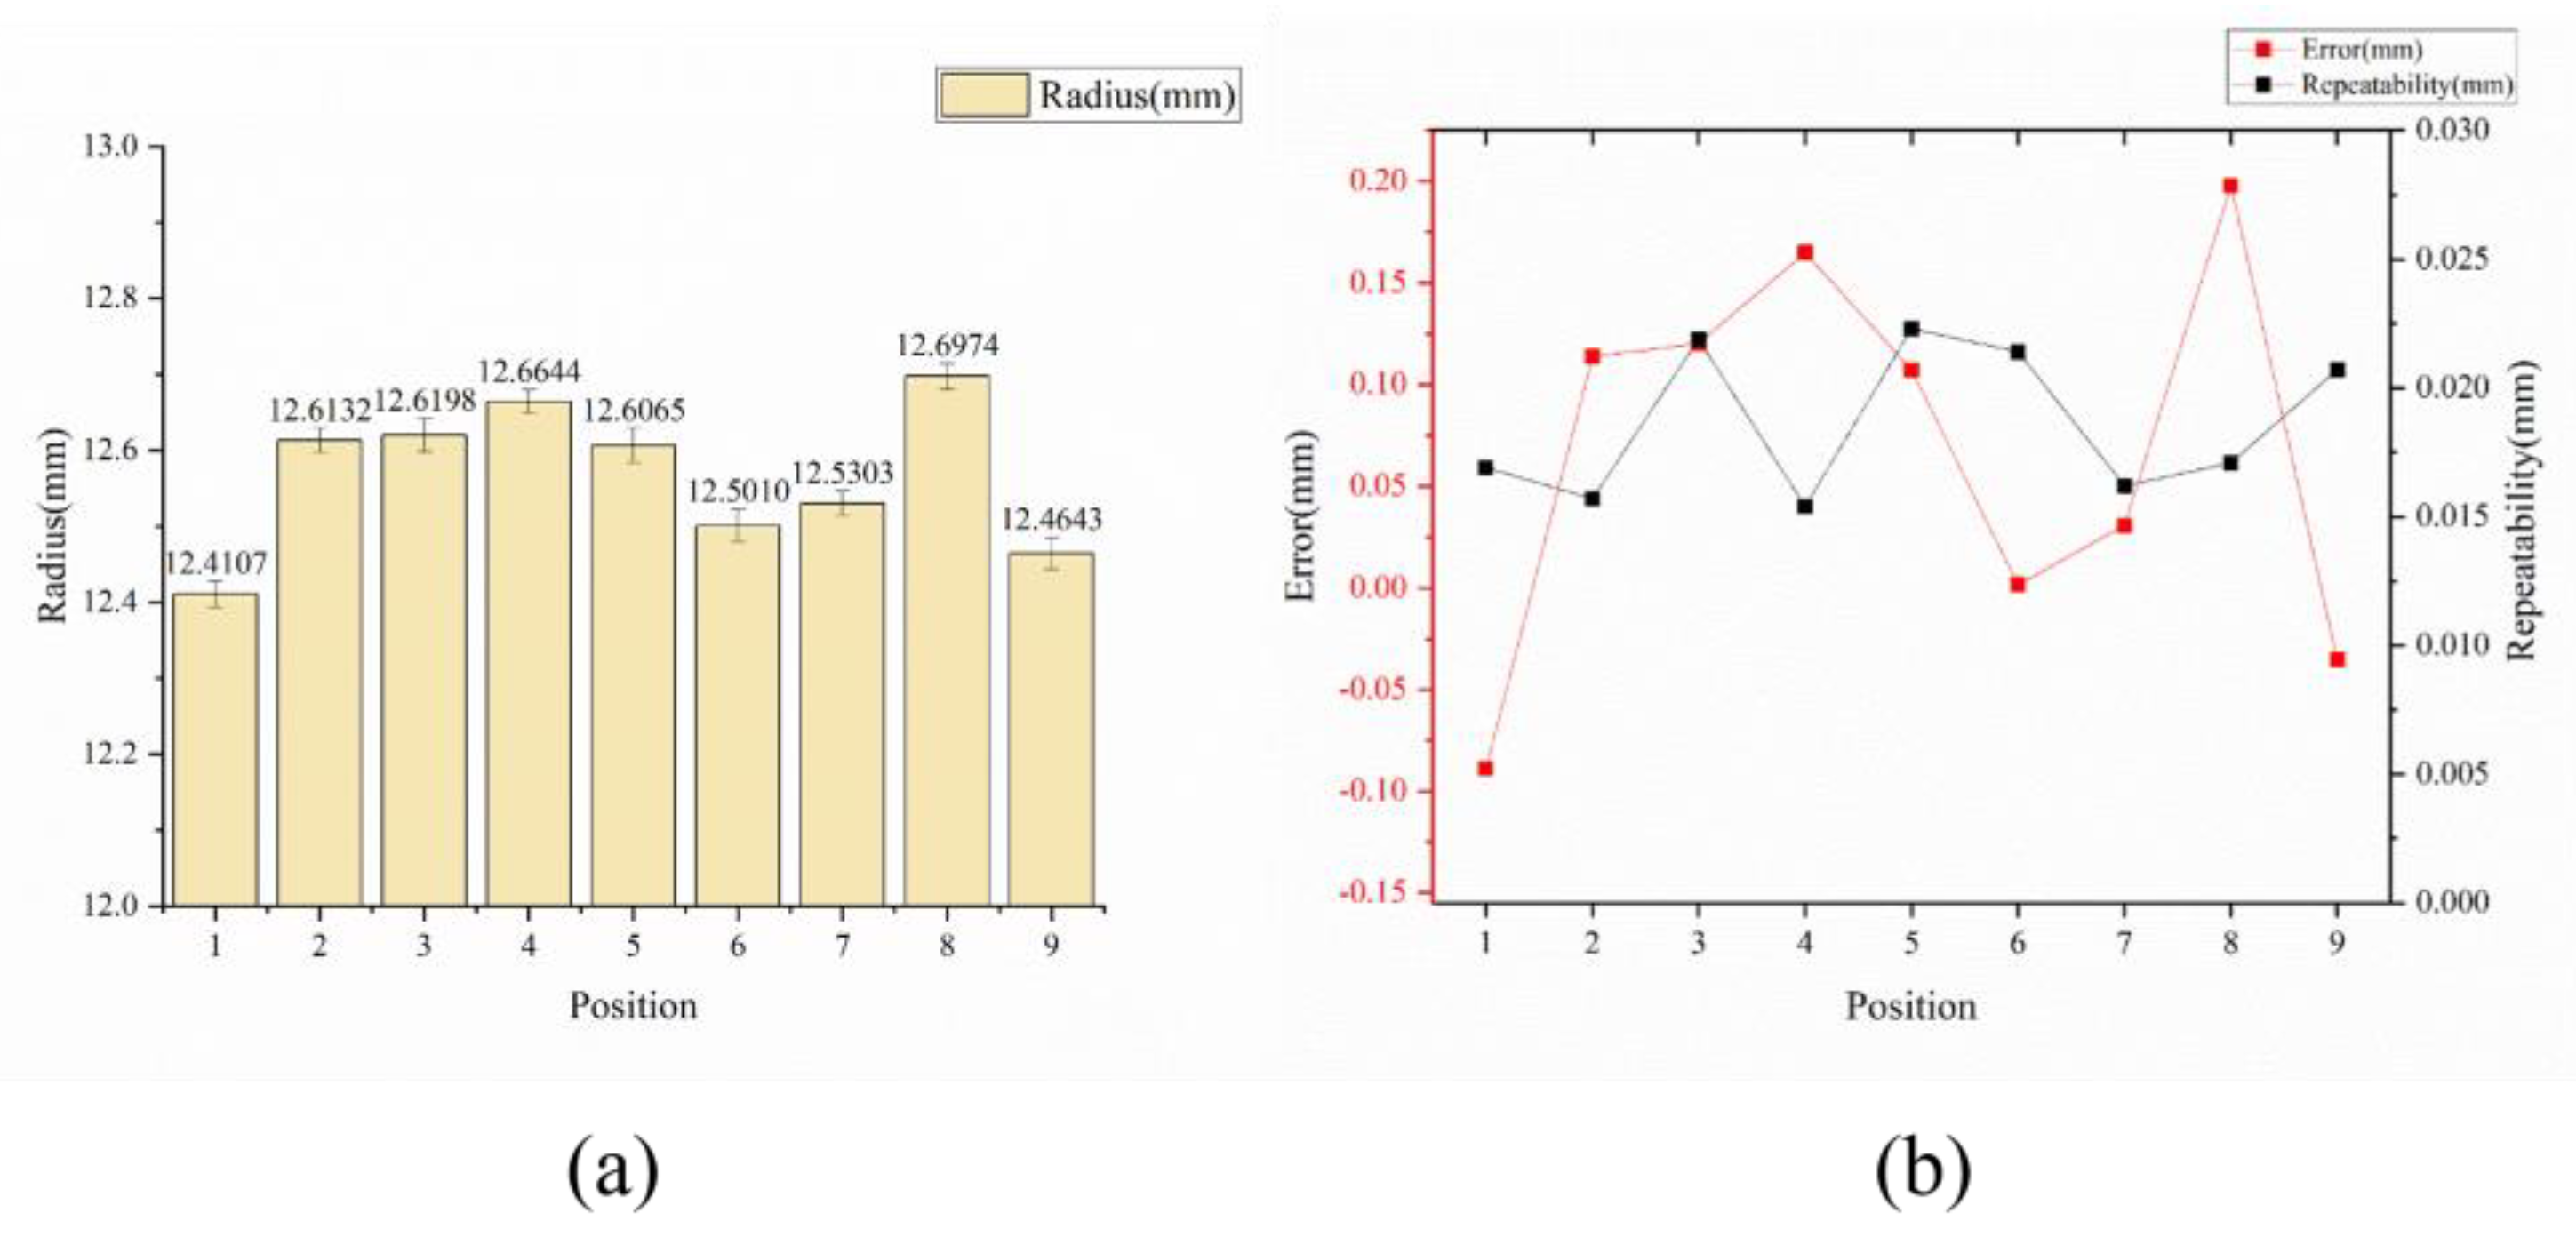
The results of this experiment depicted in
Figure 14 indicate that the measurements taken at different positions using the same velocity and angle produce significantly disparate results, with a maximum error of 0.1979 mm and a minimum error of 0.0015 mm. While the magnitude of the error exhibits a degree of uncertainty, the repeatability demonstrates relatively stable fluctuations around 0.02 mm. The results also show that the error caused by the measurement position is irregular and difficult to decouple.
6. Discussion
The results of this experiments show that the optimal approaching velocity for the measuring device composed of a 6−DOF industrial robot holding a probe is approximately 2 mm/s, the optimal way of contact is a perpendicular touch, the maximum absolute value of the measurement error within the specified range is 0.1979 mm, and the repeatability is 0.0219 mm. This indicates that the measuring device is capable of automatically measuring curved surfaces.
However, compared to commercially available AACMMs, the measurement accuracy of the measuring device is not high enough. Before it is put into practical use, it is necessary to perform an error compensation for each error source identified in the error analysis in order to improve the measurement accuracy.
Simultaneously, in the measurement experiment, the measuring device is used to measure a calibration ball, so it is without doubt that the measuring instrument is capable of measuring convex surfaces. However, during the measurement of concave surfaces, blind spots may occur due to the presence of the probe radius. Therefore, the measuring device still needs improvement in its ability to measure concave surfaces.
Moreover, in real industrial environments, especially with the rise of multi−variety and small−batch productions, there is a need for rapid switching between measurement tasks. At present, the measurement program of the measuring device requires manual replacement and has not achieved full automation. This reduces the measurement efficiency to some extent.
7. Conclusions
This paper presents a measuring device that uses a 6−DOF industrial robot to hold a probe to realize the basic functions of an AACMM. Compared to traditional AACMMs, the measurement method changes from manual measurement to automatic measurement, thus eliminating the operator error. From the perspective of three measurement parameters (approaching velocity, measurement angle, and measurement position), the sources of the measurement error are analyzed and a calibration ball measurement experiment is conducted. Through experiments, the optimal approaching velocity, the optimal contact angle, the error, and the repeatability of the measuring device are determined.
Our future work will be dedicated to enhancing the measurement accuracy by compensating for various errors of the measuring device. Additionally, the ability of the measuring device to measure formed parts will be improved. A major priority of our future work will be to achieve smooth switching between different measurement tasks.
Author Contributions
Conceptualization, L.L.; methodology, L.L. and Y.S.; software, Y.S.; validation, Y.S., F.W., J.S. and S.X.; formal analysis, Y.S.; resources, L.L.; data curation, Y.S.; writing—original draft preparation, Y.S.; writing—review and editing, Y.S. and L.L; supervision, L.Z.; project administration, L.L.; funding acquisition, L.L. All authors have read and agreed to the published version of the manuscript.
Funding
This work is multiple supported by the Natural Science Foundation of the Jiangsu Higher Education Institution of China (grant No: 22KJB460034), Undergraduate Training Program for Innovation and Entrepreneurship, Soochow University (No. 202210285051Z).
Institutional Review Board Statement
Not applicable.
Informed Consent Statement
Not applicable.
Data Availability Statement
Not applicable.
Conflicts of Interest
The authors declare no conflict of interest.
References
- Tirkel, I.; Rabinowitz, G. Modeling cost benefit analysis of inspection in a production line. Int. J. Prod. Econ. 2014, 147, 38–45. [Google Scholar] [CrossRef]
- Foumani, M.; Gunawan, I.; Smith−Miles, K.; Ibrahim, M.Y. Notes on Feasibility and Optimality Conditions of Small−Scale Multifunction Robotic Cell Scheduling Problems With Pickup Restrictions. IEEE Trans. Ind. Inform. 2014, 11, 821–829. [Google Scholar] [CrossRef]
- Wu, Z.-G.; Lin, C.-Y.; Chang, H.-W.; Lin, P.T. Inline Inspection with an Industrial Robot (IIIR) for Mass−Customization Production Line. Sensors 2020, 20, 3008. [Google Scholar] [CrossRef] [PubMed]
- Li, D.; Wang, B.; Tong, Z.; Blunt, L.; Jiang, X. On−machine surface measurement and applications for ultra−precision machining: A state−of−the−art review. Int. J. Adv. Manuf. Technol. 2019, 104, 831–847. [Google Scholar] [CrossRef]
- Xing, T.; Zhao, X.; Song, L.; Cui, Z.; Zou, X.; Sun, T. On−machine measurement method and geometrical error analysis in a multi−step processing system of an ultra−precision complex spherical surface. J. Manuf. Process. 2022, 80, 161–177. [Google Scholar] [CrossRef]
- Shang, H.; Liu, C.; Wang, R. Measurement methods of 3D shape of large−scale complex surfaces based on computer vision: A review. Measurement 2022, 197, 111302. [Google Scholar] [CrossRef]
- Moona, G.; Kumar, V.; Jewariya, M.; Kumar, H.; Sharma, R. Measurement uncertainty assessment of articulated arm coordinate measuring machine for length measurement errors using Monte Carlo simulation. Int. J. Adv. Manuf. Technol. 2022, 119, 5903–5916. [Google Scholar] [CrossRef]
- Mohajan, H.K. Two Criteria for Good Measurements in Research: Validity and Reliability. Ann. Spiru Haret Univ. Econ. Ser. 2017, 17, 59–82. [Google Scholar] [CrossRef] [PubMed]
- Vrhovec, M.; Munih, M. Improvement of coordinate measuring arm accuracy. In Proceedings of the 2007 IEEE/RSJ International Conference on Intelligent Robots and Systems, San Diego, CA, USA, 29 October 2007–2 November 2007; IEEE: Piscataway, NJ, USA, 2007; pp. 697–702. [Google Scholar]
- Santolaria, J.; Yagüe, J.A.; Jiménez, R.; Aguilar, J.J. Calibration−based thermal error model for articulated arm coor−dinate measuring machines. Precis. Eng. 2009, 33, 476–485. [Google Scholar] [CrossRef]
- Gatti, G.; Danieli, G. A practical approach to compensate for geometric errors in measuring arms: Application to a six−degree−of−freedom kinematic structure. Meas. Sci. Technol. 2007, 19, 015107. [Google Scholar] [CrossRef]
- Brau, A.; Valenzuela, M.; Santolaria, J.; Aguilar, J.J. Evaluation Of Different Probing Systems Used In Articulated Arm Coordinate Measuring Machines. Metrol. Meas. Syst. 2014, 21, 233–246. [Google Scholar] [CrossRef]
- Cheng, W.; Fei, Y.; Yu, L.; Yang, R. Probe parameters calibration for articulated arm coordinate measuring machine. In Proceedings of the Sixth International Symposium on Precision Engineering Measurements and Instrumentation, Hangzhou, China, 8–11 August 2010; p. 75445. [Google Scholar]
- Gao, G.; Wang, W.; Lin, K.; Chen, Z. Kinematic Calibration for Articulated Arm Coordinate Measuring Machines Base on Particle Swarm Optimization. In Proceedings of the 2009 Second International Conference on Intelligent Computation Technology and Automation, Changsha, China, 10–11 October 2009; Volume 1, pp. 189–192. [Google Scholar] [CrossRef]
- Acero, R.; Brau, A.; Santolaria, J.; Pueo, M. Verification of an articulated arm coordinate measuring machine using a laser tracker as reference equipment and an indexed metrology platform. Measurement 2015, 69, 52–63. [Google Scholar] [CrossRef]
- Cheng, L.; Wang, W.; Weng, Y.; Shi, G.; Yang, H.; Lu, K. A novel kinematic parameters identification method for ar−ticulated arm coordinate measuring machines using repeatability and scaling factor. Math. Probl. Eng. 2018, 2018, 1760190. [Google Scholar] [CrossRef]
- Wang, C.; Wang, W.; Xu, J.; Lu, K.; Sang, Z.; Chen, Z. Research on improving the measurement accuracy of the AACMM based on indexing joint. Meas. Sci. Technol. 2021, 32, 115011. [Google Scholar] [CrossRef]
- Gąska, A.; Gąska, P.; Harmatys, W.; Gruza, M.; Sładek, J. Simple method for articulated arm coordinate measuring machines task−specific accuracy assessment. Meas. Sens. 2021, 18, 100158. [Google Scholar] [CrossRef]
- Sadaoui, S.E.; Phan, N.D.M. Touch probe measurement in dimensional metrology: A review. Int. J. Automot. Mech. Eng. 2021, 18, 8647–8657. [Google Scholar] [CrossRef]
- Urban, J.; Beranek, L.; Koptiš, M.; Šimota, J.; Košťák, O. Influence of CMM scanning speed and inspected feature size on an accuracy of size and form measurement. Manuf. Technol. 2020, 20, 538–544. [Google Scholar] [CrossRef]
- ISO 10360–12:2016; Geometrical Product Specifications (GPS)—Acceptance and Reverification Tests for Coordinate Measuring Systems (CMS)—Part 12: Articulated Arm Coordinate Measurement Machines (CMM). International Organization for Standardisation: Geneva, Switzerland, 2016.
Figure 1.
Measurement system.
Figure 1.
Measurement system.
Figure 2.
Elfin 10 robot.
Figure 2.
Elfin 10 robot.
Figure 3.
PIONEER TP300 series of cable probe.
Figure 3.
PIONEER TP300 series of cable probe.
Figure 4.
Special fixture.
Figure 4.
Special fixture.
Figure 5.
Electrical interface of Elfin 10 robot electrical box.
Figure 5.
Electrical interface of Elfin 10 robot electrical box.
Figure 6.
Electrical connection.
Figure 6.
Electrical connection.
Figure 7.
Components of the measurement program.
Figure 7.
Components of the measurement program.
Figure 8.
Measurement process flow chart.
Figure 8.
Measurement process flow chart.
Figure 9.
Schematic diagram of perpendicularity error.
Figure 9.
Schematic diagram of perpendicularity error.
Figure 10.
(a)The calibration ball. (b) Measuring device measuring the calibration ball.
Figure 10.
(a)The calibration ball. (b) Measuring device measuring the calibration ball.
Figure 11.
The mean value (a), error, and repeatability (b) of the radius of the calibration ball measured at different approach velocity.
Figure 11.
The mean value (a), error, and repeatability (b) of the radius of the calibration ball measured at different approach velocity.
Figure 12.
Schematic diagram of altering the measurement angle.
Figure 12.
Schematic diagram of altering the measurement angle.
Figure 13.
The error of the z coordinate at different measuring angles.
Figure 13.
The error of the z coordinate at different measuring angles.
Figure 14.
The mean value (a), error, and repeatability (b) of the radius of the calibration ball measured at different measurement position.
Figure 14.
The mean value (a), error, and repeatability (b) of the radius of the calibration ball measured at different measurement position.
Table 1.
Technical parameters of Elfin 10 robot.
Table 1.
Technical parameters of Elfin 10 robot.
| Name | Parameter |
|---|
| Weight | 43 kg |
| Payload | 10 kg |
| Reach | 1000 mm |
| Power consumption | 350 W typical application |
| Joint range | ±360° |
| Joint velocity | J1−J2 100 °/s |
| J3−J4 150 °/s |
| J5−J6 180 °/s |
| Tool velocity | 2 m/s |
| Repeatability | ±0.03 mm |
Table 2.
Technical parameters of PIONEER TP300 series of cable probe.
Table 2.
Technical parameters of PIONEER TP300 series of cable probe.
| Name | Parameter |
|---|
| Stylus sensing direction | ±X, ±Y, and +Z |
| Stylus sensing over−travel | X,Y ± 15° and Z + 5 mm |
| The trigger force in Z direction | 1000 g |
| Trigger force in X—Y surface (standard stylus) | 65–130 g |
| Unidirectional repeatability (2σ) | ≤2 μm |
| Seal grade | IP68 |
Table 3.
Measurement results of the approach velocity experiment.
Table 3.
Measurement results of the approach velocity experiment.
| Velocity (mm/s) | Radius (mm) | Error (mm) | Repeatability (mm) |
|---|
| 1 | 12.6109 | 0.1110 | 0.0169 |
| 2 | 12.6111 | 0.1112 | 0.0219 |
| 4 | 12.6343 | 0.1344 | 0.0530 |
| 6 | 12.6163 | 0.1164 | 0.0600 |
| 8 | 12.6530 | 0.1531 | 0.0594 |
| 10 | 12.6889 | 0.1890 | 0.1068 |
Table 4.
The coordinate of the selected measurement points on the calibration ball and the corresponding contact angles.
Table 4.
The coordinate of the selected measurement points on the calibration ball and the corresponding contact angles.
| No. | Coordinate | Angle (°) |
|---|
| 1 | 557.583, 542.367, 513.341 | 46.059 |
| 2 | 558.583, 542.367, 514.271 | 39.796 |
| 3 | 559.583, 542.367, 515.023 | 34.059 |
| 4 | 560.583, 542.367, 515.633 | 28.688 |
| 5 | 561.583, 542.367, 516.123 | 23.580 |
| 6 | 562.583, 542.367, 516.510 | 18.664 |
| 7 | 563.583, 542.367, 516.802 | 13.888 |
| 8 | 566.583, 542.367, 517.167 | 0.000 |
| 9 | 569.583, 542.367, 516.802 | 13.888 |
| 10 | 570.583, 542.367, 516.510 | 18.664 |
| 11 | 571.583, 542.367, 516.123 | 23.580 |
| 12 | 572.583, 542.367, 515.633 | 28.688 |
| 13 | 573.583, 542.367, 515.023 | 34.059 |
| 14 | 574.583, 542.367, 514.271 | 39.796 |
| 15 | 575.583, 542.367, 513.341 | 46.059 |
Table 5.
Measurement results of the contact angle experiment.
Table 5.
Measurement results of the contact angle experiment.
| No. | Angle (°) | Total Error (mm) | Systematic Error (mm) | Random Error (mm) |
|---|
| 1 | 46.059 | 0.9324 | 0.9183 | 0.0141 |
| 2 | 39.796 | 0.7049 | 0.6950 | 0.0099 |
| 3 | 34.059 | 0.5152 | 0.5146 | 0.0006 |
| 4 | 28.688 | 0.3809 | 0.3683 | 0.0126 |
| 5 | 23.580 | 0.2567 | 0.2505 | 0.0062 |
| 6 | 18.664 | 0.1598 | 0.1578 | 0.0020 |
| 7 | 13.888 | 0.1096 | 0.0877 | 0.0219 |
| 8 | 0.000 | −0.0015 | 0.0000 | −0.0015 |
| 9 | 13.888 | 0.0880 | 0.0877 | 0.0003 |
| 10 | 18.664 | 0.1633 | 0.1578 | 0.0056 |
| 11 | 23.580 | 0.2587 | 0.2505 | 0.0082 |
| 12 | 28.688 | 0.3883 | 0.3683 | 0.0200 |
| 13 | 34.059 | 0.5230 | 0.5146 | 0.0084 |
| 14 | 39.796 | 0.7006 | 0.6950 | 0.0056 |
| 15 | 46.059 | 0.9458 | 0.9183 | 0.0275 |
Table 6.
Measurement results of the measurement position experiment.
Table 6.
Measurement results of the measurement position experiment.
| Position | Radius (mm) | Error (mm) | Repeatability (mm) |
|---|
| 1 | 12.4107 | −0.0888 | 0.0169 |
| 2 | 12.6132 | 0.1137 | 0.0157 |
| 3 | 12.6198 | 0.1203 | 0.0219 |
| 4 | 12.6644 | 0.1649 | 0.0154 |
| 5 | 12.6065 | 0.1070 | 0.0223 |
| 6 | 12.5010 | 0.0015 | 0.0214 |
| 7 | 12.5303 | 0.0308 | 0.0162 |
| 8 | 12.6974 | 0.1979 | 0.0171 |
| 9 | 12.4643 | −0.0352 | 0.0207 |
| Disclaimer/Publisher’s Note: The statements, opinions and data contained in all publications are solely those of the individual author(s) and contributor(s) and not of MDPI and/or the editor(s). MDPI and/or the editor(s) disclaim responsibility for any injury to people or property resulting from any ideas, methods, instructions or products referred to in the content. |
© 2023 by the authors. Licensee MDPI, Basel, Switzerland. This article is an open access article distributed under the terms and conditions of the Creative Commons Attribution (CC BY) license (https://creativecommons.org/licenses/by/4.0/).


