Abstract
Based on Jiles–Atherton theory and the quadratic law, a displacement model for giant magnetostrictive actuators (GMA) has been developed. The Runge–Kutta method is used to solve the nonlinear differential equation of the hysteresis model in a segmented magnetic field. Aiming at the problem that the model parameters are coupled with each other and difficult to estimate, a heuristic intelligent search algorithm-differential evolution algorithm (DE) is employed to implement parameter identification. In order to verify the effectiveness of the algorithm, comparative studies with the genetic algorithm (GA) and the particle swarm optimization (PSO) applied in parameter identification are performed. The simulation results demonstrate that the algorithm has the advantages of requiring few control variables, fast convergence speed, stable identified results, and excellent repeatability. Furthermore, the experimental results demonstrate that the output displacements calculated from the identified model are in great agreement with the measured values. Accordingly, the DE can identify the parameters of a displacement model for giant magnetostrictive actuators with satisfactory accuracy and reliability.
1. Introduction
The giant magnetostrictive actuator (GMA), which has the properties of compact size, high force, large strain, and fast response, has been widely applied in ultra-precision machining, micro-machining, micro-vibration control, and precision positioning, etc. [1,2,3]. However, the physical model parameters of GMA are related to the magnetization process. The relation between the generated displacement and input magnetic field exhibits dominant hysteresis and nonlinearity. Therefore, it is crucial to establish an effective hysteresis nonlinear model to achieve accurate displacement control. According to ferromagnetic magnetization theory, the Jiles–Atherton model is developed [4,5]. Under the condition of constant magnetic field change, the model has promising performance in describing the magnetization process of giant magnetostrictive material. Furthermore, it is a common low-order differential equation, which can clearly describe the nonlinearity between the magnetic field intensity and magnetization, and is easy to implement in practical application. Calkins and Dapino et al. [6,7] established the displacement hysteresis nonlinearity model for GMA by combing the Jiles–Atherton model with a quadratic moment domain rotation model [8]. However, because six physical parameters of the displacement model are coupled with each other, it is difficult and complicated to realize parameter identification in practical application.
Jiles et al. calculated hysteresis model parameters from experimental measurements of the coercivity, remanence, saturation magnetization, initial normal susceptibility, and the maximum differential susceptibility [9]. Calkins et al. optimized the model parameters by using a constrained optimization algorithm based upon sequential quadratic programming updates and a least squares fit with displacement data [6]. In order to avoid unconvergence of the identification, Lederer et al. adopted a simulated annealing optimization method to identify the hysteresis parameters [10]. Cao et al. optimized the hysteresis parameters using a genetic algorithm (GA) and then established a hybrid intelligent algorithm to solve the weak capacity of climbing hill of the genetic algorithm [11,12]. Kis et al. accomplished parameter identification of the Jiles–Atherton model with a nonlinear least-square method based on the measurement data [13]. Zheng et al. developed a hybrid genetic algorithm combining a gradient algorithm with a conventional genetic algorithm to accomplish parameter identification [2]. To prevent the premature convergence of the genetic algorithm and avoid slowness of convergence rate of the simulated annealing algorithm, Liu et al. proposed an improved genetic simulated annealing algorithm [14]. Knypinski et al. presented the particle swarm optimization (PSO) [15]. Further, Yang et al. improved PSO with a dynamically-adjusting inertia weighting, study factors, and genetic variation to overcome premature convergence and easily falling into local optimum in later iterations of PSO [16]. In addition, Yang et al. employed the PSO with a time-varying weight and an adaptive mutation stage to improve the global convergence performance [17]. Toman et al. utilized differential evolution (DE) to realize parameter identification of the hysteresis model [18].
Based on the above analysis, parameter identification of a hysteresis nonlinear model for GMA generally uses GA and PSO. However, the GA easily falls into prematurity and its convergence speed is too slow. The PSO is unstable, and the final optimized results are easily influenced by the number of parameters and the initial population. Even though other scholars apply differential evolution to identify hysteresis parameters, the method is only limited to the Jiles–Atherton model. Compared with the GA and PSO, the DE has faster convergence speed, fewer adjustable parameters, and lower probability in falling into local optimum. In this paper, the differential evolution (DE) algorithm is employed to implement parameter identification of a displacement model for GMA accordingly.
2. Displacement Model for Giant Magnetostrictive Actuator
2.1. Structure and Working Principle of Giant Magnetostrictive Actuator
The structure of a GMA made of giant magnetostrictive material (e.g., Terfenol-D) is shown in Figure 1. The axial dimension of a Terfenol-D rod changes under the action of the magnetic field generated from the drive current of the coil. In order to obtain different displacement, the current in the drive coil can be changed. As shown in Figure 1, a disk spring provides an adjustable prestress which can improve the output characteristic of the Terfenol-D rod by adjusting the thread fit distance between the preload nut and head cover. A closed magnetic circuit is formed by connecting the Terfenol-D rod, magnetizer, and magnetic yoke. The pickup coil is employed to obtain the magnetic field change caused by inverse magnetostrictive effect when the output shaft has external mechanical constraints.
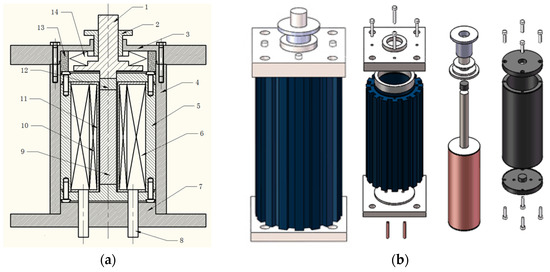
Figure 1.
Schematic diagram of GMA structure: (a) Two-dimensional structure diagram: 1 output shaft, 2 preload nut, 3 head cover, 4 non-magnetic shell, 5 magnetic yoke, 6 drive coil, 7 base of GMA 8 cooling pipe, 9 Terfenol-D rod, 10 pickup coil, 11 coil frame, 12 magnetizer, 13 limit cylinder, 14 disk spring; (b) Solid diagram of GMA.
2.2. Establishment of Displacement Model
The establishment of a displacement model for GMA is performed in two steps. Firstly, a magnetic hysteresis model is established under the Jiles–Atherton theory. The second step mainly concerns the magnetomechanical model which is established according to the quadratic law. The Jiles–Atherton model has been used to describe the relationship between the applied magnetic field and magnetization intensity . The hysteresis model based on the domain wall theory of ferromagnetic material is determined from Equation (1) to Equation (5). The equations discuss the relationships among the effective applied magnetic field , the anhysteretic magnetization , the irreversible magnetization , the reversible magnetization , and the total magnetization [19]:
where is the quantifies domain interactions parameter, is the shape parameter for , is saturation magnetization, is the irreversible loss coefficient, and is the reversibility coefficient. In addition, ensures that the pinning process always impedes magnetization, i.e., is +1 when the magnetic field H increases and −1 when the H decreases. As in Equation (1), He is the sum of the external applied magnetic field H and long range magnetic coupling , and the value of H is determined by the current of the drive coil. That is, H = NI/L (N is the coil turns, L is the axial length of the drive coil).
The magnetostriction coefficient indicates the relative change in length of the giant magnetostrictive material from the ordered to the state in which domains are aligned, where represents the length of the Terfenol-D rod and represents the displacement change of GMA. The absolute value of is proportional to the change of the magnetic field. When the magnetic field intensity increases to a critical value, the magnetostriction coefficient no longer changes and finally reaches a saturation value. Under a specific prestress and magnetic field, is shown to be an even function of the magnetization M for isotropic material. In the view of energy analysis, the magnetomechanical model form is given by Equation (6) to Equation (7):
where denotes the saturation magnetostriction, Ms denotes the saturation magnetization, and denotes the secondary magnetostriction coefficient.
In combination, the output displacement model for GMA is described by Equation (1) to Equation (7). The displacement change can be calculated according to the applied magnetic field generated by the current in the drive coil. However, to obtain the output displacement, the parameters of the displacement model need to be identified.
2.3. Solution of Nonlinear Differential Equation
In order to implement the parameter identification, it is essential to solve the nonlinear differential equation in the Jiles–Atherton hysteresis model. As in Equation (3), it is a nonlinear differential equation of the first order. We assume that the anhysteretic magnetization Man is an invariant constant. A nonlinear ordinary differential equation of the first order is derived from Equation (3). Then the Runge–Kutta method, as a numerical solution of differential equations, is employed to solve the equation. Since the parameter Man is mutually coupled with other variables, the value of Man is constantly changing. If the magnetic field is in a wide range, a large error can be generated by using the Runge–Kutta method to solve the equation with a fixed Man. To obtain accurate solutions, we solve the nonlinear differential equation in a segmented magnetic field as follows:
- (1)
- The magnetic field range [Hmin Hmax] is divided into N small intervals with the length .
- (2)
- The effective magnetic field He is calculated by substituting the lower limit into (1) and obtaining the approximate from Equation (2); here m is an integer belonging to [0 N]
- (3)
- Substituting into Equation (3), we obtain a nonlinear ordinary differential equation of the first order. Normalization processing is performed by introducing variable t. The fourth-order Runge–Kutta method is used to solve the differential equation in the range of small intervals.
- (4)
- We calculate the approximate magnetization M by substituting and obtained in the previous step into Equations (4) and (5).
- (5)
- If the whole solution procedure is not completed, the next loop continues with the loop variable being modified.
The Runge–Kutta method is a numerical algorithm for the initial value problem of a differential equation. Using this method, we can find approximate discrete solutions for a differential equation with a given initial value. The fourth-order Runge–Kutta method, which meets the accuracy requirements in most applications, has been widely used. As shown in Equations (8)–(10), the calculation is to predict the function value y(xn + h) (i.e., yn+1) with y(xn) (i.e., yn) in the interval [xn xn + h]; here h is the step size [20]. The differential equation and initial value can be expressed as
The fourth-order Runge–Kutta method is given by the equation
where
Using the above Runge–Kutta method to solve the nonlinear differential equation in the hysteresis model of GMA, we yield the differential equation and initial value as follows:
In order to ensure convergence in the solving process, the value of the step size should be between 0 and 1. Accordingly t is introduced to replace the original variable H in the interval . The normalization processing is given by:
As shown in Equation (15), the differential equation and initial value are derived from Equation (11) to Equation (14) after the normalization of the hysteresis nonlinear model.
Clearly, the initial value of each interval is constantly changing in the loop of solutions. The range of the magnetic field is divided into N intervals. In each interval, the Runge–Kutta method is used to solve the nonlinear differential equation with updated and initial value. Finally, we obtain N magnetization values corresponding with N discrete magnetic field values.
3. Parameter Identification of Displacement Model
3.1. Principle of Model Parameter Identification
Model parameter identification is to estimate a set of parameters which ensure that the prediction model can best match the actual model. Based on large numbers of experimental data and the established theoretical model, the parameter identification is performed, i.e., calculation results are derived from the theoretical model with estimated parameters that can agree well with the experimental measurement. As a result, an accurate theoretical model according with actual process is determined. The parameter identification principle of a displacement model for GMA is shown in Figure 2. Firstly, the value range of parameter is determined and a prediction model is obtained through selecting a random in this range. Under the action of the input current, theoretical displacement is calculated from the prediction model. Meanwhile, actual displacement of GMA is obtained from the sensor. Then, model parameters are modified by using a differential evolution algorithm on the basis of error . Finally, the values of are optimized through minimization of the objective function, as in (16):
where denotes the objective function, K is the number of total samples, denotes the nth time sample, is the number of parameters to be identified, is the jth element of the parameter , and and respectively denote the lower limit and upper limit of .
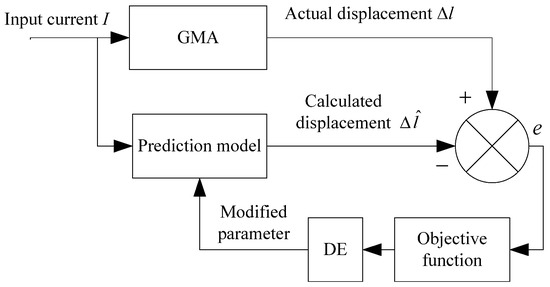
Figure 2.
Identification process of GMA.
3.2. Parameter Identification Using Differential Evolution Algorithm
Differential evolution (DE), proposed by Rainer Storn and Kenneth Price, is a heuristic method for global optimization based on population. The method is based on real number encoding, requires few control variables, and is stronger in robustness, easy to use, faster in convergence, and easily realizes parallel computation. Accordingly, it is suitable for solving optimization problems in a complex environment [21,22].
The DE mainly contains three operations: mutation, crossover, and selection. The crux of the algorithm is to start from a randomly generated initial population which should cover the entire parameter space. On the assumption that a preliminary solution is available, the initial population might be generated by adding normally distributed random deviations to the nominal solution. In accordance with certain rules, DE generates new mutated vectors by adding the weighted difference between two population vectors to a third vector. Next, we yield the so-called trial vector by mixing the mutated vectors with the parameters of another predetermined vector, the target vector. If the trial vector yields a better fitness value than the target vector, the trial vector replaces the target vector in the following generation. Otherwise, the target vector is preserved. The basic strategy of DE can be described as follows.
(1) Generating an initial population. In the feasible solution space, the initial population is generated randomly according to Equation (17):
where D denotes the dimension of estimated parameters, NP is the population size, and respectively denote the upper and lower bound of the jth chromosome, and is a random decimal between 0 and 1.
(2) Mutation. The basic mutation strategy randomly selects three individuals , , , and i ≠ p1 ≠ p2 ≠ p3; the operation is given by
where is the differential variation, F is the mutation factor which controls the amplification of the differential variation, and p1, p2, p3 are the individual sequence numbers in the population. Note that differential operation is the key step of DE. In the absence of local optimization problems, can be replaced by the best individual in the current generation to improve the convergence speed. Thus, from Equation (18) we can obtain:
(3) Crossover. In order to increase the diversity of the perturbed parameter vectors, the crossover is introduced as in (20).
In Equation (20), is a uniform random generator with outcome between 0 and 1. is the crossover probability between 0 and 1, which has to be determined by the user.
(4) Selection. In order to determine whether or not should become a member of the following generation, the trial vector is compared to the target vector using the evaluation function. If the vector yields a smaller evaluation function value than , then is selected as the offspring; otherwise, the vector is retained. The operation can be expressed as:
where is the evaluation function which is determined by Equation (16), and is the evaluation function value corresponding to the trial vector. In the displacement model, as discussed in the previous section, the parameter is estimated by combining model parameter identification with the DE. The implementation procedures of the parameter identification using the DE is shown in Figure 3. The implementation procedures of the parameter identification using the DE are described as follows:
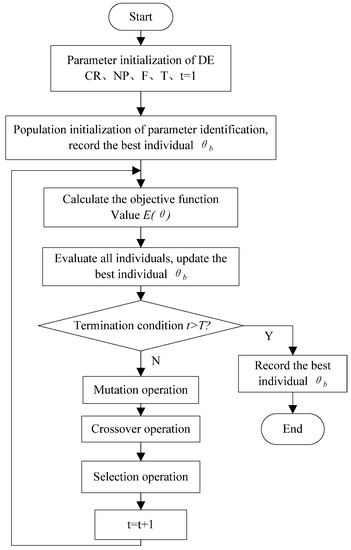
Figure 3.
Flow chart of parameter identification using DE.
Step 1: The search range of the identification parameter for the displacement model is determined. Meanwhile, the population size, the iteration number, mutation factor and crossover probability of the DE are initialized.
Step 2: The initial population of six parameters in is generated according to population size and Equation (17).
Step 3: The fitness value of each individual is evaluated according to Equation (16), and the best individual BestS is selected based on the fitness value.
Step 4: Using the mutation strategy DE/best/1 proposed by Price and Storn, the mutated individual generates after the operation in Equation (19).
Step 5: Based on Equation (20), the new individual is obtained through the crossover operation between the current individual and the mutation individual .
Step 6: In view of the greedy strategy from Equation (21), the best individual which can be retained to the following generation is selected.
Step 7: The objective function value of the ith time individual is calculated and compared to that of the best individual BestS. Next, it is decided whether or not the best individual BestS is to be updated according to the objective function value.
Step 8: If the iteration number exceeds the maximum generation number, then the search for model parameter should be terminated and the best individual BestS be considered as the final identified parameter . Otherwise, go to step 4 and repeat the above operations.
4. Identification Results and Experimental Analysis
4.1. Design of Experimental System
The experimental measurement system designed for parameter identification of GMA is shown in Figure 4. The system mainly consists of a GMA, a digital controlled current source, a laser displacement sensor, a data acquisition module, a control system, and a cooling system. In the experimental system, the Digital Controlled Current Source controls the drive coil of the GMA and causes the GMA to output different displacement by adjusting the output current. The system obtains the GMA output displacement collected by the Laser Displacement Sensor through the Data Acquisition Module. The stabilized voltage supply provides power for the Laser Displacement Sensor. A membrane air dryer, gas manometer, and air compressor comprise a cooling system to stabilize the temperature of the GMA drive coil and reduce the error caused by temperature rise. The coil and the Terfenol-D rod are the core components of the GMA, and their physical parameters are described as follows: the number of coil turns is N = 3800, the axial length of the coil is mm, the diameter of the Terfenol-D rod is , and the length of the rod is . The digital controlled current source YL2410 is a bipolar programmable power supply whose output accuracy is ±0.001 A. The laser sensor LK-031 with a measuring range of and repeatability 1 µm2 is used to measure GMA’s output displacement in real time. The data acquisition USB-4711A-AE with 16 channels, 12 bits resolution and 150 ks/s sampling rates is adopted. With current 1 A as the maximum value Imax and 0 A as the minimum value Imin, the displacement measurement process is repeated ten times under the action of the current from Imin to Imax. In the operation of single time measurement, the total measurement data are 6300 with a current change step of 0.01 A, a current change frequency of 1 Hz, and a data acquisition rate of 63 bits/s (i.e., output displacement is sampled 63 times under the action of the same current). Therefore, the average of 63 displacements should be calculated as the output value corresponding to the same current. Then, 100 groups of data I(n) and are obtained to be applied in parameter identification.

Figure 4.
The experimental test system: (a) System connection diagram; (b) GMA actuator.
4.2. Parameter Identification Results
In the identification experiment, the population size is initialized to 100, the total iteration number is set to 500, and the objective function is as in Equation (16). Taking the measured data as the sample, we respectively use the GA, PSO, and DE to identify the displacement model parameters for the GMA. Here the GA’s parameters are crossover probability Pc = 0.8 and mutation probability Pm = 0.1. The learning factors of the PSO are c1 = 1.3 and c2 = 1.7, and in addition, its inertia weight becomes smaller in linearity from wmax = 0.9 to wmin = 0.1. The DE’s parameters are mutation factor F = 0.8 and crossover probability CR = 0.9 [23,24,25]. Parameter identification of evolution processes are shown in Figure 5a–c through repeating the identification five times randomly. The results obtained from different optimization algorithms are summarized in Table 1, Table 2 and Table 3.

Figure 5.
Identification evolution process: (a) GA; (b) PSO; (c) DE.

Table 1.
Repeated identification results of the GA.

Table 2.
Repeated identification results of the PSO.

Table 3.
Repeated identification results of the DE.
The results obtained from running the GA are illustrated in Table 1. The final objective function values are different, and the minimum value is 0.1567 μm2. During the identification procedure, the objective function is easy to converge to a certain value and does not reduce any further. The algorithm falls into local convergence, and the premature convergence occurs. Furthermore, the difference of five iteration times achieving the stable convergence value is large, and the average iteration number is more than 200. As shown in Table 2, the minimum objective function value of the PSO is 0.1462 μm2, which is significantly less than that of the GA. However, the search ability becomes poor in the late stage of the identification algorithm. The convergence is slow with the average of iteration times being more than 250. Compared with the results using of GA and PSO, the variance of repeated identification results for parameters , , and is approximate to zero and the identified parameter change is stable by using DE. After about 100 iterations, the objective function value converges to 0.1352 μm2. It is clear that the DE has the advantages of fast convergence speed, accurate identification parameters, stable objective function value, and excellent global convergence capability. In order to further verify the performance of the DE, a simulation is performed by using identified parameters available in Table 3.
The displacement-current characteristic curves are shown in Figure 6. It is noted that the output displacements of the GMA, which are calculated from four groups of identified parameters, are in great agreement. Thus, the DE algorithm has excellent repeatability and stability.
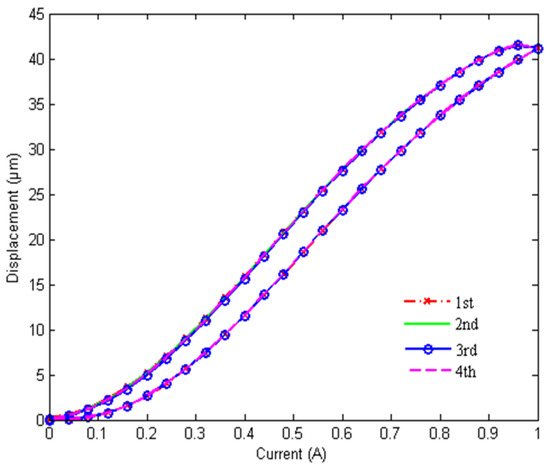
Figure 6.
Four simulation results of the DE.
4.3. Experimental Results Analysis
As illustrated in Table 1, Table 2 and Table 3, the best parameters identified by using GA, PSO, and DE are respectively put into the displacement model shown in Equations (1)–(7) and corresponding models are obtained. Based on the identified models, the output displacements are calculated and compared with the measurement data. The detailed comparisons between simulations and experiments are shown in Figure 7a–c. Figure 7d describes the errors between theoretical values and measurement values with different optimization algorithms. The average relative errors of the GA, PSO, and DE are 10.63%, 9.5%, and 5.02%, respectively. Experimental results indicate that the output displacements of the model calculated according to the DE agree well with the measured values. Clearly, the identification accuracy of the DE is higher than that of the other two algorithms.
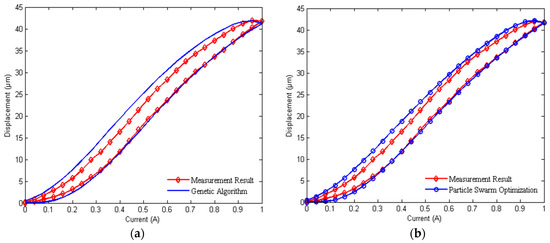
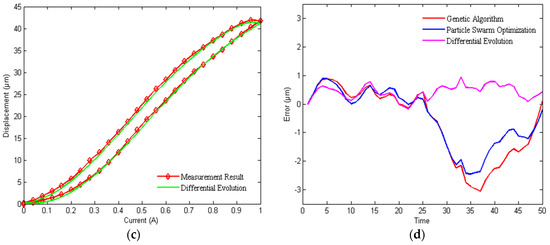
Figure 7.
Comparison of simulation results and experimental results: (a) Measurement result and Genetic Algorithm; (b) Measurement result and Particle Swarm Optimization; (c) Measurement Result and Differential Evolution; (d) the time of Genetic Algorithm, Particle Swarm Optimization, and Differential Evolution.
When the current changes from 0 A to 1 A with the step of 0.01 A, the average relative errors are obtained, 4.87%, 5.02%, 5.24% and 5.16%, respectively, by comparing simulation results calculated from the four groups of identified parameters available in Table 3 with experimental results. In three current ranges such as 0–0.4 A, 0–0.7 A and 0–1 A, the output displacements of the GMA are calculated from the identified parameter with the minimum relative error. As shown in Figure 8, the calculated results are basically consistent with the measurement results. In addition, under the action of twelve different current values which are selected randomly, the displacements are calculated by using the identified parameters of the DE. The comparison results between actual values and calculated values are summarized in Table 4. It is noticeable that the relative errors are almost less than 5%, but at 0.24 A and 0.28 A. The reason is that the system error has a great influence on the result when the current is relatively small. Further, experimental results show that the DE has excellent optimization performance in model parameter identification. Therefore, parameter identification of a displacement model for GMA using DE is convenient and effective.
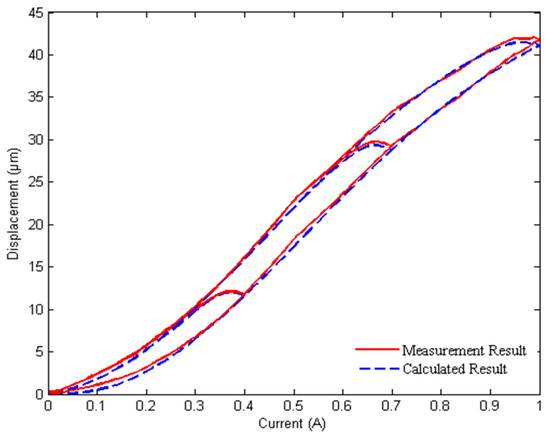
Figure 8.
Comparison results under different current values.

Table 4.
Experimental verification results.
5. Conclusions and Future Work
In this paper, the DE is firstly used to identify the parameters of a nonlinear displacement model for giant magnetostrictive actuator. In order to solve the nonlinear differential equation of the hysteresis model, the Runge–Kutta method is adopted in a segmented magnetic field.
- (1)
- The iteration evolution process and identified results indicate that the DE has better performance compared with the GA and PSO in parameter identification. Using the DE, we have obtained fast convergence speed, high identification accuracy, and excellent global optimization ability. The algorithm itself requires few control variables and the identified results are insensitive to parameter variations. Furthermore, parameter identification of a displacement model for GMA using the DE only requires measuring the input current and output displacement.
- (2)
- Simulation and experimental study are performed based on the experimental test platform of GMA. The results show that parameter identification using the DE has excellent stability and repeatability. The output displacements calculated from the identified model are in great agreement with the measured values and the relative error is less than 5.3%. Therefore, it is effective to apply the DE to parameter identification of a displacement model for GMA. The identified model has a significant value for applications in practical engineering.
The standard DE algorithm is used to identify the parameters of GMA in this paper. In the future, based on the experiments and simulations proposed, the DE algorithm will be improved according to the characteristics of GMA to improve identification accuracy.
Author Contributions
Conceptualization, H.J. and X.J.; methodology, X.J.; software, J.L.; validation, X.J., H.J. and B.R.; formal analysis, X.J.; investigation, B.R.; resources, H.J.; data curation, J.L.; writing—original draft preparation, X.J.; writing—review and editing, H.J.; supervision, H.J.; project administration, X.J.; funding acquisition, X.J. and H.J. All authors have read and agreed to the published version of the manuscript.
Funding
This research was funded by the financial support of National Natural Science Foundation of China (NSFC) under Grant No. 51475267 and The Doctor’s Fund of Zaozhuang University under Grant No. 1020711.
Institutional Review Board Statement
Not applicable.
Informed Consent Statement
Not applicable.
Data Availability Statement
The data that support the findings of this study are available from the corresponding author, [Hongyan Jin], upon reasonable request.
Acknowledgments
The experimental part of the research was supported by Gansu Tianxing Rare Earth Functional Materials Co., Ltd. Moreover, the authors are grateful to the Mingxing Lin of Shandong University and the anonymous reviewers for their constructive comments and helpful suggestions that greatly improved the quality of this article.
Conflicts of Interest
The authors declare no conflict of interest.
References
- Nakamura, Y.; Nakayama, M.; Kura, M.; Yasuda, M.; Fujita, T. Application of active microvibration control system using a giant magnetostrictive actuator. J. Intell. Mater. Syst. Struct. 2007, 18, 1137–1148. [Google Scholar] [CrossRef]
- Zheng, J.J.; Cao, S.Y.; Wang, H.L.; Huang, W.M. Hybrid genetic algorithms for parameter identification of a hysteresis model of magnetostrictive actuators. Neurocomputing 2007, 70, 749–761. [Google Scholar] [CrossRef]
- Zhu, Z.W.; Liu, Y.; Xu, J.; Wang, H.L. Modeling of giant magnetostrictive actuator based on hysteretic nonlinear theory. Int. J. Appl. Electromagn. Mech. 2010, 13, 87–93. [Google Scholar] [CrossRef]
- Jiles, D.C.; Atherton, D.L. Theory of ferromagnetic hysteresis. J. Magn. Magn. Mater. 1986, 61, 48–60. [Google Scholar] [CrossRef]
- Sablik, M.J.; Wun, H.K.; Burkhardt, G.L.; Jiles, D.C. Model for the effect of tensile and compressive stress on ferromagnetic hysteresis. J. Appl. Phys. 1987, 61, 3799–3801. [Google Scholar] [CrossRef]
- Calkins, F.T.; Smith, R.C.; Flatau, A.B. An energy-based hysteresis model for magnetostrictive transducers. IEEE Trans. Magn. 2000, 36, 429–439. [Google Scholar] [CrossRef]
- Dapino, M.J.; Smith, R.C.; Flatau, A.B. Structural magnetic strain model for magnetostrictive transducers. IEEE Trans. Magn. 2000, 36, 545–556. [Google Scholar] [CrossRef]
- Wang, A.M.; Meng, J.J.; Xu, R.X.; Li, D.C. Parameter Identification and Linear Model of Giant Magnetostrictive Vibrator. Discret. Dyn. Nat. Soc. 2021, 2021, 6676911. [Google Scholar] [CrossRef]
- Jiles, D.C.; Thoelke, J.B.; Devine, M.K. Numerical determination of hysteresis parameters for the modeling of magnetic properties using the theory of ferromagnetic hysteresis. IEEE Trans. Magn. 1992, 28, 27–35. [Google Scholar] [CrossRef]
- Lederer, D.; Igarashi, H.; Kost, A.; Honma, T. On the parameter identification and application of the Jiles-atherton hysteresis model for numerical modelling of measured characteristics. IEEE Trans. Magn. 1999, 35, 1211–1214. [Google Scholar] [CrossRef]
- Cao, S.Y.; Wang, B.W.; Yan, R.G.; Huang, W.M.; Yang, Q.X. Optimization of hysteresis parameters for the Jiles-atherton model using a genetic algorithm. IEEE Trans. Appl. Supercond. 2004, 40, 1157–1160. [Google Scholar] [CrossRef]
- Cao, S.Y.; Wang, B.W.; Zheng, J.J.; Yan, R.G.; Huang, M.M. Parameter identification of hysteretic model for giant magnetostrictive actuator using hybrid genetic algorithm. Proc. Chin. Soc. Electr. Eng. 2004, 24, 127–132. Available online: https://kns.cnki.net/kcms/detail/detail.aspx?dbcode=CJFD&dbname=CJFD2004&filename=ZGDC20041000N&uniplatform=NZKPT&v=DcGNqwzbbN4cKv7kRuHKjWb8AQypHBNzpeoKd34LuC0JNGOEvrpH6Yr9pqL_ZocW (accessed on 21 October 2020).
- Kis, P.; Iványi, A. Parameter identification of Jiles–Atherton model with nonlinear least-square method. Phys. B 2004, 343, 59–64. [Google Scholar] [CrossRef]
- Liu, H.F.; Jia, Z.Y.; Wang, F.J.; Zong, F.C. Parameter identification of displacement model for giant magnetostrictive actuator. Chin. J. Mech. Eng. 2011, 47, 115–120. Available online: http://www.cjmenet.com.cn/CN/Y2011/V47/I15/115 (accessed on 23 October 2020). [CrossRef]
- Knypinski, L.; Nowak, L.; Sujka, P.; Radziuk, K. Application of a PSO algorithm for identification of the parameters of Jiles-atherton hysteresis model. Arch. Electr. Eng. 2015, 61, 139–148. [Google Scholar] [CrossRef]
- Yang, L.H.; Li, J.F.; Wu, H.P.; Lou, J.J. Parameter identification of nonlinear model of giant magnetostrictive actuator. J. Vib. Shock 2015, 34, 142–146. [Google Scholar] [CrossRef]
- Yang, Z.S.; He, Z.B.; Li, D.W.; Zhao, Z.L.; Xue, G.M. Dynamic modeling of a giant magnetostrictive actuator based on PSO. J. Appl. Sci. 2015, 15, 311–315. [Google Scholar] [CrossRef]
- Toman, M.; Stumberger, G.; Dolina, D. Parameter identification of the Jiles–Atherton hysteresis model using differential evolution. IEEE Trans. Magn. 2008, 44, 1098–1101. [Google Scholar] [CrossRef]
- Ju, X.J.; Lu, J.L.; Jin, H.Y. Study on heat transfer characteristics and thermal error suppression method of cylindrical giant magnetostrictive actuator for ball screw preload. Proc. Inst. Mech. Eng. Part B J. Eng. Manuf. 2021, 235, 782–794. [Google Scholar] [CrossRef]
- Igobi, D.K.; Abasiekwere, U. Results on Uniqueness of Solution of Nonhomogeneous Impulsive Retarded Equation Using the Generalized Ordinary Differential Equation. Int. J. Differ. Equ. 2019, 2019, 2523615. [Google Scholar] [CrossRef]
- Storn, R.; Price, K. Differential evolution-a simple and efficient heuristic for global optimization over continuous spaces. J. Glob. Optim. 1997, 11, 341–359. [Google Scholar] [CrossRef]
- Zhang, C.M.; Chen, J.; Xin, B. Distributed differential evolution algorithm with adaptive parameters. Control Decis. 2014, 29, 701–706. [Google Scholar] [CrossRef]
- Wang, X.-K.; Wang, G.-B. A Hybrid Method Based on the Iterative Fourier Transform and the Differential Evolution for Pattern Synthesis of Sparse Linear Arrays. Int. J. Antennas Propag. 2018, 2018, 6309192. [Google Scholar] [CrossRef]
- Ronkkonen, J.; Kukkonen, S.; Price, K.V. Real-parameter optimization with differential evolution. IEEE Congr. Evol. Comput. 2005, 1, 506–513. [Google Scholar] [CrossRef]
- Zielinski, K.; Weitkemper, P.; Laur, R.; Kammeyer, K.D. Parameter study for differential evolution using a power allocation problem including interference cancellation. IEEE Congr. Evol. Comput. 2006, 4, 1857–1864. [Google Scholar] [CrossRef]
Disclaimer/Publisher’s Note: The statements, opinions and data contained in all publications are solely those of the individual author(s) and contributor(s) and not of MDPI and/or the editor(s). MDPI and/or the editor(s) disclaim responsibility for any injury to people or property resulting from any ideas, methods, instructions or products referred to in the content. |
© 2023 by the authors. Licensee MDPI, Basel, Switzerland. This article is an open access article distributed under the terms and conditions of the Creative Commons Attribution (CC BY) license (https://creativecommons.org/licenses/by/4.0/).