Article

Effect of Plasma Actuator Layout on the Passage Vortex Reduction in a Linear Turbine Cascade for a Wide Range of Reynolds Numbers

by
Takayuki Matsunuma
* and
Takehiko Segawa
National Institute of Advanced Industrial Science and Technology (AIST), 1-2-1 Namiki, Tsukuba 305-8564, Japan
*
Author to whom correspondence should be addressed.
Actuators 2023, 12(12), 467; https://doi.org/10.3390/act12120467
Submission received: 16 October 2023 / Revised: 12 December 2023 / Accepted: 13 December 2023 / Published: 15 December 2023
(This article belongs to the Section Precision Actuators)

Abstract

:
This study examined how various plasma actuator (PA) configurations affect the passage vortex (PV) reduction in a linear turbine cascade (LTC) utilizing dielectric barrier discharge PAs. The experiments were carried out under three specific layout conditions: axial placement of the PA, slanted placement at the blade inlet, and slanted placement inside the blade. Particle image velocimetry was employed to measure the velocity distribution of the secondary flow at the LTC exit, followed by an analysis of the streamline patterns, turbulence intensity distribution, and vorticity distribution. At a Reynolds number of 3.7 × 10⁴, the PA with an oblique orientation at the blade inlet provided the most effective PV suppression. The average value of the secondary flow velocity and the peak vorticity value at the LTC exit decreased by 59.0% and 68.8%, respectively, compared to the no-control case. Furthermore, the wind tunnel blower’s rotation speed was modified, adjustments were made to the LTC’s mainstream velocity, and the Reynolds number transitioned from 1.0 × 10⁴ to 9.9 × 10⁴, approximately 10 times. When the slanted PA was used at the blade inlet, the PV suppression effect was the highest. The peak vorticity value owing to the PV at the LTC exit decreased by 62.9% at the lowest Reynolds number of 1.0 × 10⁴. The Reynolds number increased with a higher mainstream velocity and decreased flow induced by the PA, consequently reducing the PV suppression effect. However, the drive of the PA was effective even under the most severe conditions (9.9 × 10⁴), and the peak vorticity value was reduced by 20.2%.

1. Introduction

Passage vortices (PVs) in turbine blades [1] constitute a primary factor contributing to aerodynamic performance deterioration, typically accounting for approximately one third of the total pressure losses [2]. As depicted in Figure 1, the formation of PVs begins with the generation of a horseshoe vortex when the inlet boundary layer encounters the leading edge of the turbine blade. The PV then undergoes significant development as it entrains and draws in the endwall boundary layer flow within the blade.
PV development in turbine blades is strongly contingent upon the Reynolds number [3]. As the Reynolds number decreases, the viscosity effect intensifies, and, thus, the PV gradually increases. When dealing with Reynolds numbers in the order of 105 or greater, the impact on PVs remains relatively minimal, owing to the fully turbulent boundary layer. Conversely, when the Reynolds number diminishes to the order of 104, the boundary layer undergoes a transition from turbulent to laminar flow. Consequently, the PV undergoes rapid development owing to the increased boundary layer thickness, leading to a substantial degradation in the aerodynamic performance of the turbine blade.
Because of the significant impact of PVs on turbine aerodynamic performance, research has been conducted on both passive and active flow control methods to mitigate PVs. Passive control methods encompass leading-edge fillets/bulbs [4], boundary layer endwall fences [5], linearly varied height endwall fences [6], non-uniform-height endwall fences [7], riblets [8], non-axisymmetric endwall contouring [9,10], and undulated blades [11]. Passive control offers the advantage of effectiveness through a straightforward, solid structure; however, it leads to performance degradation when unnecessary. In contrast, active control methods encompass steady jet blowing [12], pulsed jet blowing [13], air suction [14], and plasma actuators (PAs) [15,16]. Active control boasts the advantage of not adversely affecting the flow when not needed; nevertheless, it introduces the drawback of complexity in both structure and control systems. Among active control methods, those utilizing jets can exert a strong influence on the flow field depending on the jet’s strength. However, they require an air source device, pose installation challenges, and raise concerns regarding structural complexity and added weight.
Dielectric barrier discharge (DBD) PAs [17] represent a novel active fluid control technique distinguished by its high-speed response, wide frequency bandwidth, uncomplicated structure, and lightweight design. Recent PA research has focused on separation control mechanisms [18], icing mitigation [19], the flow control of the NACA0015 airfoil [20], the development of a background-oriented schlieren (BOS) system [21], density and velocity fields in burst modulation [22], cross-flow vortex cancellation [23], shock wave/boundary layer interaction [24], 3D turbulent boundary layer separation control via multi-discharge PAs [25], and closed-loop cavity shear layer control [26].
As the PA is integrated into the aerodynamic aspects of turbine blades, investigations into mitigating flow separation on the blade suction surface (SS) [27,28,29], blade tip leakage vortex [30,31,32], and PVs [15,16] have been undertaken. This study was conducted as part of a series of experiments to suppress PV using PAs [15,16]. Specifically, the study centered on assessing the influence of the PA layout on PV suppression. Notably, investigations into altering the PA layout for PV control in turbine blades have yet to be conducted.
For compressor blades, PAs were positioned on the tip-side endwall upstream of the blades. Subsequently, research efforts were undertaken to enhance the stall margin [33], mitigate the rotating stall [34], and alleviate tip leakage flow [35]. These investigations encompassed a comparison between the effects of PAs oriented in the blade axis direction and those oriented at an angle.
Saddoughi et al. [33] conducted an experimental study on tip leakage flow control in transonic axial flow compressors. Within the stable operating region, including the design point, no enhancement in the performance of the PA was observed. However, within the unstable operating region, the axial PA demonstrated an improvement of up to 4% in the stall margin under the same flow conditions. In contrast, when utilizing the slanted PA, the stall margin exhibited a 2% improvement under identical flow conditions. These results indicate that axial PAs are more effective than slanted PAs in enhancing the stall margin.
Zhang et al. [34] conducted an experimental study on tip leakage flow control in a low-speed axial compressor. When the PA was axially installed immediately before the leading edge of the compressor blade, the stall margin exhibited a remarkable improvement of 19.36%, representing the most compelling case. In contrast, when the PA was installed at an angle, there was a 6.31% improvement in the stall margin. Furthermore, near the design point, the axial PA had a lesser impact on performance; conversely, the slanted PA led to a performance deterioration owing to a reduction in the compressor’s static pressure rise coefficient. This study conclusively demonstrates the superiority of the axial PA over the slanted PA in terms of enhancing both the stall margin at an unstable operating point and the aerodynamic performance at the design point.
Zhang et al. [35] conducted comprehensive experimental and numerical investigations into tip leakage flow control using a linear compressor cascade. The study compared three types of passive flow control devices: (1) an axial PA, (2) a PA oriented perpendicularly to the leakage flow, and (3) a PA inclined towards the leakage flow. All of these flow control devices led to reductions in tip leakage flow and total pressure loss. However, among them, the axial PA proved to be the most effective, while the PA inclined towards the leakage flow demonstrated the least effectiveness. Additionally, when the PA’s installation location shifted from upstream of the blade’s leading edge to inside the blades, the placement inside the blade introduced unnecessary mainstream flow mixing, resulting in an increased total pressure loss.
The preceding three studies collectively established that the installation of a slightly axial PA immediately ahead of the blade’s leading edge proves highly effective in enhancing the stall margin for tip leakage flow control in axial compressor blades.
In contrast, in the PV control of turbine blades, research on changing the installation position of the axial PA [15] revealed that positioning the PA upstream from the blade’s leading edge yields the most significant PV suppression effect. This result is the same as that of the tip leakage vortex control for compressor blades described above. However, studies other than those on the axial PA have not been conducted on turbine blades. Therefore, this study clarifies the effect of slanted PAs on the PV control of turbine blades.

2. Experimental Method

2.1. Linear Turbine Cascade (LTC)

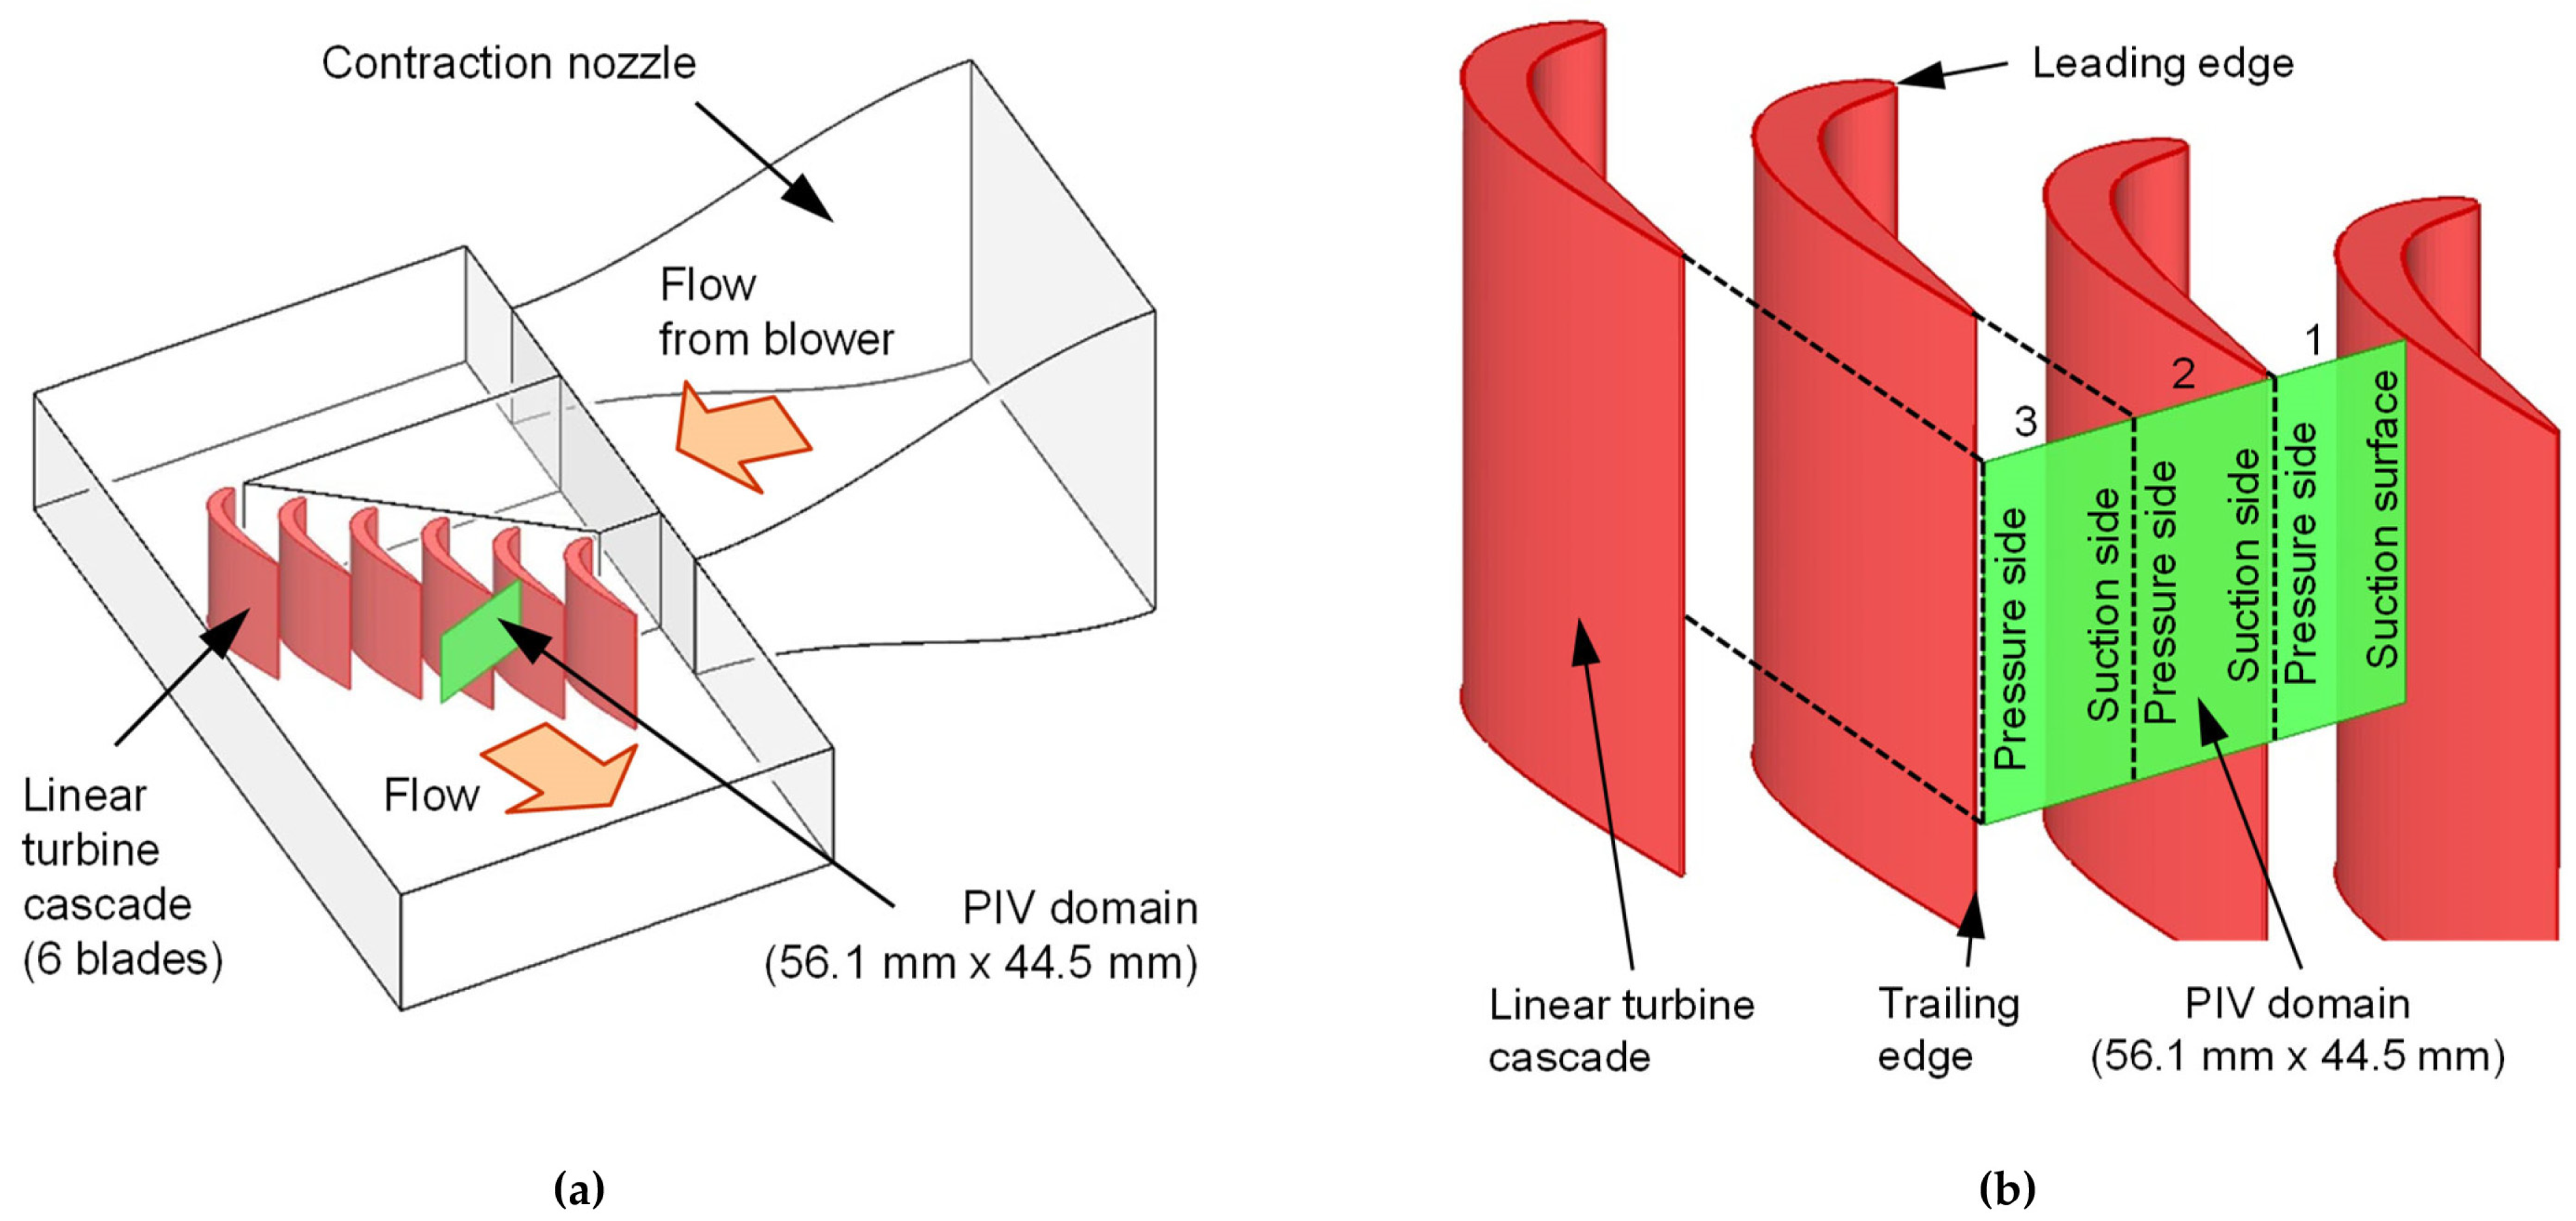
Figure 2 shows the measurement section of the linear turbine cascade (LTC). As depicted in Figure 2a, the air, originating from the blower of the small blowing-type wind tunnel, is directed towards the measurement section. Within this measurement section, an LTC equipped with six blades was incorporated. The velocity distributions of the secondary flow at the exit of the LTC were quantified using particle image velocimetry (PIV). Figure 2b shows an enlarged PIV measurement of the cross-sectional position in Figure 2a. The PIV measurement range is exactly between those of the three blades. Passages 1, 2, and 3 are situated internally, at the blade exit, and downstream of the blades, respectively.
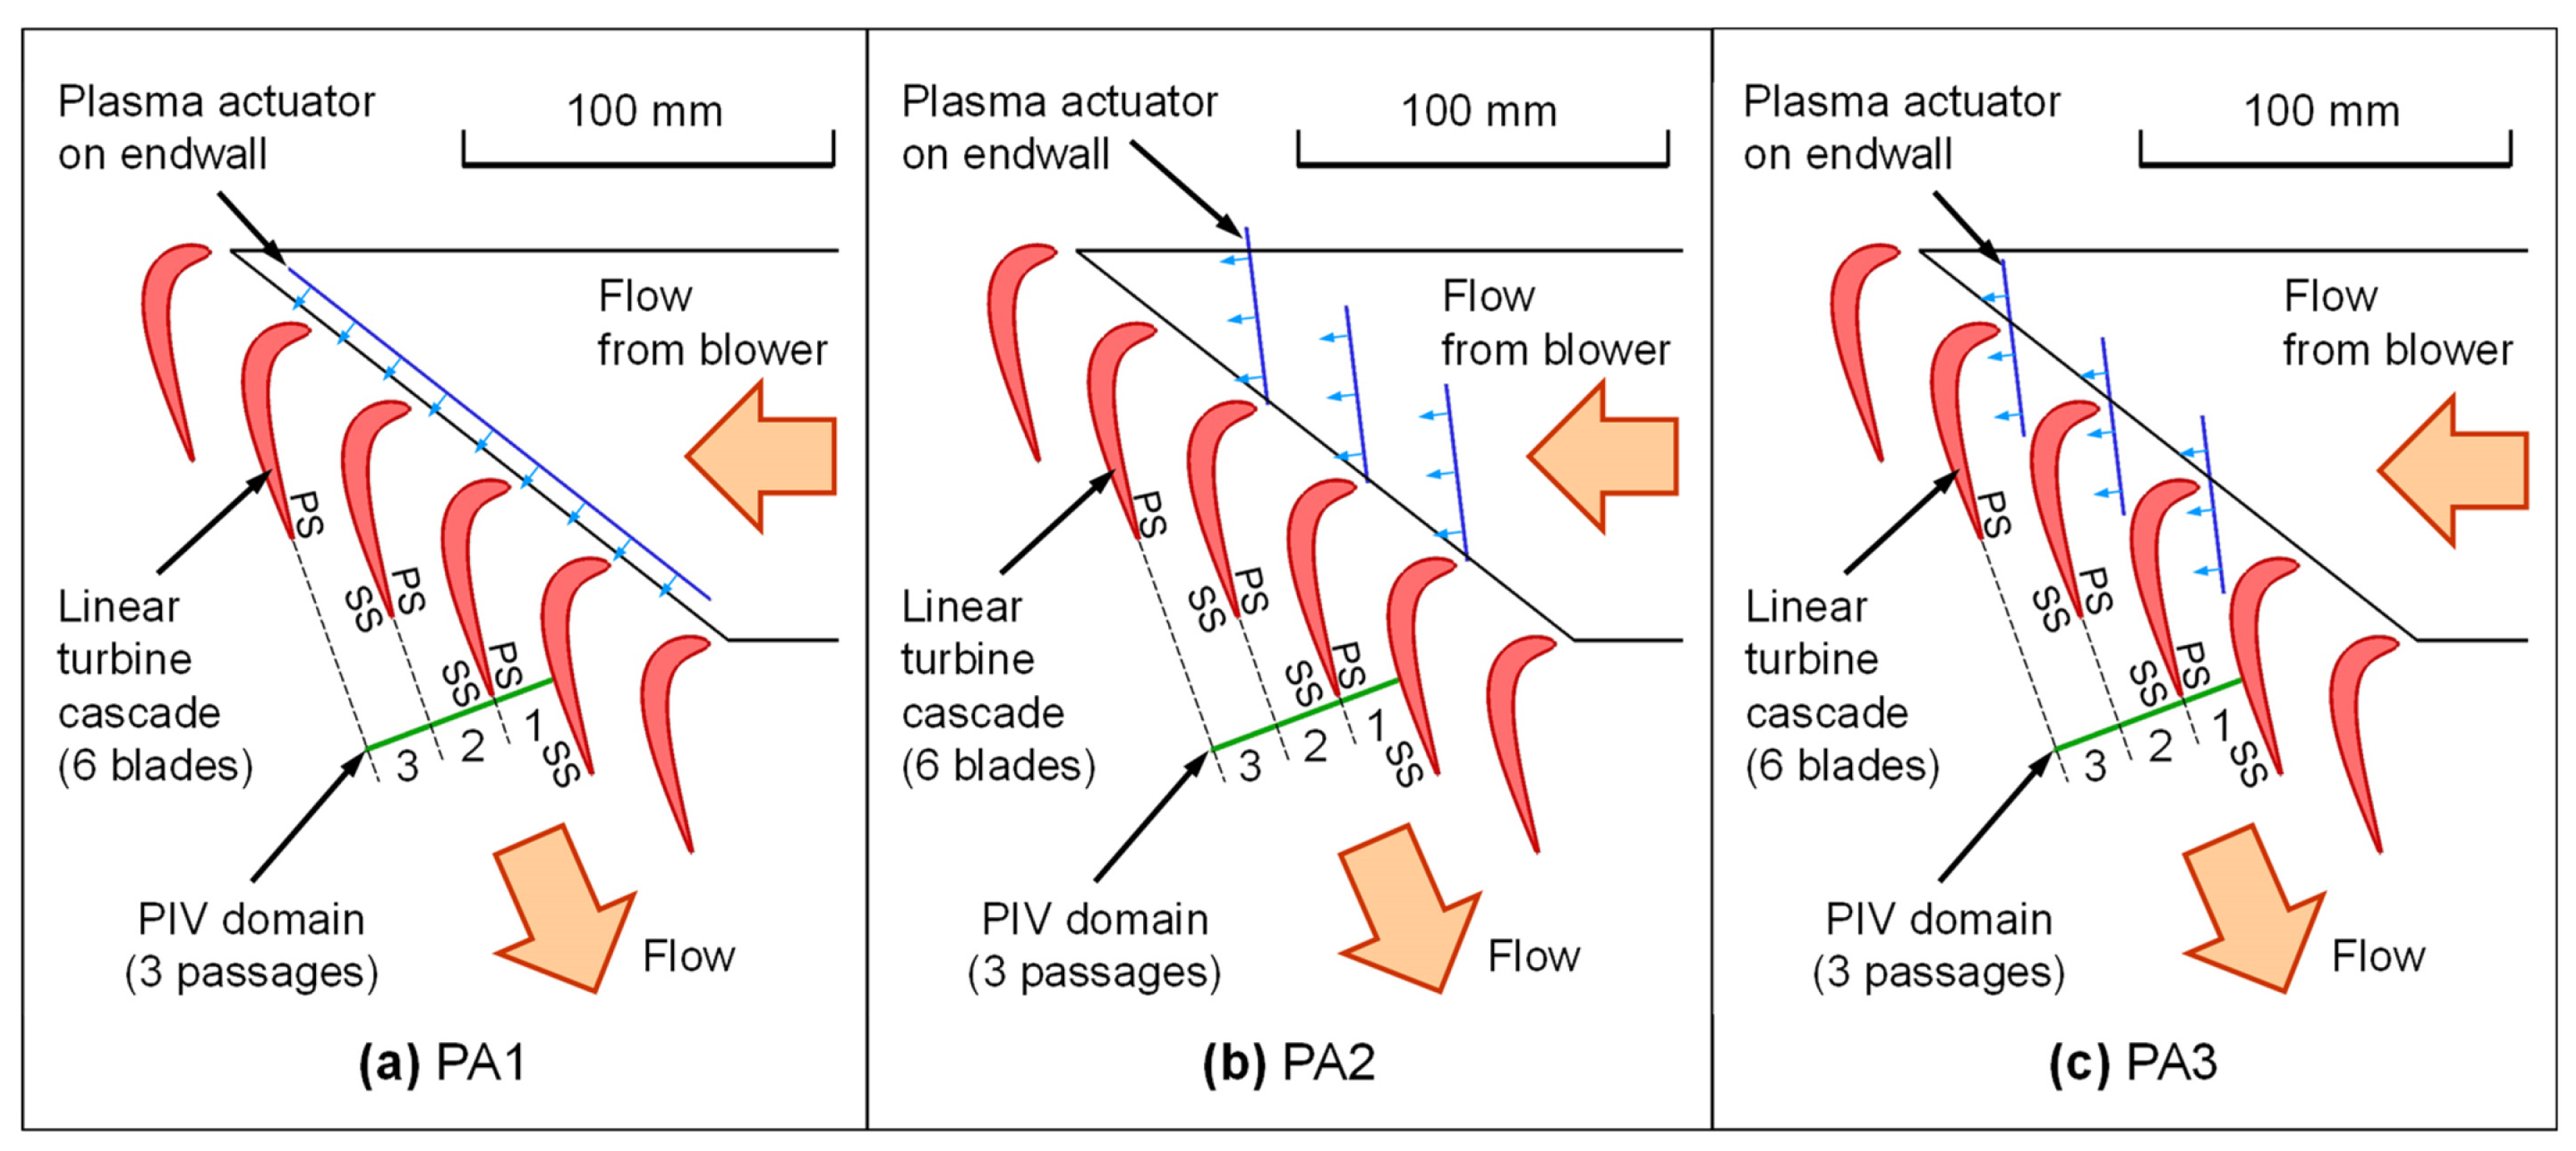
Figure 3 provides an upper view of the measurement section. The configuration of the PA was altered into three different types. In Figure 3a, the axial arrangement is depicted, with the PA positioned 10 mm upstream of the blade’s leading edge. When the blade axial chord length Cax is dimensionless, it is located 20% upstream of the axial chord length. As clarified in a previous study [15], this installation position is deemed the most effective for the PA in terms of suppressing PV in the axial arrangement. Figure 3b illustrates the slanted arrangement at the blade inlet, while Figure 3c demonstrates the slanted arrangement within the blade. These configurations, depicted in Figure 3a–c, are denoted as PA1, PA2, and PA3, respectively.
Table 1 lists the specifications of the LTC. The blade height was 75 mm, and the blade pitch was 35.47 mm. This blade geometry reproduced the hub shape of the annular axial-flow turbine rotor blades designed by the first author of this paper [36]. The two-dimensional blade coordinates are described in the Appendix in [16].
In this experiment, the rotational speed of the wind tunnel blower was varied between 113 and 1125 Hz. Table 2 summarizes the blade outlet velocity and the Reynolds numbers of the LTC based on the blade exit velocity and chord length at various blower rotating speeds. The freestream blade outlet velocity was measured using a conventional Pitot tube. Hot-wire anemometry was used to assess the Pitot tube measurements results. The outlet velocity was used as the reference velocity for the nondimensionalization of the measured velocity and turbulence intensity. Experiments were conducted across a broad spectrum of Reynolds numbers, from 1.0 × 10⁴ to 9.9 × 10⁴.
This experiment was conducted under sea-level static pressure conditions (atmospheric pressure: ~101,325 Pa). However, actual gas turbine compressors and turbines operate under varying pressure conditions. Ashpis and Thurman [37] suggested that the pressure range where a PA might be used in gas turbine engines is 0.03–12.4 atm (3040–1,260,000 Pa). For low-pressure ranges, Benard et al. [38] investigated the effect of the air pressure level on the PA-induced velocity from 1 to 0.2 atm (20,300 Pa). They found that the produced airflow was present at the local maximum of 0.6 atm. Although the induced velocities at 1 and 0.2 atm were 2.5 and 3.0 m/s, respectively, that at 0.6 atm reached 3.5 m/s. For wider pressure ranges, Valerioti and Corke [39] investigated the pressure dependence of Pas for a pressure range of 0.17–9.0 atm (17,200–912,000 Pa). They found that the local maximum thrust by the PA occurred at high pressure (~6 atm). In general, the PA-induced thrust (and velocity) increases as the ambient pressure increases.

2.2. Particle Image Velocimetry (PIV) Measurements

PIV was employed to quantify the two-dimensional velocity field at the exit of the LTC using a 15-mJ pulsed, double-pulse Nd-YAG laser. The smoke employed for visualization was atomized dioctyl sebacate (DOS) oil, characterized by an average particle size of 1 μm. This smoke was introduced into the wind tunnel by injecting it upstream of the blower through a pressurized oil chamber. A pair of flow images were captured using a camera with a resolution of 1280 × 1024 pixels. Using the PIV software (Insight Ver. 3.53, TSI Inc., Shoreview, MN, USA), a velocity vector was calculated from the peak correlation of the particle groups between frames using a conventional cross-correlation algorithm on a 32 × 32 pixel grid. The time-averaged velocity distribution was analyzed using 300 instantaneous velocity distributions. Furthermore, calculations were performed to determine the turbulence intensity and vorticity distributions. The velocity and turbulence intensity were nondimensionalized by the mainstream velocity at the outlet of the LTC, UFS,out, as shown in Table 2. For more comprehensive details regarding the PIV system, please refer to [15].
Regarding the measurement uncertainty, the flow image resolution of each pixel was fixed at dpX (=dpY) = 45.5 μm per pixel in the XY cross-section. The laser pulse interval (Δt) required to obtain a pair of flow images was set such that the maximum displacement of seeding particles during Δt was less than eight pixels. In this study, when the mainstream velocity at the blade outlet was set at 2.4 m/s, Δt = 140 μs was set to obtain a pair of PIV images. As the minimum displacement of the seeding particle calculated by the sub-pixel interpolation in PIV image processing is approximately 0.1 pixels, the velocity uncertainty was determined as 0.033 m/s by calculating 0.1 × dpXt. Therefore, the velocity uncertainty in the PIV analysis was estimated to be less than 1.4% of the freestream velocity at the blade outlet [40,41,42].

2.3. Plasma Actuator (PA)

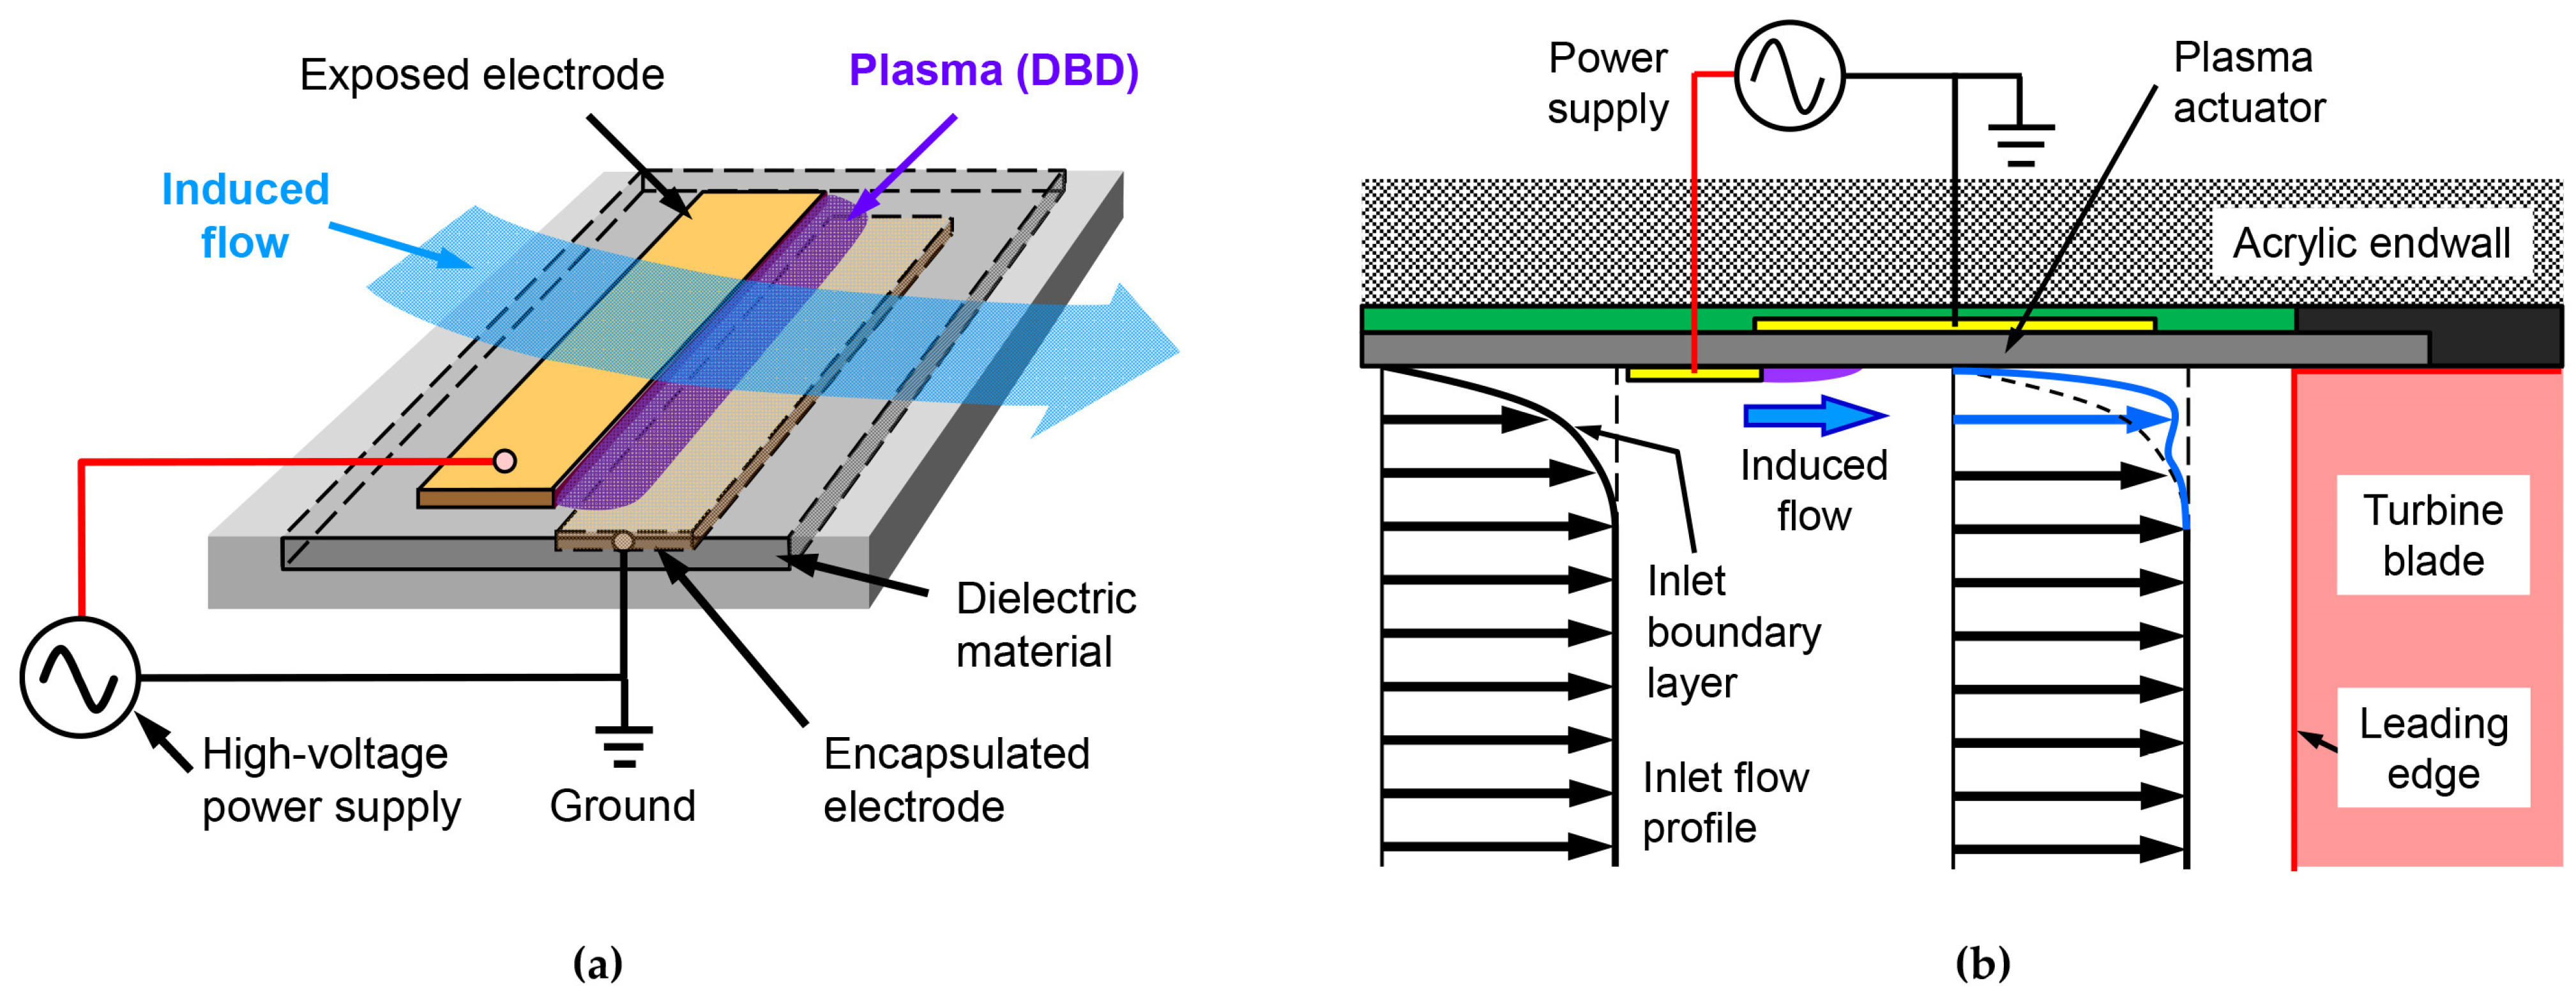
As shown in Figure 4a, the PA was composed of two asymmetric electrodes with an insulation material sandwiched between them. One electrode was exposed to air, while the other was embedded in insulation. The application of a high-voltage, high-frequency alternating current between these two electrodes of the PA results in the generation of plasma at the surface electrode’s tip. This plasma, ionized air, imparts a body force to the surrounding air through an electric field gradient, inducing a unidirectional flow along the surface.
In this study, the PV was reduced by accelerating the boundary-layer flow at the blade inlet using PAs. Figure 4b shows the inlet boundary layer flow control using the PA. By installing a PA on the upstream endwall surface of the blade leading edge and accelerating the inlet boundary layer flow near the endwall surface, the generation of horseshoe vortices at the leading edge was weakened, and the PV formed by the development of the horseshoe vortex was suppressed.
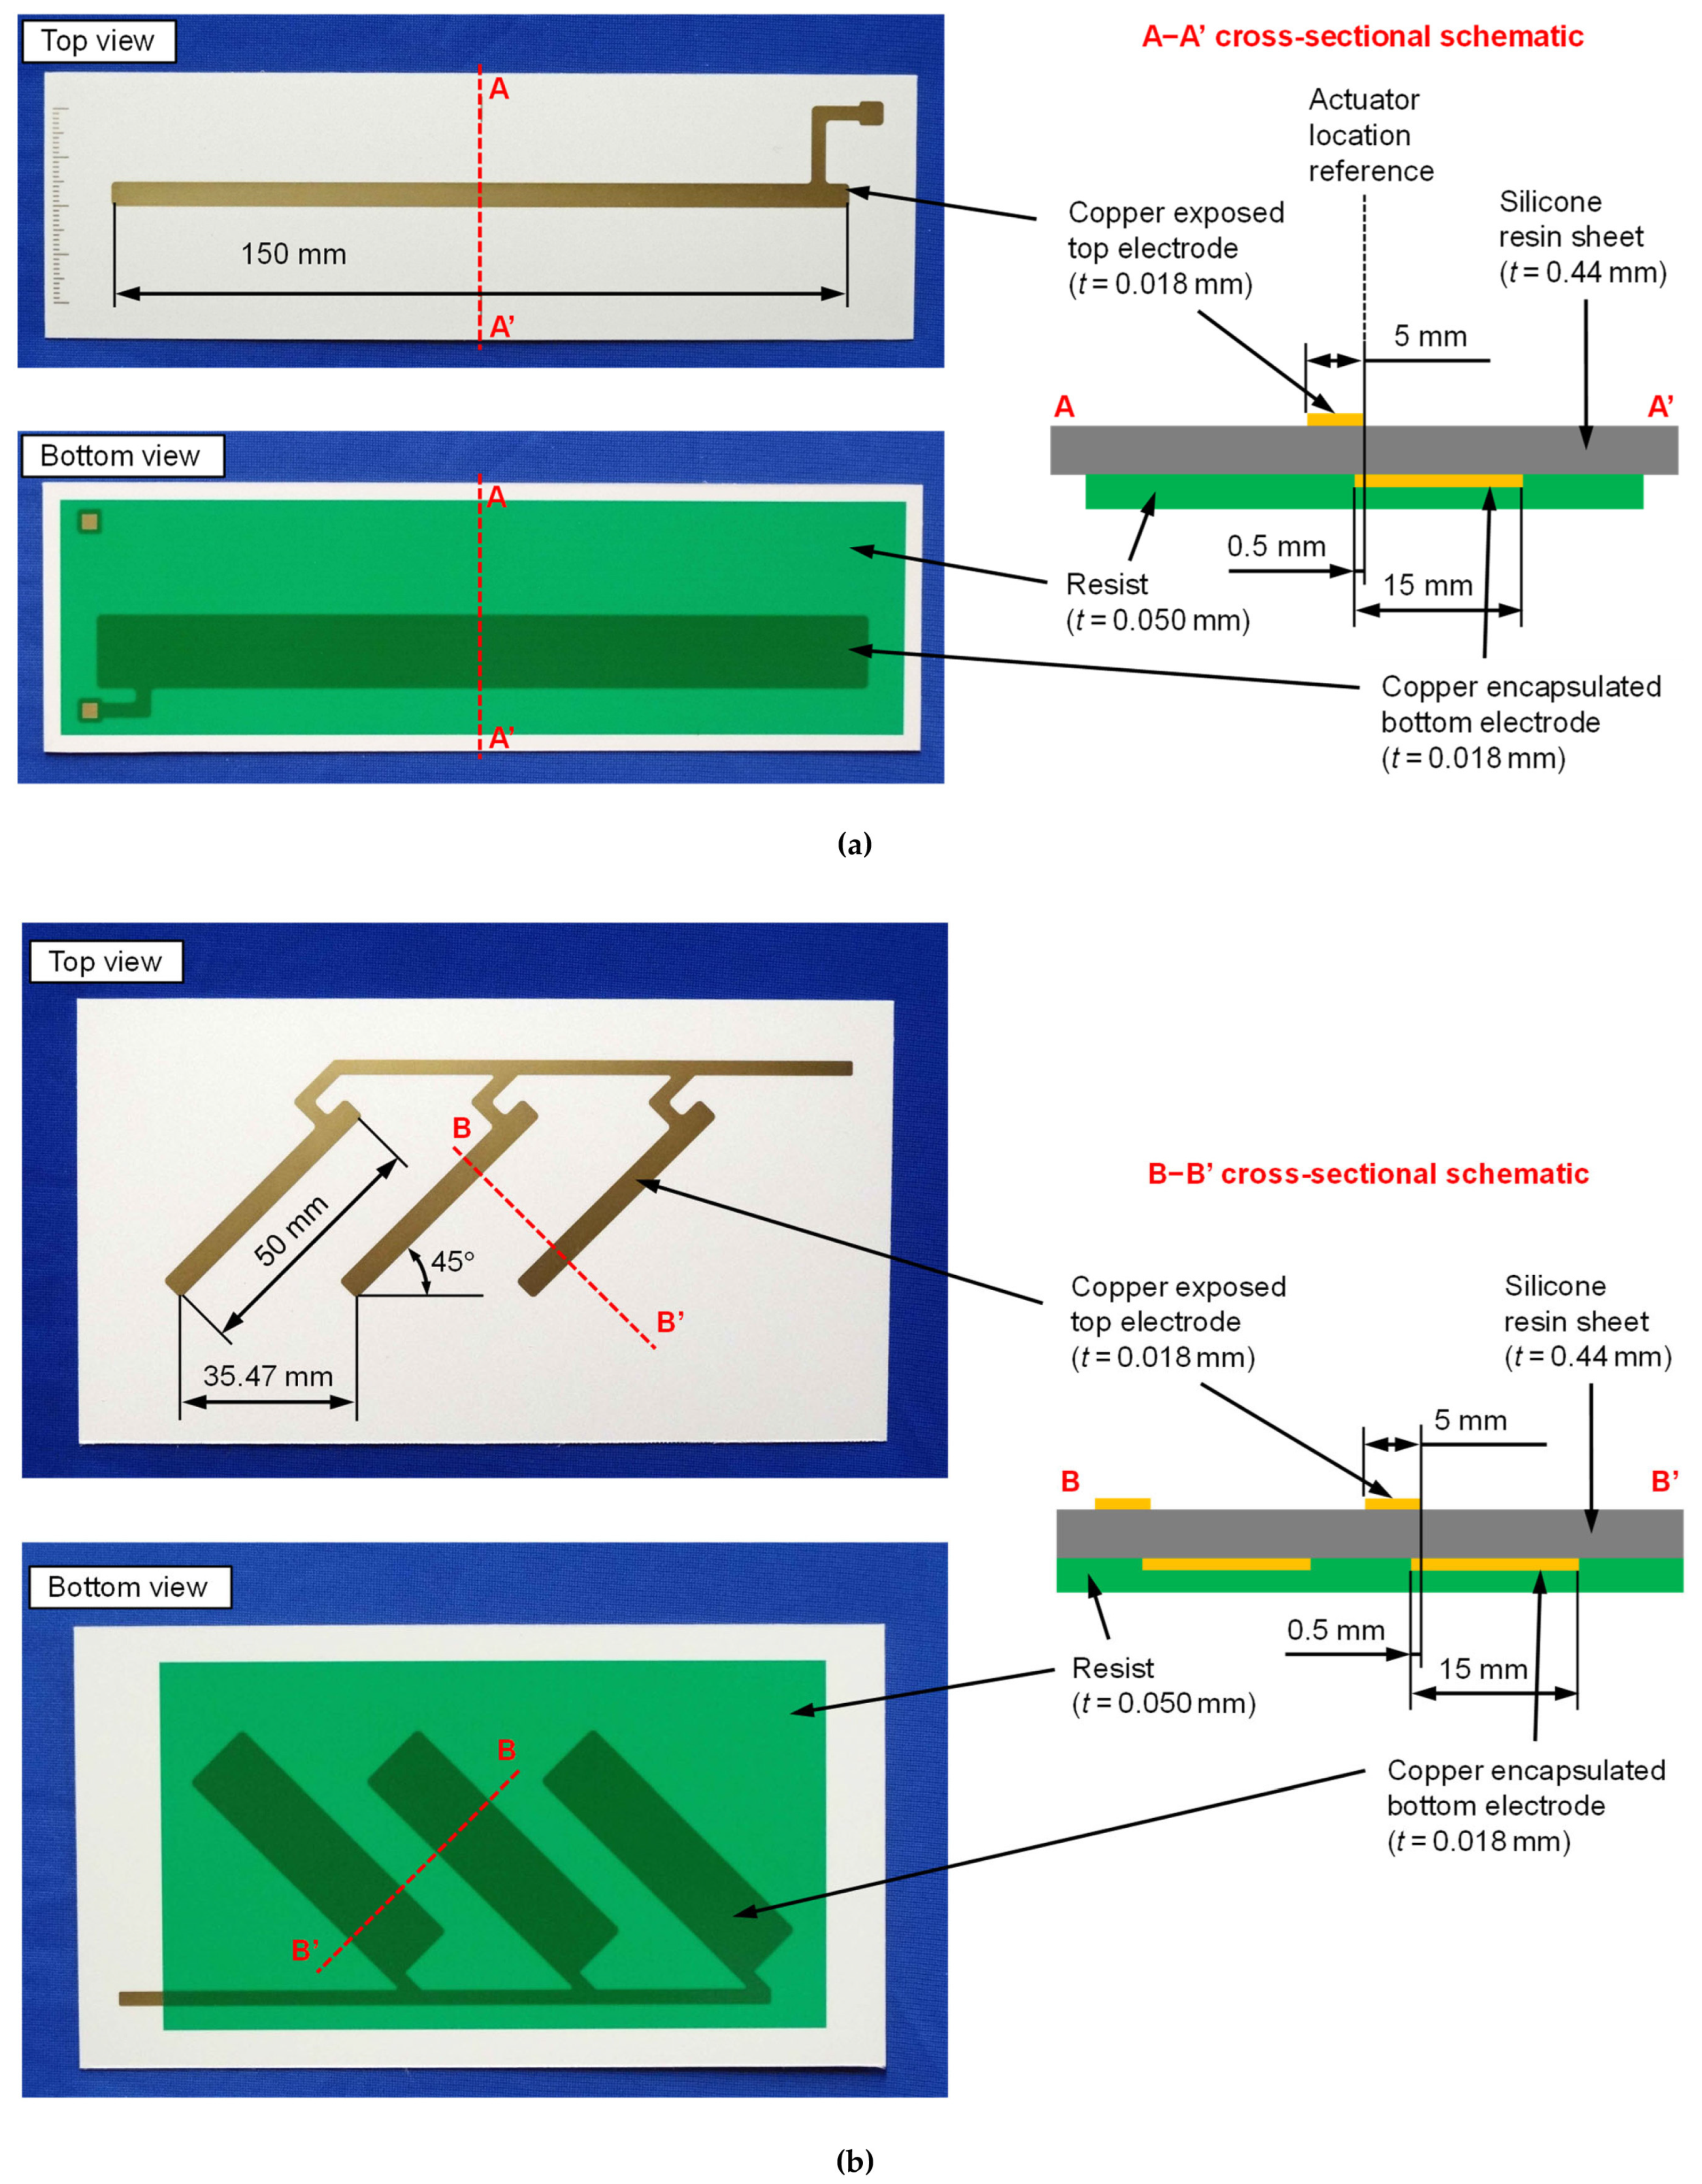
Figure 5 displays a photograph of the PA along with its cross-sectional structure. In particular, Figure 5a provides a depiction of the axial PA employed in previous studies [15,16], while Figure 5b shows the newly prepared slanted PA used in this experiment. Both PAs were built using a printed circuit board (PCB) process.
Figure 6 shows the configuration of the LTC and PA. The PA was installed on an acrylic top endwall. The blades were mounted on a bottom blade-support plate. To realize the PA installation within the blades, as shown in Figure 3c, the open tip of the blades was in contact with the PA, with no space in between.
The PA was energized by a high-voltage power amplifier, which amplifies the input waveform generated by a multifunctional generator by a factor of 1000. In this experiment, a sine wave with a frequency of 10 kHz was continuously inputted. The peak-to-peak voltage applied to the PA can be varied in the range of 6–15 kVp-p. Figure 7a shows the maximum velocity induced by the PA at various input voltages [43]. Although the maximum velocity increased in almost direct proportion to the input voltage, the maximum velocity at a high input voltage (over 12 kVp-p) exhibited a low increase rate. At the highest input voltage (15 kVp-p), the maximum velocity induced by the PA was approximately 4.5 m/s. Figure 7b shows the power consumption per unit length (1 m) of the PA at various input voltages [43]. As the input voltage increased, the power consumption of the PA increased drastically. The measured power consumption coincided with the input voltage curve at a power of 4. The power consumption per unit length at 15 kVp-p was approximately 420 W/m.

3. Experimental Results and Discussion

3.1. Effect of Actuator Layout at Reout = 3.7 × 10⁴

First, at a Reynolds number of Reout = 3.7 × 10⁴, where the impact of the PAs was most prominent, the change in the flow field resulting from various PA configurations was elucidated.

3.1.1. Velocity Distribution of the Secondary Flow at PA1 (Axial PA)

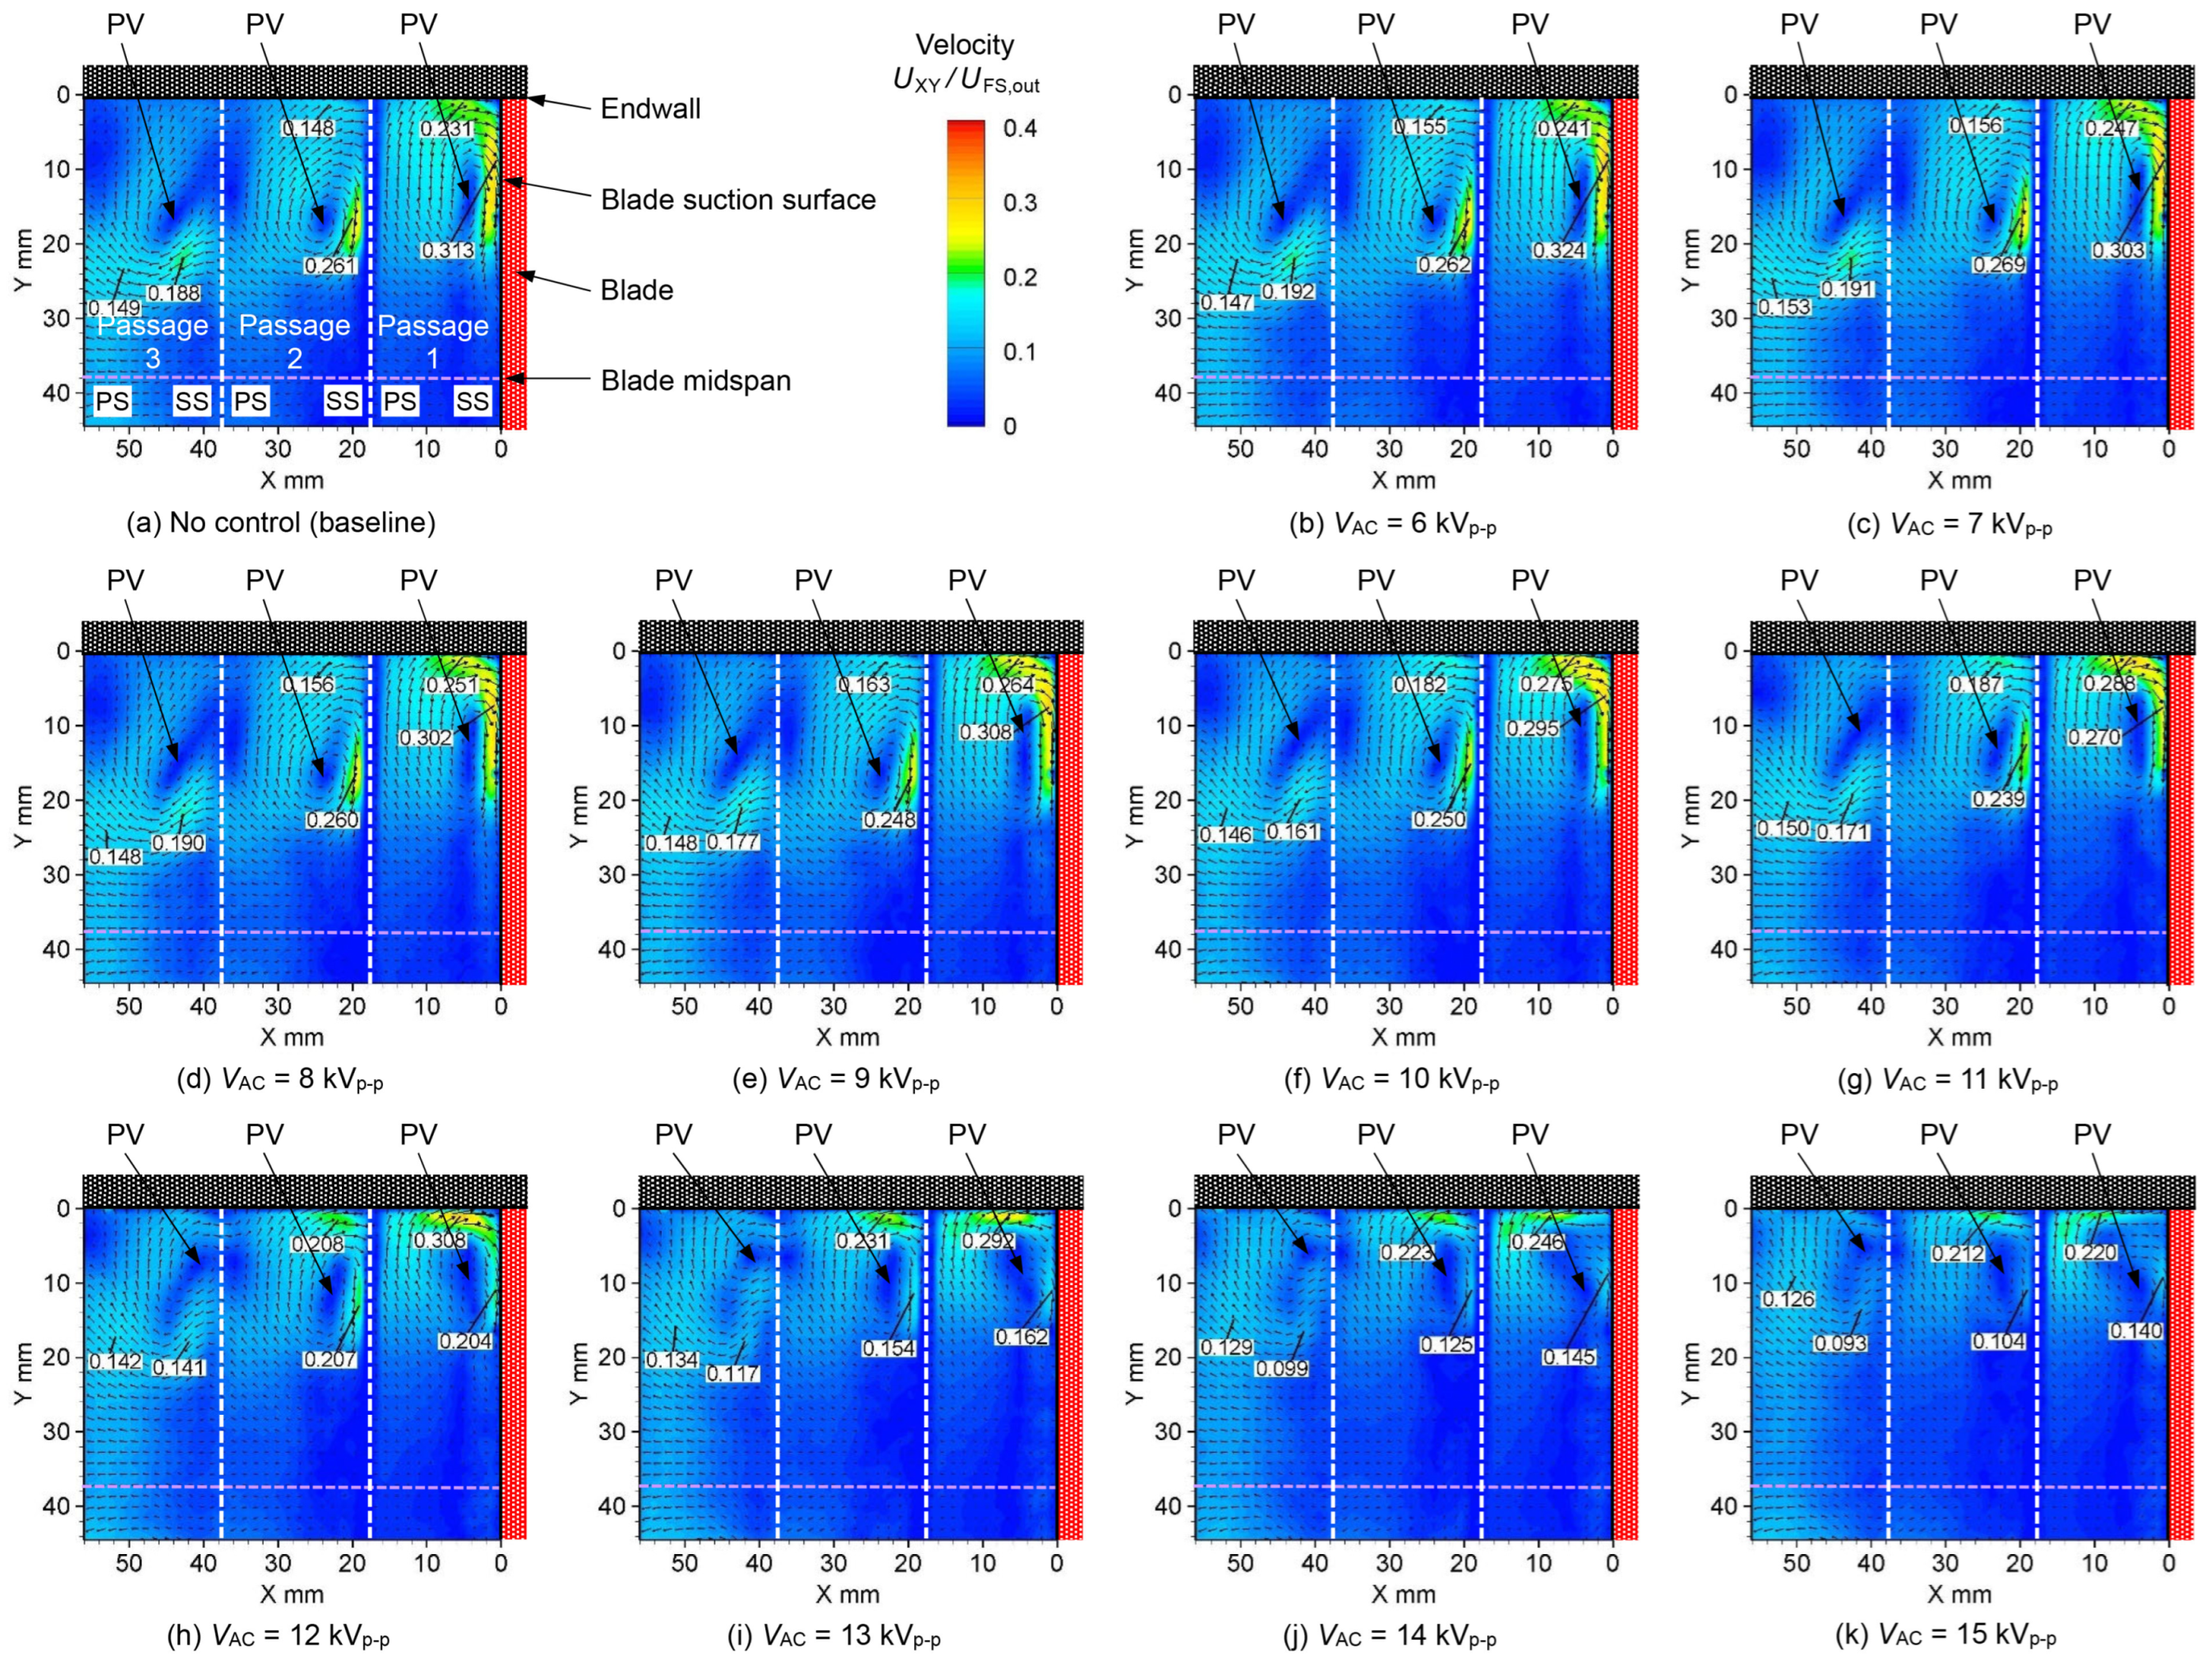
Figure 8 illustrates the nondimensionalized velocity distribution of the secondary flow at the LTC exit, showcasing the alterations resulting from changes in the input voltage within the PA1 actuator layout. For reference, the figure also presents the peak velocity values.
Figure 8a shows the velocity distribution without control. A clockwise PV is observed at each passage. The secondary flow exhibited its highest intensity, reaching the maximum velocity at the juncture where the PV interacted with the blade’s SS. In passages 1 and 2, the secondary flow was also strong, and the PV met the upper endwall. The peak velocities at passages 1, 2, and 3 were 0.313, 0.261, and 0.188, respectively, and the peak velocity decreased as the PV moved downstream.
Figure 8b–k show the velocity distribution when the input voltage to PA1 was changed from 6 to 15 kVp-p. With an increase in input voltage, the high-velocity region where the PV interacted with the blade’s SS side diminished. Conversely, the high-velocity region where the PV interacted with the upper endwall intensified. The peak velocities in passages 1, 2, and 3 at an input voltage of 15 kVp-p were 0.220, 0.212, and 0.126, respectively, which were lower than those in the no-control case.
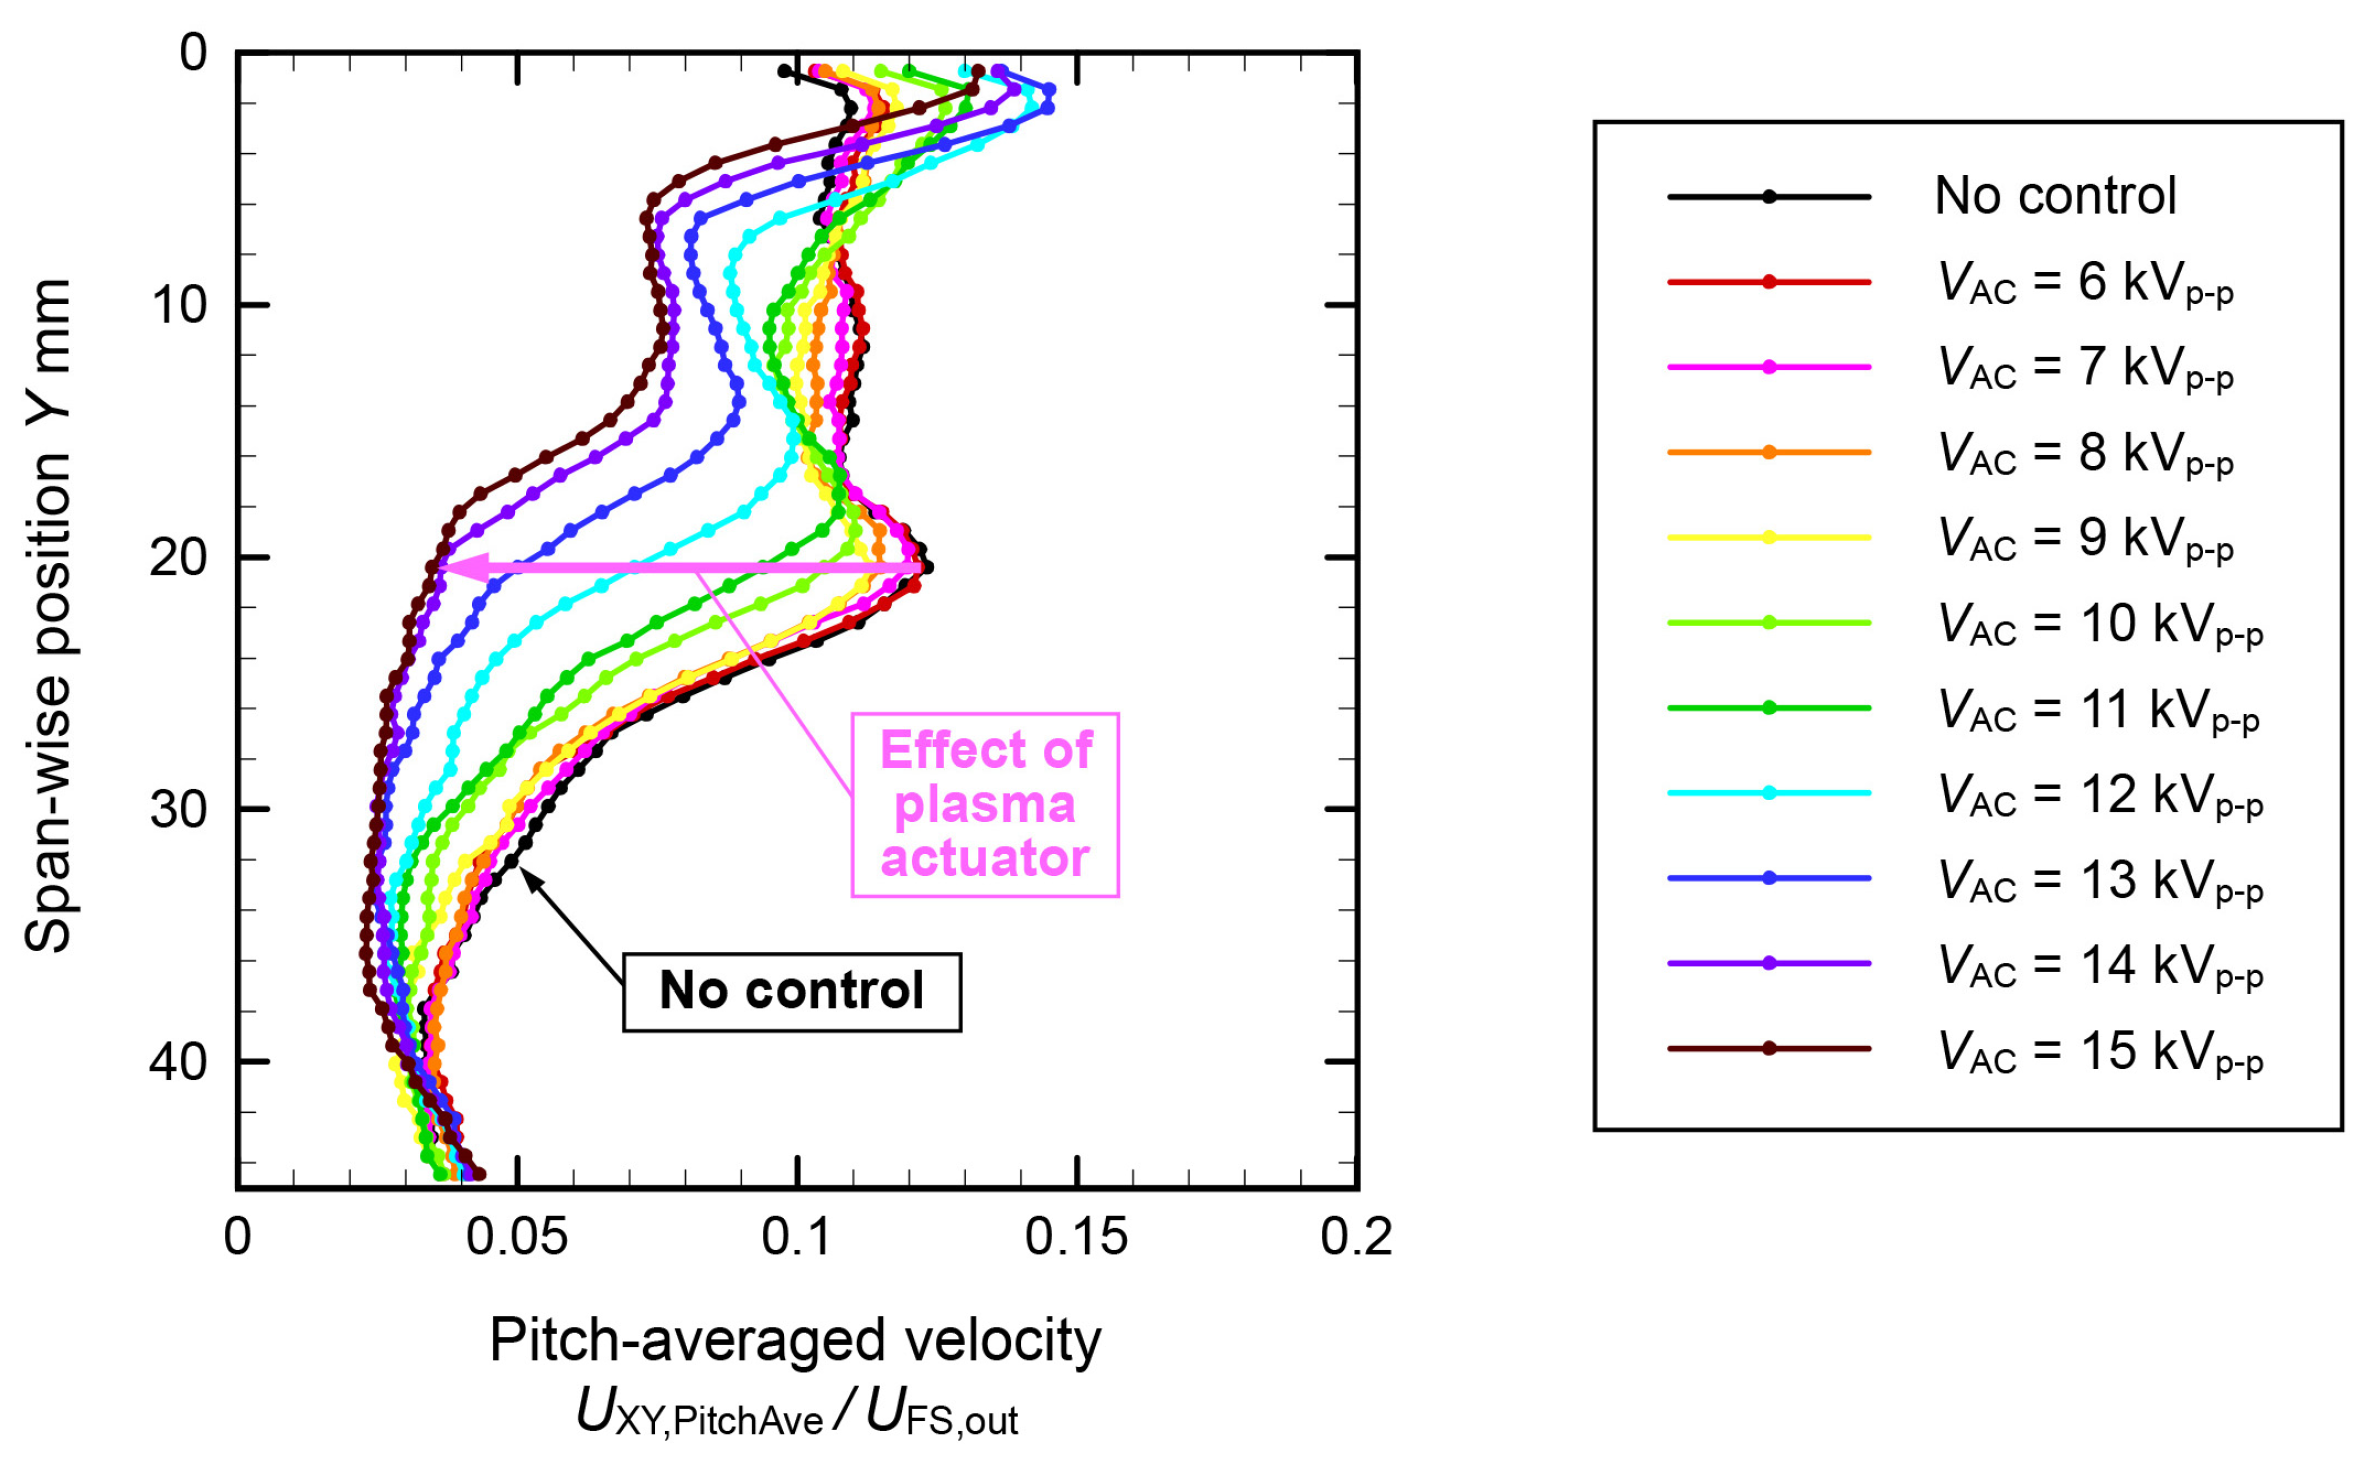
Figure 9 illustrates the pitch-averaged velocity obtained by averaging the velocities in the pitch direction (X-direction) at various span-wise positions within the central passage (passage 2, blade exit) for the PA1 actuator layout. The velocity decrease owing to the drive of the PA was remarkable, mainly at approximately Y = 20 mm. At Y = 20.4 mm, the velocity decreased from 0.123 with no control to 0.035 at 15 kVp-p, which corresponds to a 72% decrease in velocity. In contrast, in the vicinity of the upper endwall, the velocity increased by driving the PA. This phenomenon is attributed to the presence of a PV in proximity to the upper endwall. The peak velocity at Y = 0.7 mm and 15 kVp-p was 0.132.

3.1.2. Velocity Distribution of the Secondary Flow at PA2 (Slanted PA Blade Inlet)

Figure 10 depicts the velocity distribution of the secondary flow, illustrating the impact of changing the input voltage within the PA2 actuator layout.
Figure 10a shows the velocity distribution with no control, similar to that in Figure 8a. Figure 10b–k show the velocity distribution when the input voltage to PA2 was changed from 6 to 15 kVp-p. With an increase in input voltage, the high-velocity region at the juncture where the PV interacts with the blade’s SS side diminishes. This decrease is more pronounced than that for PA1, and the velocity peak disappears at an input voltage of 13 kVp-p or higher. In contrast, when the PV met the upper endwall, the peak velocity increased up to an input voltage of 12 kVp-p; however, it tended to decrease above 13 kVp-p. Above 14 kVp-p, the presence of a PV was not observed in the velocity vector distribution during passages 2 and 3.
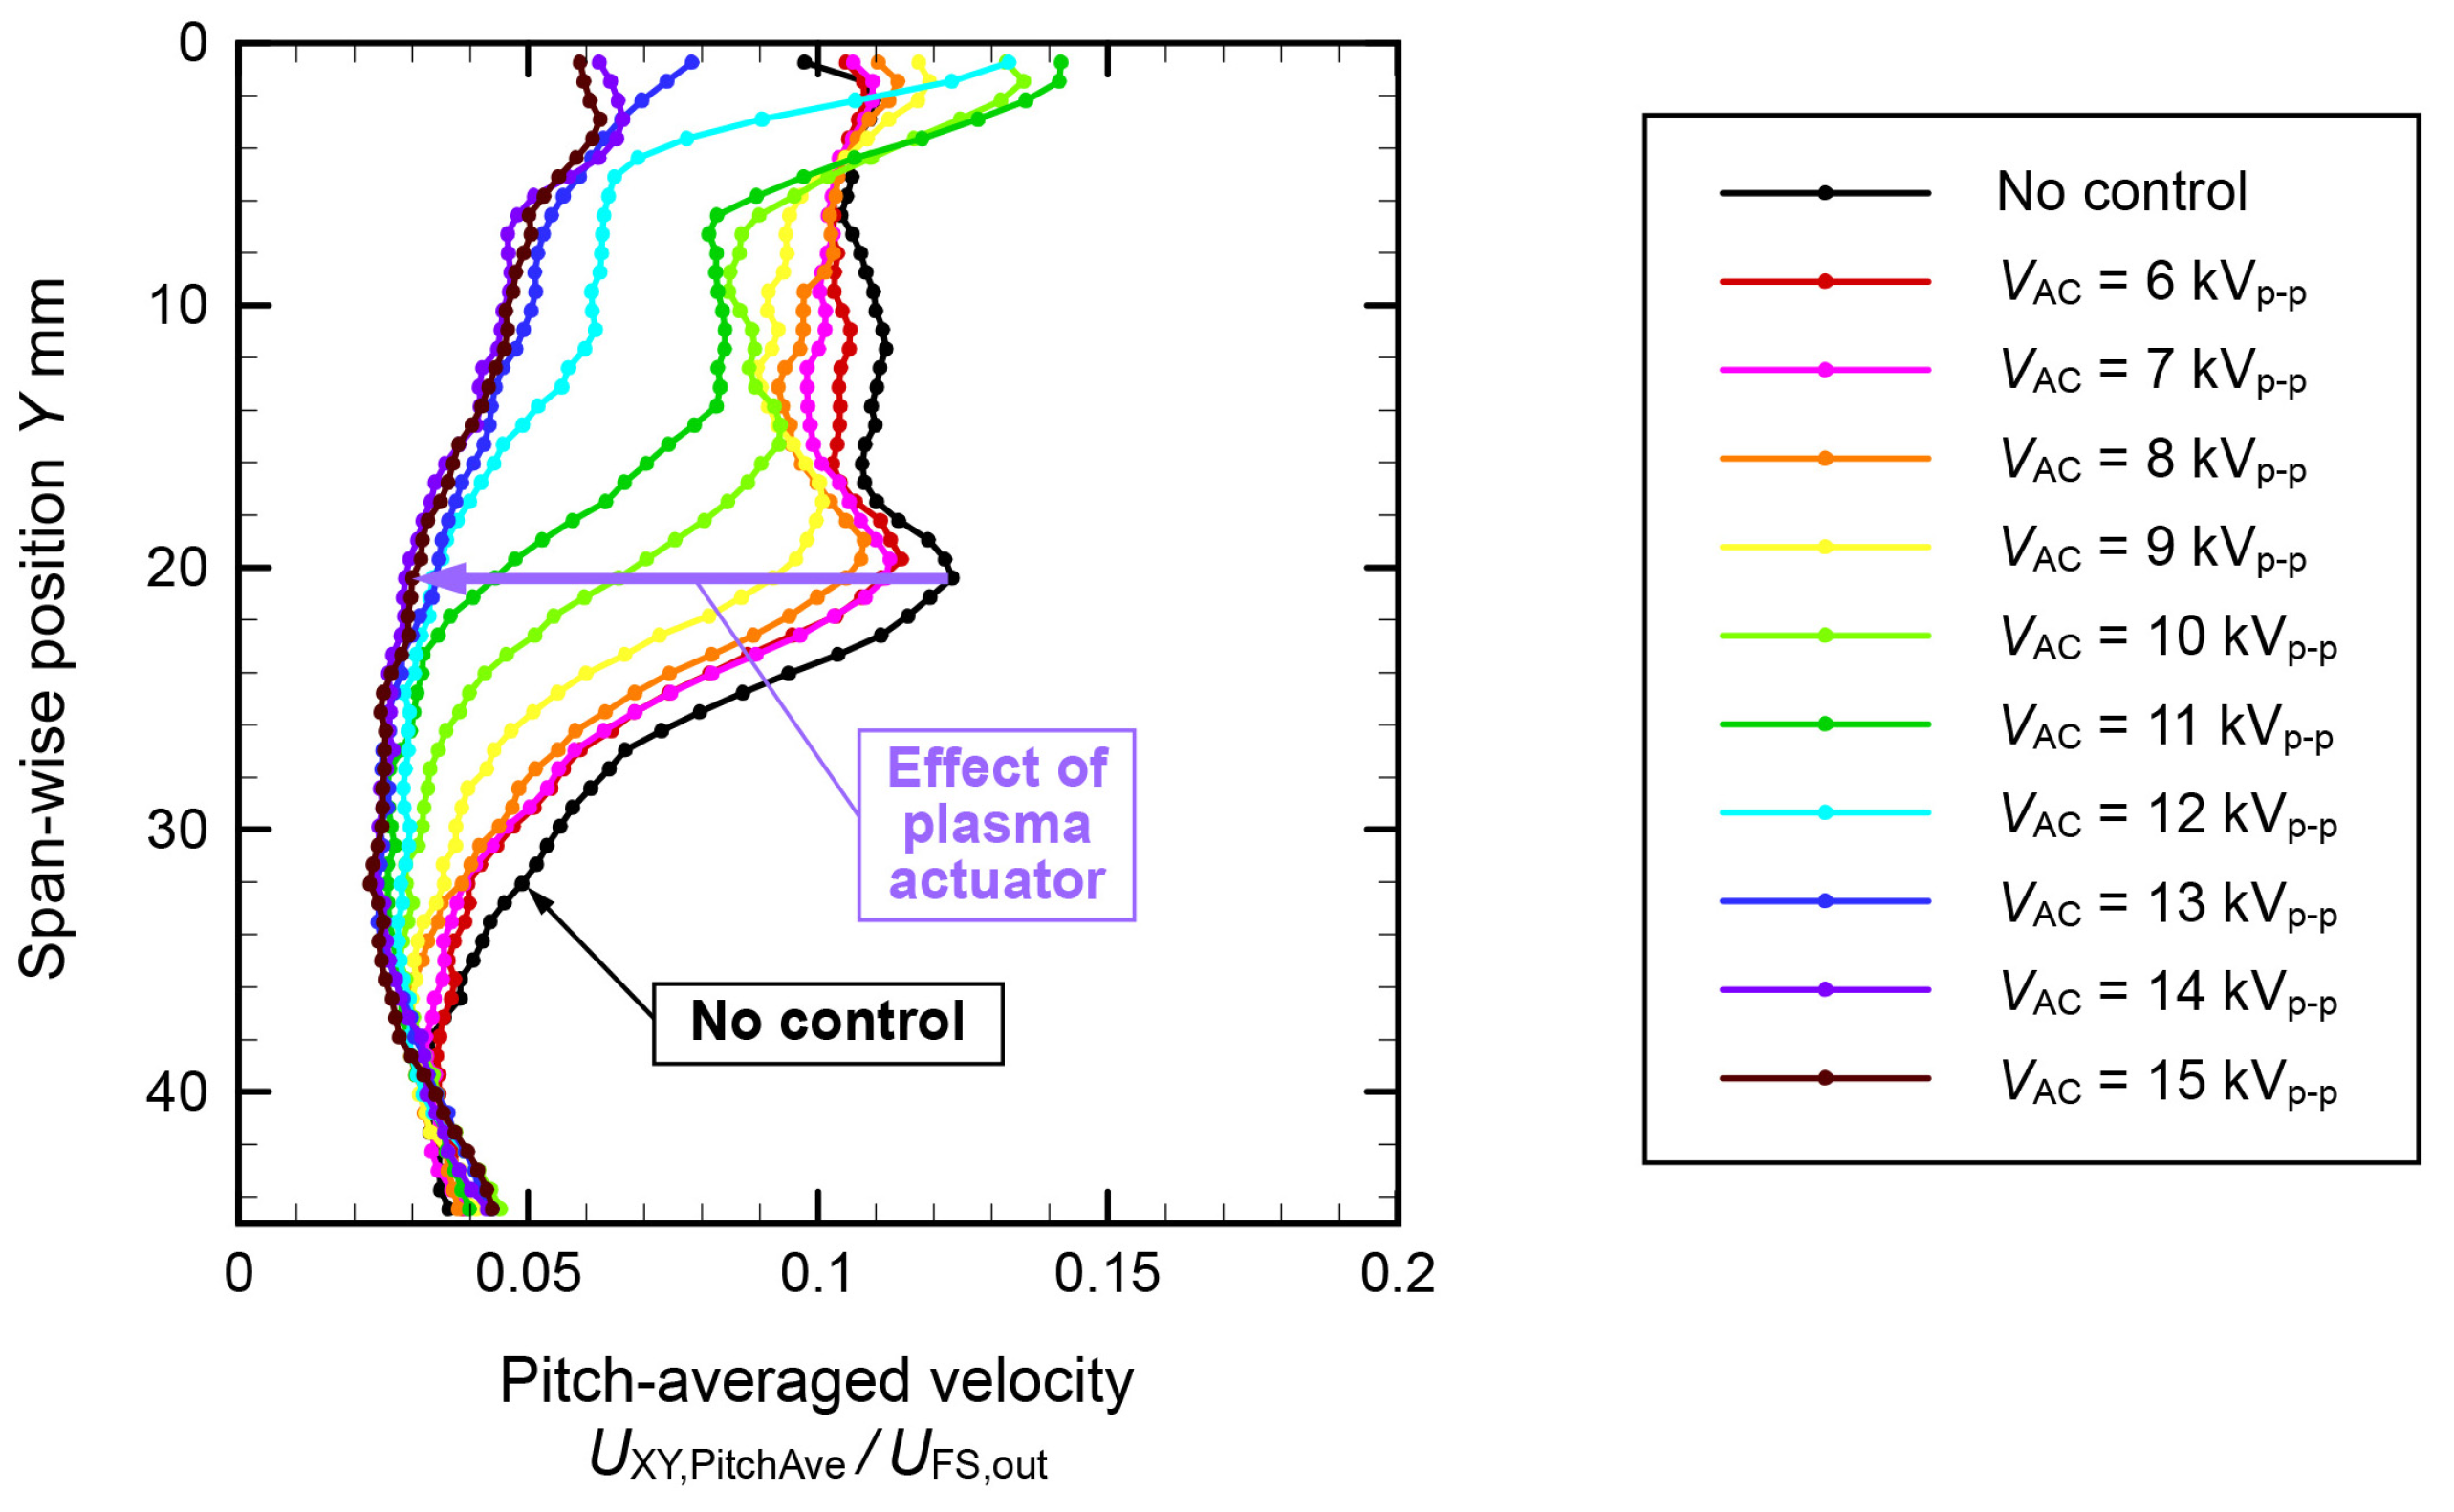
Figure 11 displays the span-wise distribution of the pitch-averaged velocity within the central passage (passage 2) of the PA2 actuator layout. The velocity around Y = 20 mm decreased because of the PA drive. At Y = 20.4 mm, the velocity was 0.123 with no control and 0.030 with 15 kVp-p—a 76% reduction in velocity, which was larger than that in PA1. By contrast, in the vicinity of the upper endwall, the difference between PA1 and PA2 was remarkable. When the PA was driven, the velocity increased to 11 kVp-p; however, it gradually decreased above 12 kVp-p. The peak velocity at Y = 2.9 mm and 15 kVp-p was 0.062. Therefore, PA2 was more effective in suppressing PV than PA1.

3.1.3. Velocity Distribution of the Secondary Flow at PA3 (Slanted PA Blade Inside)

Figure 12 illustrates the velocity distribution of the secondary flow, demonstrating the effects of varying the input voltage in the PA3 actuator layout. Figure 12a shows the velocity distribution in the no-control case, exhibiting identical results to those shown in Figure 8a and Figure 10a. Figure 12b–k show the velocity distribution when the input voltage to PA3 was changed from 6 to 15 kVp-p. As the input voltage increased, the high-velocity region at the point where the PV met the SS side of the blade weakened. This decrease is more pronounced than that observed for PA1, and the velocity peak dissipates at an input voltage of 11 kVp-p or higher. By contrast, when the PV met the upper endwall, the peak velocity increased to an input voltage of 11 kVp-p; however, it tended to decrease above 12 kVp-p. At an input voltage exceeding 14 kVp-p, the presence of a PV system was not detected in the velocity vector distribution within passages 2 and 3, similar to the case of PA2.
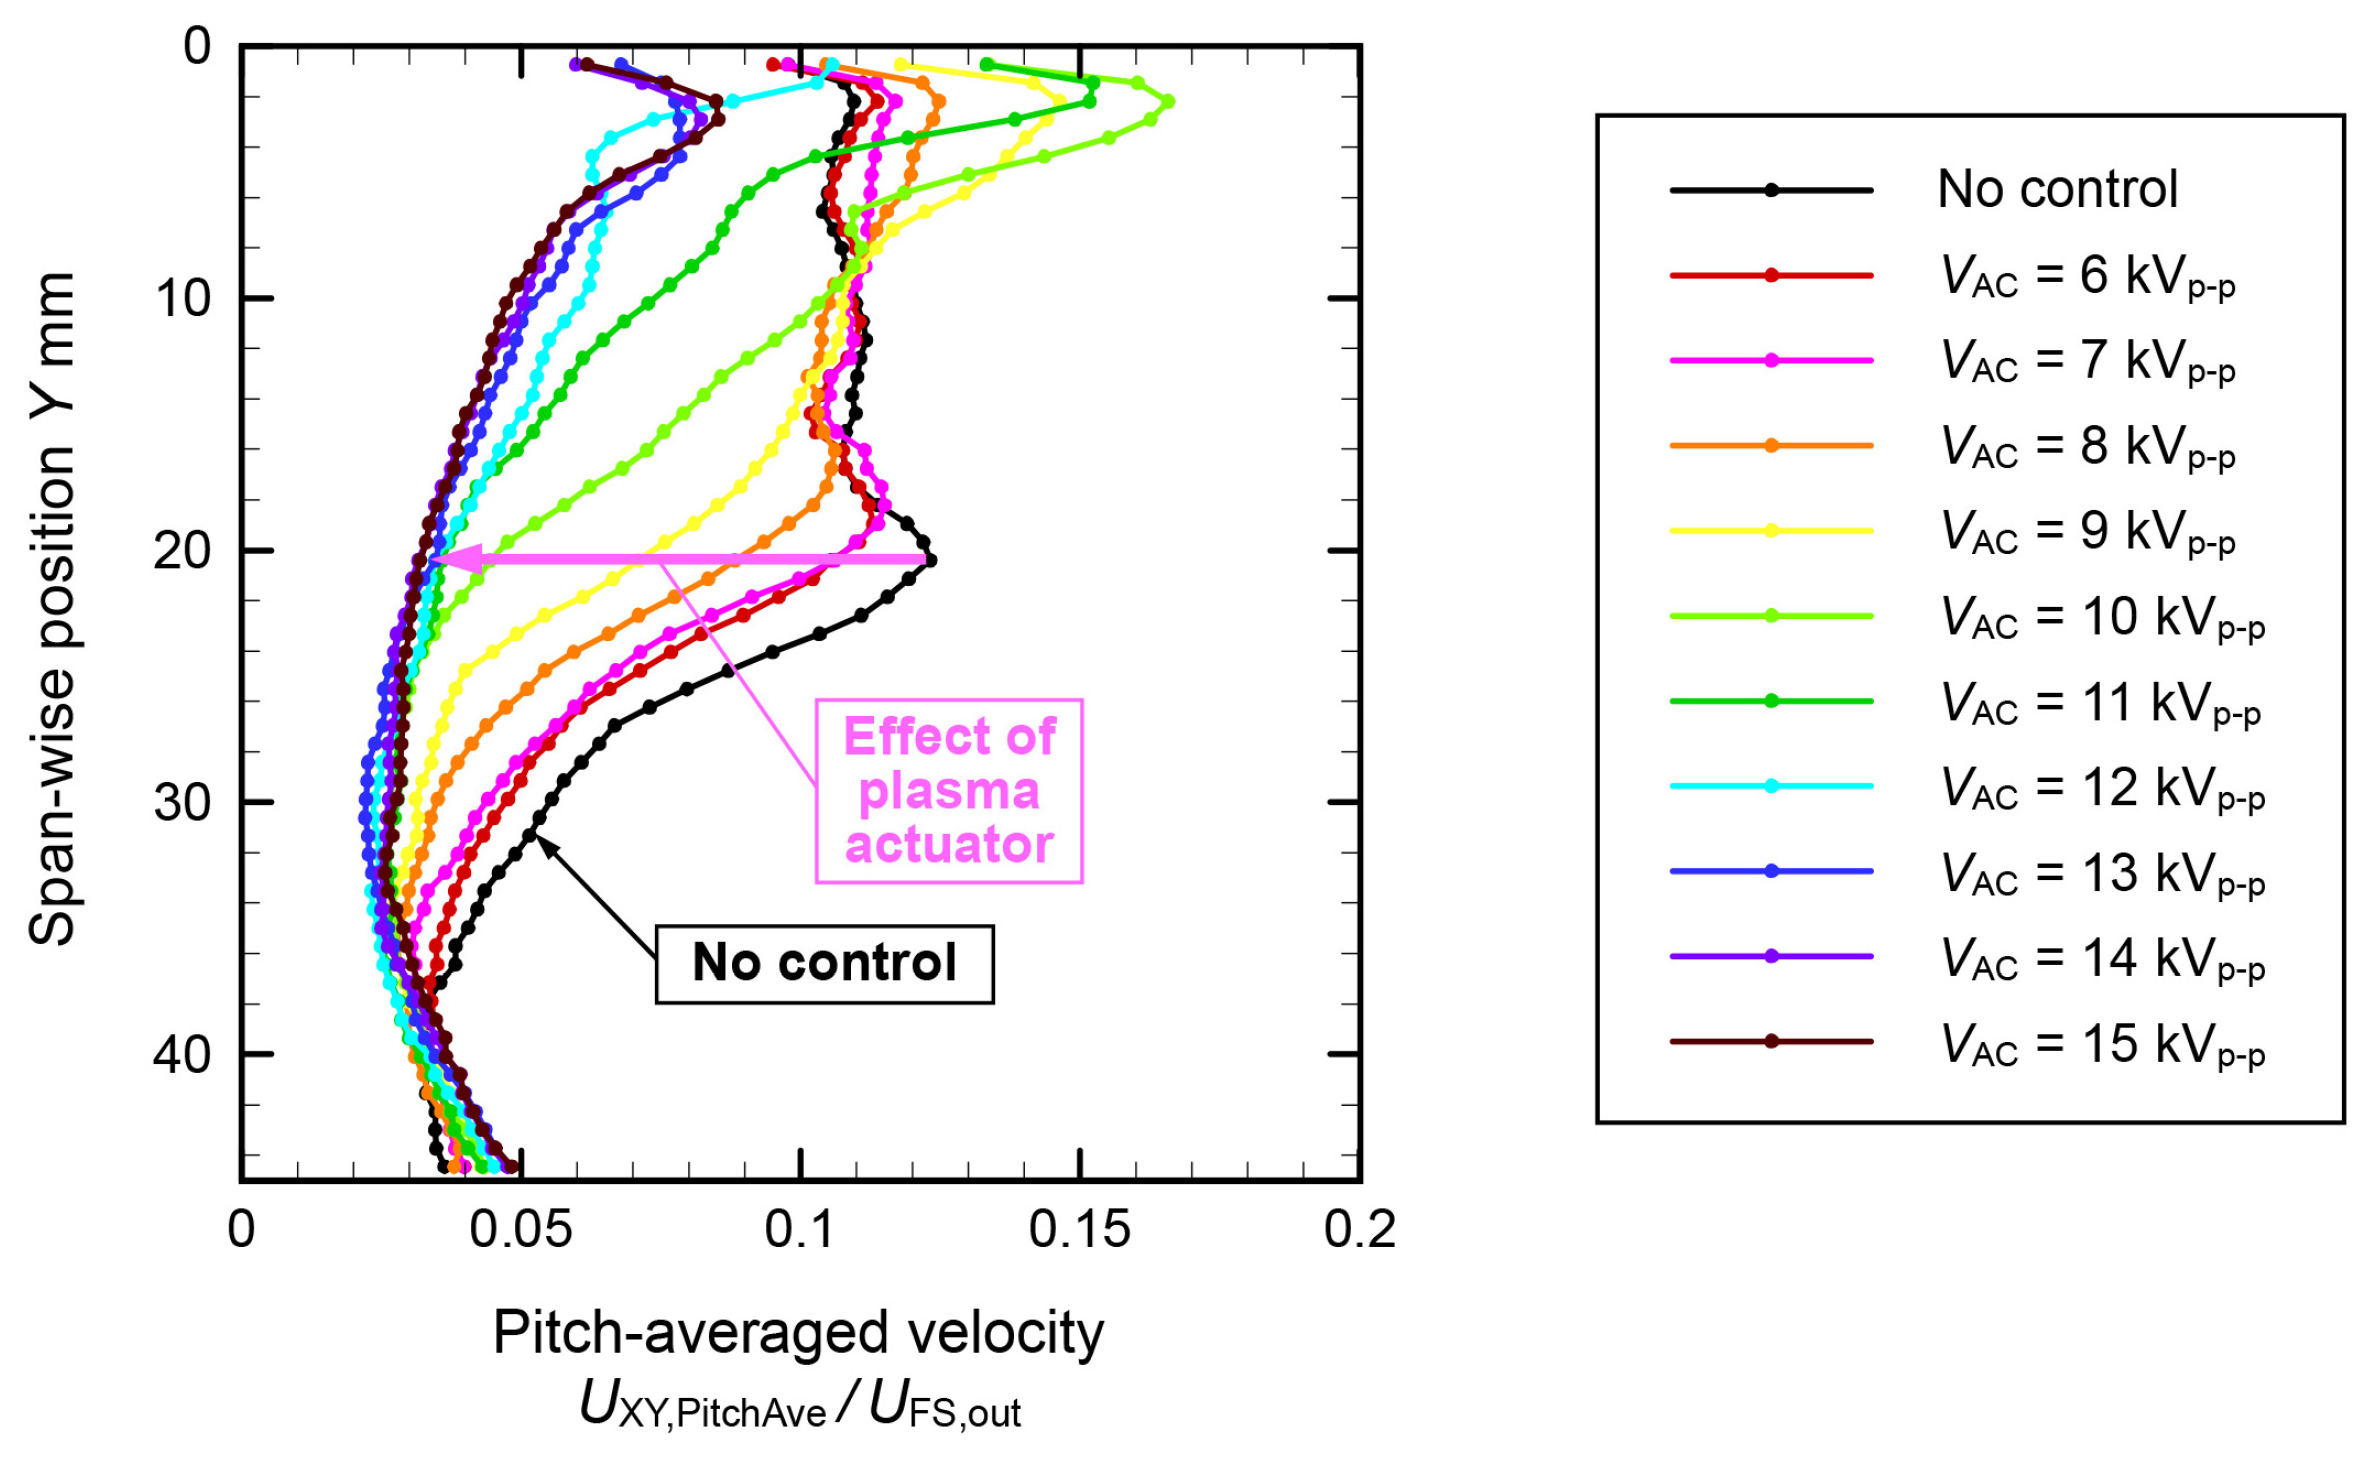
Figure 13 illustrates the span-wise distribution of the pitch-averaged velocity within the central passage (passage 2) of the PA3 actuator layout. The velocity around Y = 20 mm decreased because of the PA drive. At Y = 20.4 mm, the velocity was 0.123 with no control and 0.032 with 15 kVp-p—a 74% velocity reduction. The rate of decrease in PA3 was between those of PA1 and PA2. In contrast, in the vicinity of the upper endwall, the velocity increased to 10 kVp-p by driving the PA; however, it gradually decreased to 11 kVp-p and above. The peak velocity at Y = 2.9 mm and 15 kVp-p was 0.085. This peak value is lower than that of PA1 yet higher than that of PA2. Consequently, PA3 was slightly less effective in mitigating PV compared to PA2.

3.1.4. Quantitative Comparison between the Velocity Distributions of Three PA Layouts

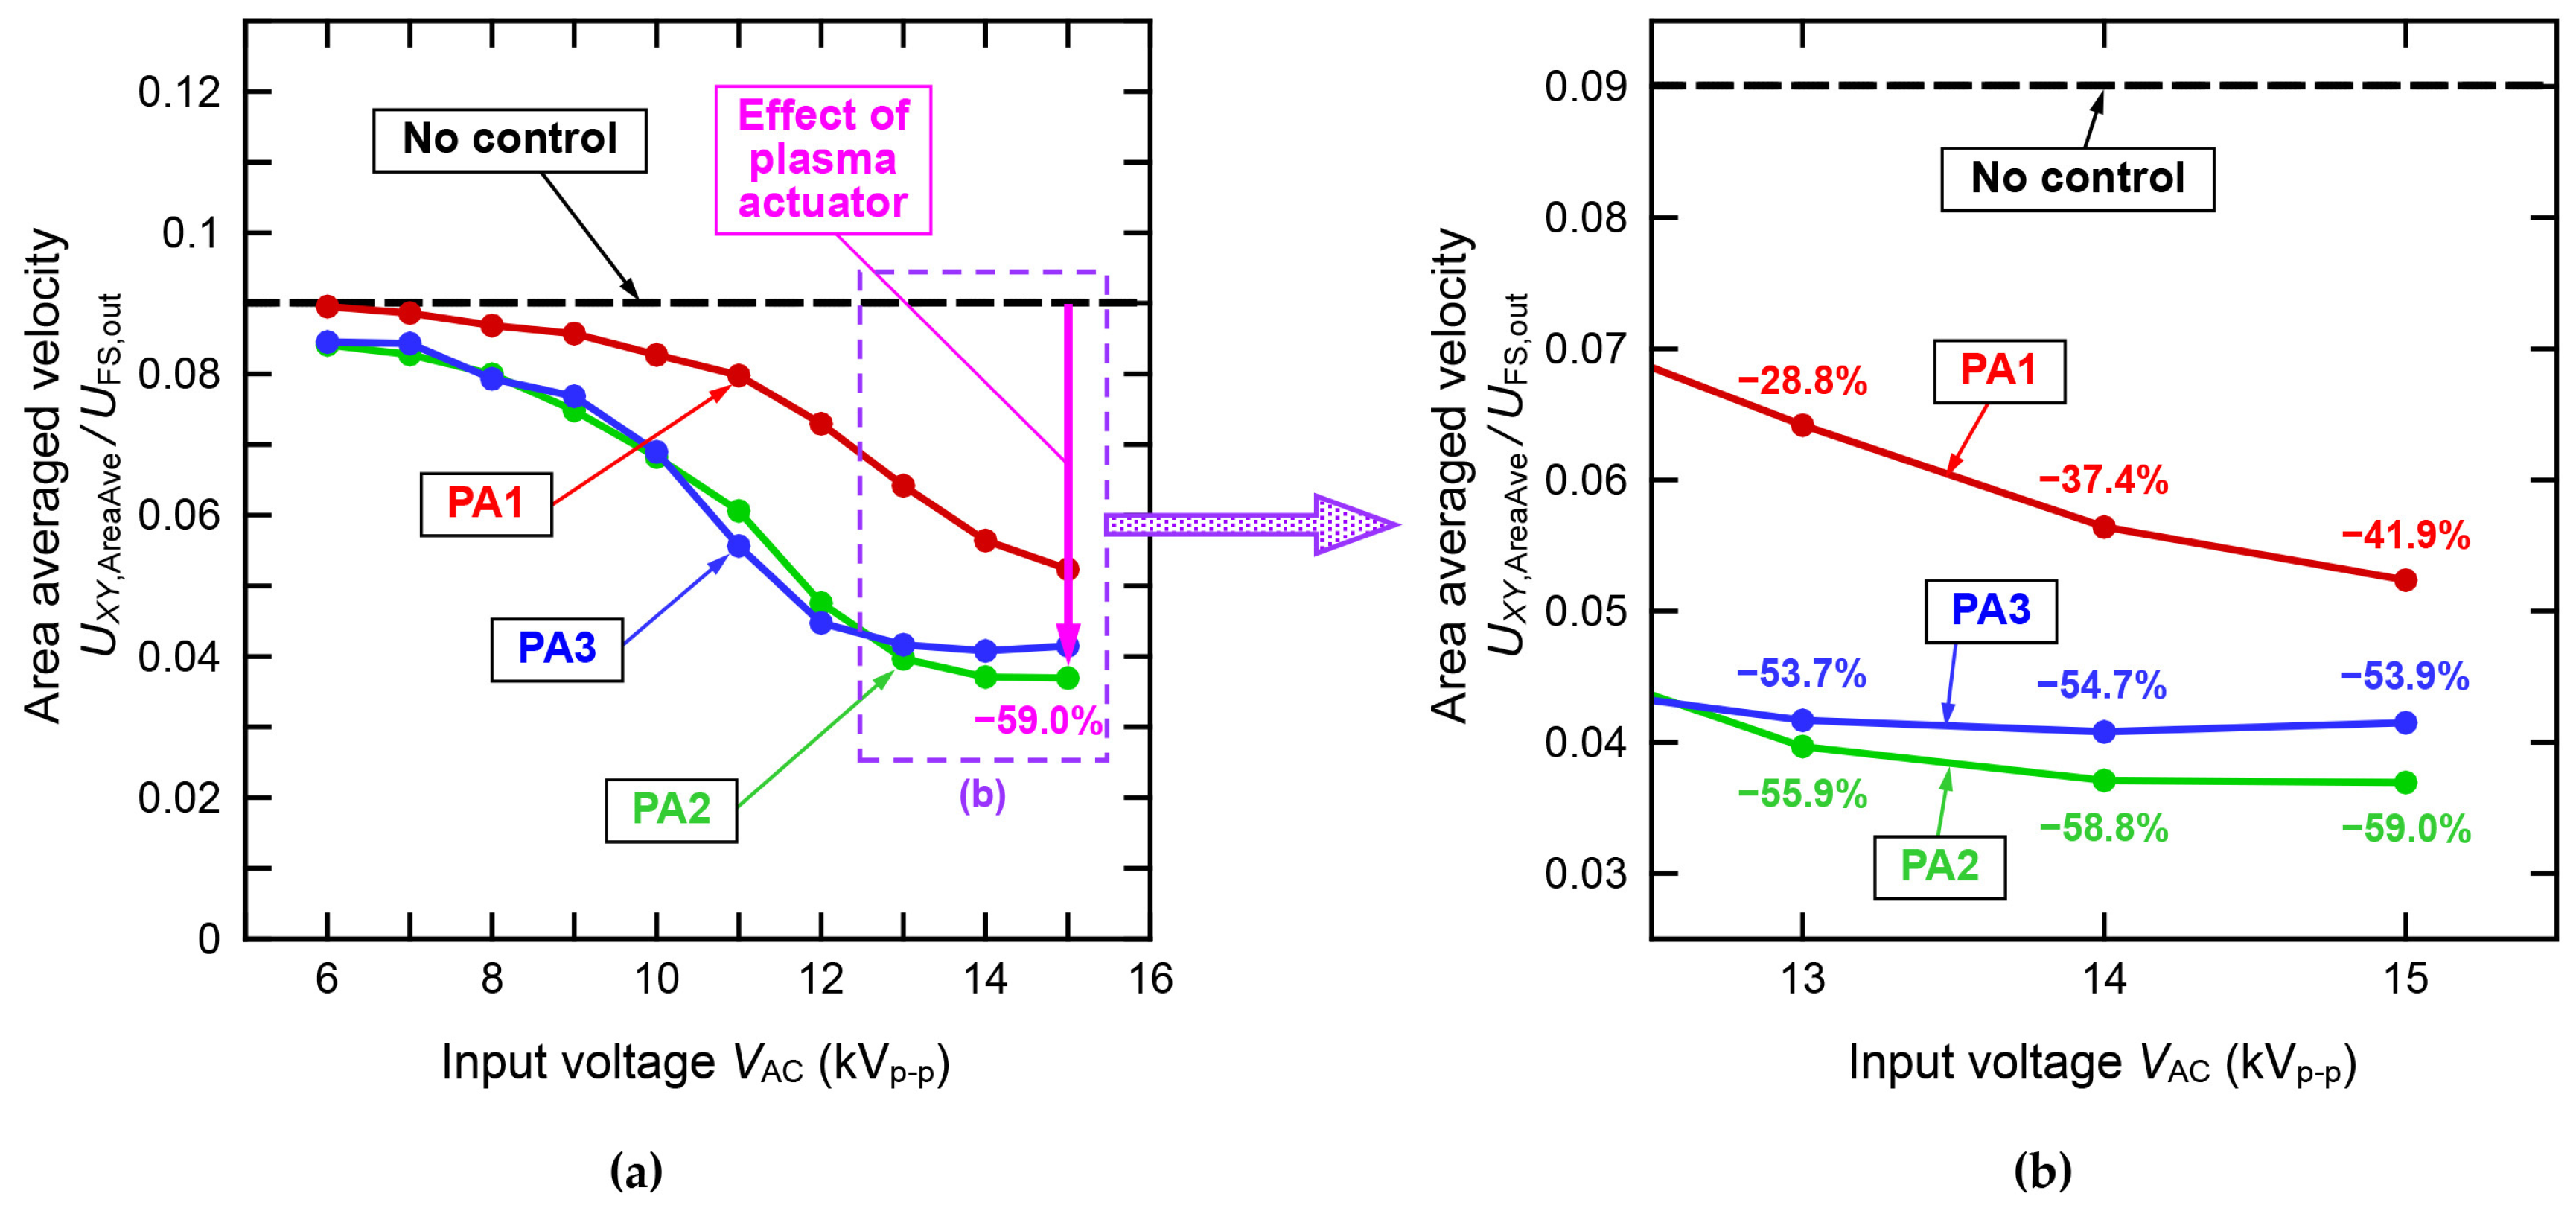
Figure 14a shows the area-averaged velocity of the secondary flow, computed within the central passage, in the span-wise velocity distribution of Figure 9, Figure 11 and Figure 13. This range extends from the upper endwall (Y = 0 mm) to the midspan (Y = 37.5 mm). The dashed black line represents the area-averaged velocity in the no-control condition (0.090). The area-averaged velocities for PA1, PA2, and PA3 are denoted by the red, green, and blue symbols, respectively. As the input voltage increases, the area-averaged velocity decreases. At the maximum input voltage of 15 kVp-p, the area-averaged velocity was the lowest at 0.037 at PA2, representing a 59.0% decrease compared to that of the control. Comparing PA2 and PA3, the input voltages up to 12 kVp-p exhibited almost the same trend; however, a difference occurred at 13 kVp-p or higher.
Figure 14b shows an enlarged section of the plot in Figure 14a for the high-input-voltage region (13 kVp-p and above). In the case of PA1, the decrease was 41.9% at the maximum input voltage of 15 kVp-p. At PA2, it decreased by 54.7% at 14 kVp-p. Comparing PA2 and PA3, the difference occurred at 13 kVp-p or higher and increased as the input voltage increased. At the maximum input voltage of 15 kVp-p, there was a 5.1% difference in velocity reduction.
To verify this, Figure 15 compiles the span-wise velocity distributions for the no-control case and PA1, PA2, and PA3 at 15 kVp-p from Figure 9, Figure 11 and Figure 13, respectively. Comparing the velocity distributions of PA1, PA2, and PA3, all distributions exhibit almost the same distribution shapes at Y = 18 mm or higher. At Y = 18 mm or less, the velocity distribution of PA1 was larger than that of PA2 and PA3. At Y = 10 mm or less, the velocity distribution for PA3 exceeded that of PA2. Hence, the velocity distribution shape is notably influenced by the PV attenuation near the upper endwall.
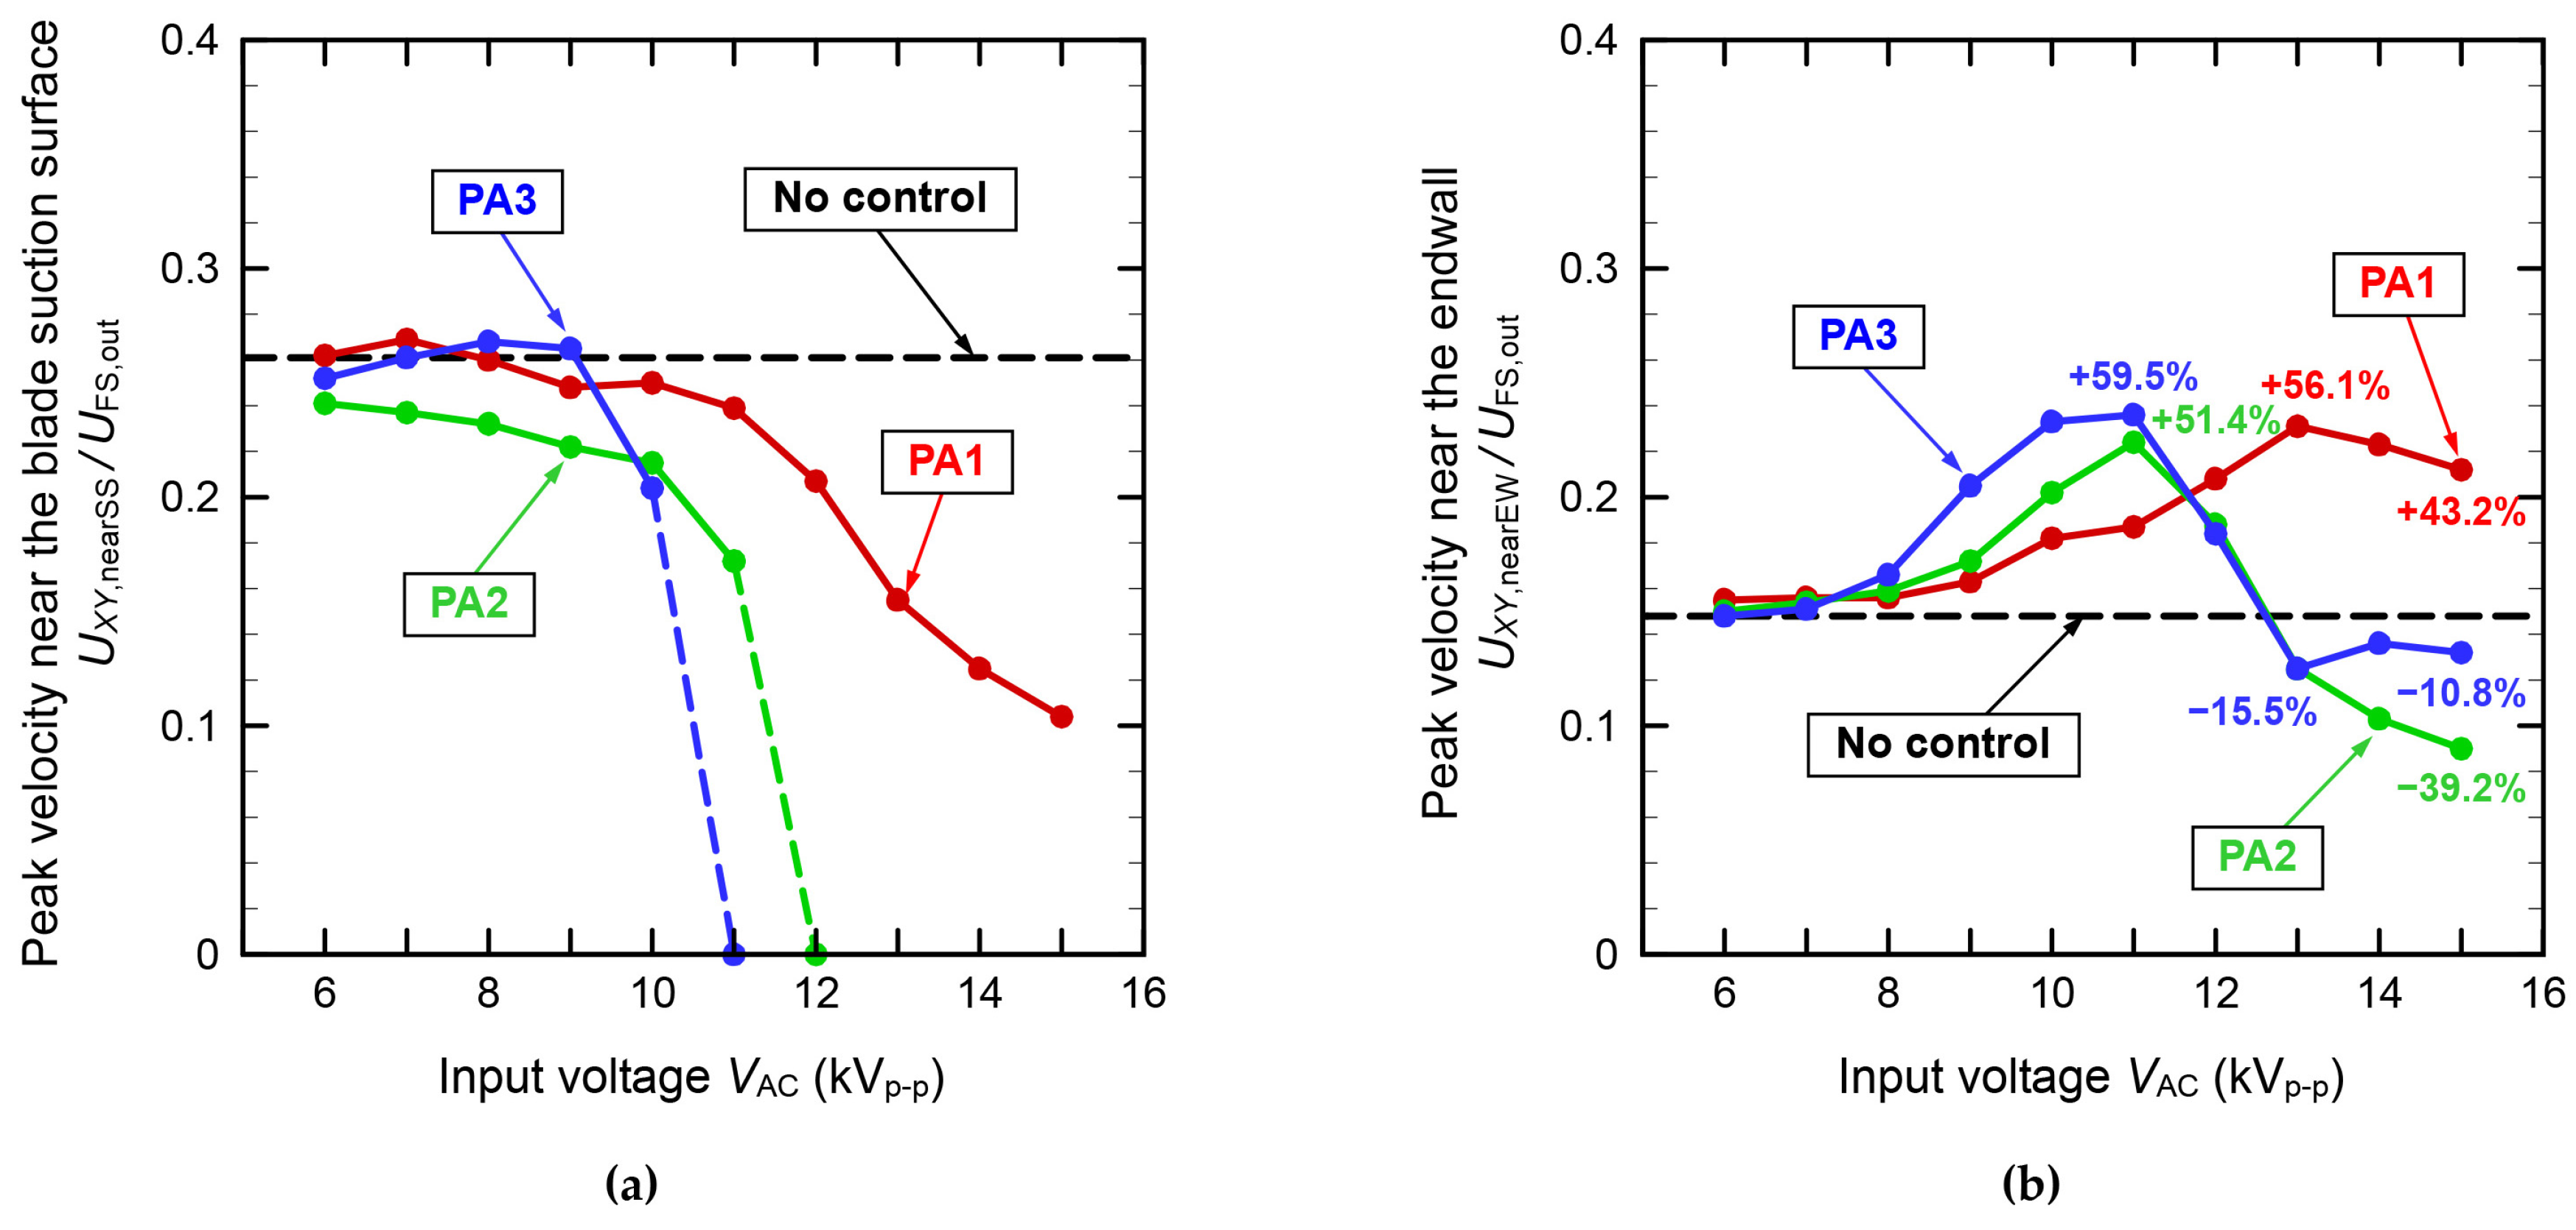
Figure 16 shows the peak velocities within the central passage. In Figure 16a, the peak velocity is depicted when the PV interacts with the SS of the blade. Notably, the peak velocity of PA1 steadily decreased as the input voltage increased. By contrast, the decrease in the peak velocities of PA2 and PA3 was more pronounced than that of PA1, and the peak velocity near the blade’s SS disappeared at 12 kVp-p for PA2 and 11 kVp-p for PA3. Figure 16b shows the peak velocity when the PV touched the upper endwall. In PA1, the peak velocity gradually increased as the input voltage increased, increasing by 56.1% at 13 kVp-p compared with the no-control case. Above 14 kVp-p, it decreased, whereas at 15 kVp-p, it increased by 43.2%. In contrast, in PA2, it increased to 51.4% at 11 kVp-p and then decreased sharply, falling to 39.2% lower than that in the no-control case. In PA3, as in PA2, it increased to 59.5% at 11 kVp-p; then, at 13 kVp-p, it was 15.5% lower compared to the no-control case. Above 14 kVp-p, it increased slightly and was 10.8% lower at 15 kVp-p.

3.1.5. Streamlines and Center Position of the Passage Vortex

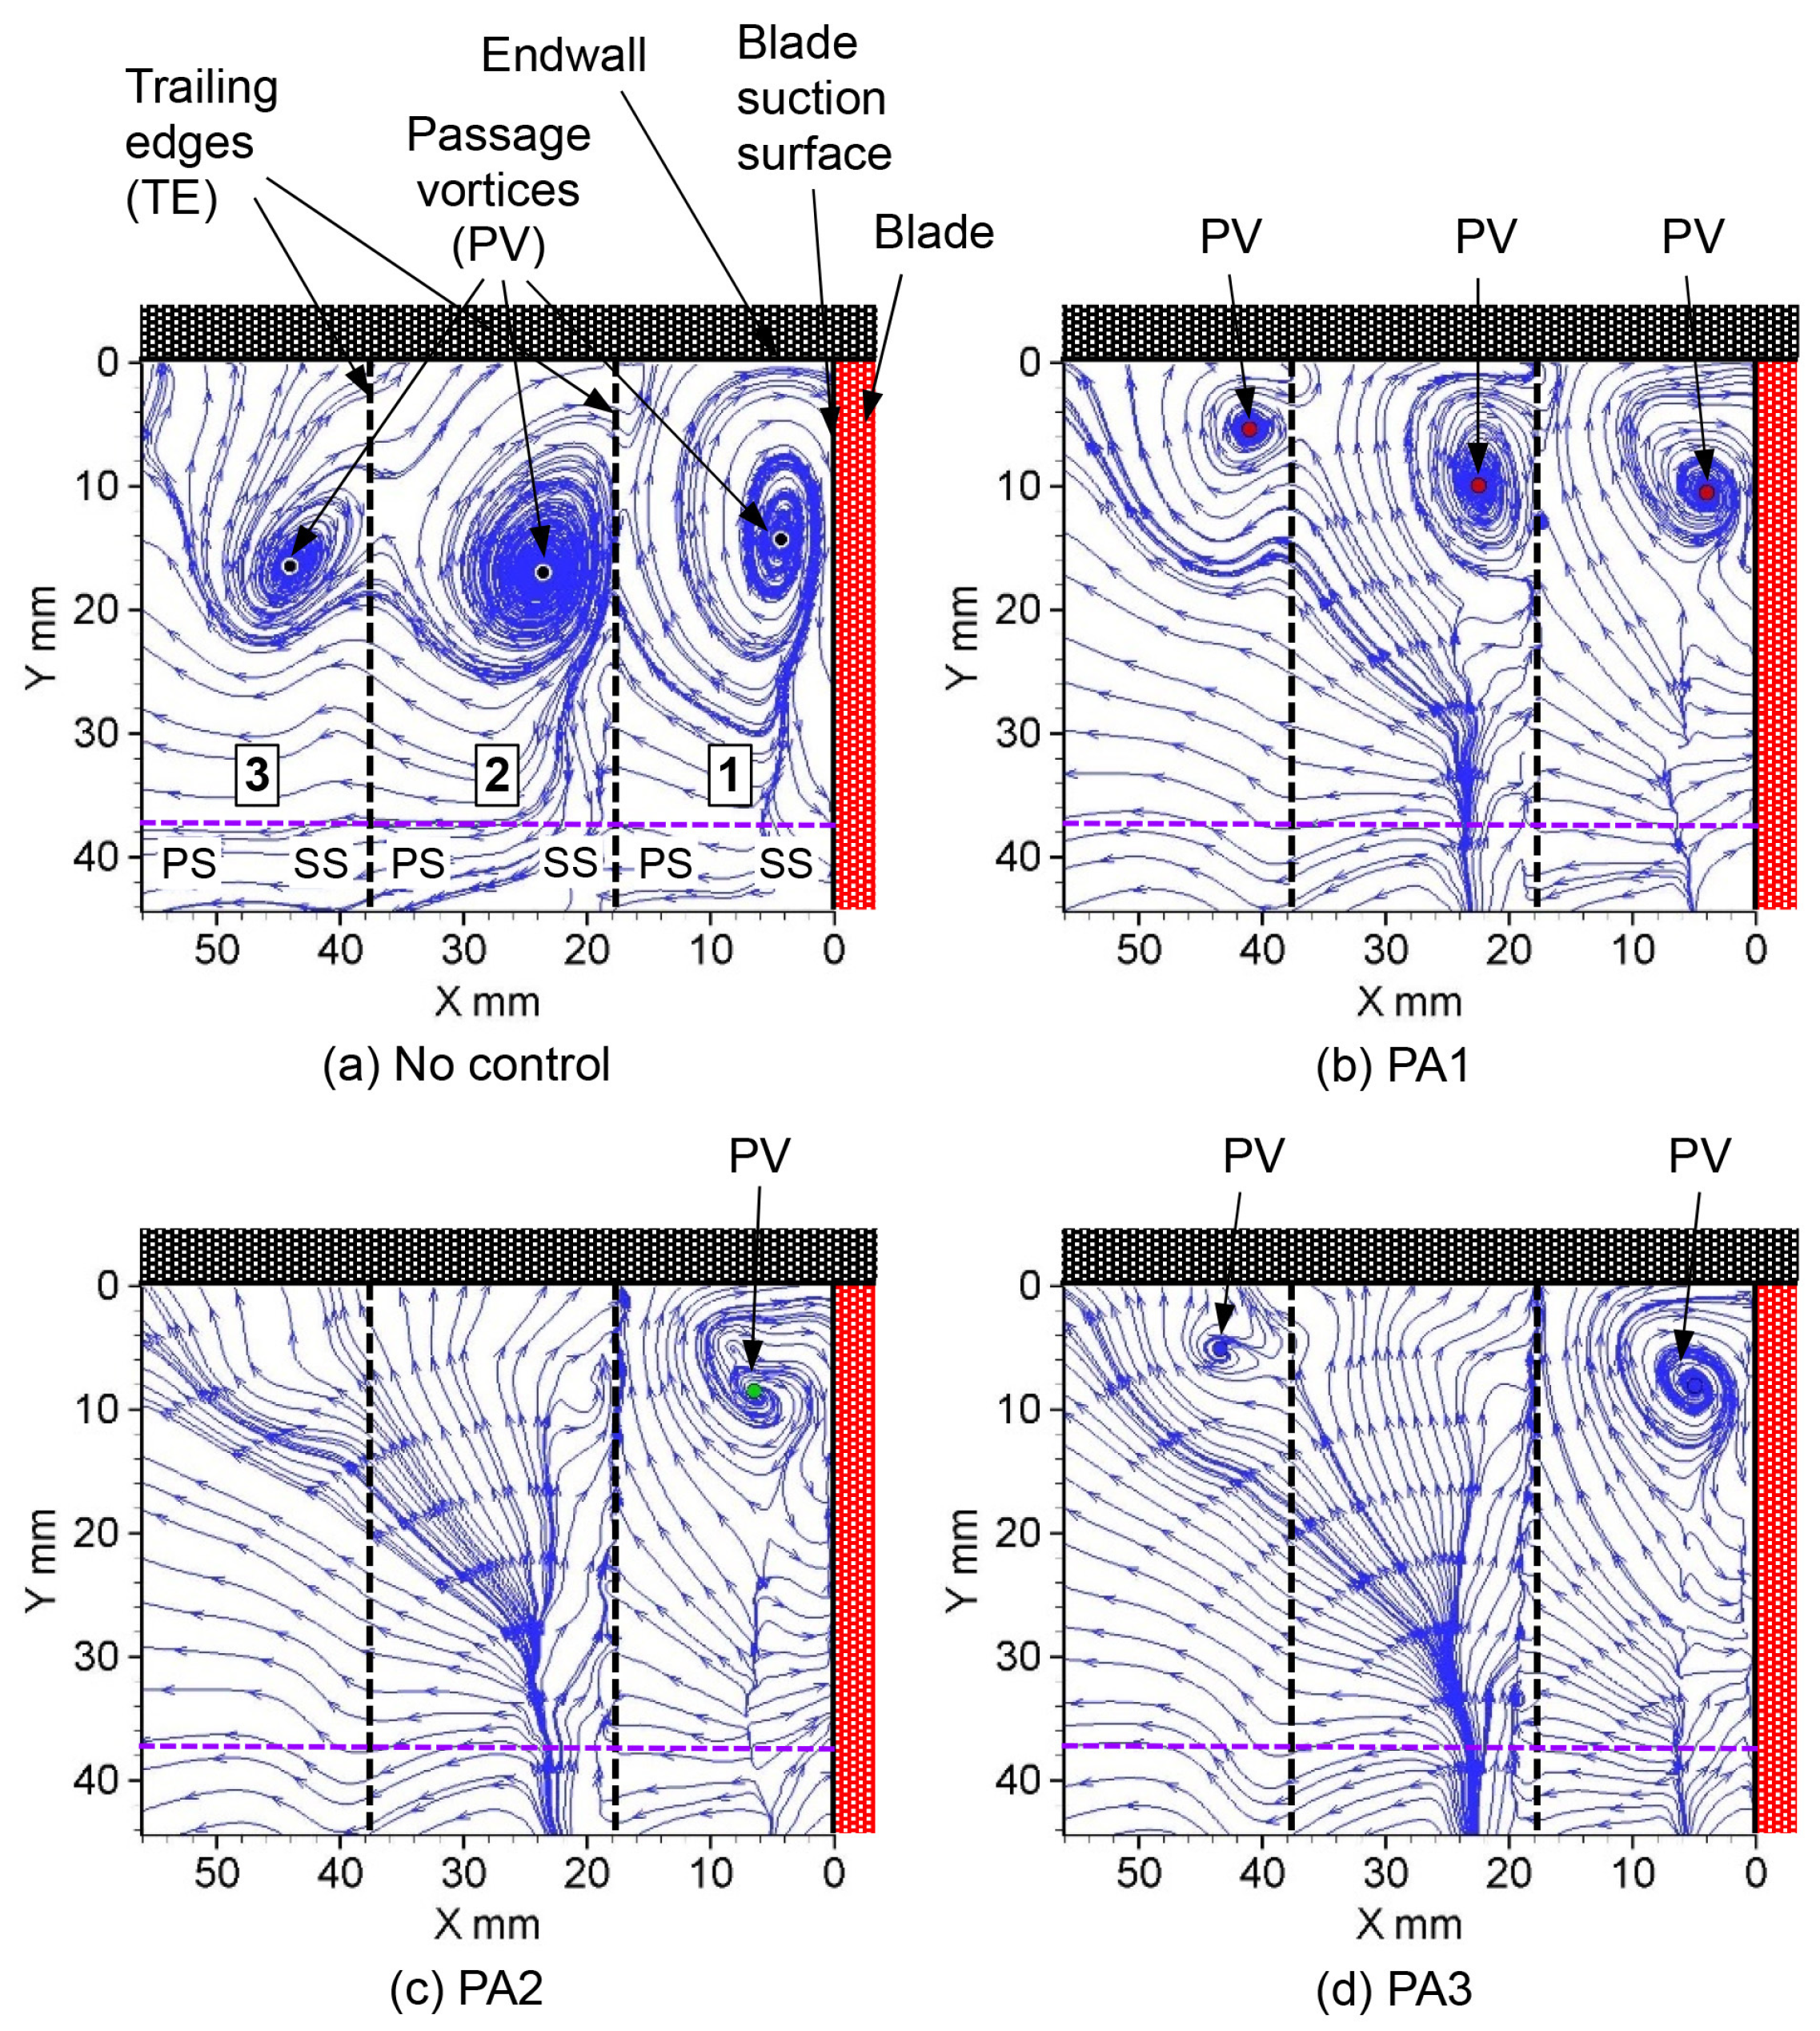
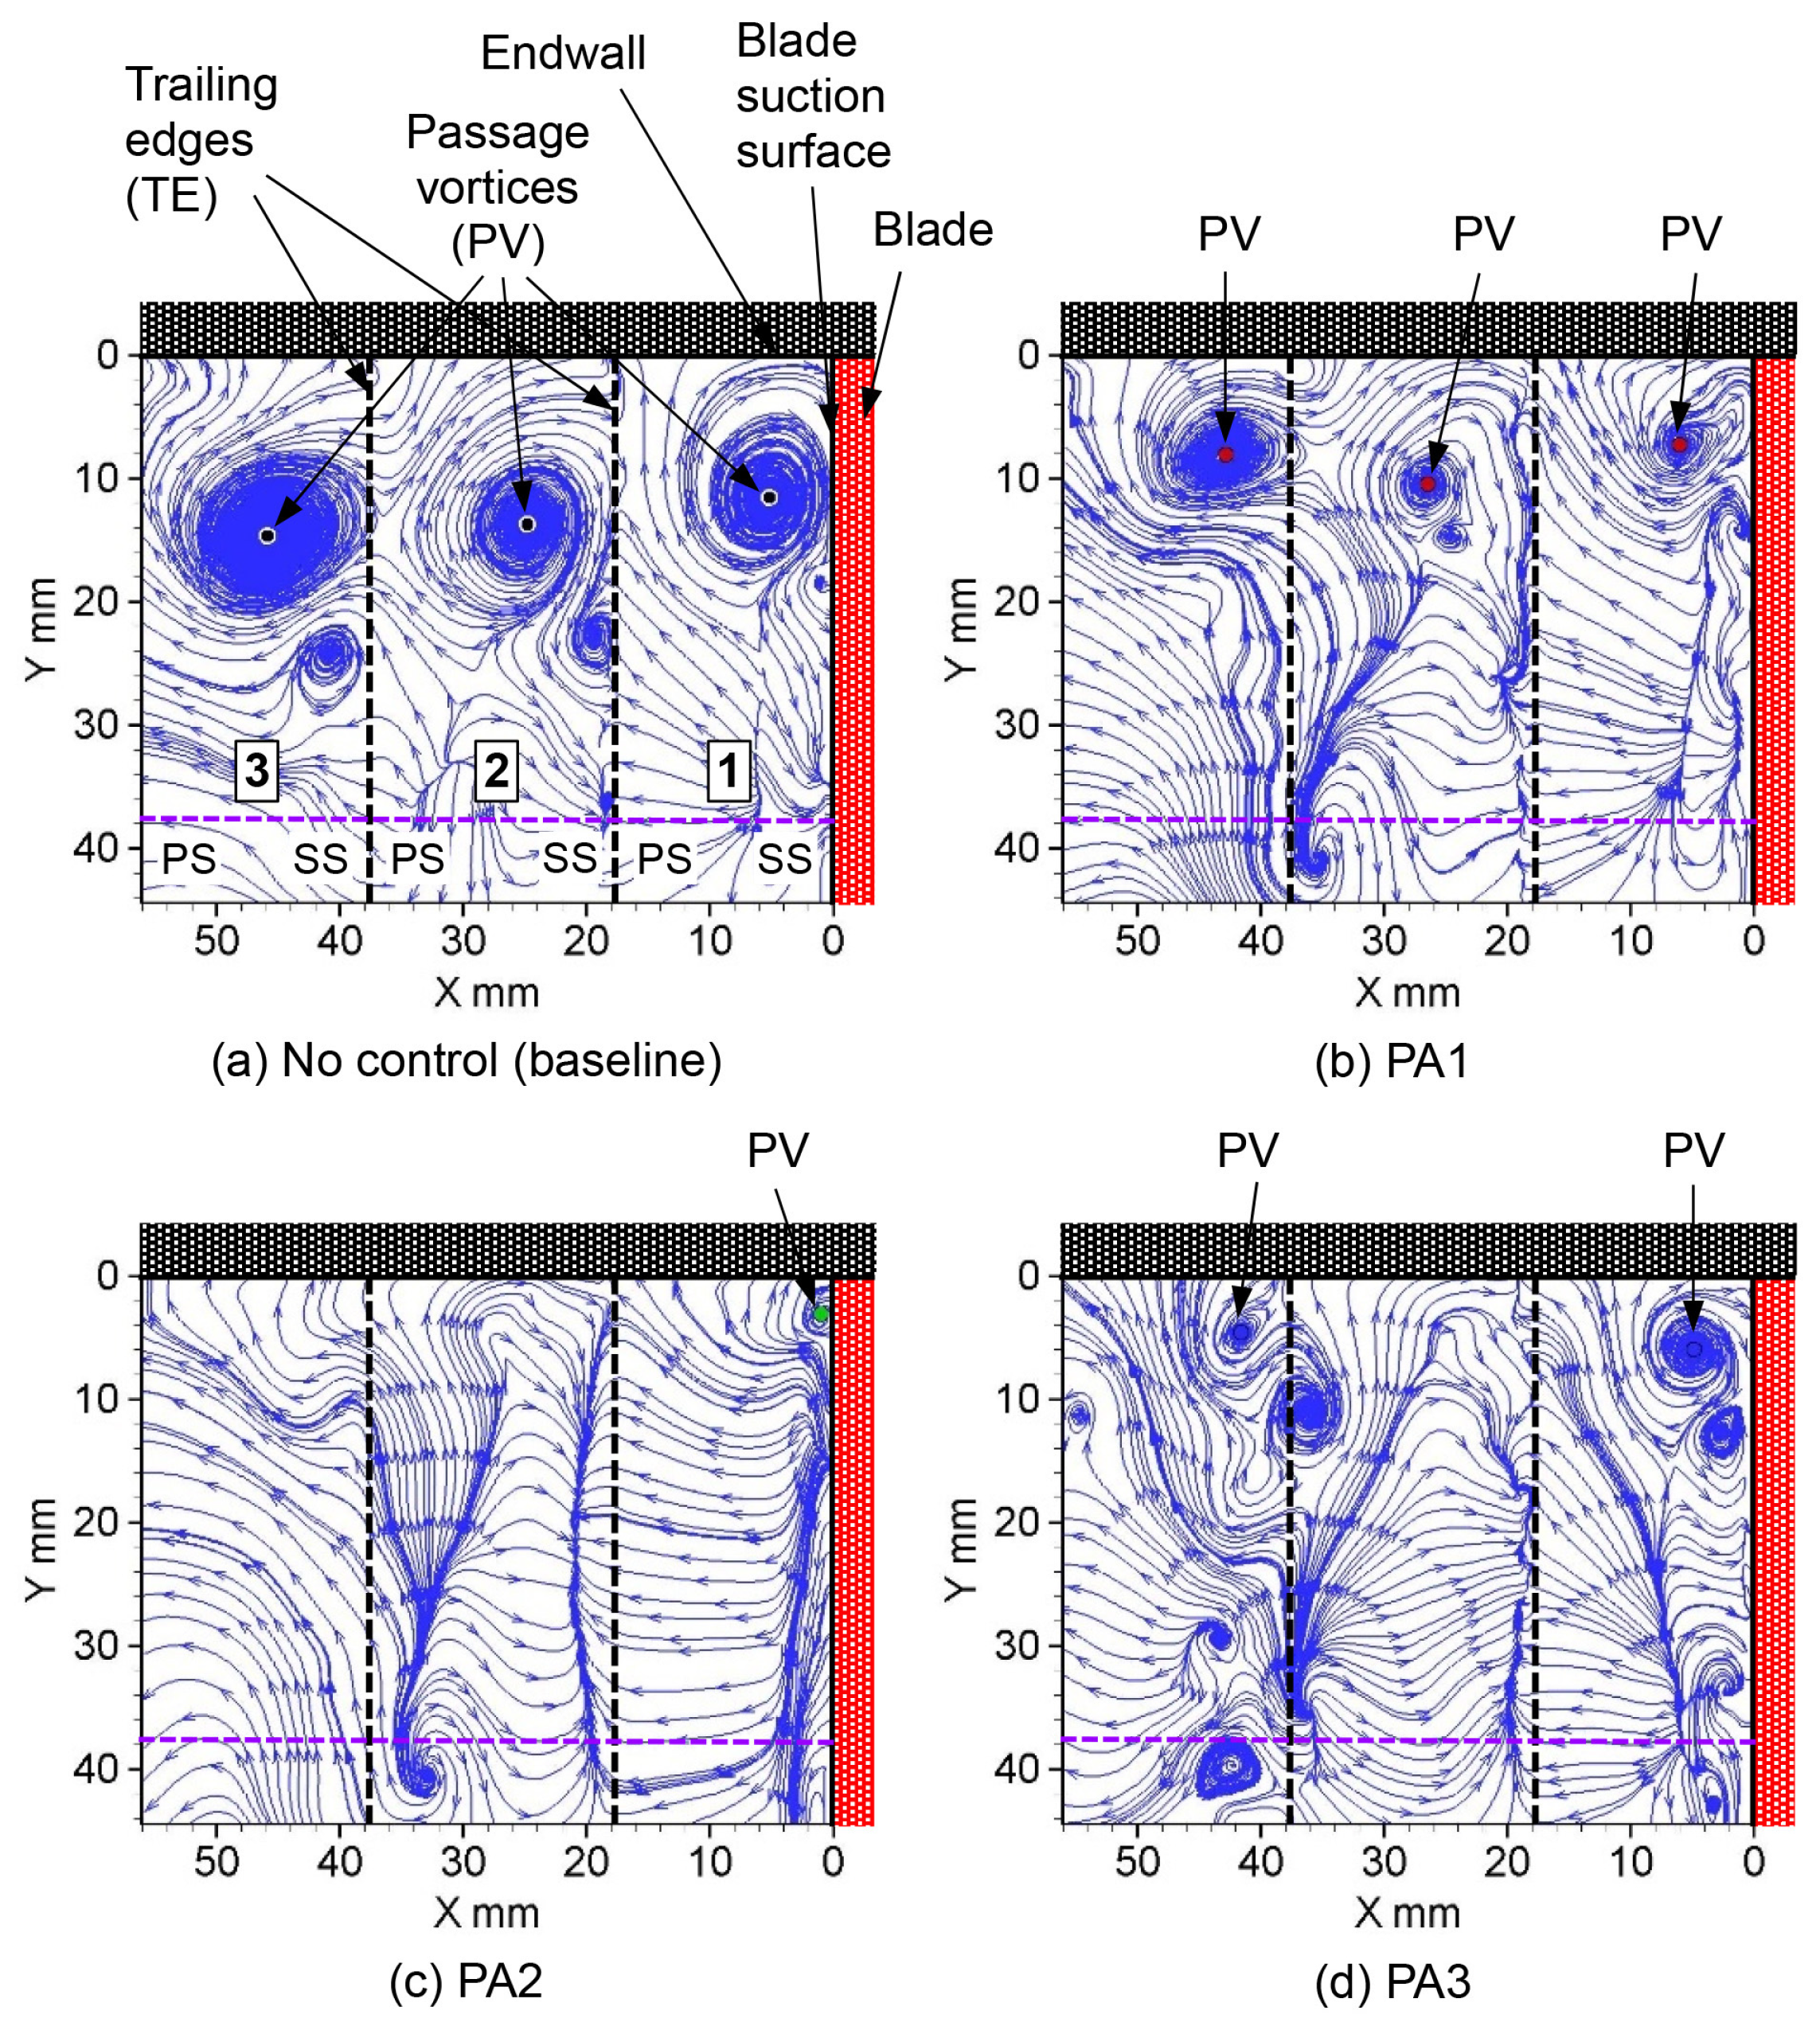
Figure 17 shows the streamlines for the no-control condition and the PA1, PA2, and PA3 layouts at an input voltage of 15 kVp-p. Figure 17a depicts the streamlines for the no-control condition, revealing the presence of significant PVs between the blades. In Figure 17b, the streamlines for PA1 are shown, where a PV is observed between each blade; nevertheless, the PV diminishes in magnitude as the blade progresses downstream. Figure 17c shows the streamlines at PA2. PVs are observed only in passage 1; meanwhile, they disappear in passages 2 and 3. Figure 17d displays the streamlines for PA3. In addition to the presence of PVs in passage 1, a minor PV is observed in passage 3.
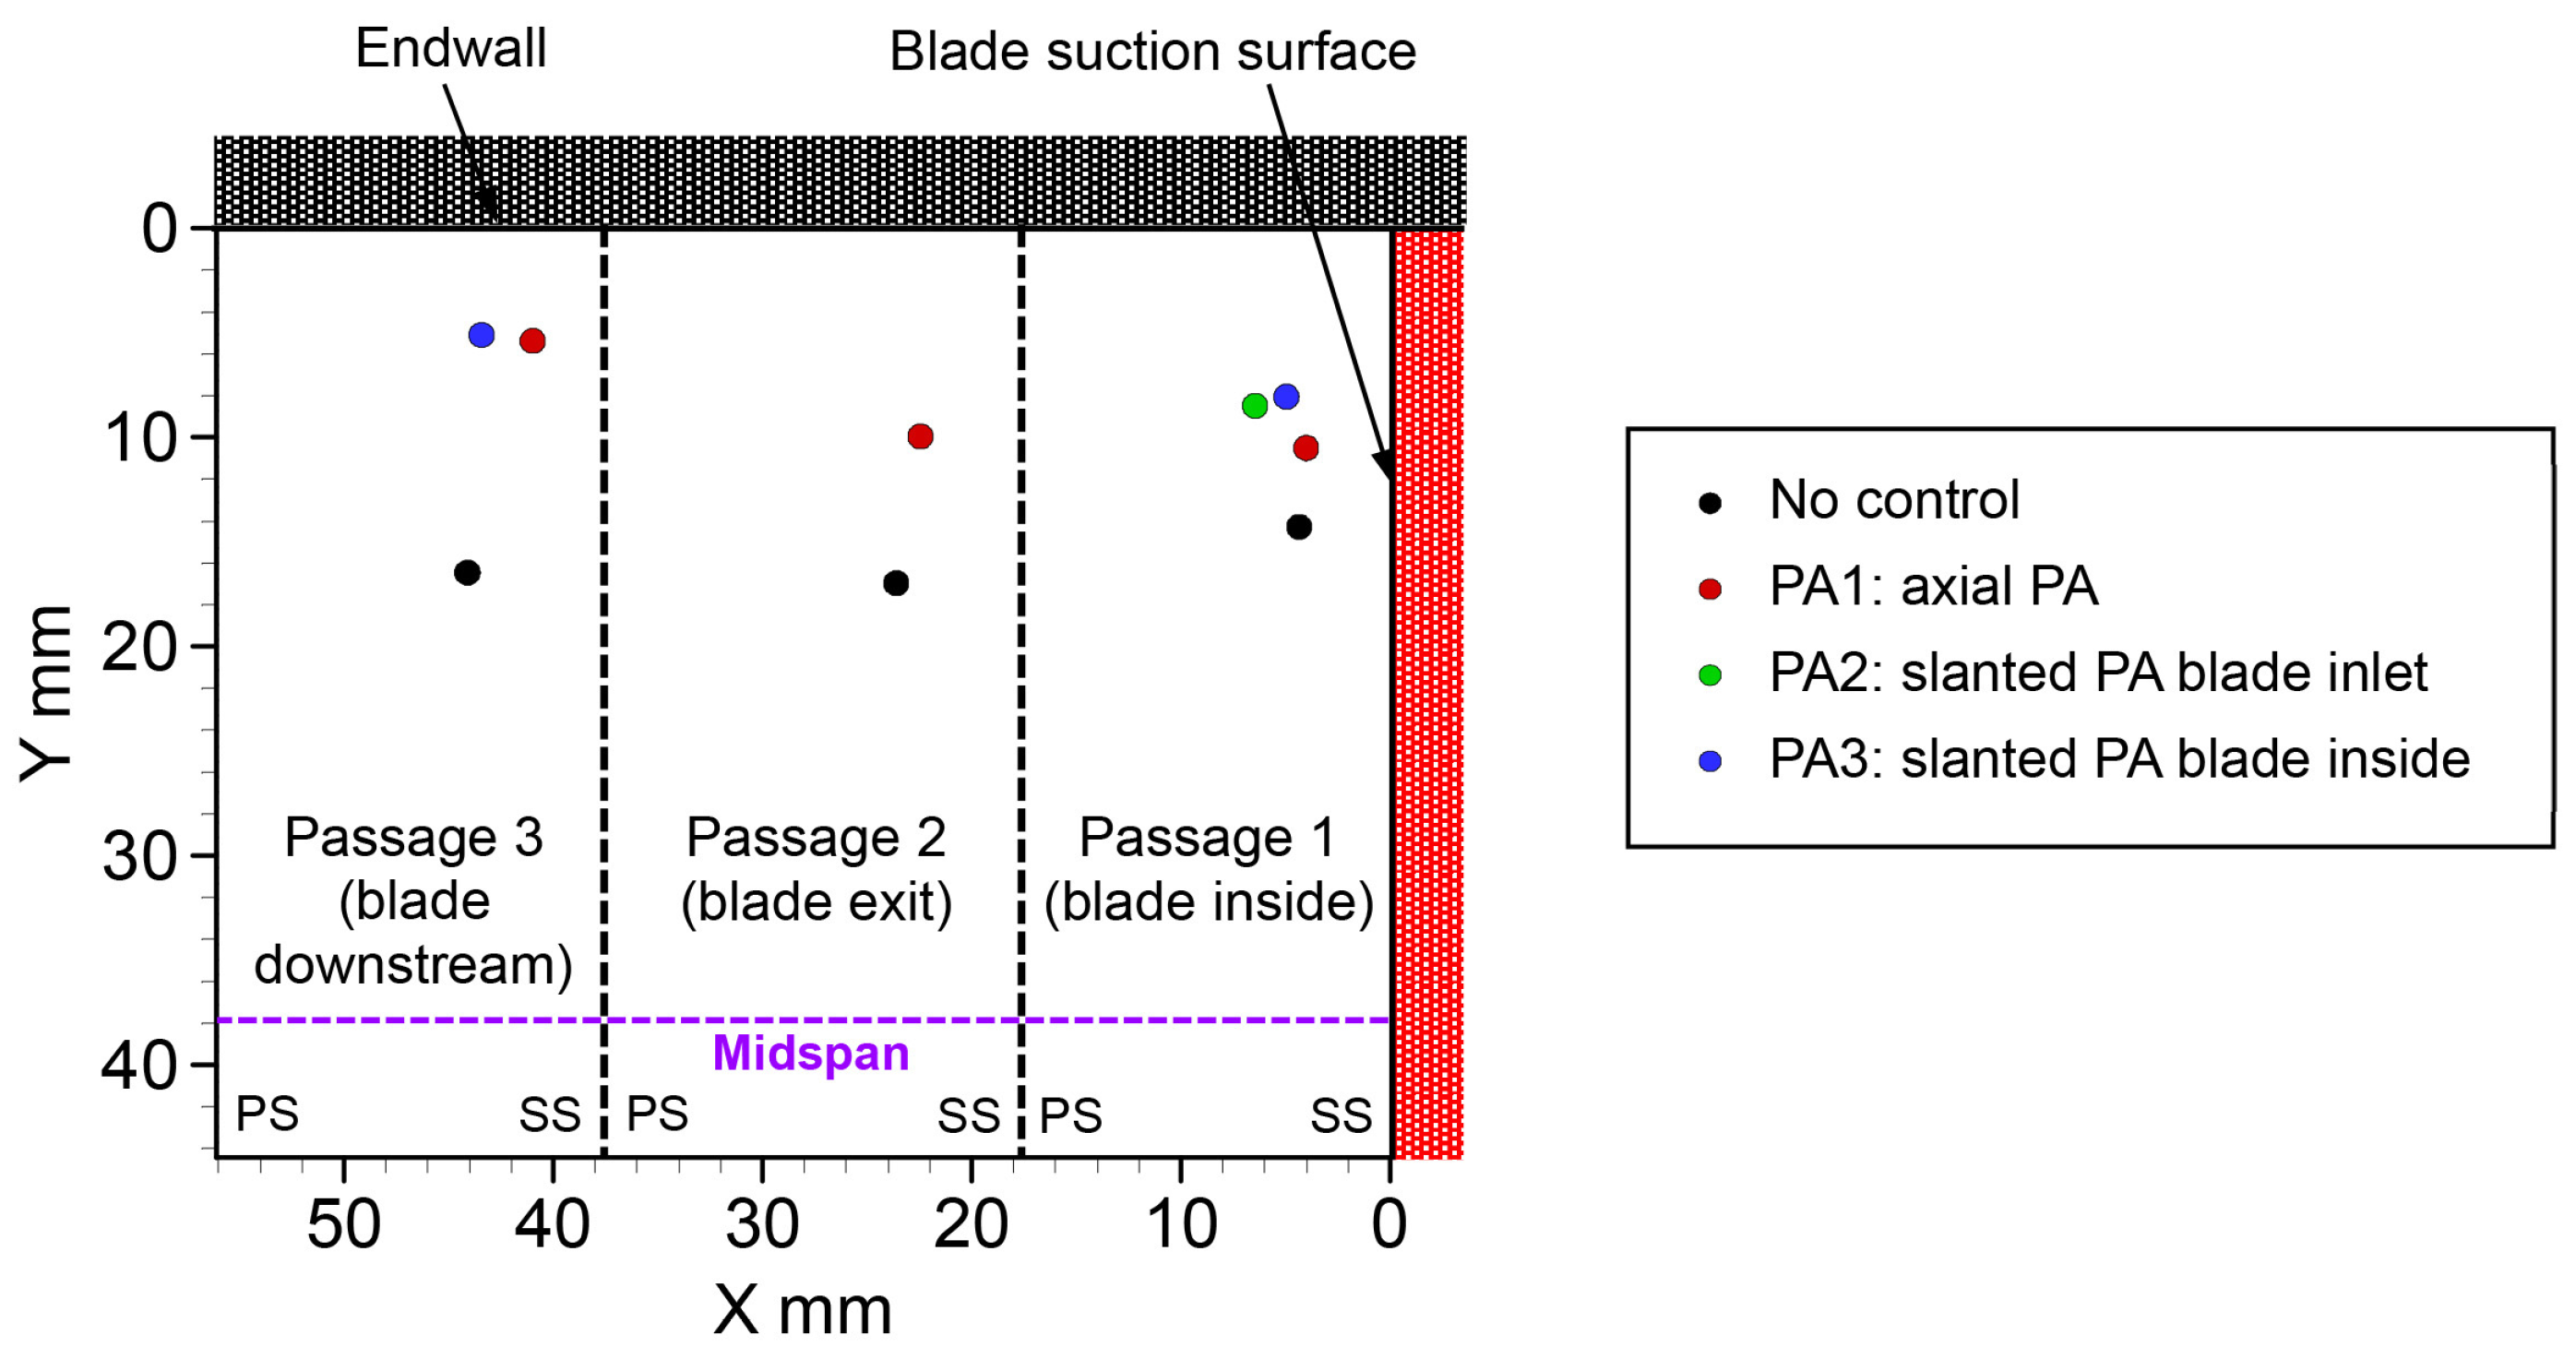
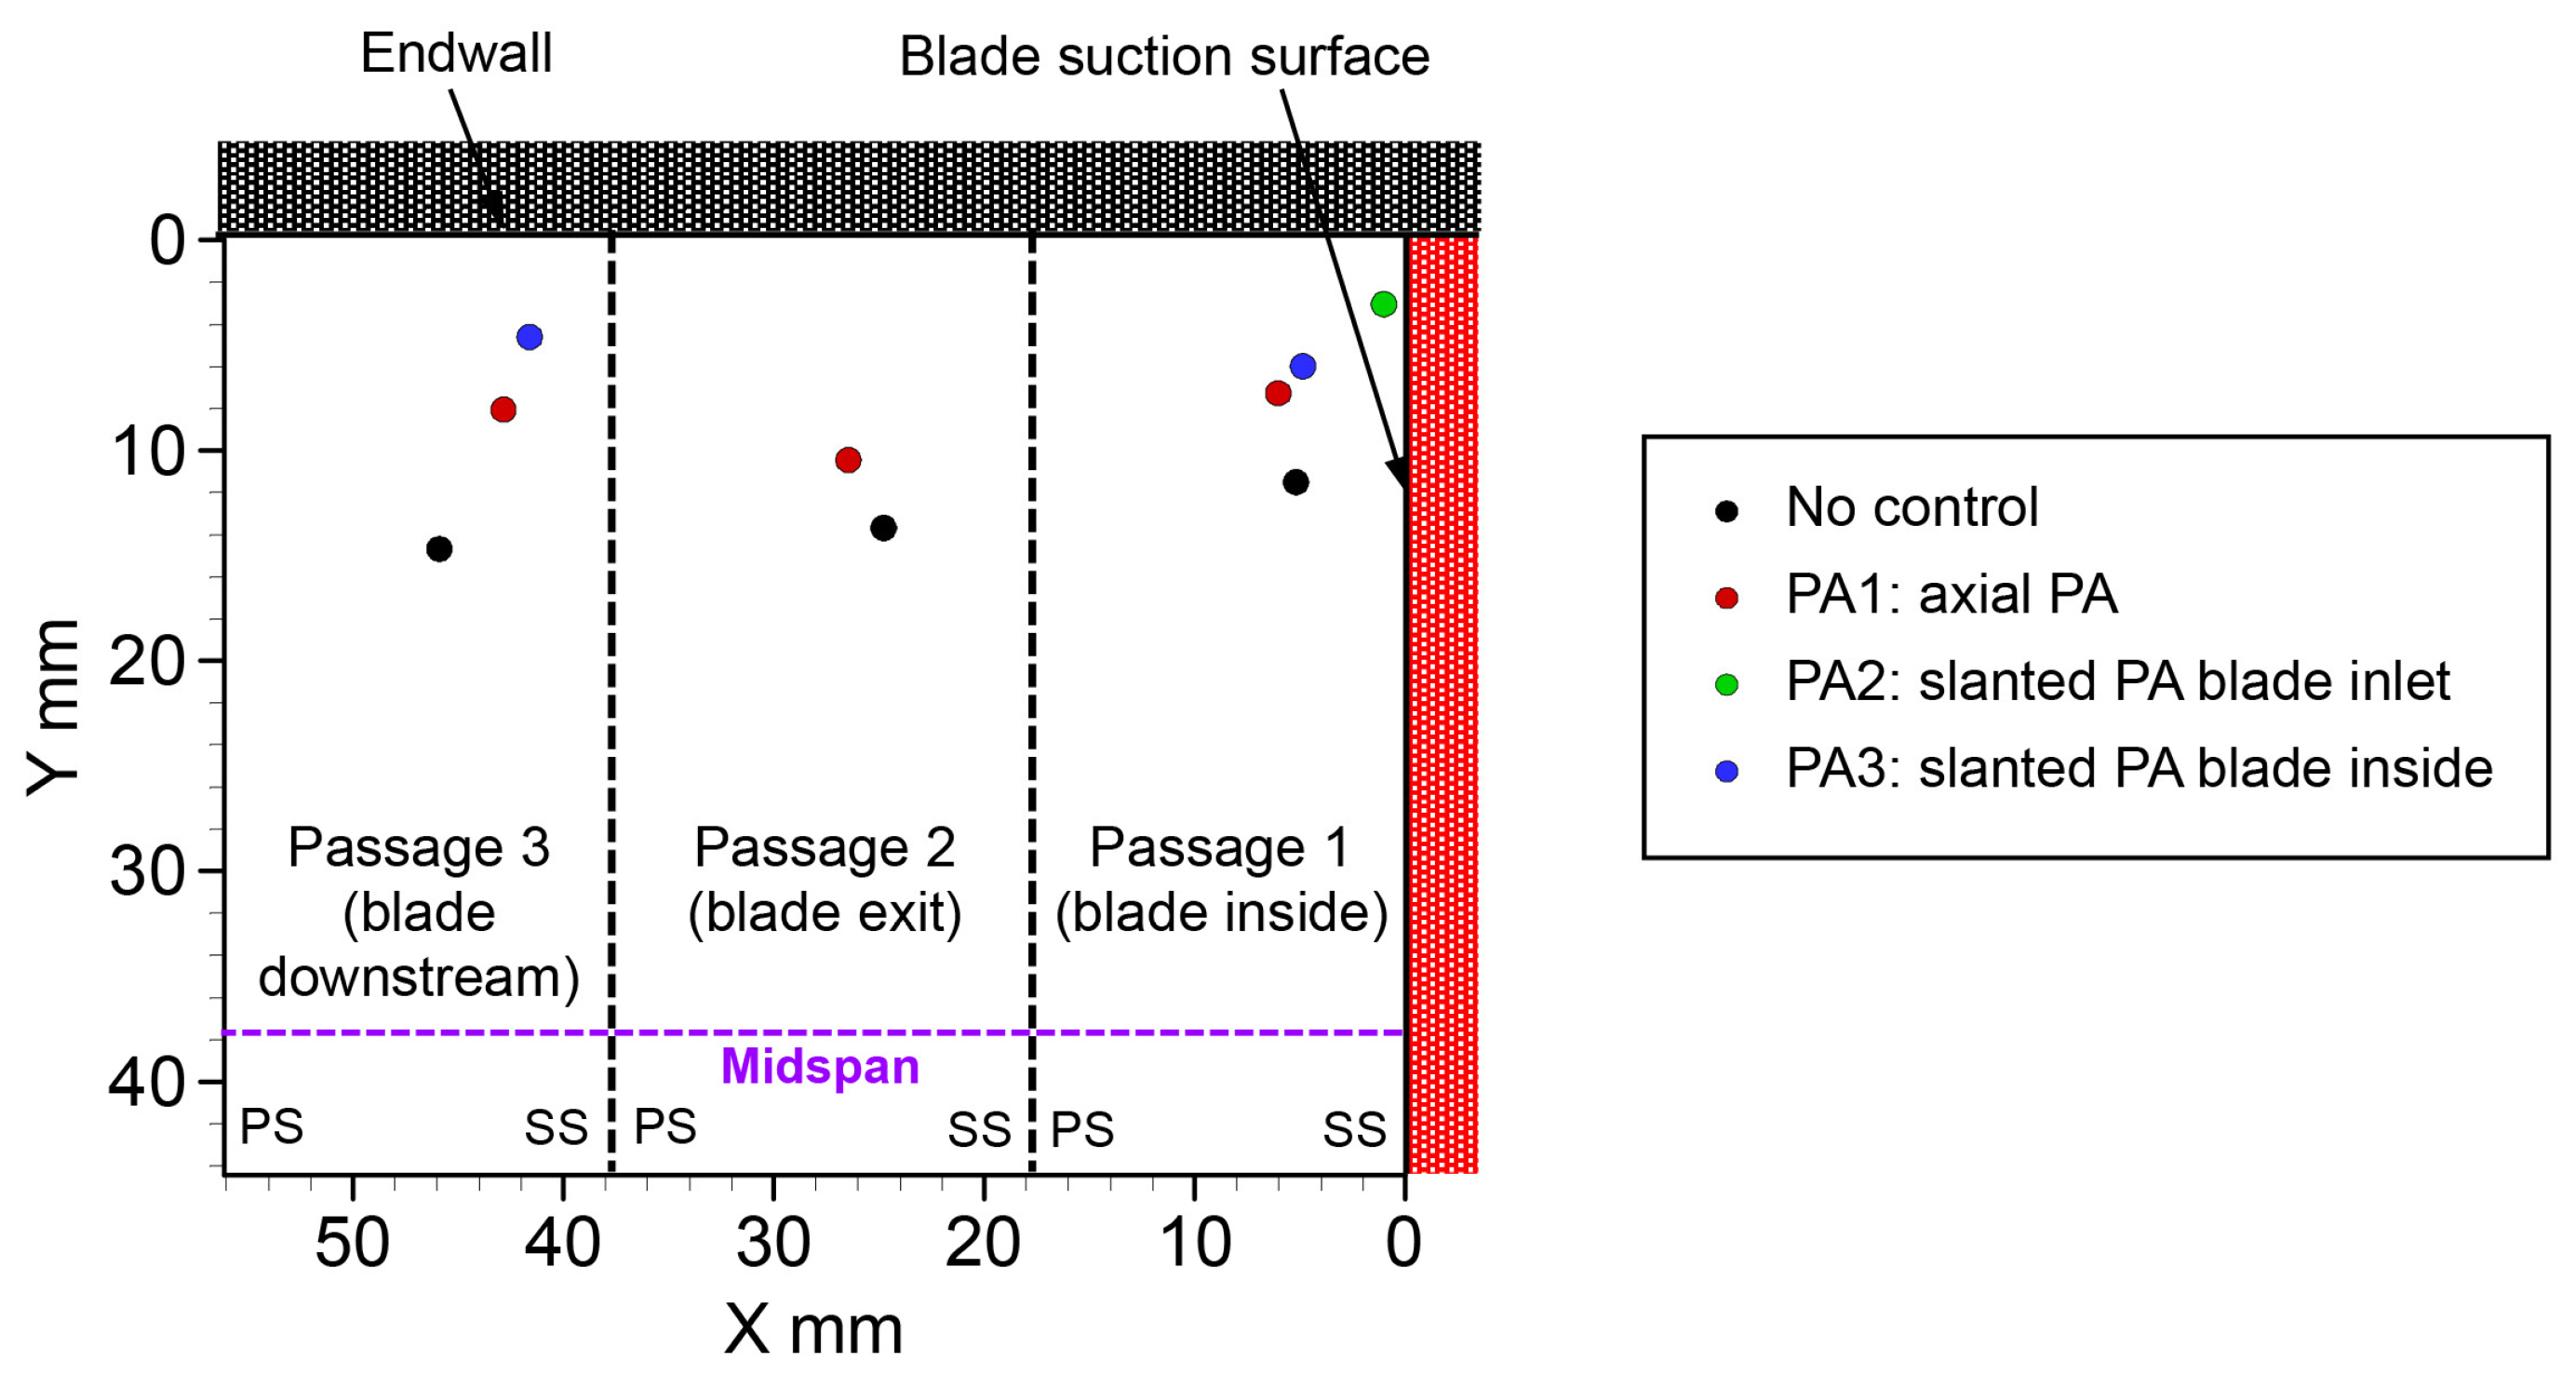
Figure 18 shows the center position of the PV from the streamlines in Figure 17. In the no-control case (solid black circles), the vortex center was in the range of Y = 14–17 mm in passages 1, 2, and 3. In the case of PA1 (solid red circles), the vortex center moved to the upper endwall side compared to the no-control case, and the tendency became more pronounced as it moved downstream. In PA2 and PA3 (solid green and blue circles, respectively), the vortex center moved further to the upper endwall side than in PA1.

3.1.6. Turbulence Intensity Distribution

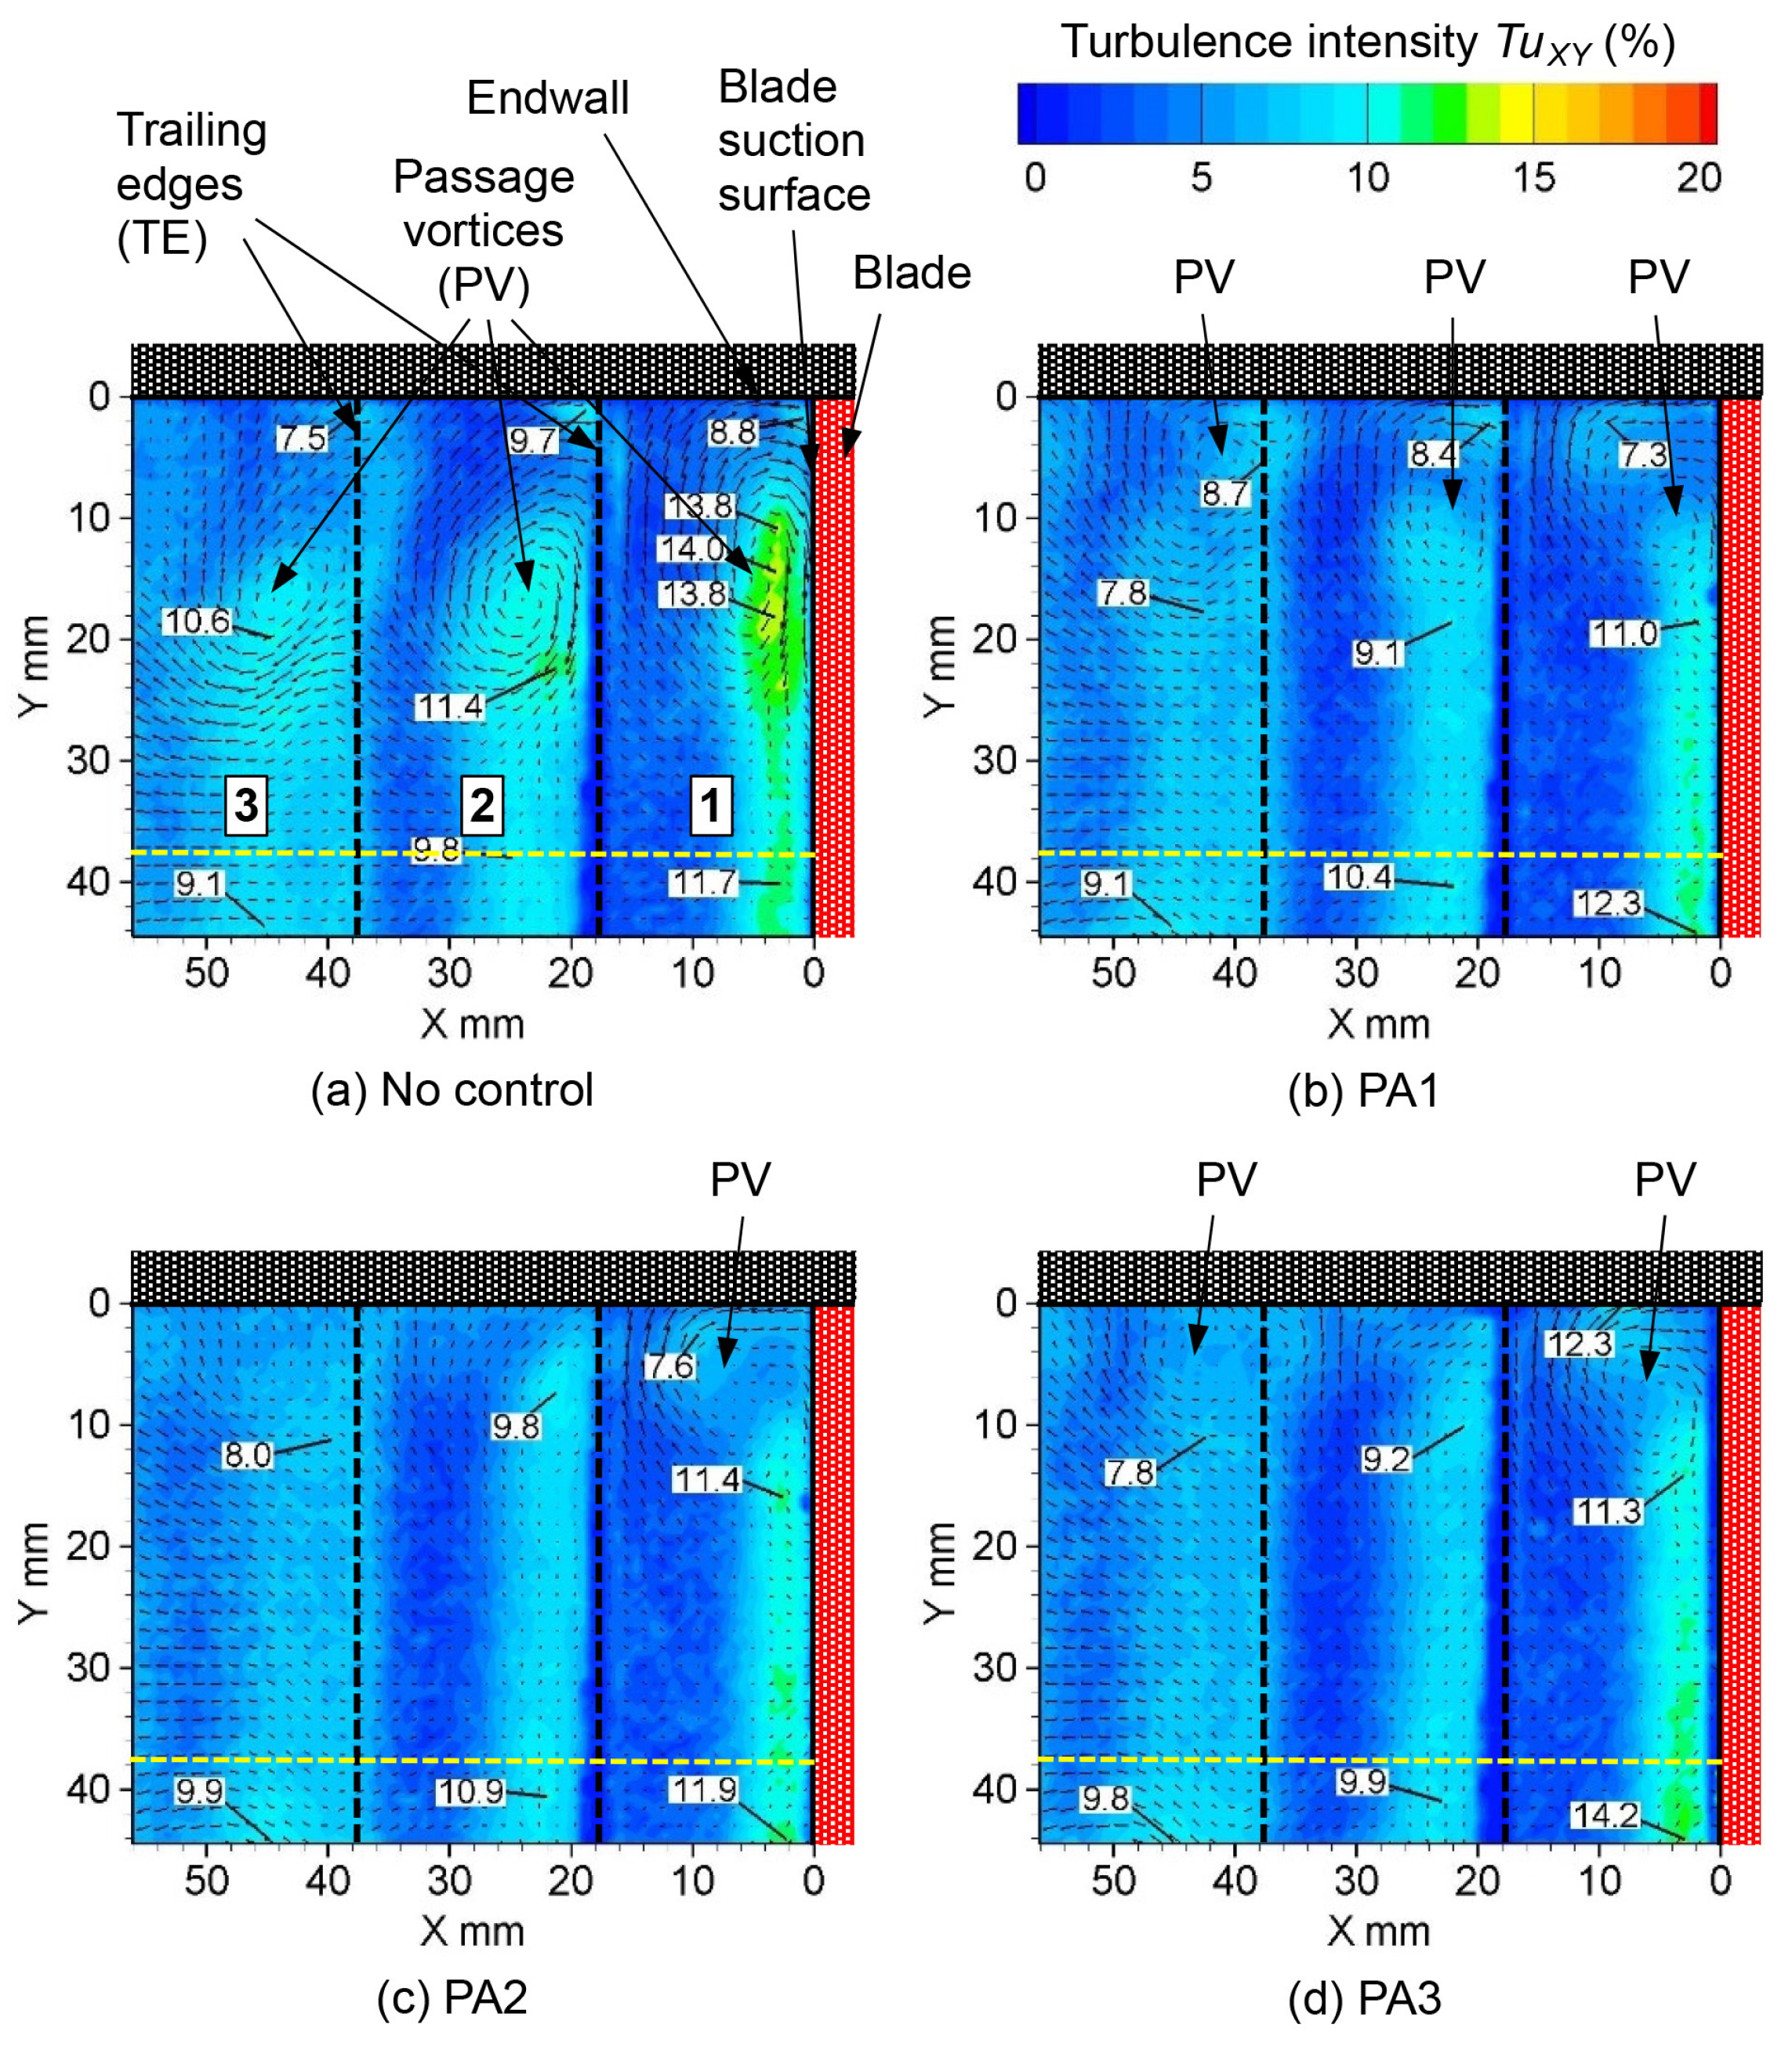
Figure 19 presents the turbulence intensity distributions for the control, PA1, PA2, and PA3 at an input voltage of 15 kVp-p. Figure 19a illustrates the turbulence intensity distribution in the absence of control measures. Within passage 1, a high turbulence intensity was observed at three specific locations: (1) where the PV impinged on the SS side of the blade, (2) at the center of the PV, and (3) where the PV deviated from the SS side of the blade. The maximum turbulence intensity was 14.0%. In addition, from the underside of the PV to the midspan side (span-wise position of Y = 30 mm or more), a turbulence intensity of approximately 11% was observed along the SS side of the blade. This indicates that the boundary layer on the SS of the blade was separated. In passage 2, the turbulence intensity reached a maximum value of 11.4% as the PV departed from the SS of the blade. In addition, the flow separation area on the SS of the blade near the midspan exhibited a maximum turbulence intensity of 9.8%. In passage 3, the turbulence intensity was high (10.6%), slightly below the center of the PV (Y = 20 mm).
Figure 19b illustrates the turbulence intensity distribution when PA1 was activated at 15 kVp-p. In passage 1, the turbulence intensity was 11.0% when the PV moved away from the SS side of the blade. In addition, a turbulence intensity of 7.3% occurred where the PV hit the upper endwall. Compared to Figure 19a, the turbulence intensity in the region where the PV existed was generally lower for passages 1–3. By contrast, from Y = 20 mm or more to the midspan, a turbulence intensity of approximately 11% occurred along the SS of the blade. This phenomenon arose from the extensive boundary layer separation occurring on the SS of the blade as the PV diminished.
Figure 19c presents the turbulence intensity distribution when PA2 was activated at 15 kVp-p. The PV area was further reduced compared to what is depicted in Figure 19b, resulting in a decrease in the region with elevated turbulence intensity near the upper endwall. In contrast, the high-turbulence-intensity region along the blade’s SS in passage 1 extends to Y = 10 mm or less, owing to the increase in the boundary layer separation.
Figure 19d illustrates the turbulence intensity distribution when PA3 was activated at 15 kVp-p. It exhibits a nearly identical distribution to that shown in Figure 19c for PA2. This similarity arises from the slightly reduced size of the high-turbulence-intensity region along the blade’s SS within passage 1 (approximately Y = 12 mm) compared to that in Figure 19c, resulting in a smaller boundary layer separation region on the SS compared to that in PA2.
Figure 20 presents the span-wise distribution of the pitch-averaged turbulence intensity. The turbulence intensity distributions of PA1, PA2, and PA3 were almost the same at Y = 10 mm or more, and the turbulence intensity was reduced compared to the no-control case. In contrast, at Y = 10 mm or less (inside the purple circle), the turbulence intensity gradually increased in the following order: no control, PA1, PA3, and PA2. This is attributed to the expansion of the boundary layer separation area on the blade’s SS as the PV weakened due to the activation of the PA.

3.1.7. Vorticity Distribution

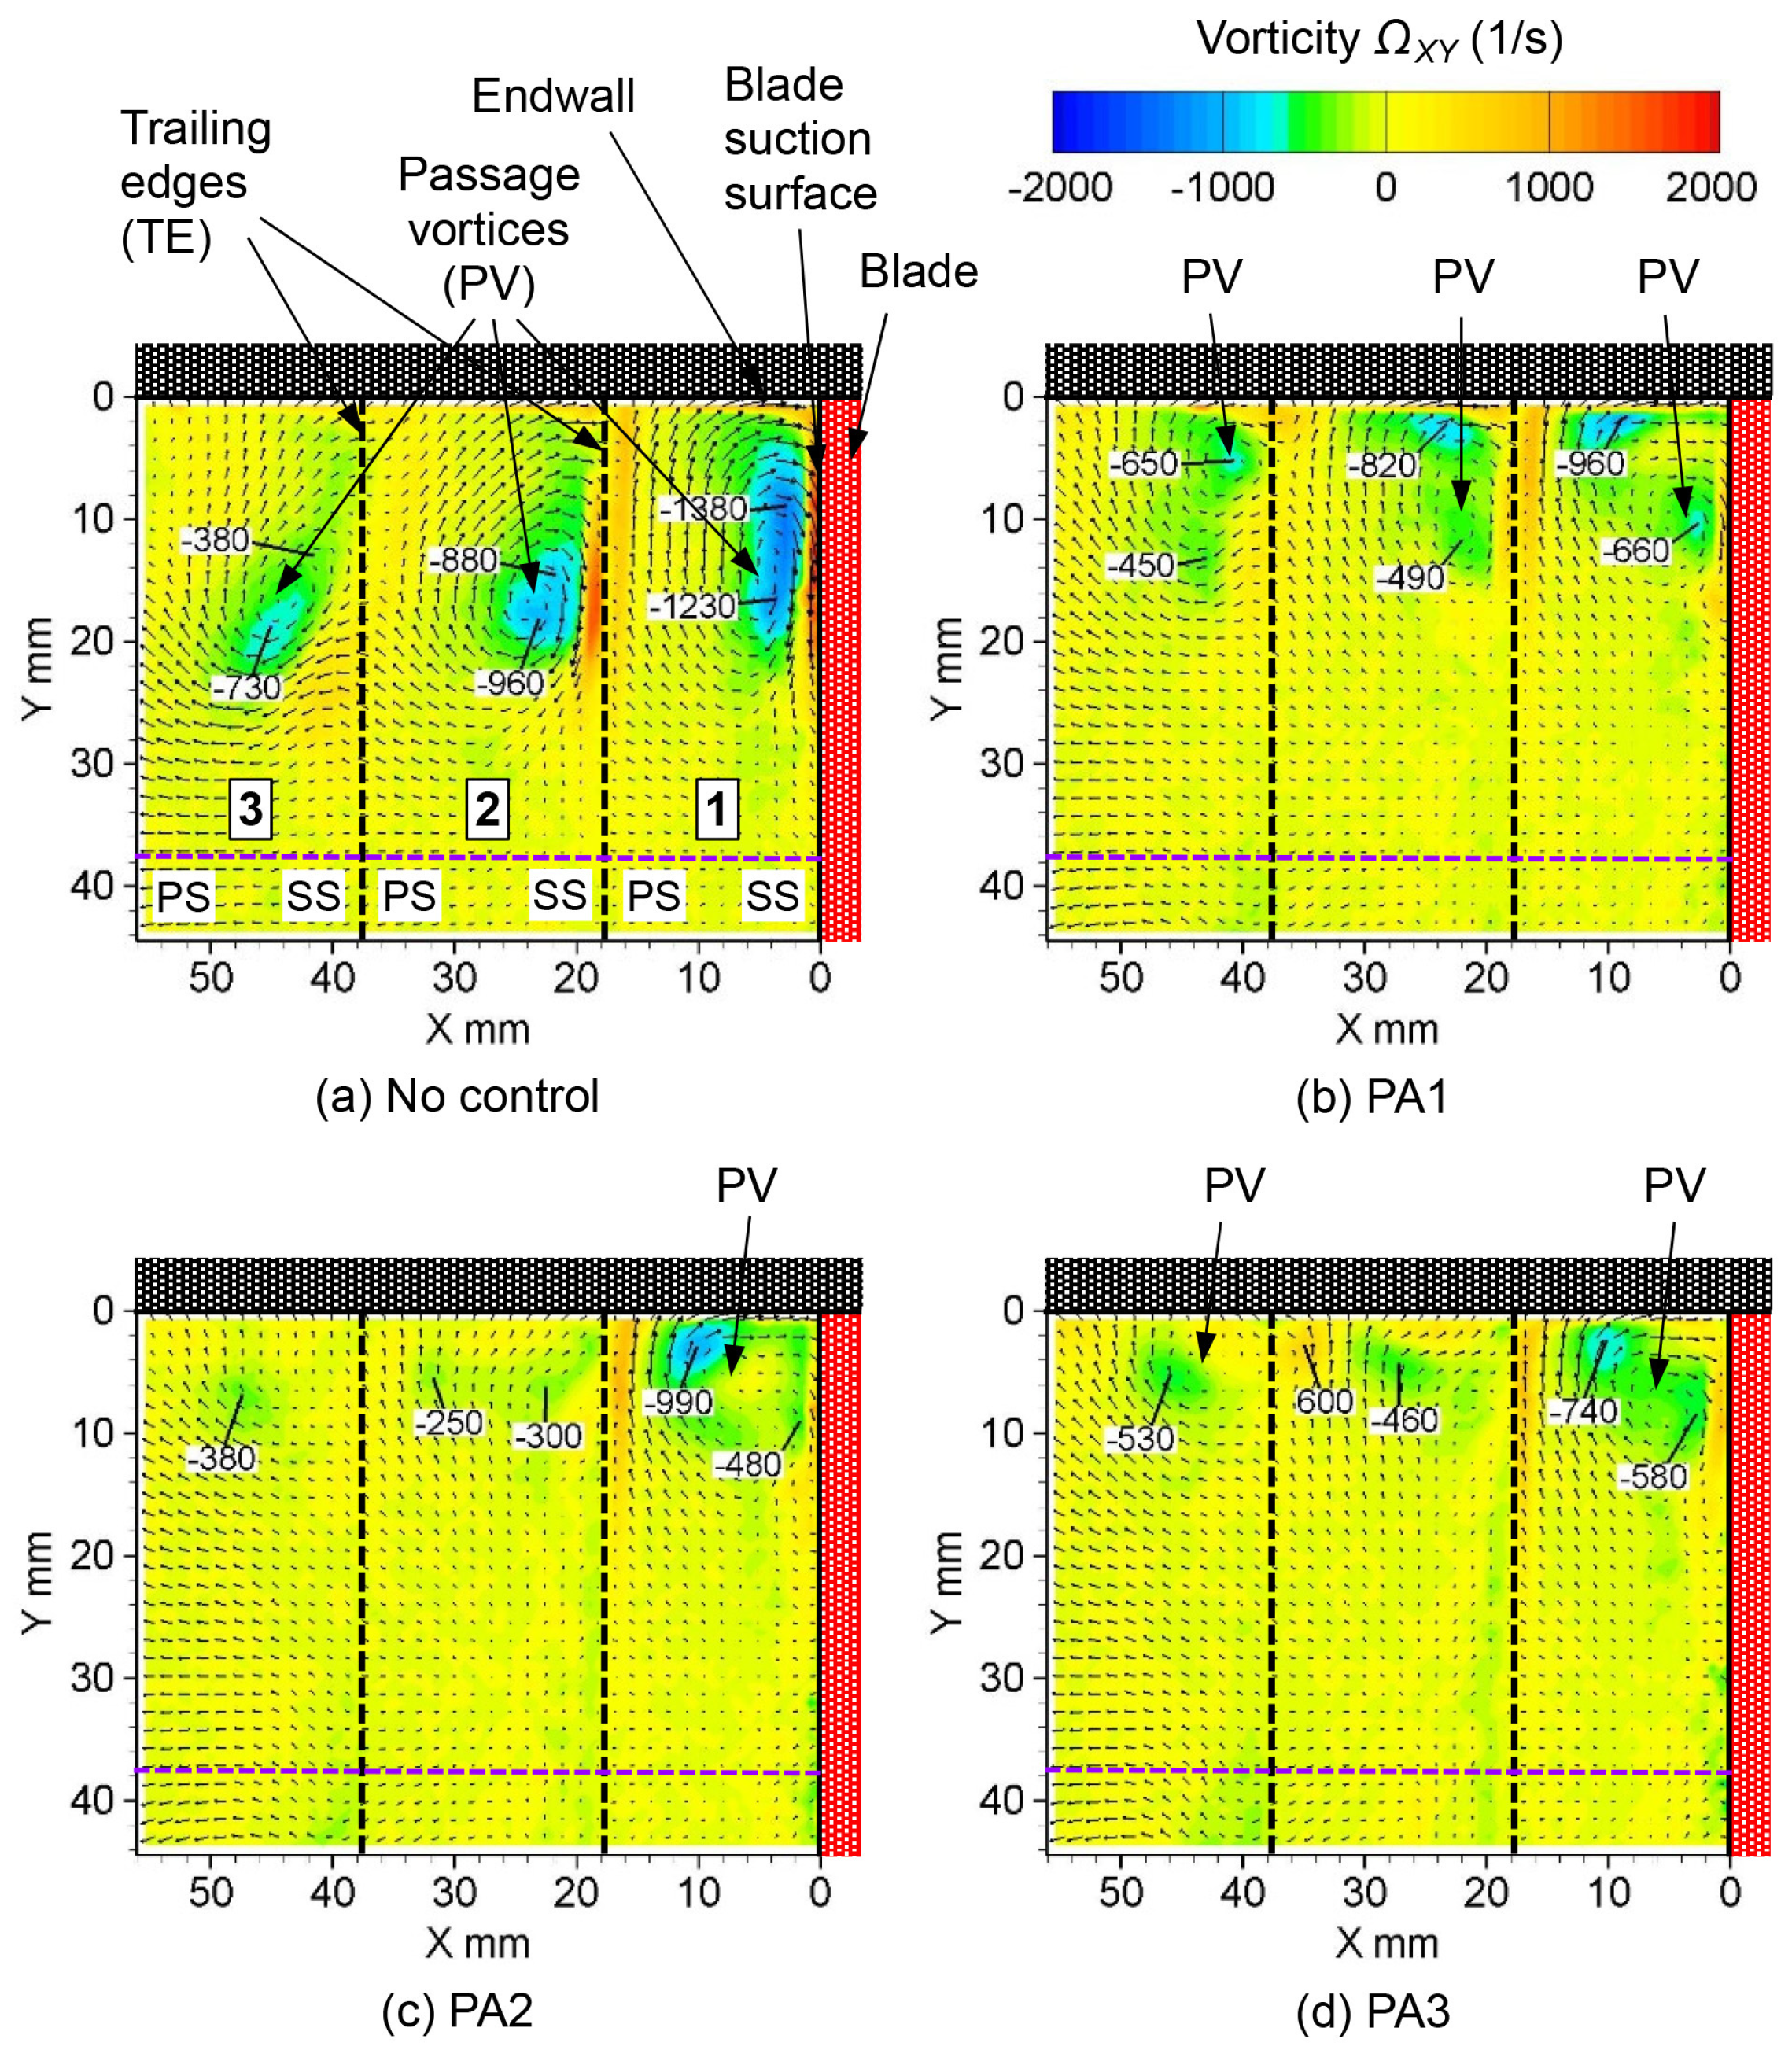
Figure 21 shows the vorticity distributions of the no-control case and PA1, PA2, and PA3 at 15 kVp-p. Positive values indicate counterclockwise vorticity, and negative values indicate clockwise vorticity. Figure 21a shows the vorticity distribution under the no-control condition. In passage 1, the vorticity had a negative peak value at two points: (1) where the PV hit the blade’s SS and (2) where the PV left the blade’s SS. These two negative peak values weakened as they moved downstream to passages 2 and 3. Figure 21b shows the vorticity distribution when PA1 was driven at 15 kVp-p. The PV weakened and moved towards the upper endwall. In passage 1, the point where the PV collided with the upper endwall had a negative peak vorticity value (−960 s−1). Additionally, at the part where the PV moved away from the blade’s SS, the peak vorticity became negative (−660 s−1). These peak values weakened as they moved downstream through passages 2 and 3. Figure 19c shows the vorticity distribution when PA2 was driven at 15 kVp-p. In passage 1, negative vorticity peaks emerged at the location where the PV impinged on the upper endwall and at the point where the PV separated from the SS of the blade. Contrarily, in passages 2 and 3, the PV could not be detected from the velocity vector, and the negative peak vorticity values were as small as −300 and −380 s−1. Figure 21d illustrates the vorticity distribution during the operation of PA3 at 15 kVp-p. In passage 1, two negative vorticity peaks are evident, akin to those observed in PA1 and PA2. In passage 2, apart from a negative vorticity peak, a positive vorticity peak (600 s−1) materialized at the junction of the pressure surface (PS) side and the endwall. The emergence of this positive peak vorticity value is attributed to an additional vortex resulting from the pronounced impact of the boundary layer flow on the PS side, induced by the penetration of the PA between the blades. The negative peak vorticity values in the center passage under no control, PA1, PA2, and PA3 were −960, −820, −300, and −460 s−1, respectively. Hence, the disparity in the PAs exerts a significant influence on the negative peak vorticity value.

3.1.8. Discussion: Comparison with Previous Compressor Blade Studies

As mentioned in the Introduction, three previous studies on compressor blades by Saddoughi et al. [33] and Zhang et al. [34,35] have demonstrated that axial PAs are more efficient than slanted PAs in mitigating the tip leakage vortex and enhancing the stall margin. In contrast, in our experimental results, the effect of the slanted PA was greater than that of the axial PA, and the result was opposite to that of the compressor blades. This disparity can be attributed to two main factors. First, there are substantial differences in the blade shapes between the turbine and the compressor. In compressor blades, the tip leakage flows upstream with respect to the axial direction, whereas, in turbine blades, it flows downstream with respect to the axial direction. Hence, the introduction of a downstream axial flow was found to be efficient in mitigating the leakage flow at the tip of the compressor blades. Second, it is worth noting that the control objectives differ between the tip leakage vortex of the compressor and the passage vortex of the turbine. The passage vortex of a turbine is generated when the inlet boundary layer collides with the leading edge of the blade; the thickness of the inlet boundary layer plays an important role. As the inlet flow of the turbine blade enters from a slanted direction with respect to the axial direction, it is considered more effective to induce a flow in a slanted direction along the inflow angle of the boundary layer.

3.2. Influence of Reynolds Number

Here, the flow fields at the lowest and maximum Reynolds numbers in this experiment, Reout = 1.0 × 10⁴ and 9.9 × 10⁴, respectively, are presented and discussed. These results elucidate how variations in the Reynolds number influenced the PV reduction effects of the PAs.

3.2.1. Flow Field at the Lowest Reynolds Number Reout = 1.0 × 10⁴

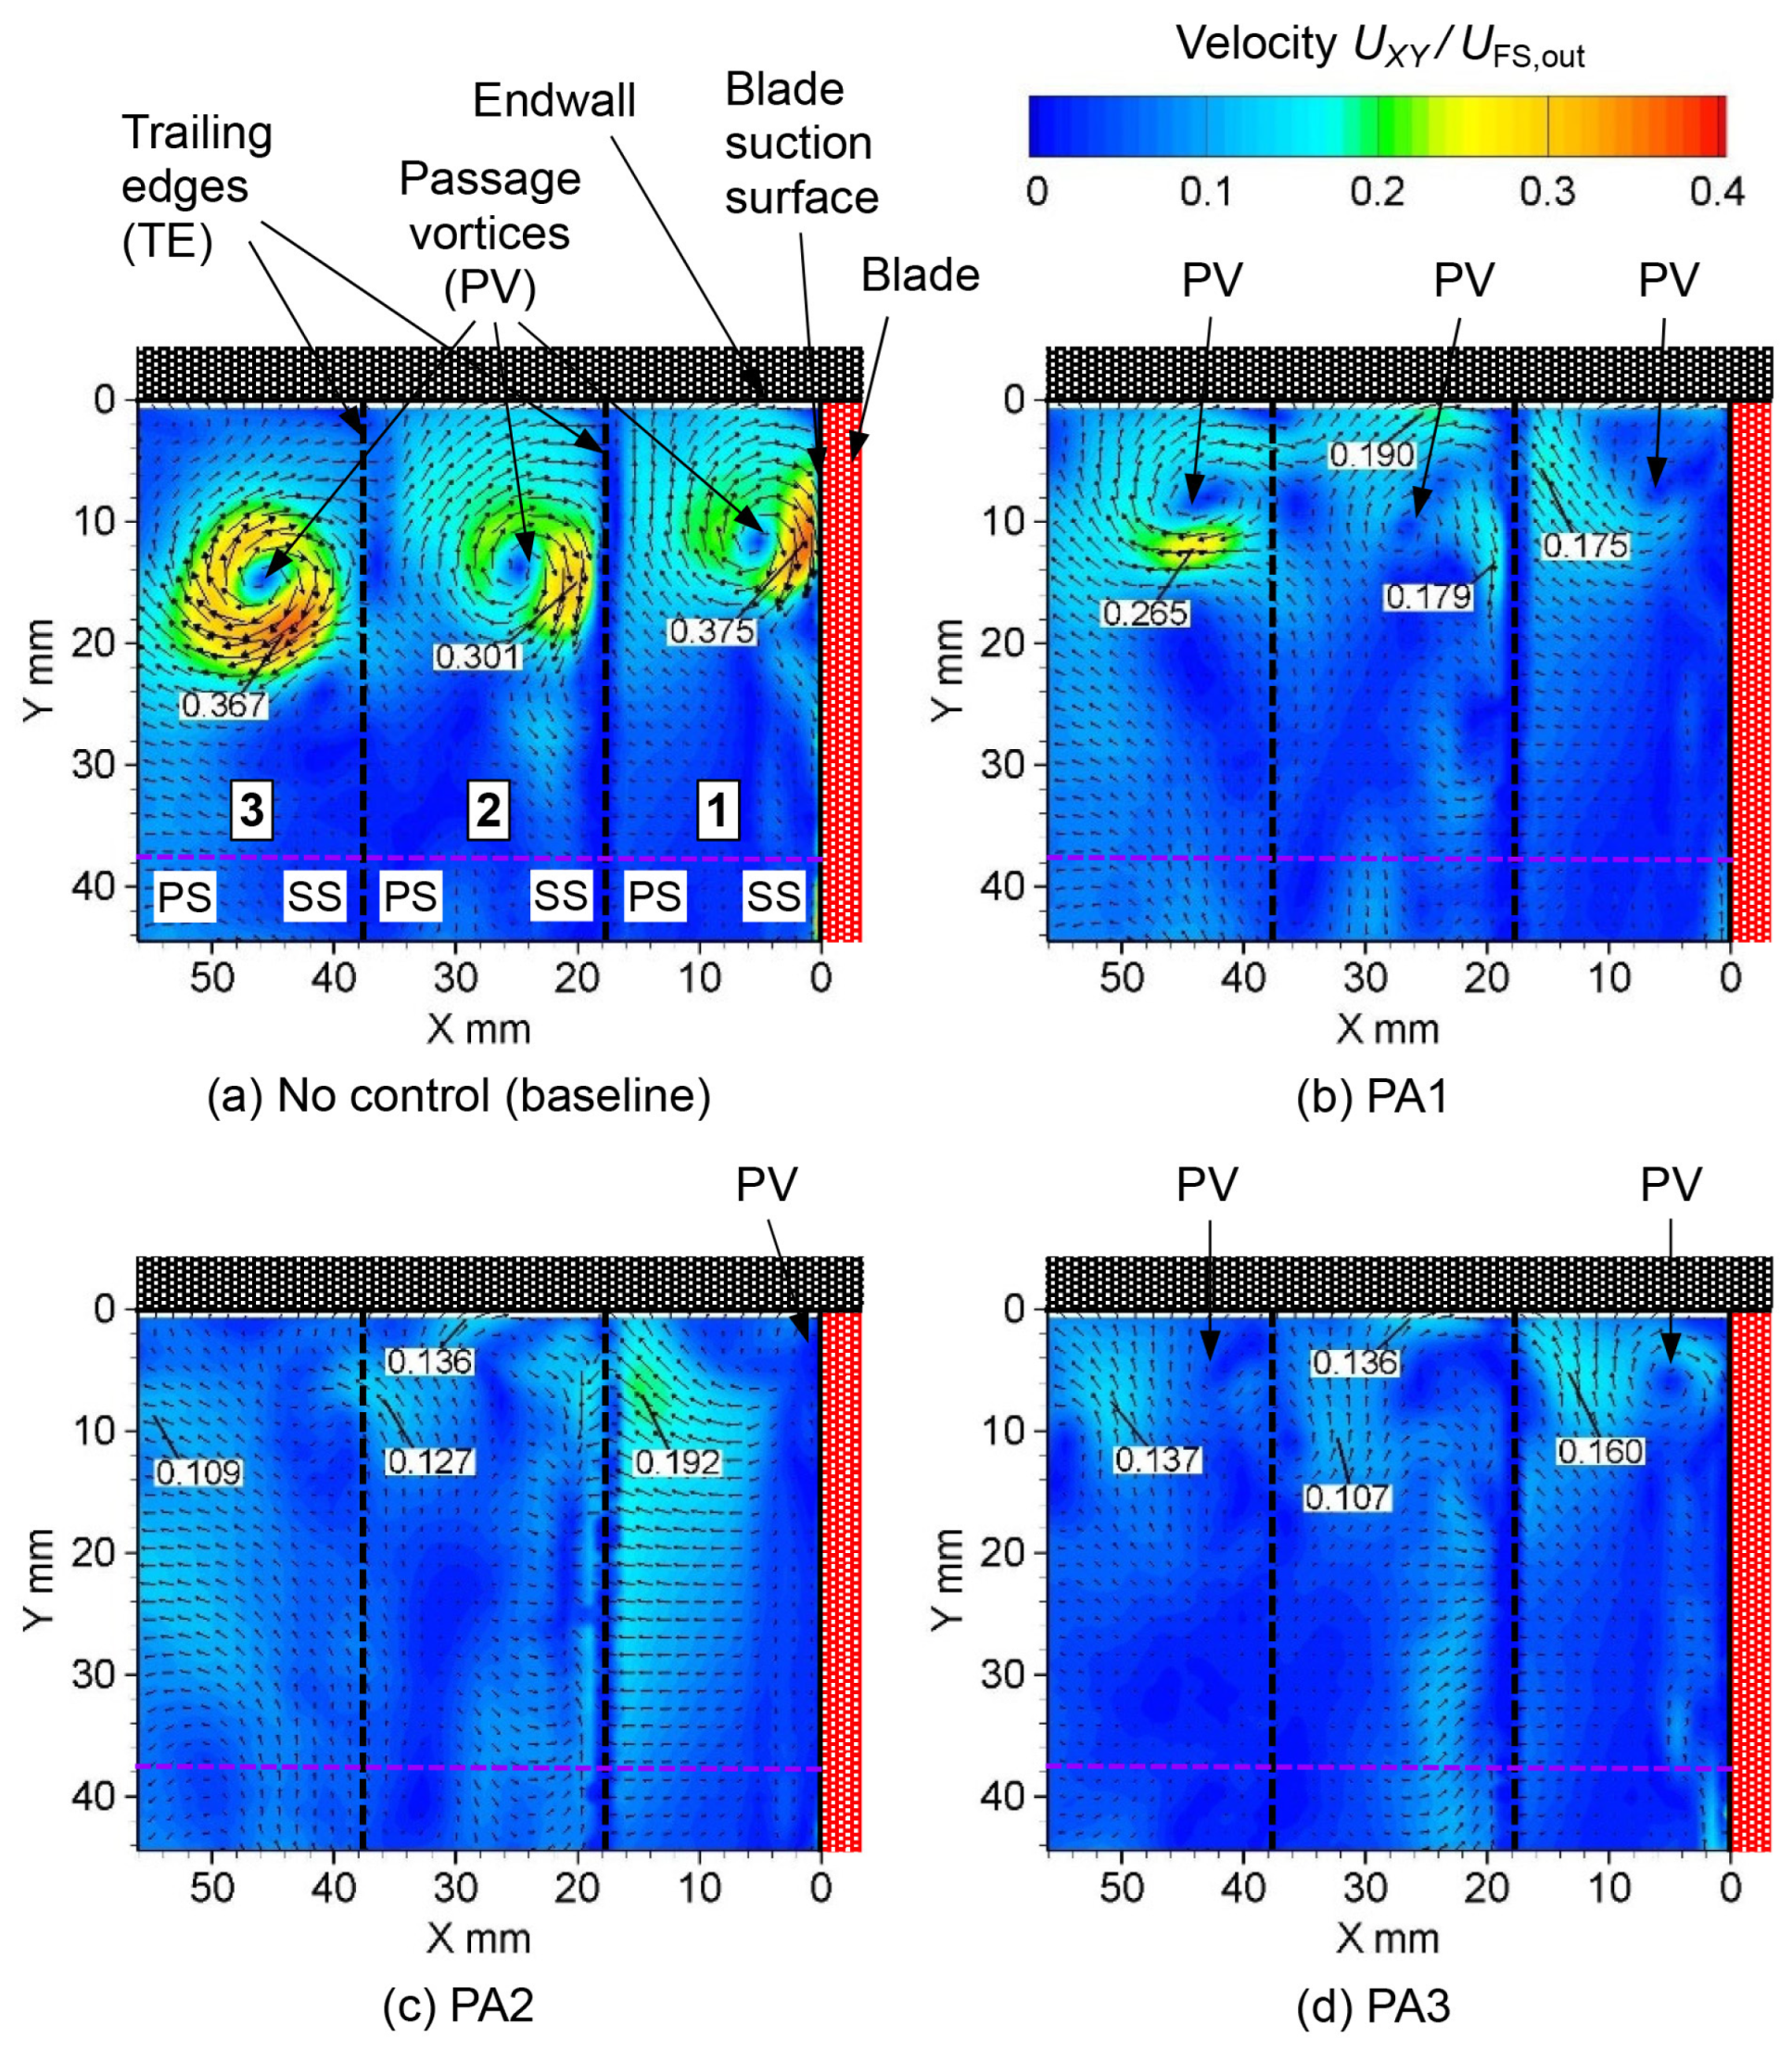
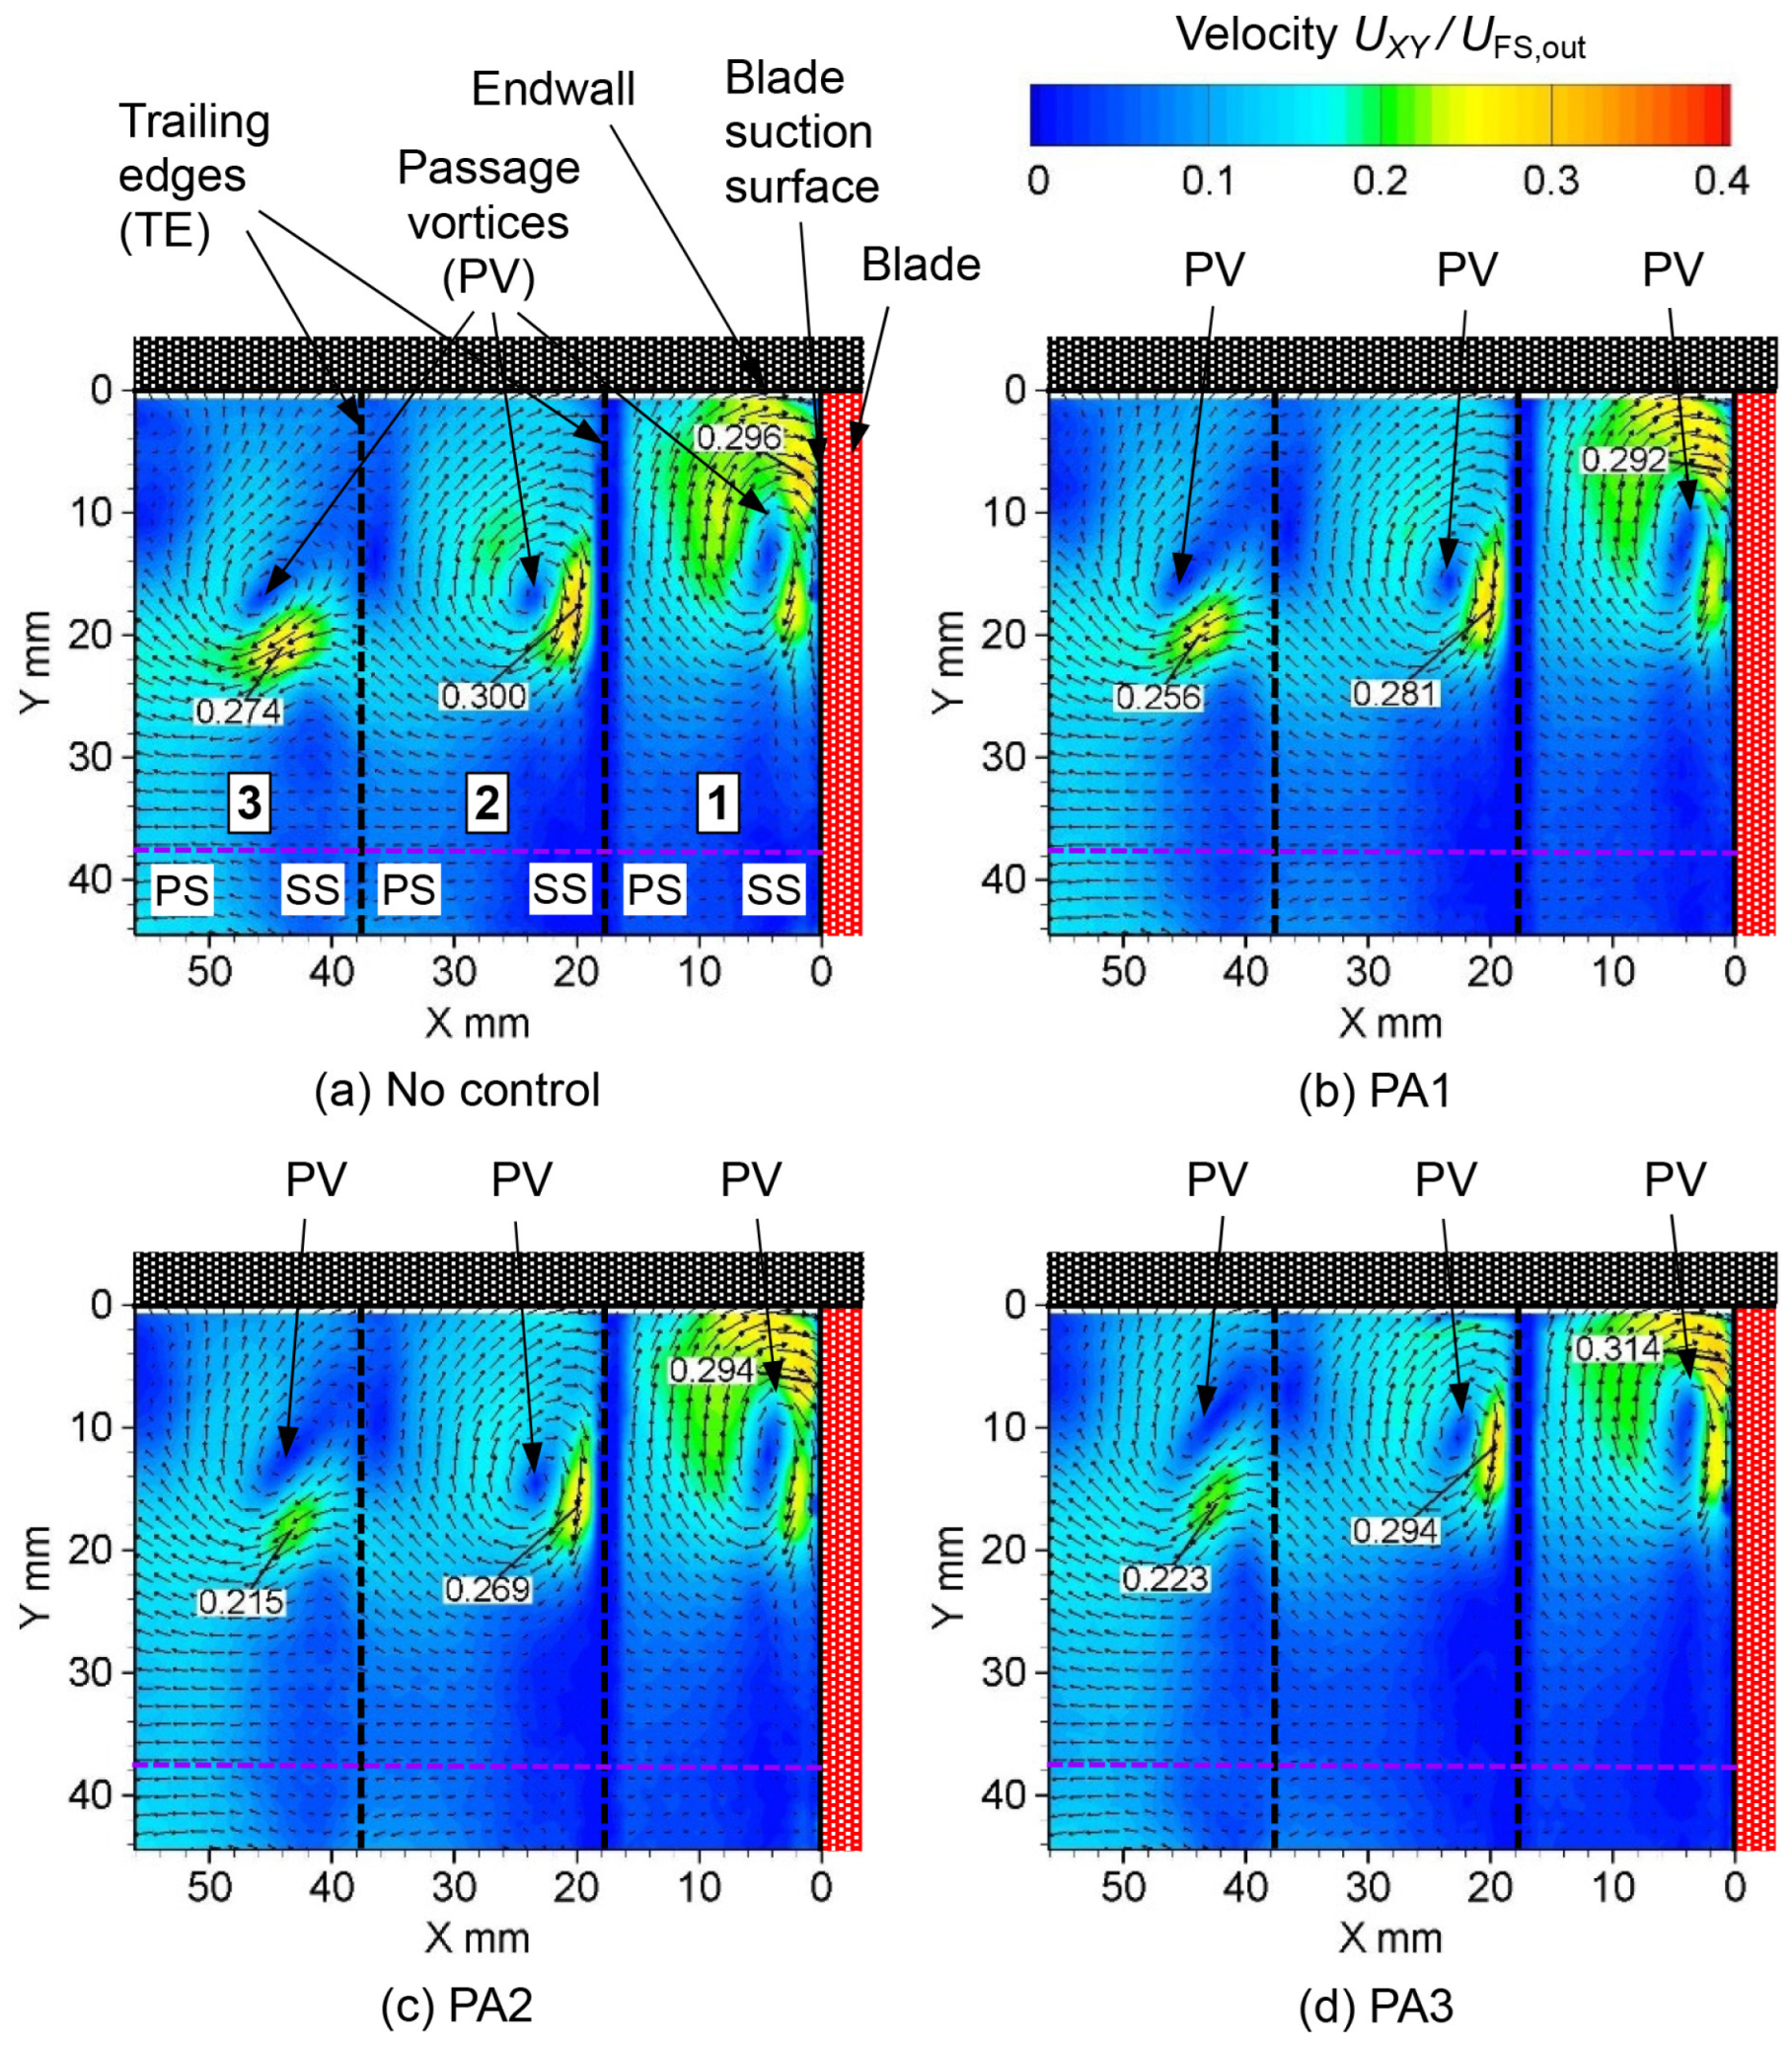
Figure 22 shows the velocity distributions for no control and PA1, PA2, and PA3 at an input voltage of 9 kVp-p. In the no-control case, as shown in Figure 22a, a strong PV is generated. The peak value of the velocity in passage 1 (0.375) was 1.2 times higher than that at Reout = 3.7 × 10⁴ in Figure 8a (0.313). This is because the effect of viscosity increases with a decrease in the Reynolds number. In passage 3, a PV with a peak value identical to that in passage 1 was observed, indicating minimal PV attenuation. In Figure 22b, weakened PVs are observed in each passage in PA1. In Figure 22c, for PA2, the PV further diminishes, decays downstream, and nearly vanishes in passage 3. In Figure 22d, for PA3, the PV progressively weakens as it advances downstream.
Figure 23 shows the streamlines for this case. As shown in Figure 23a, under no-control conditions, a PV larger than that at Reout = 3.7 × 10⁴ (Figure 17) occurs. Moreover, when the PV spirals up from the blade’s SS, it generates a counterclockwise vortex that grows in magnitude as it progresses downstream. At the flow controls by PA1, PA2, and PA3, as shown in Figure 23b–d, respectively, the PV weakens and becomes smaller. At PA2, as shown in Figure 23c, a small PV is observed in passage 1; however, the PV disappears in passages 2 and 3.
Figure 24 shows the center position of the PV for this case. As can be seen, the center position of the PV shifts toward the upper endwall owing to the PA drive.
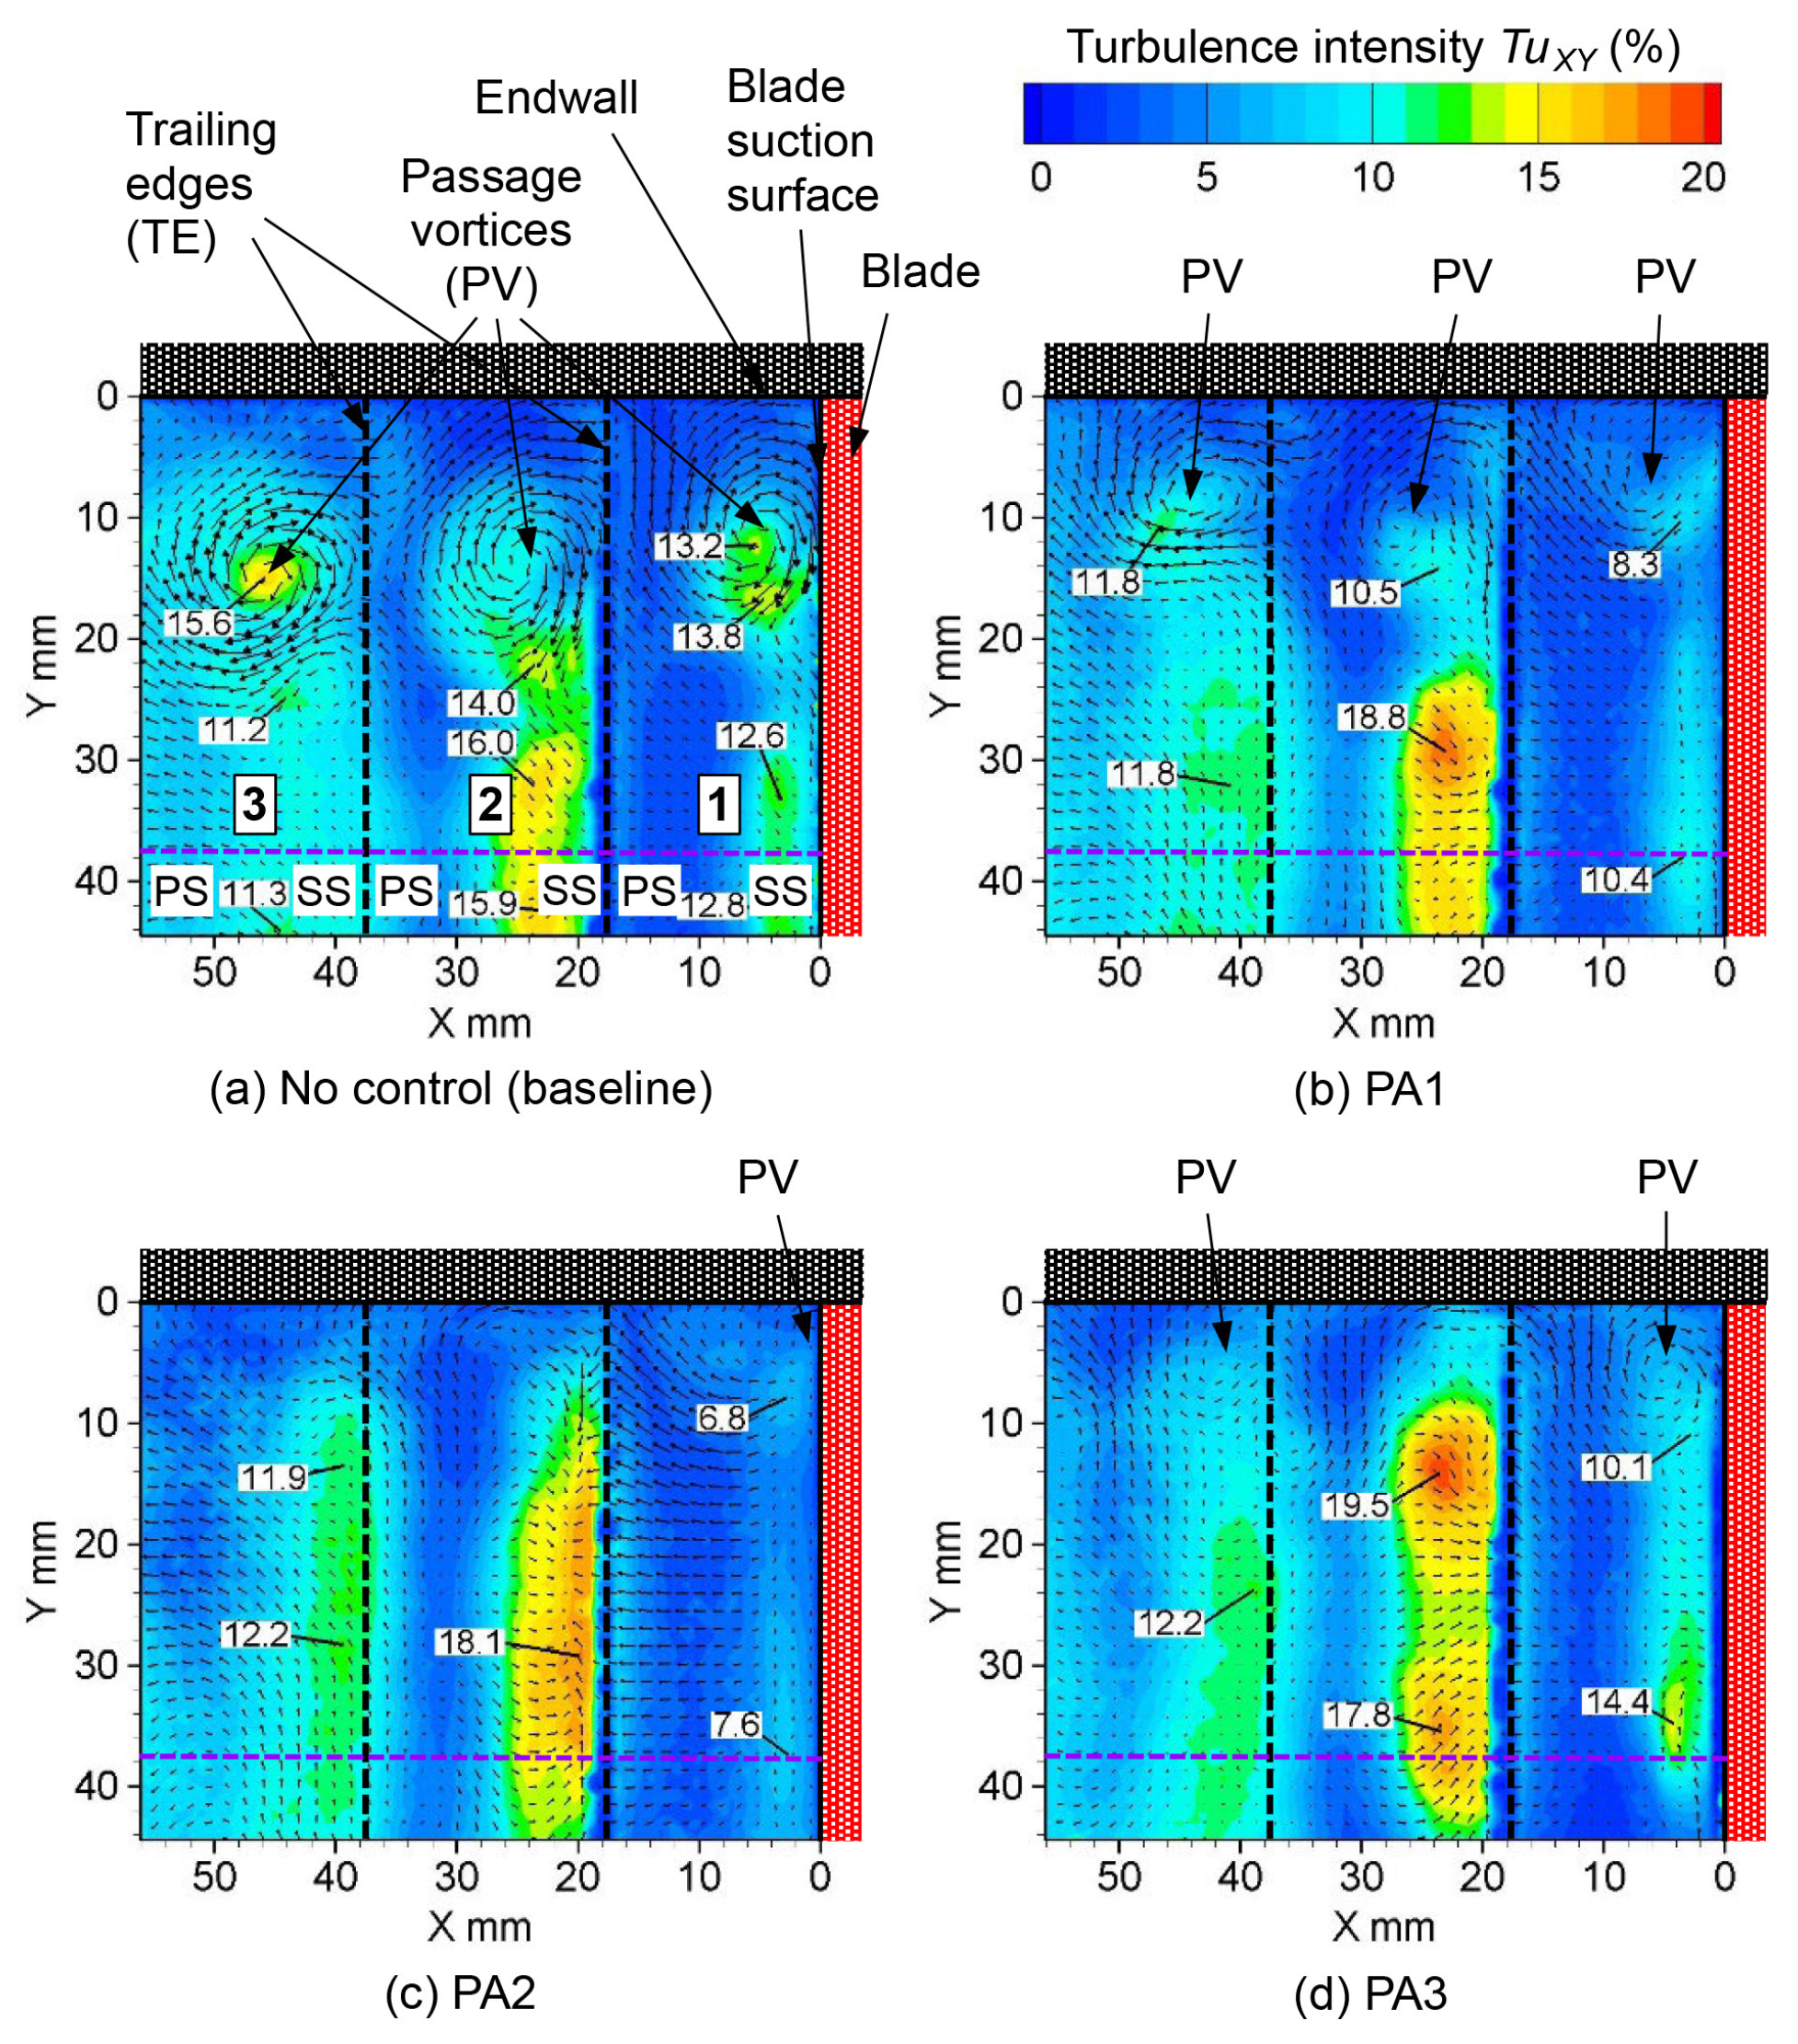
Figure 25 presents the turbulence intensity distribution for this case. Under no control, as shown in Figure 25a, the turbulence intensity exhibits a peak at the center of the PV. In addition, a region with high turbulence intensity exists along the blade’s SS, and the turbulence intensity is as high as approximately 16% immediately after the trailing edge in passage 2. This resulted from the boundary layer separation and significant fluctuations on the SS of the blade. As shown in Figure 25b–d, the high turbulence intensity region on the blade’s SS expands toward the upper endwall, and the peak value of the turbulence intensity is higher than that in Figure 25a and rises to approximately 19%. This is due to the substantial boundary layer separation on the blade’s SS, a consequence of the PA drive weakening the PV, thereby enhancing the flow instability.
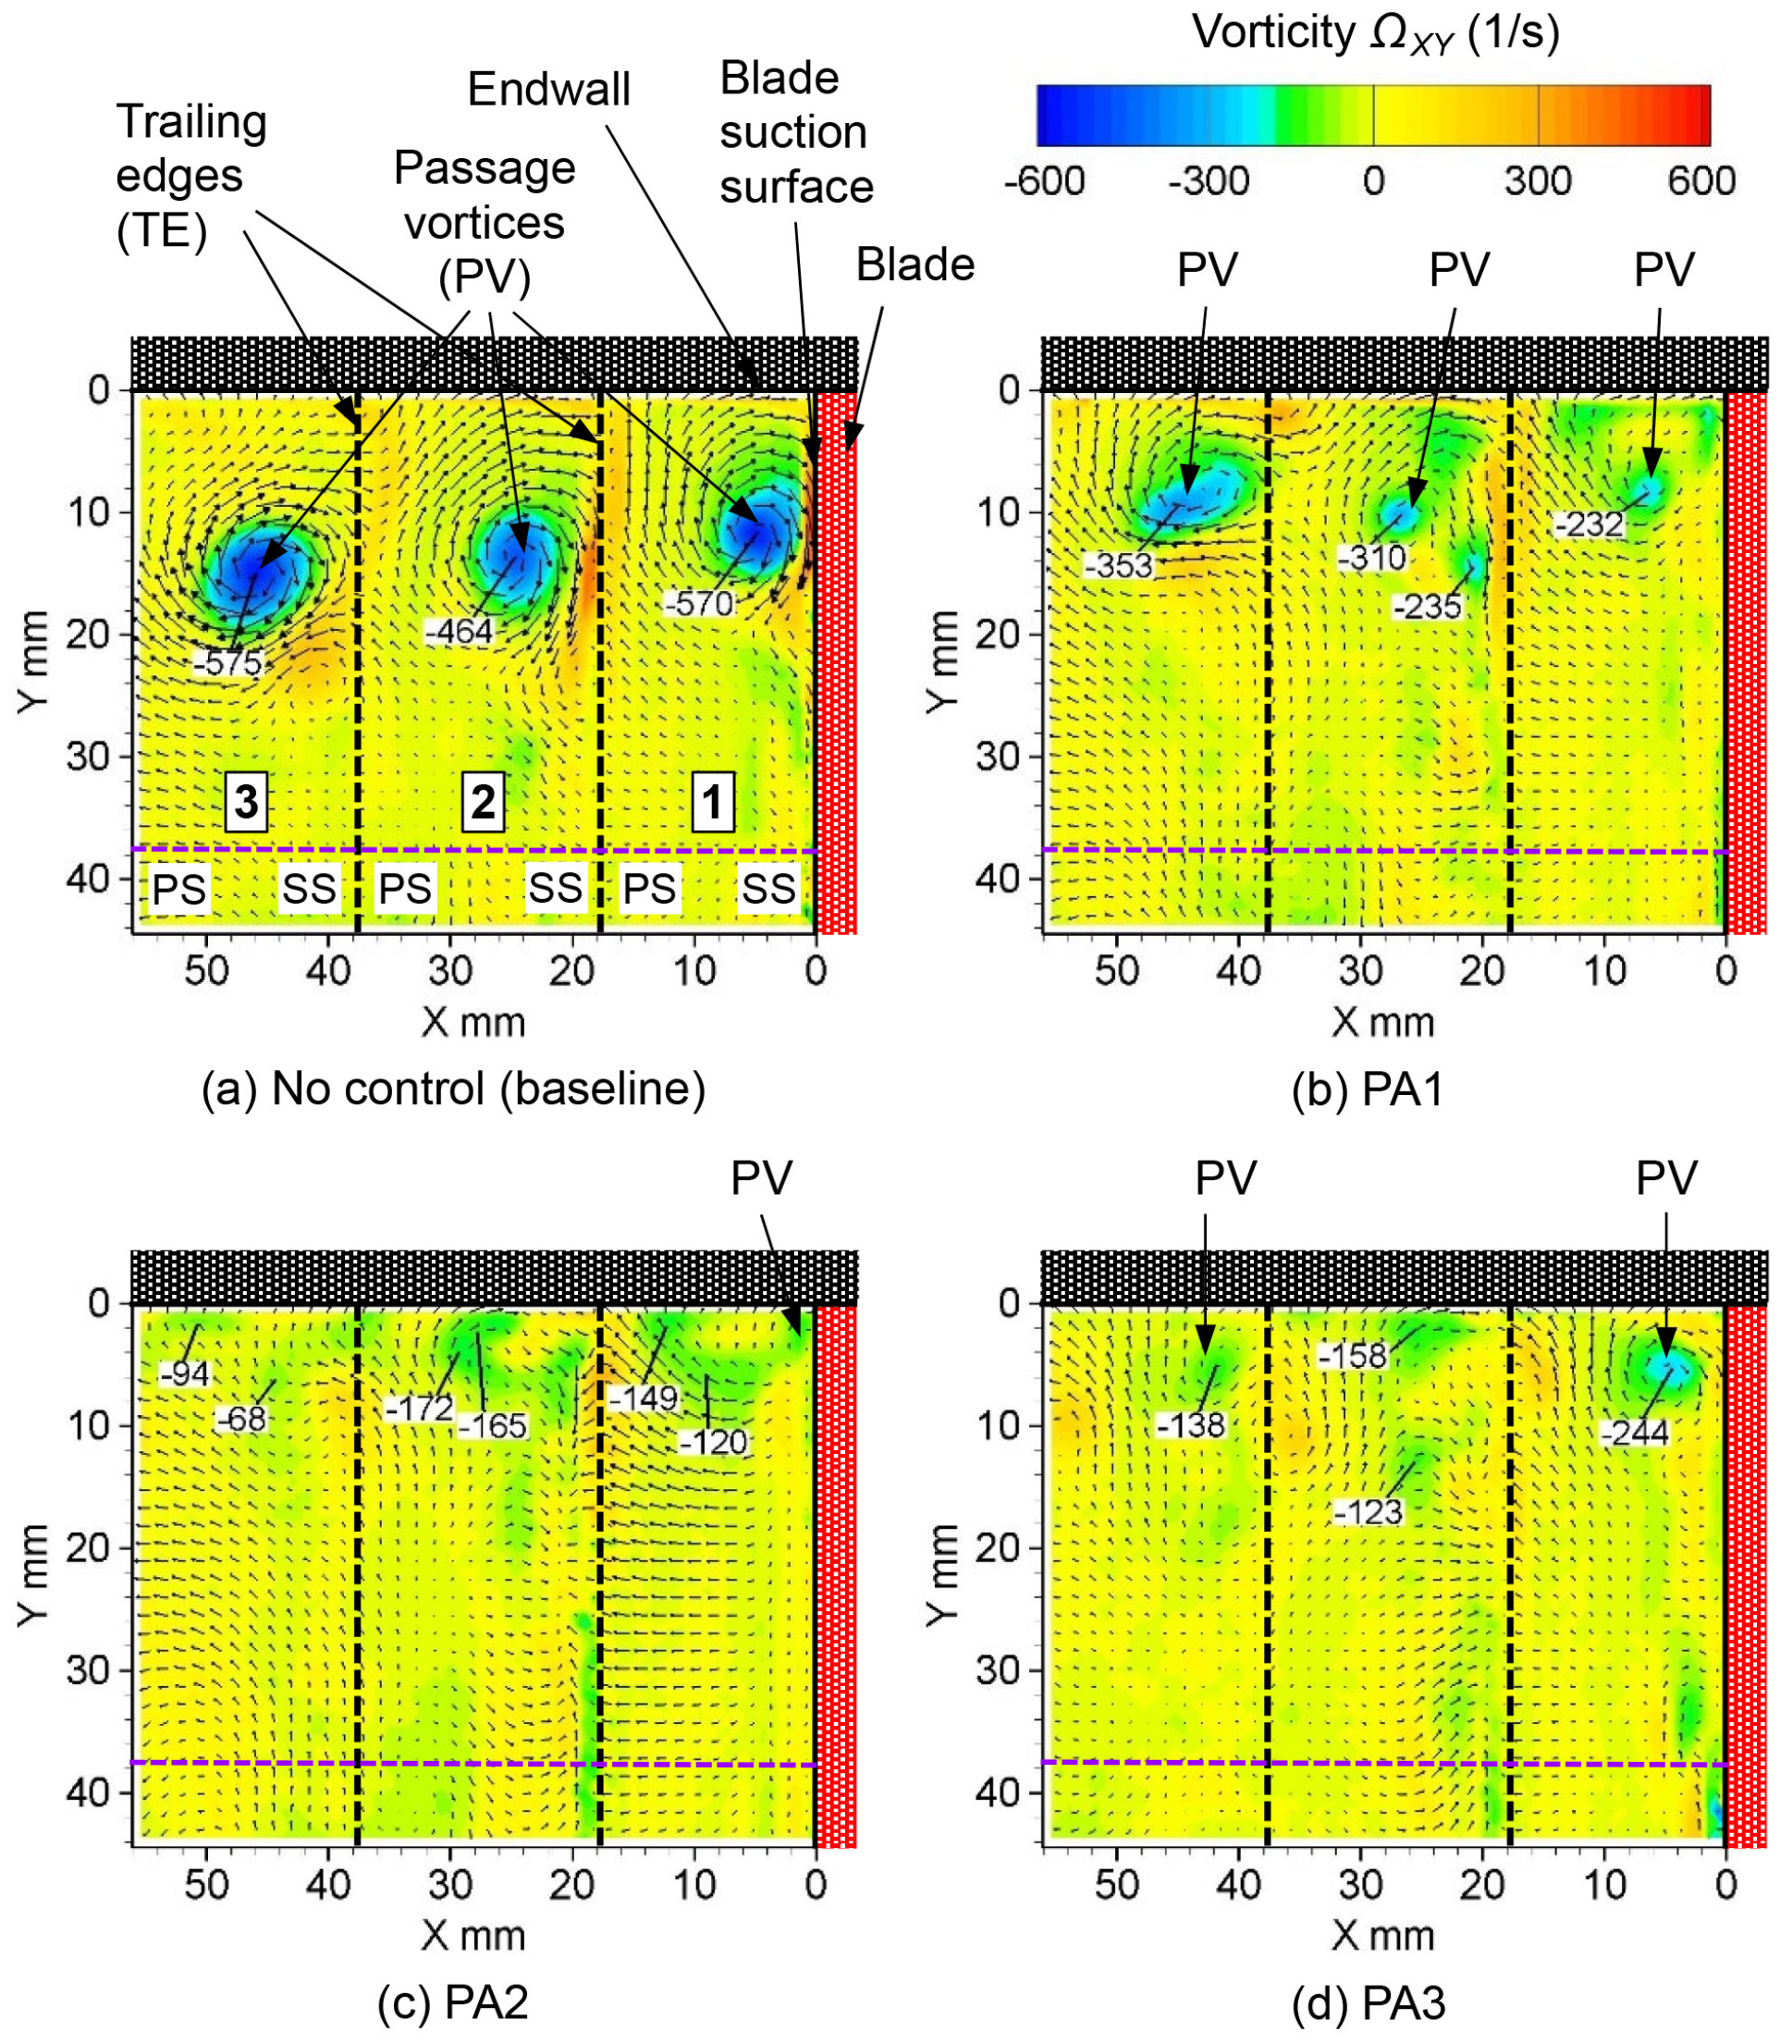
Figure 26 shows the vorticity distributions for Reout = 1.0 × 10⁴. Compared with the negative vorticity peak of −464 s−1 in passage 2 for the no-control case (Figure 26a), the peak values in passage 2 under the flow control of PA1, PA2, and PA3 were lower, with values of −310, −172, and −158 s−1, respectively (Figure 26b–d). The peak vorticity of PA2 weakened to approximately one third of that of the no-control case.

3.2.2. Flow Field at the Highest Reynolds Number Reout = 9.9 × 10⁴

Figure 27 shows the velocity distributions for this case. Given the elevated Reynolds number and mainstream velocity, the PA drive’s capacity to suppress the PV is diminished. The peak velocity in passage 2 was 0.269 for PA2 (Figure 27c) compared with 0.300 for the no-control condition (Figure 27a), which was approximately 10% lower.
Figure 28 shows the streamlines for Reout = 9.9 × 10⁴. While the PV remains visible, its reduction in size as it progresses downstream is evident.
Figure 29 charts the center position of the PV depicted in Figure 28. Under the influence of the PA drive, the vortex center shifted closer to the upper endwall, with the magnitude of this shift increasing as it progressed downstream. Unlike under other Reynolds numbers, the position of the PV center at PA3 moved mostly to the upper endwall side.
Figure 30 presents the turbulence intensity distribution for this case. Within the PV, the turbulence intensity exhibited a peak at its center. Unlike other Reynolds number conditions, the high-turbulence-intensity area on the SS was weakened. This indicates that the impact of viscosity diminished due to the high Reynolds number, leading to a reduction in boundary layer separation.
Figure 31 shows the vorticity distributions for Reout = 9.9 × 10⁴. In the no-control case in Figure 31a, the peak value of the PV center in passage 2 was −4310 s−1. In the flow-controlled instances, the PA2 layout (Figure 31c) was the most effective, and the peak vorticity decreased by approximately 20% to −3440 s−1.

3.2.3. Change in Peak Vorticity

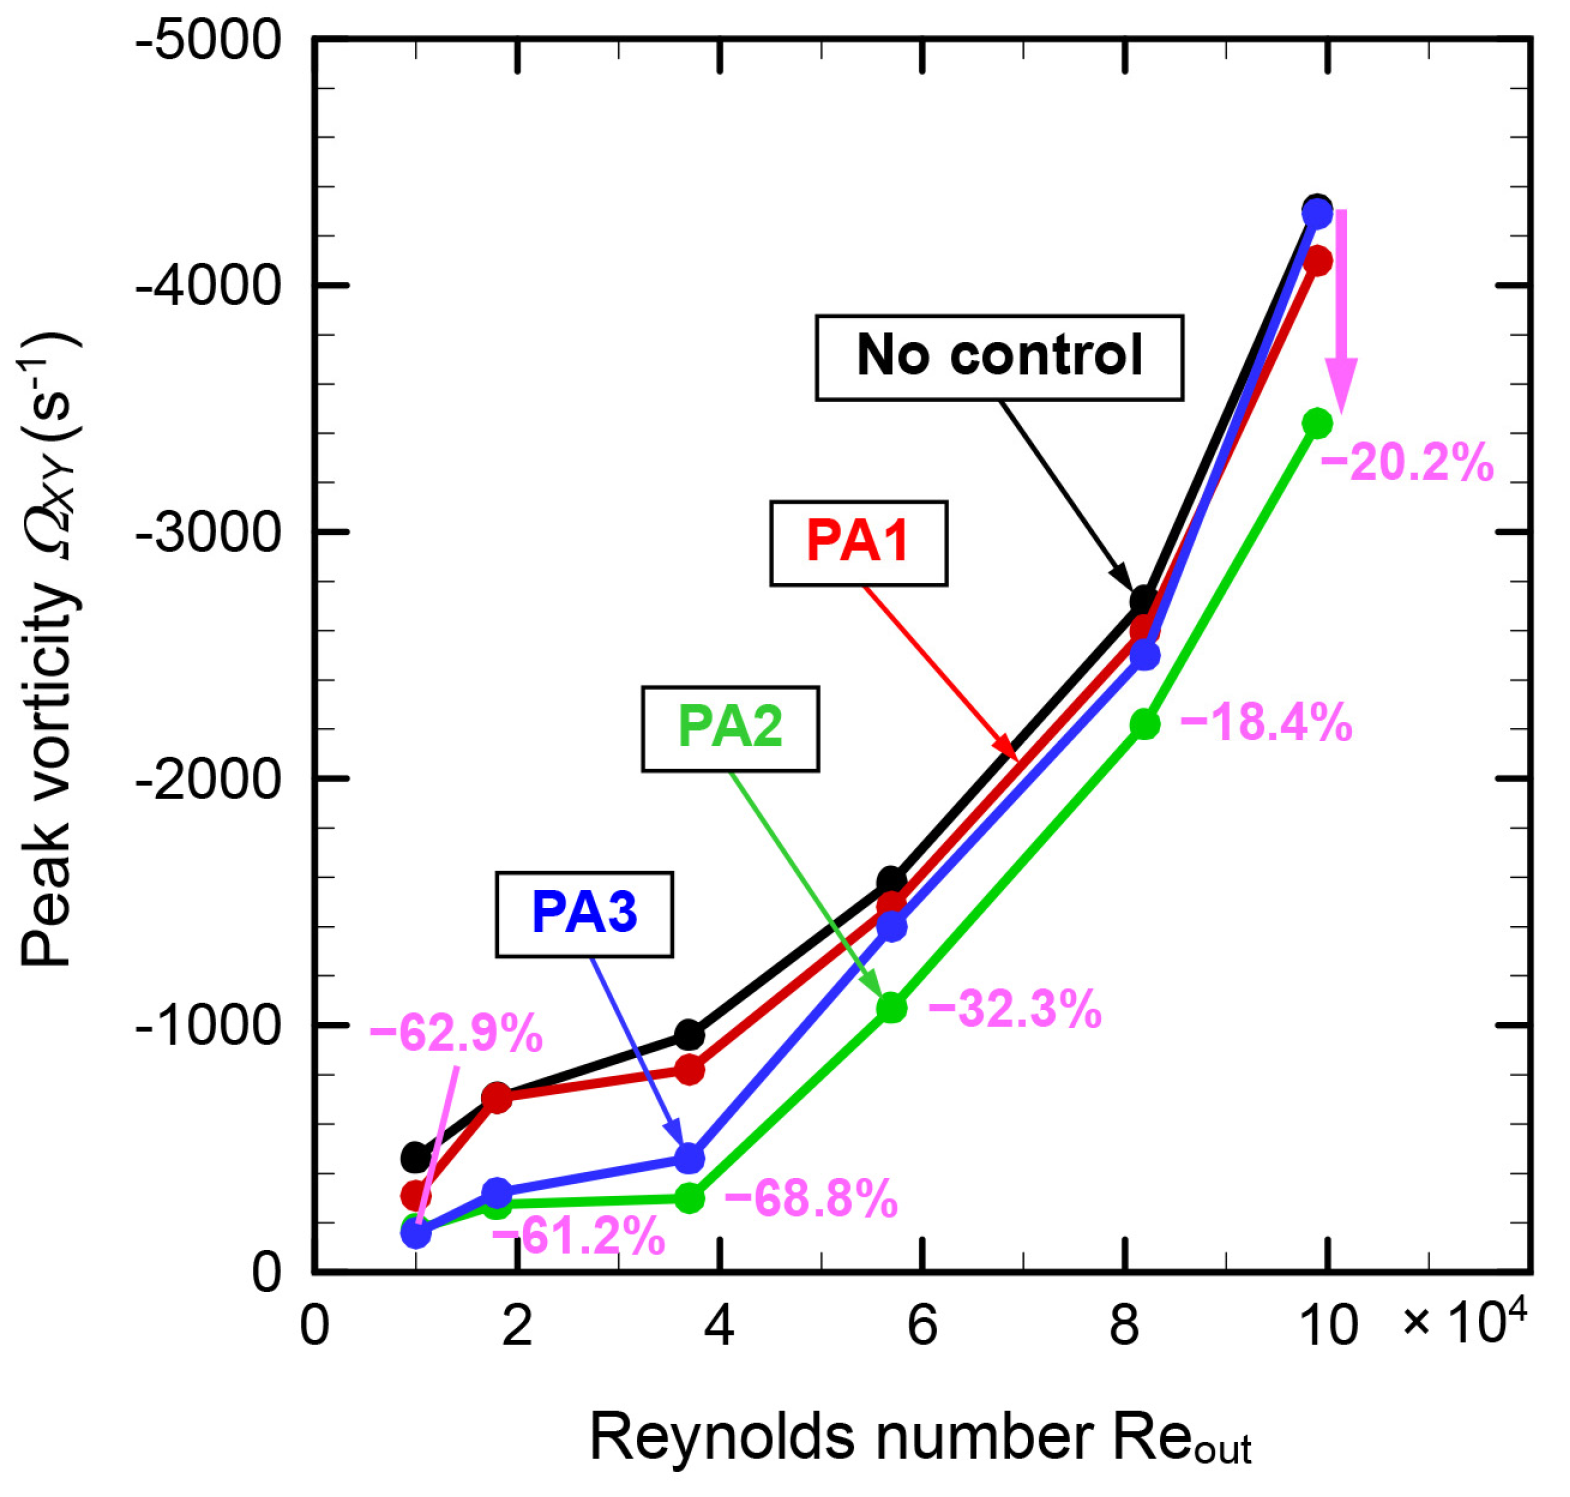
The peak vorticity observation was straightforward, as it exhibited notable changes in response to the PV suppression by the PA drive. Figure 32 shows how the vorticity peak value in the center passage (passage 2) changes according to the PA drive for each Reynolds number. The input voltage of the PA drive was 9 kVp-p for Reout = 1.0 × 10⁴, 10 kVp-p for Reout = 1.8 × 10⁴, and 15 kVp-p for Reout = 3.7 × 10⁴ or more. The peak vorticity was most effectively reduced for PA2 (green line). When the Reynolds number was low, the rate of decrease in the vorticity peak value owing to the PA drive was large. The decrease rates at Re = 1.0 × 10⁴, 1.8 × 10⁴, and 3.7 × 10⁴ were 62.9%, 61.2%, and 68.8%, respectively, and a reduction of more than 60% was observed. At higher Reynolds numbers, this effect is reduced. However, even at a maximum Reynolds number of Reout = 9.9 × 10⁴ (the mainstream velocity at the blade exit was 25.4 m/s), a 20.2% reduction was achieved in the PA2 layout.

4. Conclusions

Through alterations in the DBD-PA layout, this study elucidated distinctions in the suppression impact on the PV within turbine blades. Three PA configurations were employed: (1) an axial PA (PA1), (2) a slanted PA blade inlet (PA2), and (3) a slanted PA blade inside (PA3). The Reynolds number (Reout), calculated based on the blade chord length and the exit mainstream velocity of the LTC, was modified across six different values spanning from 1.0 × 10⁴ to 9.9 × 10⁴.
First, the flow fields in the three PA layouts at Reout = 3.7 × 10⁴, where the effect of PAs was most prominent, were investigated in detail. Then, the influence of the PA layouts on the flow field at the minimum and maximum Reynolds numbers, Reout = 1.0 × 10⁴ and 9.9 × 10⁴, respectively, was examined. The main conclusions of this study can be summarized as follows.
  • In suppressing the PV of the turbine blade, the slanted layouts (PA2 and PA3) tended to be more effective than the axial layout (PA1). This conclusion contradicts the findings of a prior study focused on enhancing the surge margin of compressor blades (suppression of the blade tip leakage vortex), in which the axial layout of the PA was more effective than the slanted layout. This difference is thought to be due to two factors: (1) the blade shape is very different between the turbine and compressor blades, and (2) the control target is different from the PV and blade tip leakage vortex.
  • A comparison between PA2 and PA3 at Reout = 3.7 × 10⁴ shows that PA2 is more effective than PA3 in suppressing the area-averaged velocity of the secondary flow and suppressing the negative peak vorticity value.
  • When PA3 was driven at a high input voltage, additional vortices were generated at the blade exit, corner of the blade PS side, and upper endwall. This is thought to be due to the excessive effect of the PA-induced flow on the boundary layer on the slow-blade PS side because a part of the PA enters the blades in the PA3 layout.
  • The effect of the PA layout differs depending on the Reynolds number. In the low-Re region, the impact of reducing the negative vorticity peak values in the PA2 and PA3 layouts is similar. By contrast, in the high-Re region, the effect of reducing the peak vorticity in the PA2 layout is remarkable.
  • Even at the highest Reynolds number Reout = 9.9 × 10⁴ (mainstream velocity at the blade exit: 25.4 m/s), the peak negative vorticity due to the PV decreases by 20.2%.

Author Contributions

Conceptualization, T.M. and T.S.; methodology, T.M.; software, T.M.; validation, T.M. and T.S.; formal analysis, T.M.; investigation, T.M. and T.S.; data curation, T.M.; writing—original draft preparation, T.M.; writing—review and editing, T.S.; visualization, T.M.; project administration, T.M.; funding acquisition, T.M. All authors have read and agreed to the published version of the manuscript.

Funding

This research was funded by the Japan Society for the Promotion of Science (JSPS), Grant Number 21K03868.

Data Availability Statement

Data will be made available on request.

Conflicts of Interest

The authors declare no conflict of interest regarding the publication of this article.

Nomenclature

Latin symbols
ReReynolds number
TuTurbulence intensity (%)
UVelocity (m/s)
VACPeak-to-peak input voltage (kV)
XHorizontal direction (mm)
YSpan-wise (vertical) direction (mm)
Greek symbols
ΩVorticity (1/s)
Abbreviations
DBDDielectric barrier discharge
PAPlasma actuator
PSPressure surface
PVPassage vortex
SSSuction surface

References

  1. Sieverding, C.H. Recent progress in the understanding of basic aspects of secondary flows in turbine blade passages. ASME J. Eng. Gas Turbines Power 1985, 107, 248–257. [Google Scholar] [CrossRef]
  2. Denton, J.D. The 1993 IGTI Scholar Lecture: Loss mechanisms in turbomachines. ASME J. Turbomach. 1993, 115, 621–656. [Google Scholar] [CrossRef]
  3. Matsunuma, T.; Abe, H.; Tsutsui, Y. Influence of Turbulence Intensity on Annular Turbine Stator Aerodynamics at Low Reynolds Numbers. In Proceedings of the ASME 1999 International Gas Turbine and Aeroengine Congress and Exhibition, Indianapolis, IN, USA, 7–10 June 1999. ASME Paper No. 99-GT-151. [Google Scholar] [CrossRef]
  4. Ananthakrishnan, K.; Govardhan, M. Influence of fillet shapes on secondary flow field in a transonic axial flow turbine stage. Aerosp. Sci. Technol. 2018, 82–83, 425–437. [Google Scholar] [CrossRef]
  5. Chung, J.T.; Simon, T.W.; Buddhavarapu, J. Three-dimensional flow near the blade/endwall junction of a gas turbine: Application of a boundary layer fence. In Proceedings of the ASME Turbo Expo 1991, Orland, FL, USA, 3–6 June 1991. ASME Paper No. 91-GT-045. [Google Scholar] [CrossRef]
  6. Kumar, K.N.; Govardha, M. Secondary Flow Loss Reduction in a Turbine Cascade with a Linearly Varied Height Streamwise Endwall Fence. Int. J. Rotating Mach. 2011, 2011, 352819. [Google Scholar] [CrossRef]
  7. Yuan, H.; Wu, Y.; Zhou, S.; Wang, M.; Lu, X.; Zhang, Y. Nonuniform height endwall fence optimization of a low-pressure turbine cascade. Int. J. Mech. Sci. 2023, 250, 108301. [Google Scholar] [CrossRef]
  8. Miao, X.; Zhang, Q.; Jiang, H.; Qi, H. Application of Riblets on Turbine Blade Endwall Secondary Flow Control. In Proceedings of the ASME Turbo Expo 2014: Turbine Technical Conference and Exposition, Düsseldorf, Germany, 16–20 June 2014. ASME Paper No. GT2014-26823. [Google Scholar] [CrossRef]
  9. Schmid, J.; Schulz, A.; Bauer, H.J. Influence of a non-axisymmetric endwall on the flow field in a turbine passage: High resolution LDV. In Proceedings of the ASME Turbo Expo 2018: Turbomachinery Technical Conference and Exposition, Oslo, Norway, 11–15 June 2018. ASME Paper No. GT2018-75061. [Google Scholar] [CrossRef]
  10. Zhang, K.; Li, Z.; Li, J. Non-axisymmetric endwall contour optimization and performance assessment as affected by simulated swirl purge flow and backward hole injection. Int. J. Therm. Sci. 2022, 172, 107297. [Google Scholar] [CrossRef]
  11. Shyam, V.; Ameri, A.; Poinsatte, P.; Thurman, D.; Wroblewski, A.; Snyder, C. Application of pinniped vibrissae to aeropropulsion. In Proceedings of the ASME Turbo Expo 2015, Montréal, QC, Canada, 15–19 June 2015. ASME Paper No. GT2015-43055. [Google Scholar] [CrossRef]
  12. Benton, S.I.; Bons, J.P.; Sondergaard, R. Secondary flow loss reduction through blowing for a high-lift front-loaded low pressure turbine cascade. ASME J. Turbomach. 2013, 135, 021020. [Google Scholar] [CrossRef]
  13. Benton, S.I.; Bernardini, C.; Bons, J.P.; Sondergaard, R. Parametric optimization of unsteady end wall blowing on a highly loaded low-pressure turbine. ASME J. Turbomach. 2014, 136, 071013. [Google Scholar] [CrossRef]
  14. Bloxham, M.J.; Bons, J.P. A global approach to turbomachinery flow control: Passage vortex control. ASME J. Turbomach. 2014, 136, 041003. [Google Scholar] [CrossRef]
  15. Matsunuma, T. Effects of the Installation Location of a Dielectric Barrier Discharge Plasma Actuator on the Active Passage Vortex Control of a Turbine Cascade at Low Reynolds Numbers. Actuators 2022, 11, 129. [Google Scholar] [CrossRef]
  16. Matsunuma, T.; Segawa, T. Active Flow Control for Passage Vortex Reduction in a Linear Turbine Cascade with Various Tip Clearance Sizes Using a Dielectric Barrier Discharge Plasma Actuator. Aerospace 2023, 10, 641. [Google Scholar] [CrossRef]
  17. Corke, T.C.; Enloe, C.L.; Wilkinson, S.P. Dielectric Barrier Discharge Plasma Actuators for Flow Control. Annu. Rev. Fluid Mech. 2010, 42, 505–529. [Google Scholar] [CrossRef]
  18. Abe, Y.; Nonomura, T.; Sato, M.; Aono, H.; Fujii, K. Comparison of Separation Control Mechanisms for Synthetic Jet and Plasma Actuators. Actuators 2023, 12, 322. [Google Scholar] [CrossRef]
  19. Rodrigues, F.; Abdollahzadehsangroudi, M.; Nunes-Pereira, J.; Páscoa, J. Recent Developments on Dielectric Barrier Discharge (DBD) Plasma Actuators for Icing Mitigation. Actuators 2023, 12, 5. [Google Scholar] [CrossRef]
  20. Sekimoto, S.; Fujii, K.; Anyoji, M.; Miyakawa, Y.; Ito, S.; Shimomura, S.; Nishida, H.; Nonomura, T.; Matsuno, T. Flow Control around NACA0015 Airfoil Using a Dielectric Barrier Discharge Plasma Actuator over a Wide Range of the Reynolds Number. Actuators 2023, 12, 43. [Google Scholar] [CrossRef]
  21. Moreira, M.; Rodrigues, F.; Cândido, S.; Santos, G.; Páscoa, J. Development of a Background-Oriented Schlieren (BOS) System for Thermal Characterization of Flow Induced by Plasma Actuators. Energies 2023, 16, 540. [Google Scholar] [CrossRef]
  22. Emori, K.; Kaneko, Y.; Nishida, H. Comparison between Density and Velocity Fields in Burst Modulation of a Dielectric-Barrier-Discharge Plasma Actuator. Actuators 2022, 11, 340. [Google Scholar] [CrossRef]
  23. Abdullaev, A.; Kotvitskii, A.; Moralev, I.; Ustinov, M. On the Possibility of Cross-Flow Vortex Cancellation by Plasma Actuators. Aerospace 2023, 10, 469. [Google Scholar] [CrossRef]
  24. Vishnyakov, O.; Polivanov, P.; Sidorenko, A. Response of the Shock Wave/Boundary Layer Interaction to Disturbances Induced by the Plasma Discharge. Aerospace 2023, 10, 798. [Google Scholar] [CrossRef]
  25. Chernyshev, S.; Gadzhimagomedov, G.; Kuryachiy, A.; Sboev, D.; Tolkachev, S. 3D Turbulent Boundary Layer Separation Control by Multi-Discharge Plasma Actuator. Aerospace 2023, 10, 869. [Google Scholar] [CrossRef]
  26. Kazanskii, P.N. Closed-Loop Cavity Shear Layer Control Using Plasma Dielectric Barrier Discharge Actuators. Aerospace 2023, 10, 888. [Google Scholar] [CrossRef]
  27. Huang, J.; Corke, T.; Thomas, F. Plasma Actuators for Separation Control of Low Pressure Turbine Blades. In Proceedings of the 41st Aerospace Sciences Meeting and Exhibit, Reno, NV, USA, 6–9 January 2003. AIAA Paper, No. 2003-1027. [Google Scholar] [CrossRef]
  28. List, J.; Byerley, A.; McLaughlin, T.; Van Dyken, R. Using a plasma actuator to control laminar separation on a linear cascade turbine blade. In Proceedings of the 41st Aerospace Sciences Meeting and Exhibit, Reno, NV, USA, 6–9 January 2003. AIAA Paper, No. 2003-1026. [Google Scholar] [CrossRef]
  29. Pescini, E.; De Giorgi, M.; Suma, A.; Francioso, L.; Ficarella, A. Separation control by a microfabricated SDBD plasma actuator for small engine turbine applications: Influence of the excitation waveform. Aerosp. Sci. Technol. 2018, 76, 442–454. [Google Scholar] [CrossRef]
  30. Van Ness, D.K., II; Corke, T.C.; Morris, S.C. Turbine Tip Clearance Flow Control Using Plasma Actuators. In Proceedings of the 44th AIAA Aerospace Sciences Meeting and Exhibit, Reno, NV, USA, 9–12 January 2006. Paper No. AIAA 2006-21. [Google Scholar] [CrossRef]
  31. Yu, J.; Wang, Z.; Chen, F.; Yu, J.; Wang, C. Kriging surrogate model applied in the mechanism study of tip leakage flow control in turbine cascade by multiple DBD plasma actuators. Aerosp. Sci. Technol. 2019, 85, 216–228. [Google Scholar] [CrossRef]
  32. Matsunuma, T.; Segawa, T. Vortex structure for reducing tip leakage flow of linear turbine cascade using dielectric barrier discharge plasma actuator. Aerosp. Sci. Technol. 2023, 136, 108215. [Google Scholar] [CrossRef]
  33. Saddoughi, S.; Bennett, G.; Boespflug, M.; Puterbaugh, S.L.; Wadia, A.R. Experimental Investigation of Tip Clearance Flow in a Transonic Compressor With and Without Plasma Actuators. ASME J. Turbomach. 2015, 137, 041008. [Google Scholar] [CrossRef]
  34. Zhang, H.; Wu, Y.; Yu, X.; Li, Y.; Liu, B. Experimental Investigation on the Plasma Flow Control of Axial Compressor Rotating Stall. In Proceedings of the ASME Turbo Expo 2019: Turbomachinery Technical Conference and Exposition, Phoenix, AZ, USA, 17–21 June 2019. ASME Paper No. GT2019-90609. [Google Scholar] [CrossRef]
  35. Zhang, H.; Wu, Y.; Li, Y.; Yu, X.; Liu, B. Control of compressor tip leakage flow using plasma actuation. Aerosp. Sci. Technol. 2019, 86, 244–255. [Google Scholar] [CrossRef]
  36. Matsunuma, T. Unsteady flow field of an axial-flow turbine rotor at a low Reynolds number. ASME J. Turbomach. 2007, 129, 360–371. [Google Scholar] [CrossRef]
  37. Ashpis, D.E.; Thurman, D.R. DBD Plasma Actuators for Flow Control in Air Vehicles and Jet Engines—Simulation of Flight Conditions in Test Chambers by Density Matching. In Proceedings of the 42nd AIAA Plasmadynamics and Lasers Conference, Honolulu, Hawaii, 27−30 June 2011. Paper No. AIAA 2011-3730. [Google Scholar] [CrossRef]
  38. Benard, N.; Balcon, N.; Moreau, E. Electric wind produced by a surface dielectric barrier discharge operating in air at different pressures: Aeronautical control insights. J. Phys. D Appl. Phys. 2008, 41, 042002. [Google Scholar] [CrossRef]
  39. Valerioti, J.A.; Corke, T.C. Pressure Dependence of Dielectric Barrier Discharge Plasma Flow Actuators. AIAA J. 2012, 50, 1490–1502. [Google Scholar] [CrossRef]
  40. Raffel, M.; Willert, C.E.; Scarano, F.; Kähler, C.J.; Wereley, S.T.; Kompenhans, J. Particle Image Velocimetry: A Practical Guide, 3rd ed.; Springer: Berlin, Germany, 2018; Available online: https://link.springer.com/book/10.1007/978-3-319-68852-7 (accessed on 15 October 2023).
  41. Michelis, T.; Kotsonis, M. Flow control on a transport truck side mirror using plasma actuators. ASME J. Fluids Eng. 2015, 137, 111103. [Google Scholar] [CrossRef]
  42. Shima, Y.; Imai, R.; Ishikawa, H.; Segawa, T. Mechanism of Thrust–Power Ratio Improvement Using Plasma Actuator with Discretized Encapsulated Electrodes. Actuators 2022, 11, 296. [Google Scholar] [CrossRef]
  43. Matsunuma, T.; Segawa, T. Effects of Input Voltage and Freestream Velocity on Active Flow Control of Passage Vortex in a Linear Turbine Cascade Using Dielectric Barrier Discharge Plasma Actuator. Energies 2020, 13, 764. [Google Scholar] [CrossRef]
Figure 1. PV generated in a turbine passage.
Actuators 12 00467 g001
Figure 2. (a) Test section of the LTC and (b) PIV measurement plane and axial PA.
Actuators 12 00467 g002
Figure 3. Top view of the LTC at three PA settings. (a) PA1: axial PA. (b) PA2: slanted PA blade inlet. (c) PA3: slanted PA blade inside.
Actuators 12 00467 g003
Figure 4. (a) Conventional DBD-PA and (b) inlet boundary layer flow acceleration by the PA.
Actuators 12 00467 g004
Figure 5. Photographs of top and bottom views and cross-sectional schematic of the Pas. (a) PA1: axial PA [15]; (b) PA2 and PA3: slanted PAs.
Actuators 12 00467 g005
Figure 6. Configuration of the LTC and the PA.
Actuators 12 00467 g006
Figure 7. (a) Maximum velocity induced by the PA at various input voltages and (b) power consumption of the PA at various input voltages [43].
Actuators 12 00467 g007
Figure 8. Velocity distributions at the outlet of the LTC at various input voltages for Reout = 3.7 × 10⁴ (PA1: axial PA).
Actuators 12 00467 g008
Figure 9. Span-wise distribution of the pitch-averaged velocity in the center passage for Reout = 3.7 × 10⁴ (PA1: axial PA).
Actuators 12 00467 g009
Figure 10. Velocity distributions at the outlet of the LTC at various input voltages for Reout = 3.7 × 10⁴ (PA2: slanted PA blade inlet).
Actuators 12 00467 g010
Figure 11. Span-wise distribution of the pitch-averaged velocity in the center passage for Reout = 3.7 × 10⁴ (PA2: slanted PA blade inlet).
Actuators 12 00467 g011
Figure 12. Velocity distributions at the outlet of the LTC at various input voltages for Reout = 3.7 × 10⁴ (PA3: slanted PA blade inside).
Actuators 12 00467 g012
Figure 13. Span-wise distribution of the pitch-averaged velocity in the center passage for Reout = 3.7 × 10⁴ (PA3: slanted PA blade inside).
Actuators 12 00467 g013
Figure 14. (a) Area-averaged velocity in the center passage for Reout = 3.7 × 10⁴ and (b) enlarged plot section of the area-averaged velocity.
Actuators 12 00467 g014
Figure 15. Span-wise distribution of the pitch-averaged velocity in the center passage for Reout = 3.7 × 10⁴ (VAC = 15 kVp-p).
Actuators 12 00467 g015
Figure 16. Peak velocity in the center passage for Reout = 3.7 × 10⁵: (a) near the blade suction surface and (b) near the endwall.
Actuators 12 00467 g016
Figure 17. Streamlines at the outlet of the LTC for the three PA layouts for Reout = 3.7 × 10⁴ (VAC = 15 kVp-p).
Actuators 12 00467 g017
Figure 18. Plots of the center positions of the PV for Reout = 3.7 × 10⁴ (VAC = 15 kVp-p).
Actuators 12 00467 g018
Figure 19. Turbulence intensity distributions at the outlet of the LTC for the three PA layouts for Reout = 3.7 × 10⁴ (VAC = 15 kVp-p).
Actuators 12 00467 g019
Figure 20. Span-wise distribution of the pitch-averaged turbulence intensity in the center passage at Reout = 3.7 × 10⁴ (VAC = 15 kVp-p).
Actuators 12 00467 g020
Figure 21. Vorticity distributions at the outlet of the LTC for the three PA layouts for Reout = 3.7 × 10⁴ (VAC = 15 kVp-p).
Actuators 12 00467 g021
Figure 22. Velocity distributions at the outlet of the LTC for the three PA layouts for Reout = 1.0 × 10⁴ (VAC = 9 kVp-p).
Actuators 12 00467 g022
Figure 23. Streamlines at the outlet of the LTC for the three PA layouts for Reout = 1.0 × 10⁴ (VAC = 9 kVp-p).
Actuators 12 00467 g023
Figure 24. Plots of the center positions of the PV for Reout = 1.0 × 10⁴ (VAC = 9 kVp-p).
Actuators 12 00467 g024
Figure 25. Turbulence intensity distributions at the outlet of the LTC for the three PA layouts for Reout = 1.0 × 10⁴ (VAC = 9 kVp-p).
Actuators 12 00467 g025
Figure 26. Vorticity distributions at the outlet of the LTC for the three PA layouts for Reout = 1.0 × 10⁴ (VAC = 9 kVp-p).
Actuators 12 00467 g026
Figure 27. Velocity distributions at the outlet of the LTC for the three PA layouts for Reout = 9.9 × 10⁴ (VAC = 15 kVp-p).
Actuators 12 00467 g027
Figure 28. Streamlines at the outlet of the LTC for the three PA layouts for Reout = 9.9 × 10⁴ (VAC = 15 kVp-p).
Actuators 12 00467 g028
Figure 29. Plots of the center positions of the PV for Reout = 9.9 × 10⁴ (VAC = 15 kVp-p).
Actuators 12 00467 g029
Figure 30. Turbulence intensity distributions at the outlet of the LTC for the three PA layouts for Reout = 9.9 × 10⁴ (VAC = 15 kVp-p).
Actuators 12 00467 g030
Figure 31. Vorticity distributions at the outlet of the LTC for the three PA layouts for Reout = 9.9 × 10⁴ (VAC = 15 kVp-p).
Actuators 12 00467 g031
Figure 32. Peak vorticity in the center passage of the three PA layouts for various Reynolds numbers.
Actuators 12 00467 g032
Table 1. Specifications of the LTC.
ParameterValue
Number of blades, N6
Chord length, C (mm)58.65
Axial chord length, Cax (mm)49.43
Blade height, H (mm)75.00
Blade pitch, S (mm)35.47
Aspect ratio, H/C1.54
Solidity, C/S1.16
Inlet flow angle, α1 (°)51.86
Exit flow angle, α2 (°)58.74
Turning angle, α1 + α2 (°)110.60
Stagger angle, ξ (°)33.43
Table 2. Blade outlet velocity and Reynolds number.
Rotating Speed of Blower (Hz)Blade Outlet Velocity UFS,out (m/s)Reynolds Number
Reout
1132.41.0 × 104
2254.71.8 × 104
4509.43.7 × 104
67514.65.7 × 104
90020.98.2 × 104
112525.29.9 × 104
Disclaimer/Publisher’s Note: The statements, opinions and data contained in all publications are solely those of the individual author(s) and contributor(s) and not of MDPI and/or the editor(s). MDPI and/or the editor(s) disclaim responsibility for any injury to people or property resulting from any ideas, methods, instructions or products referred to in the content.