
EEG Investigation on the Tactile Perceptual Performance of a Pneumatic Wearable Display of Softness

 ,
, 
Abstract
1. Introduction
2. Materials and Methods
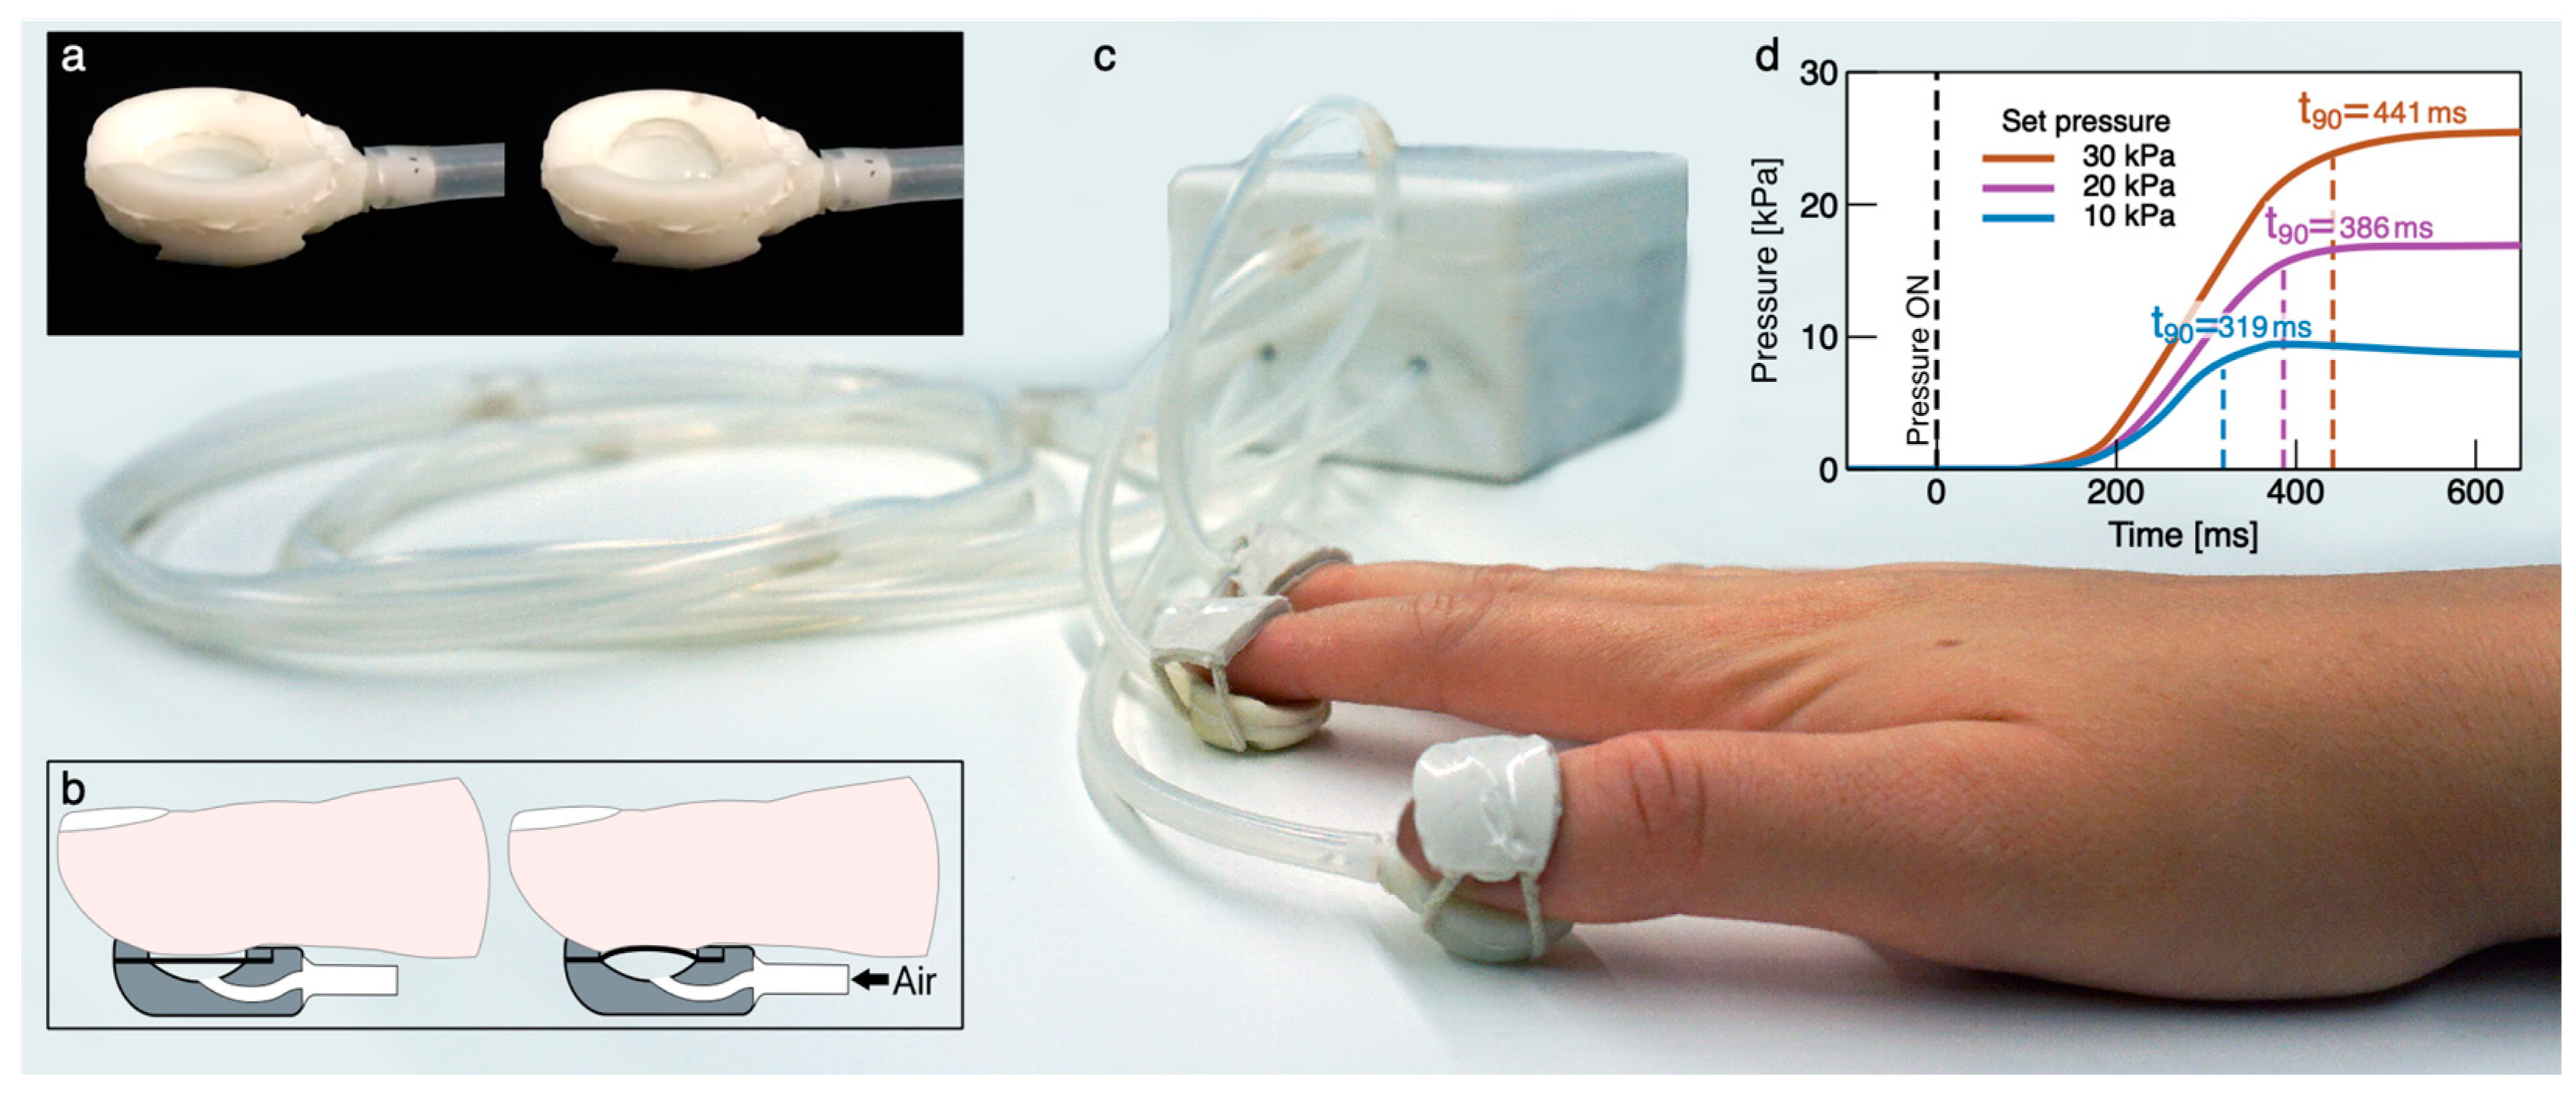
2.1. Wearable Pneumatic Tactile Display of Softness
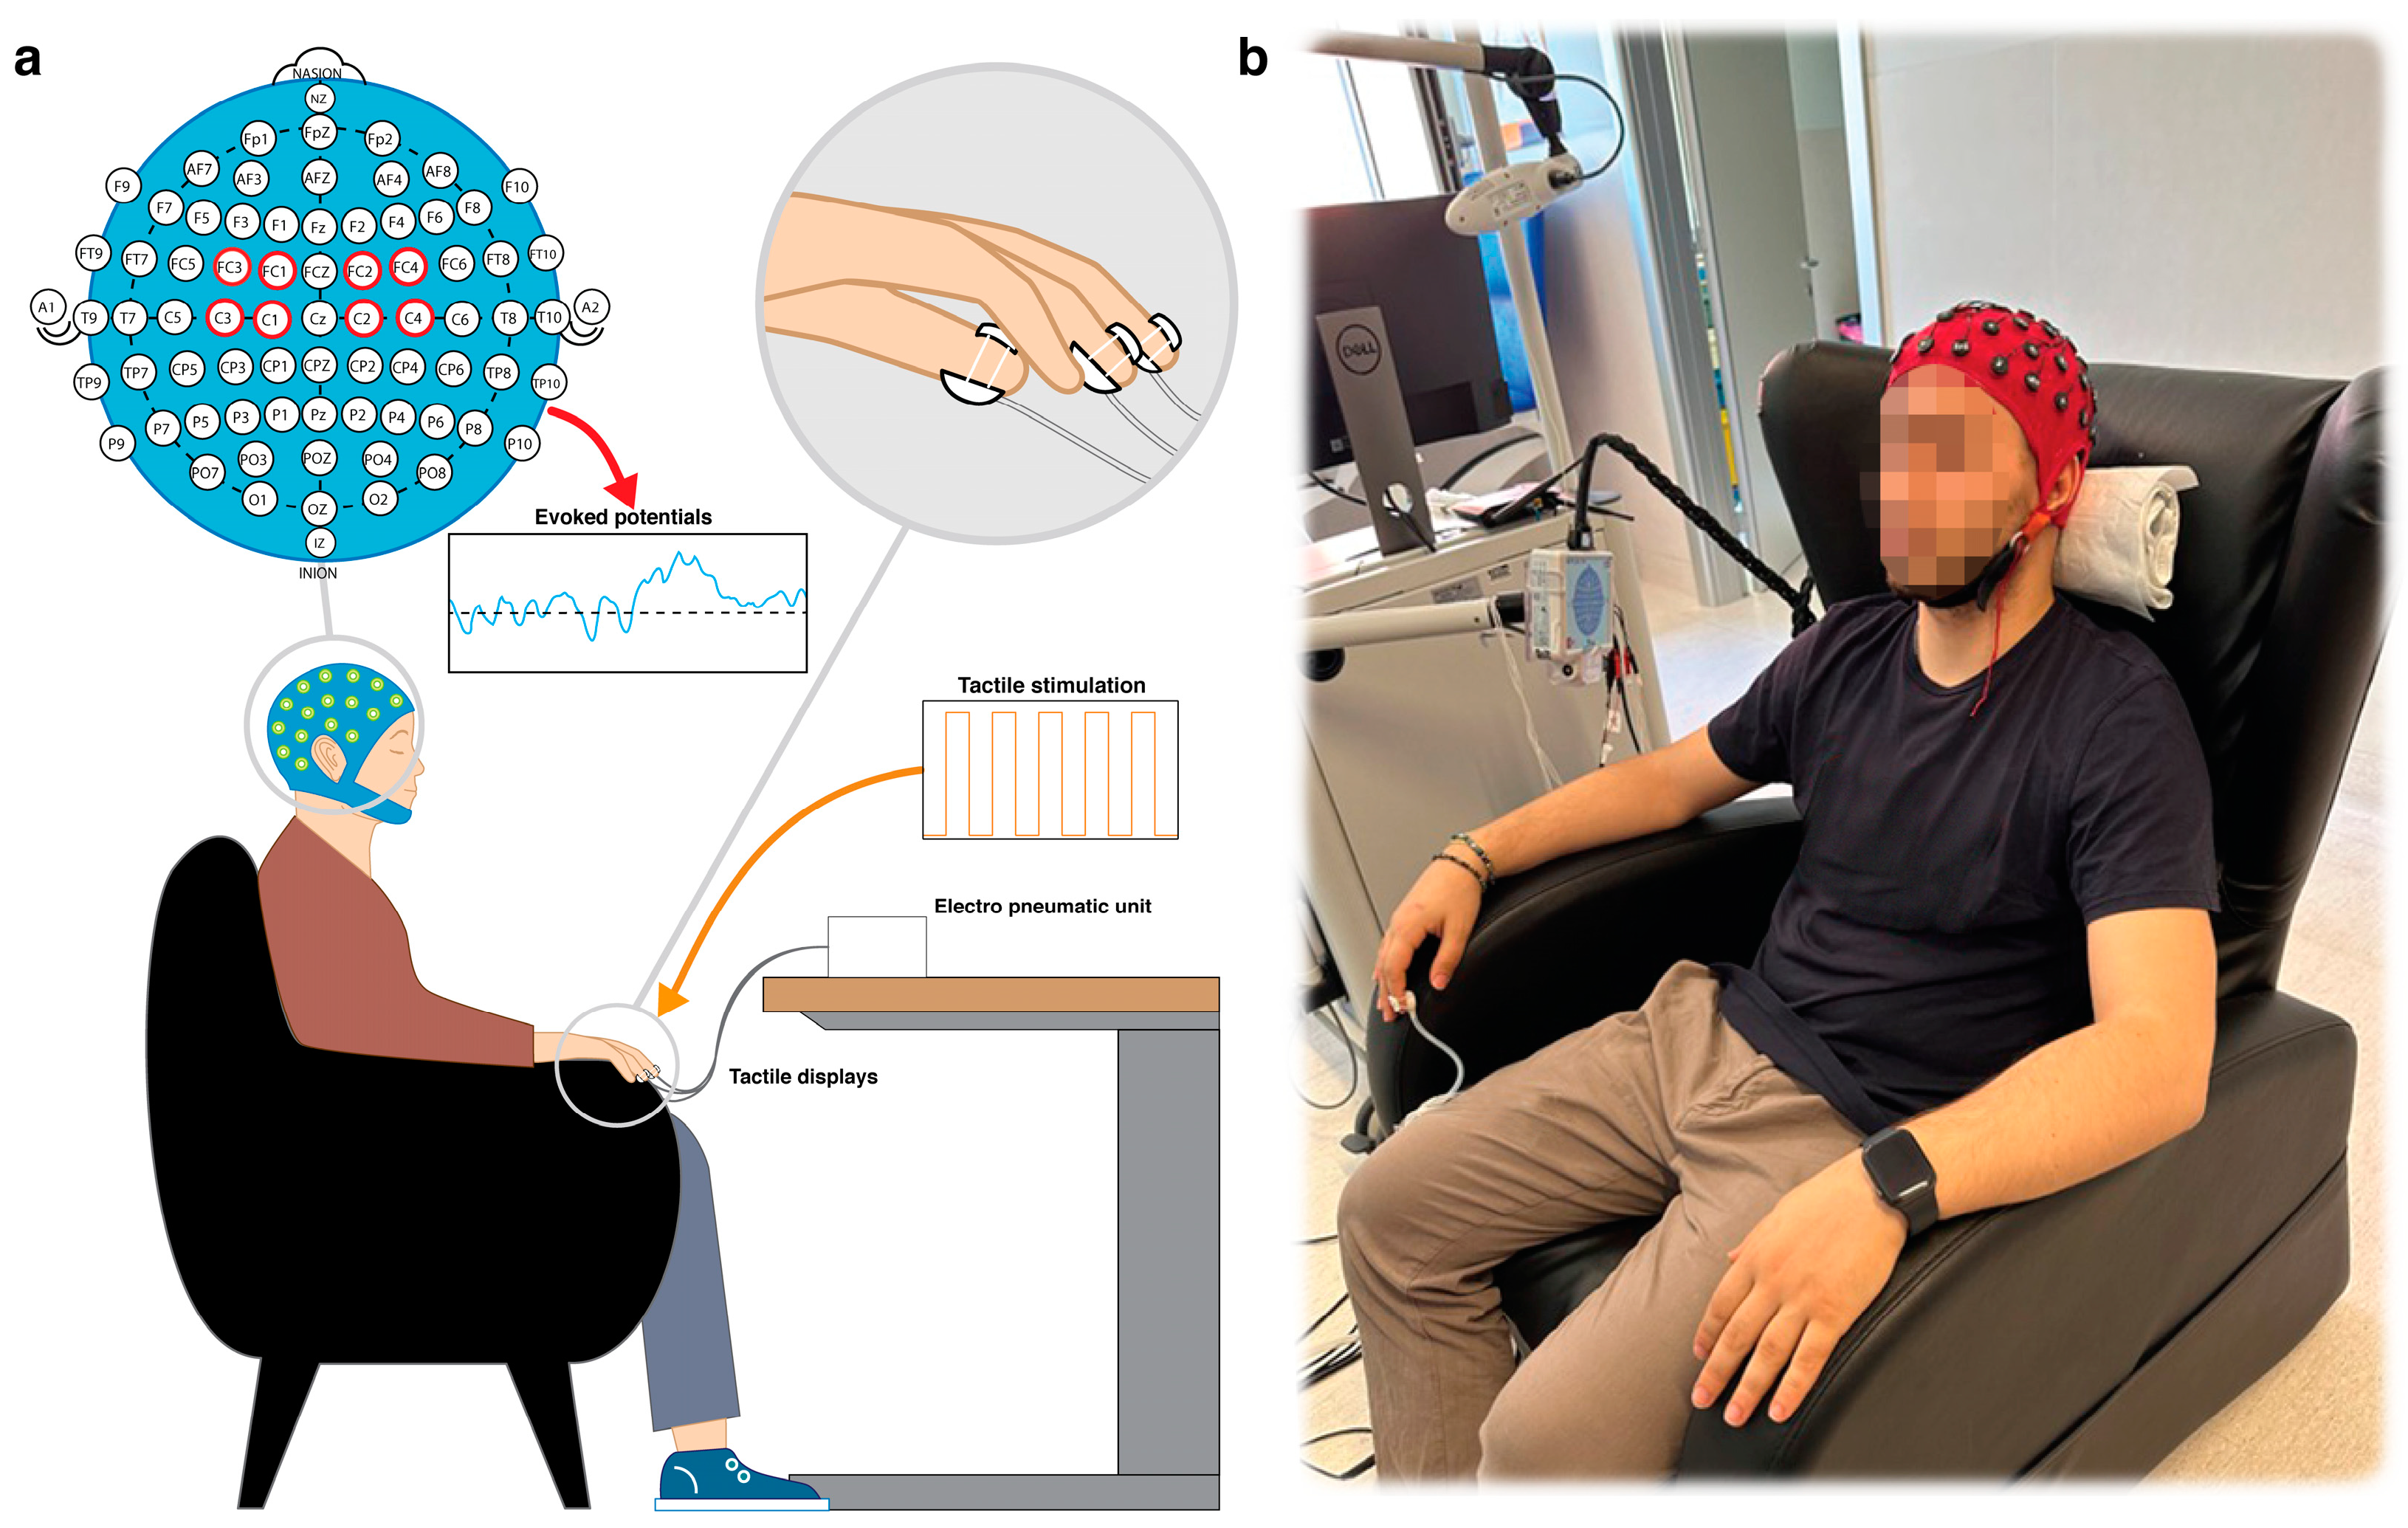
2.2. Experimental Setup and Tactile Stimulation Protocol
2.3. EEG Signals Recording
2.4. EEG Signals Processing and SEP Peaks Identification
2.5. Statistical Analysis
3. Results
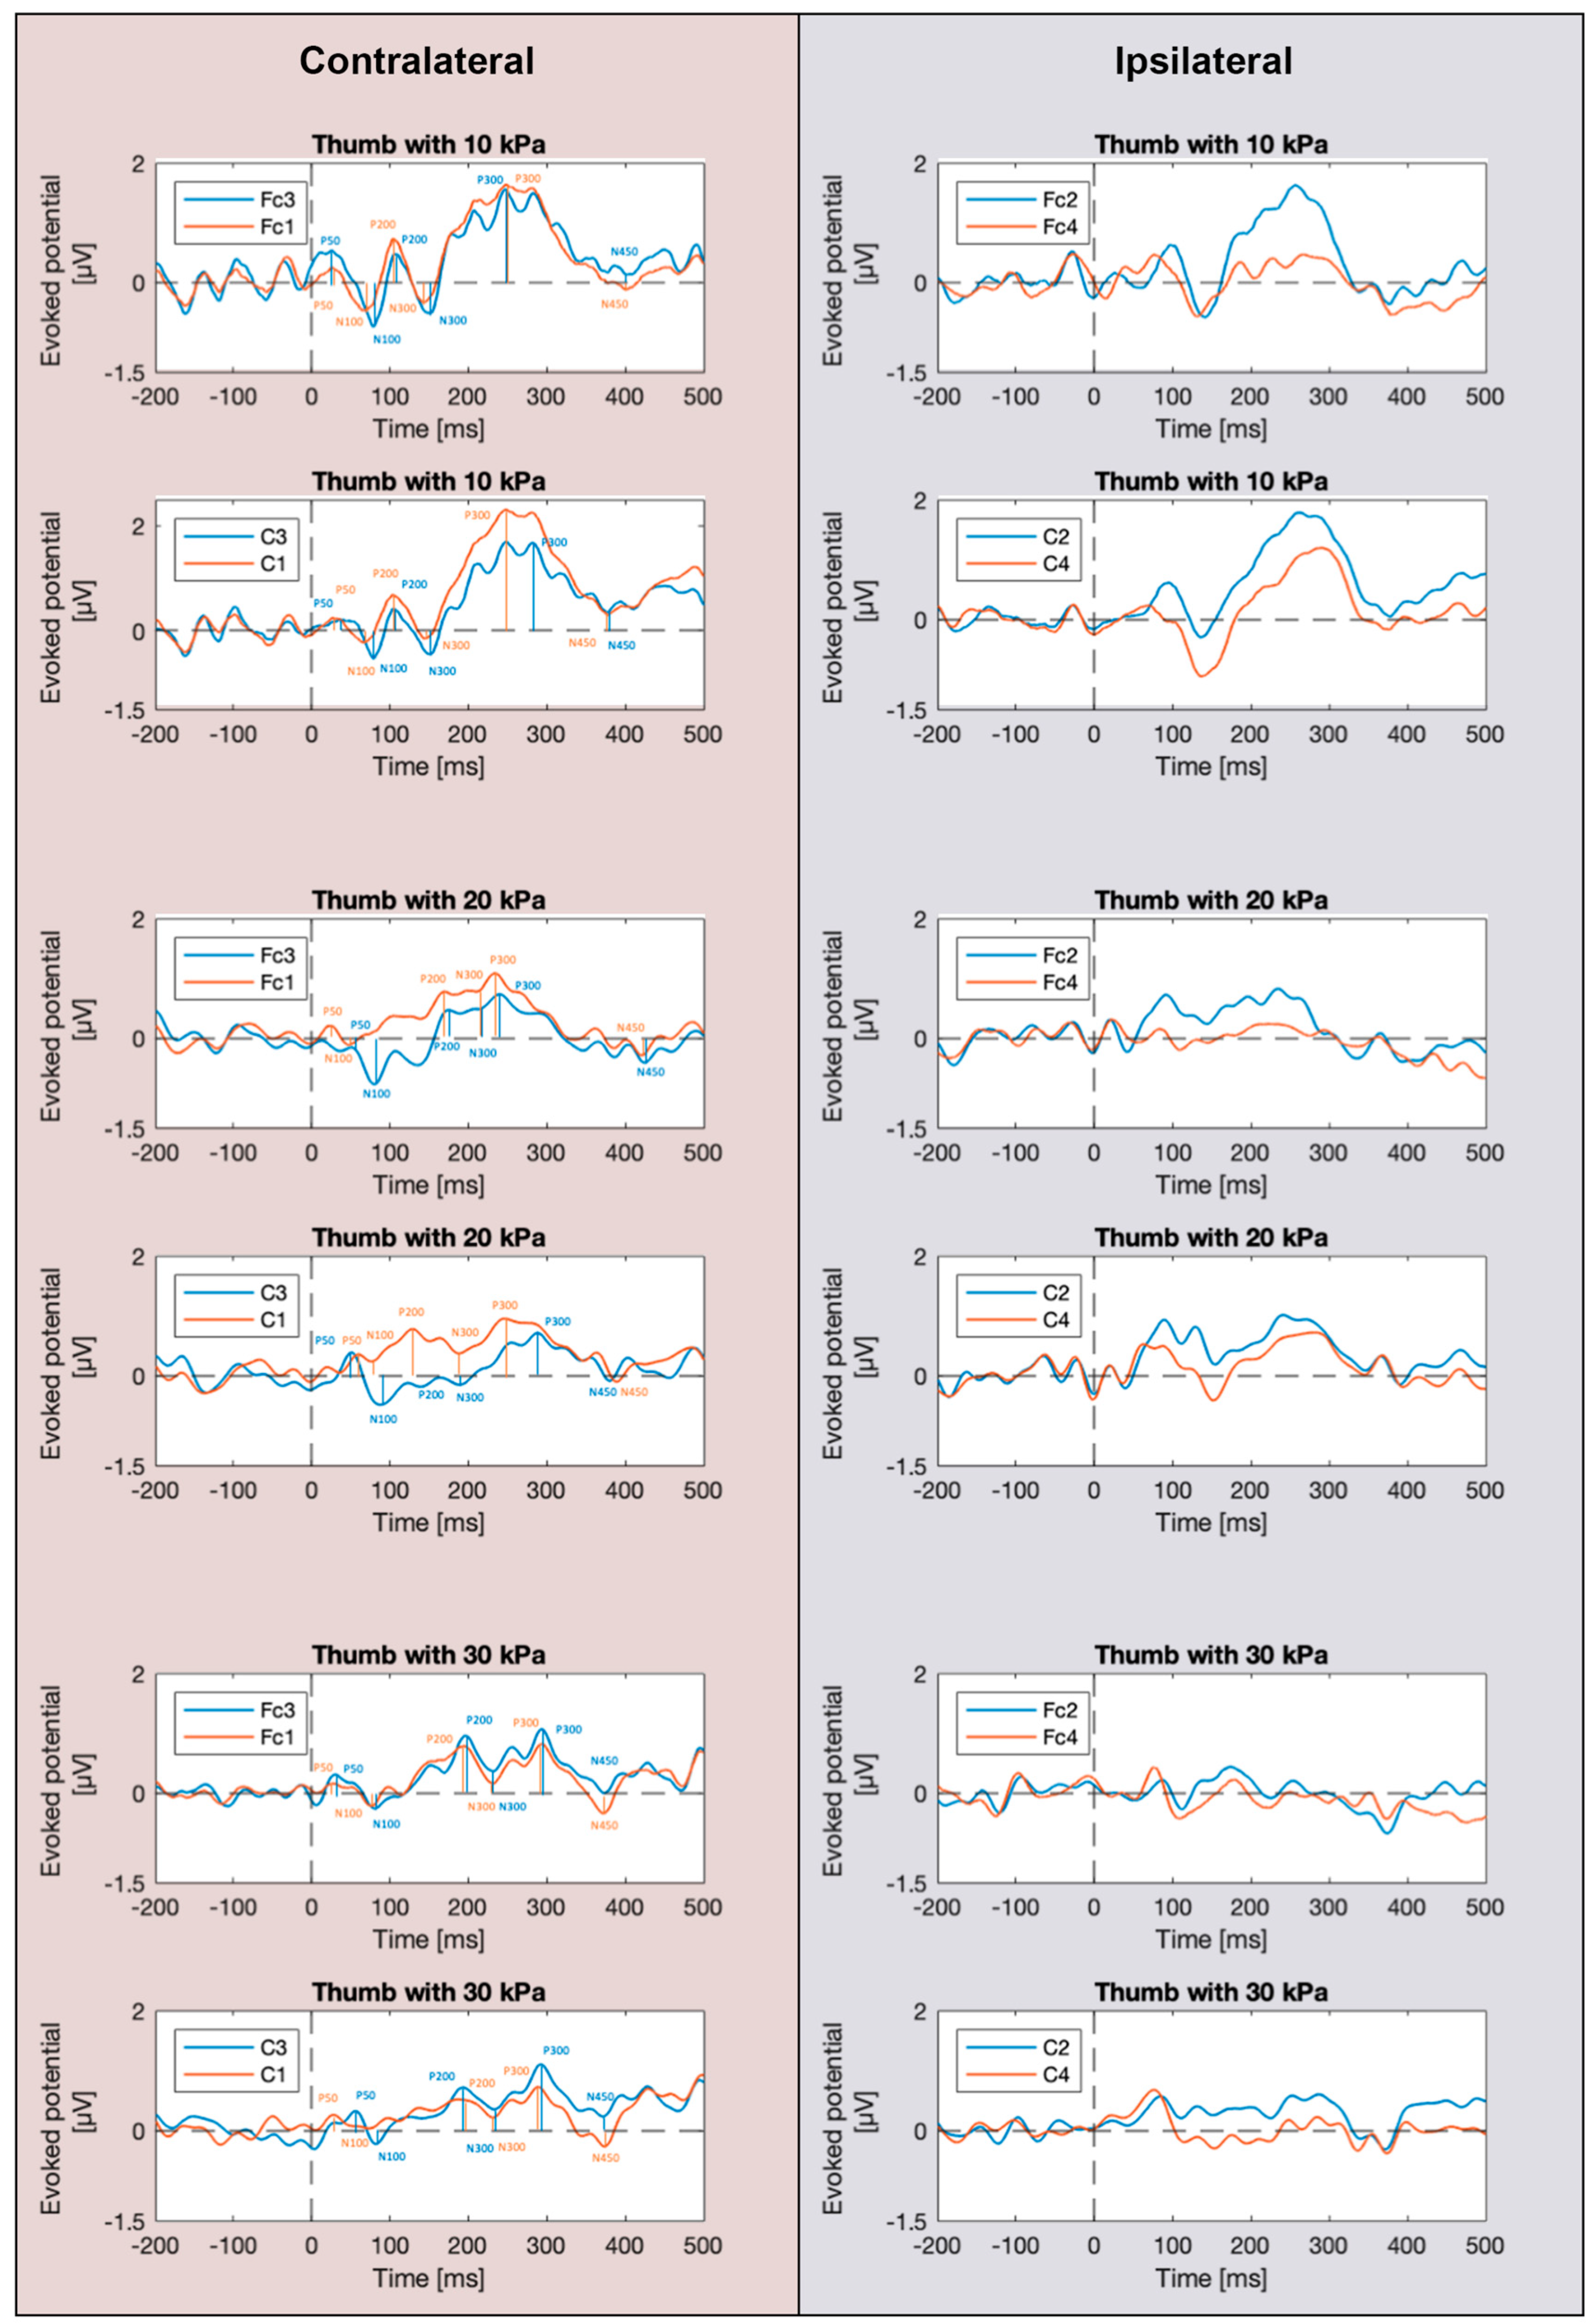
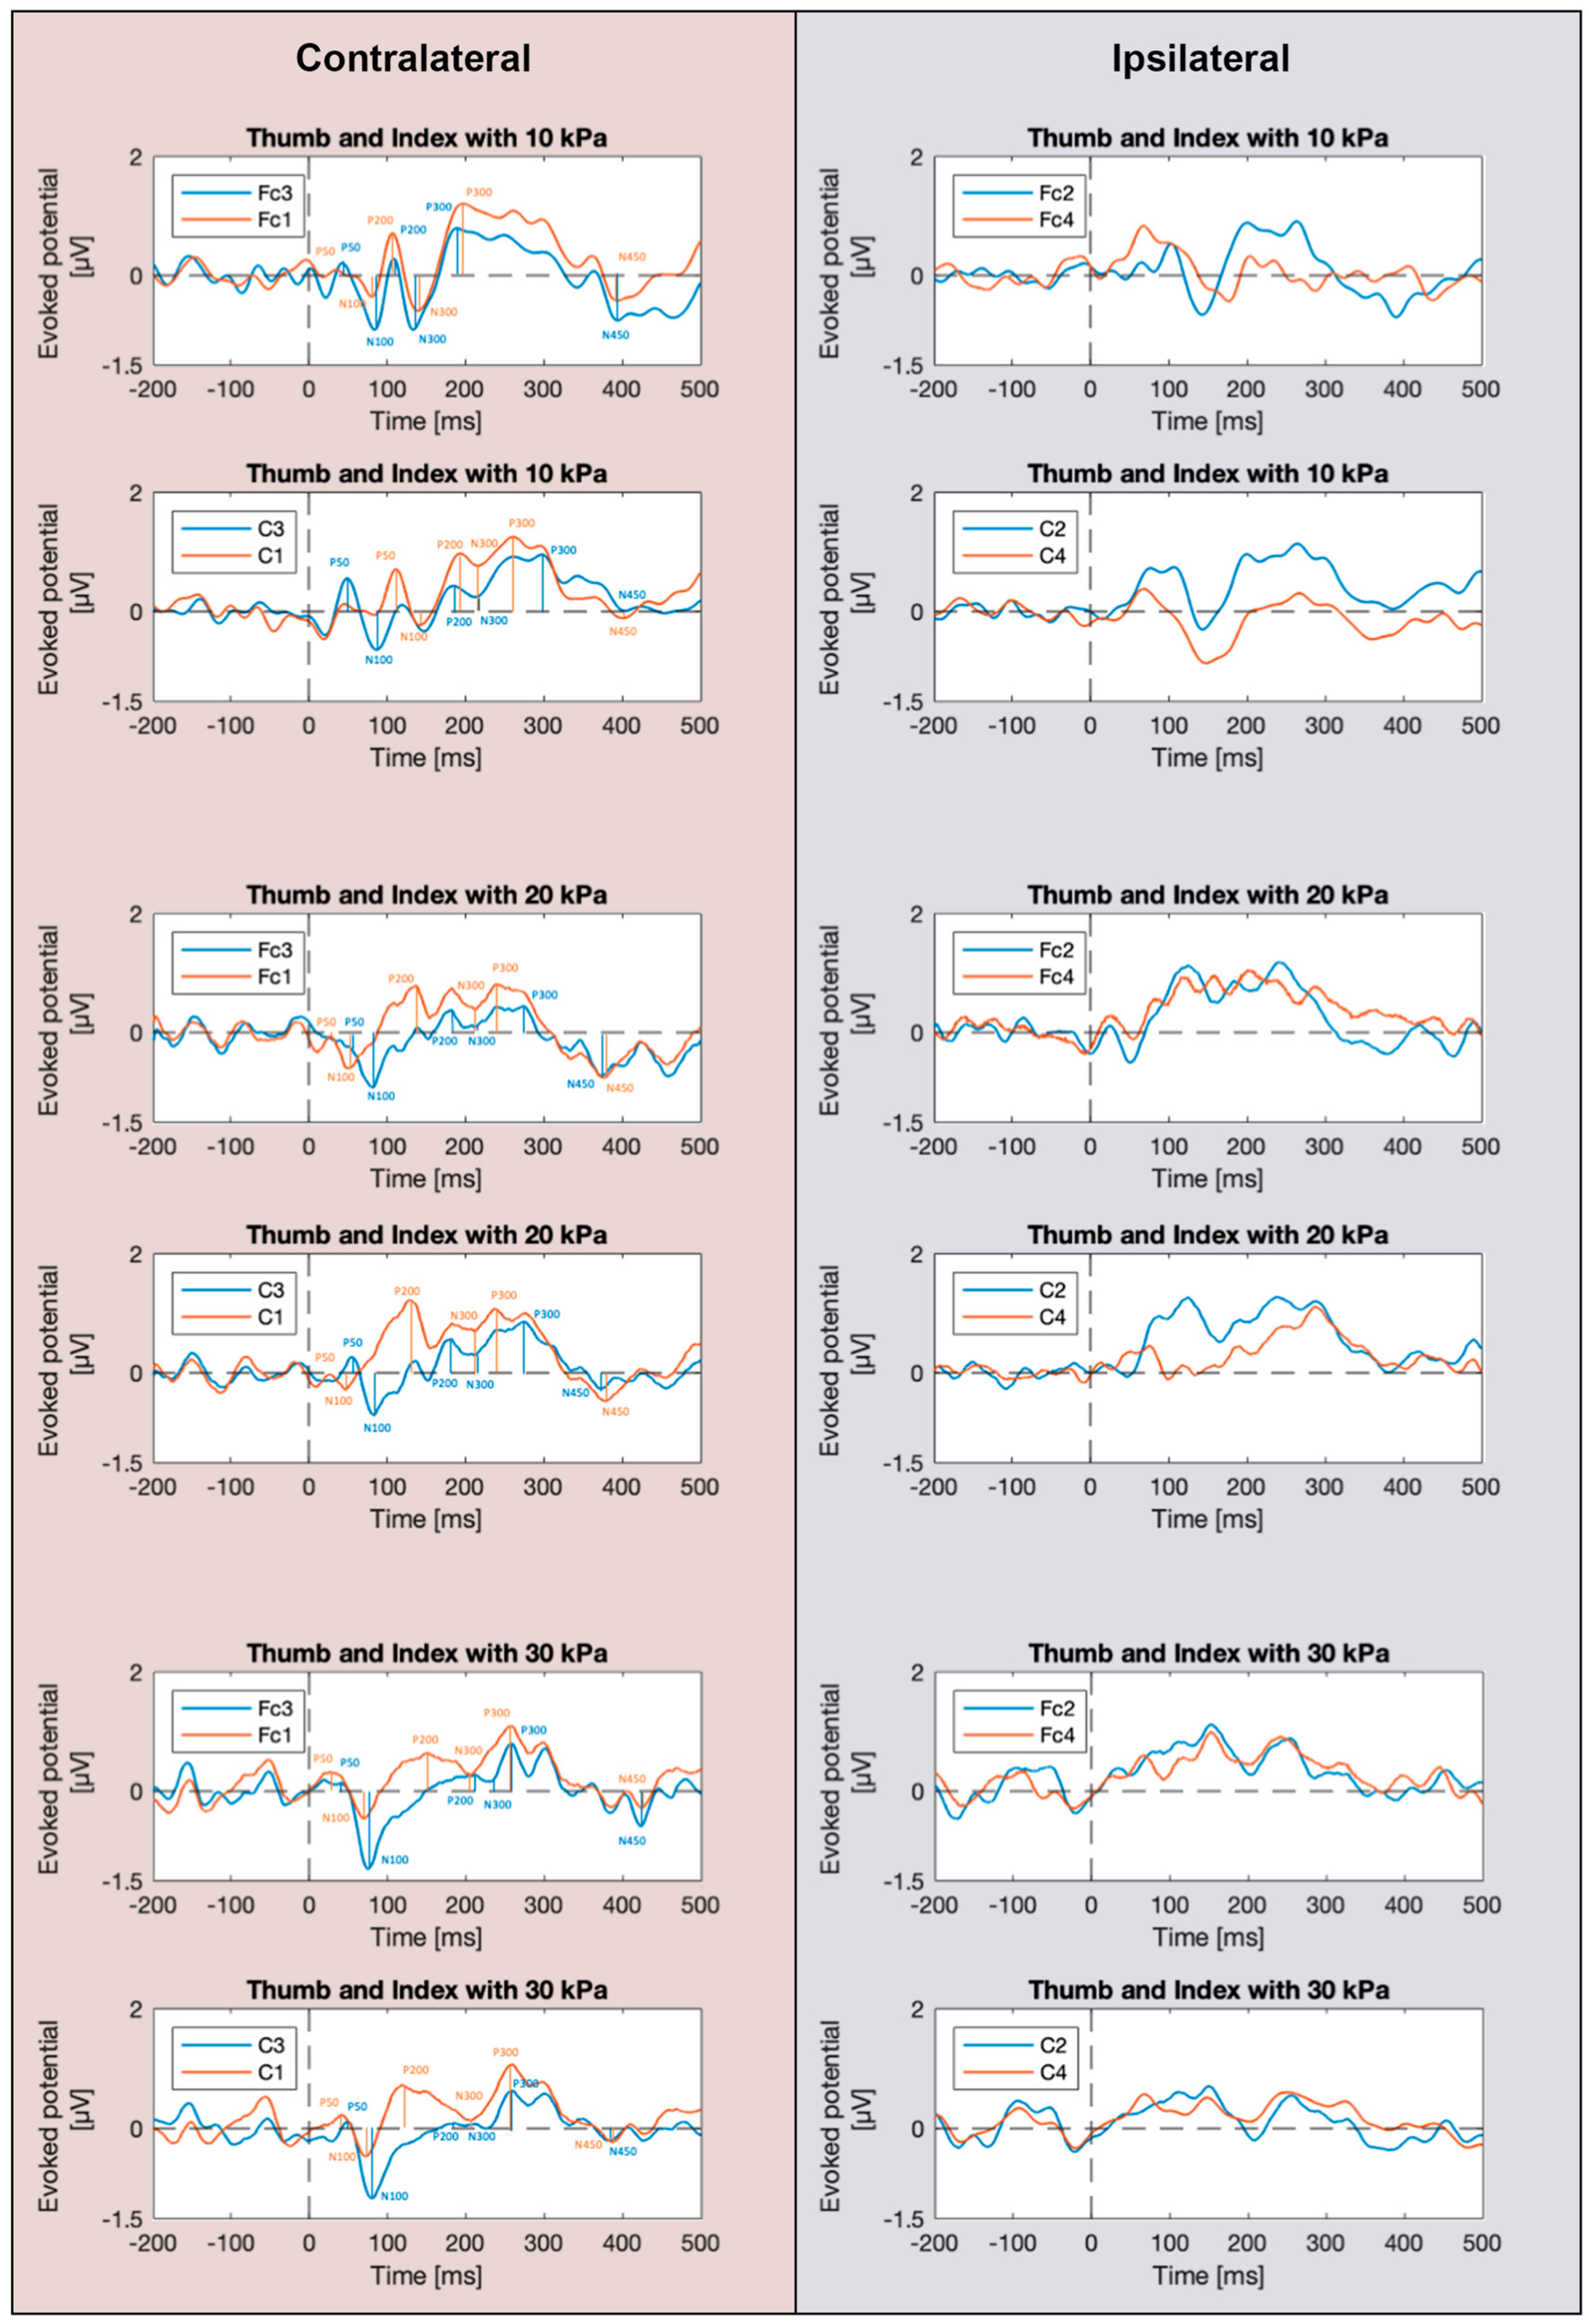
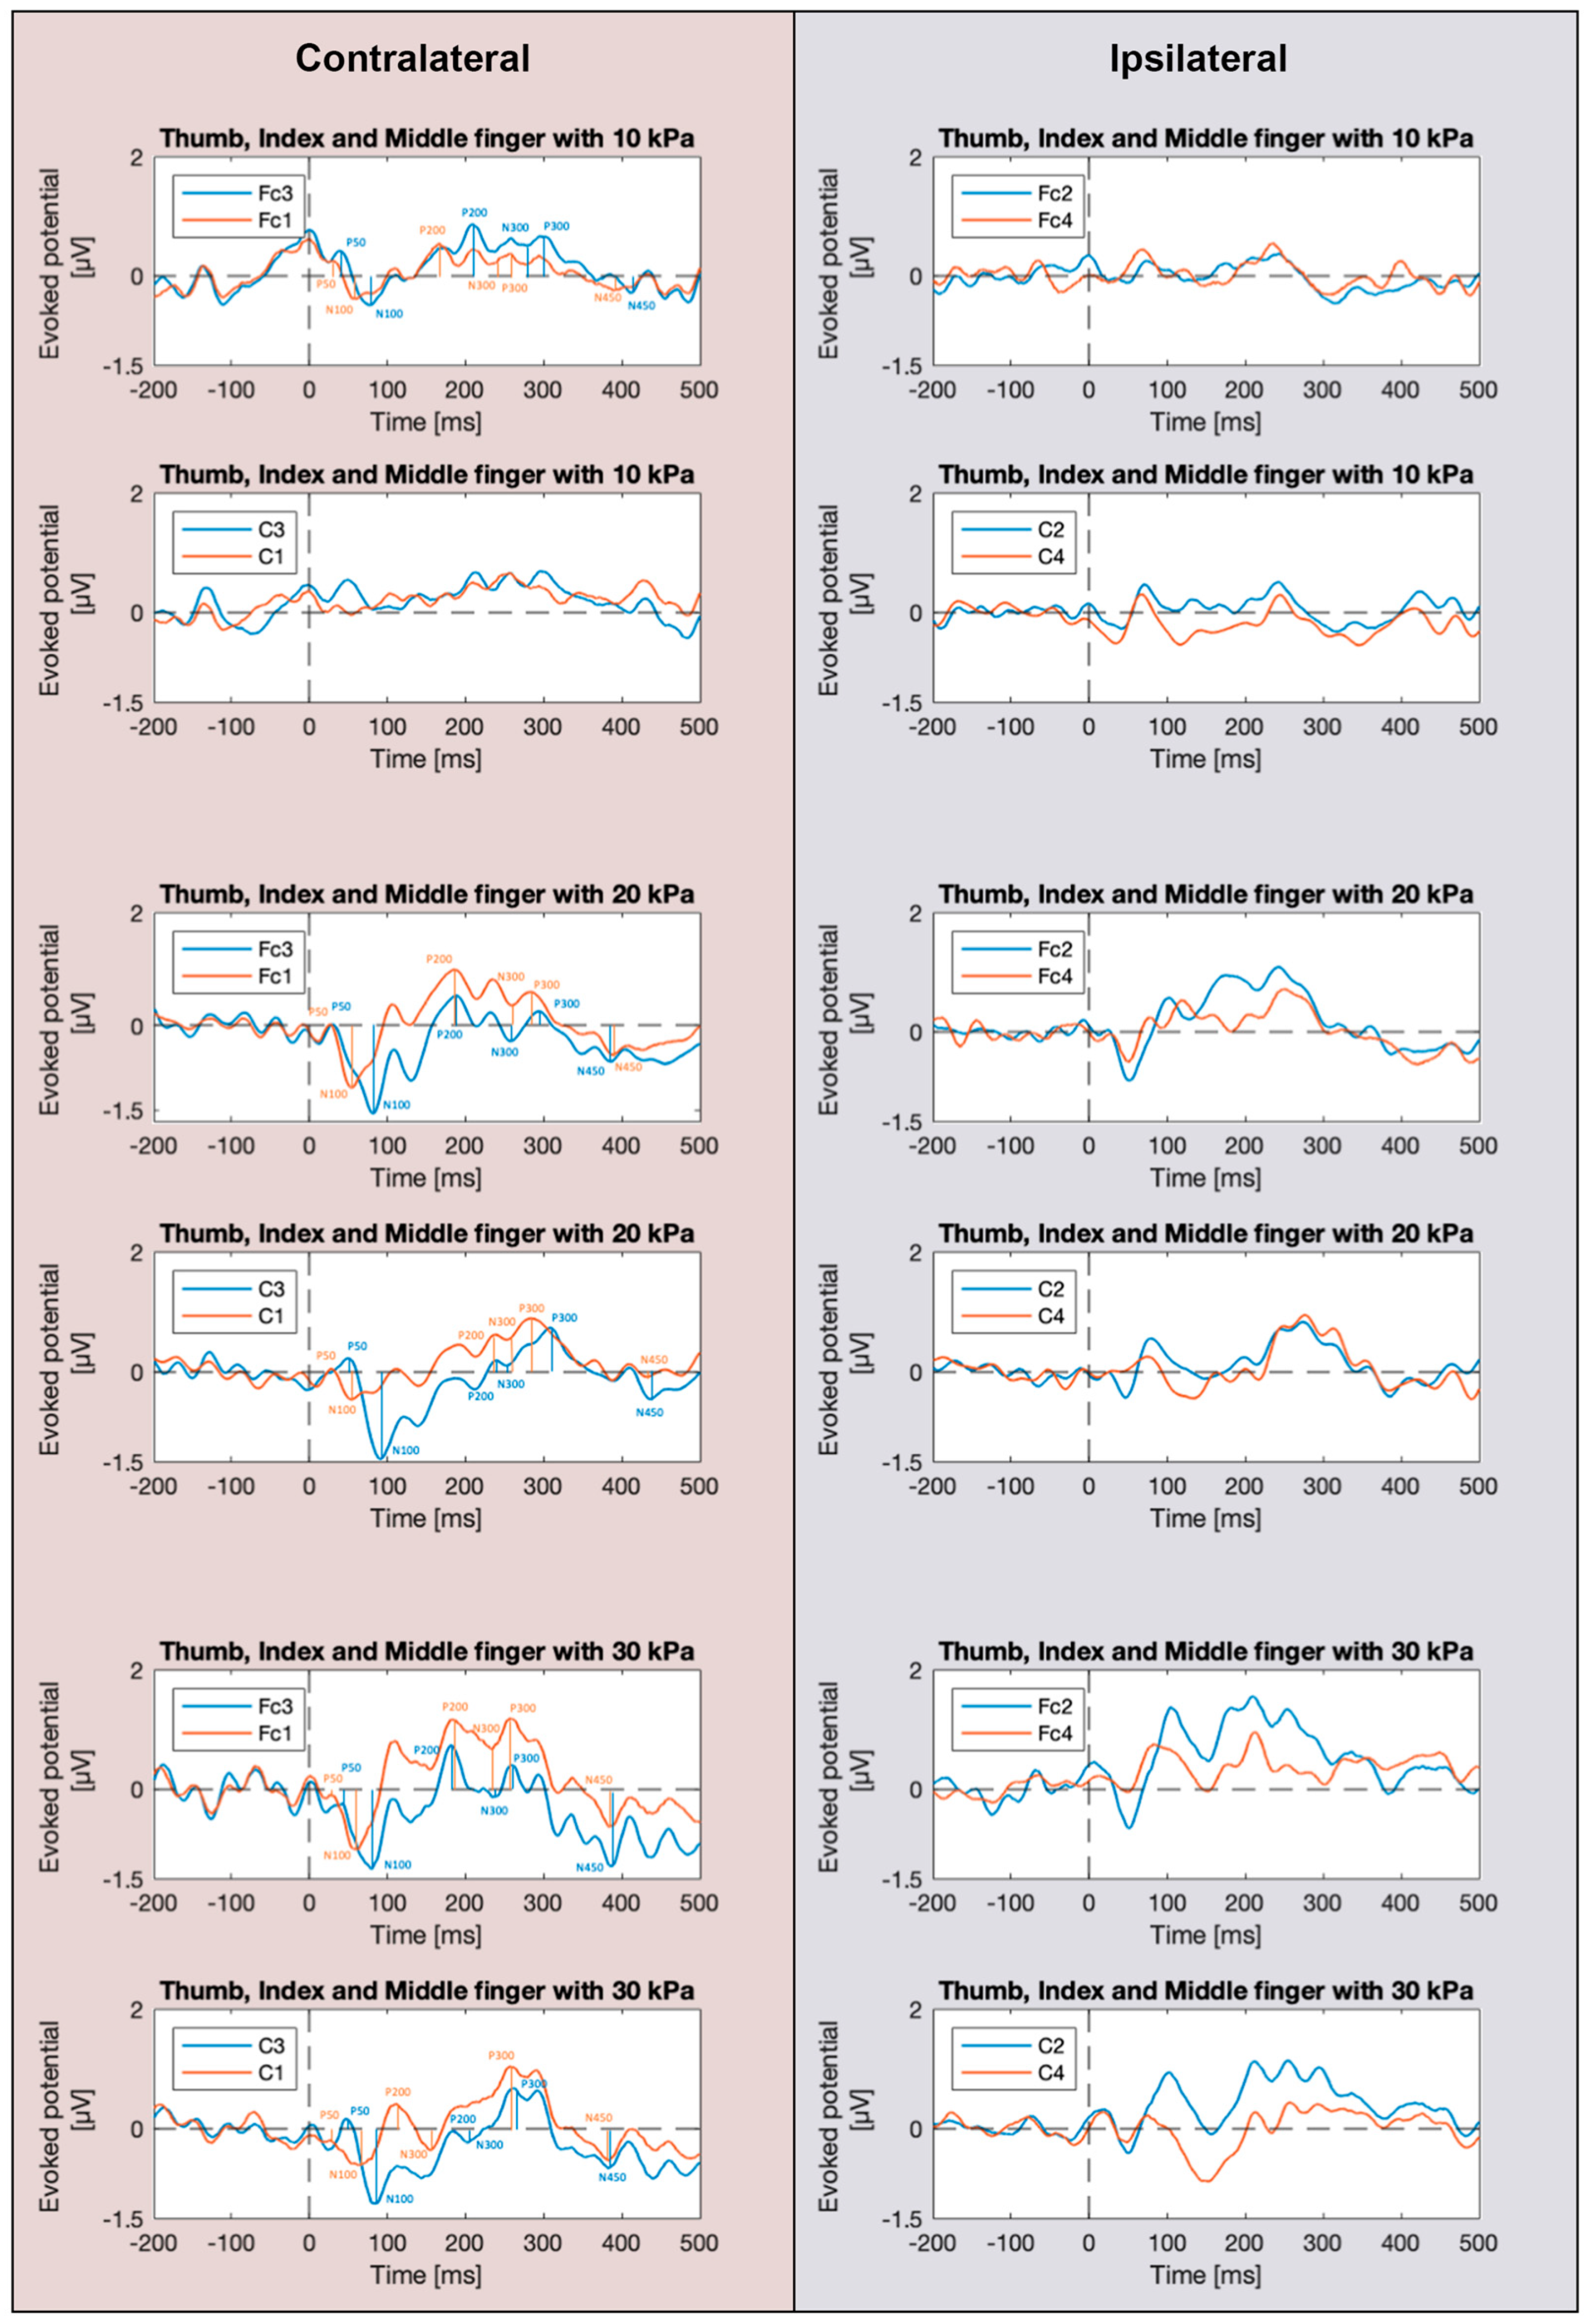
3.1. SEP Waveforms
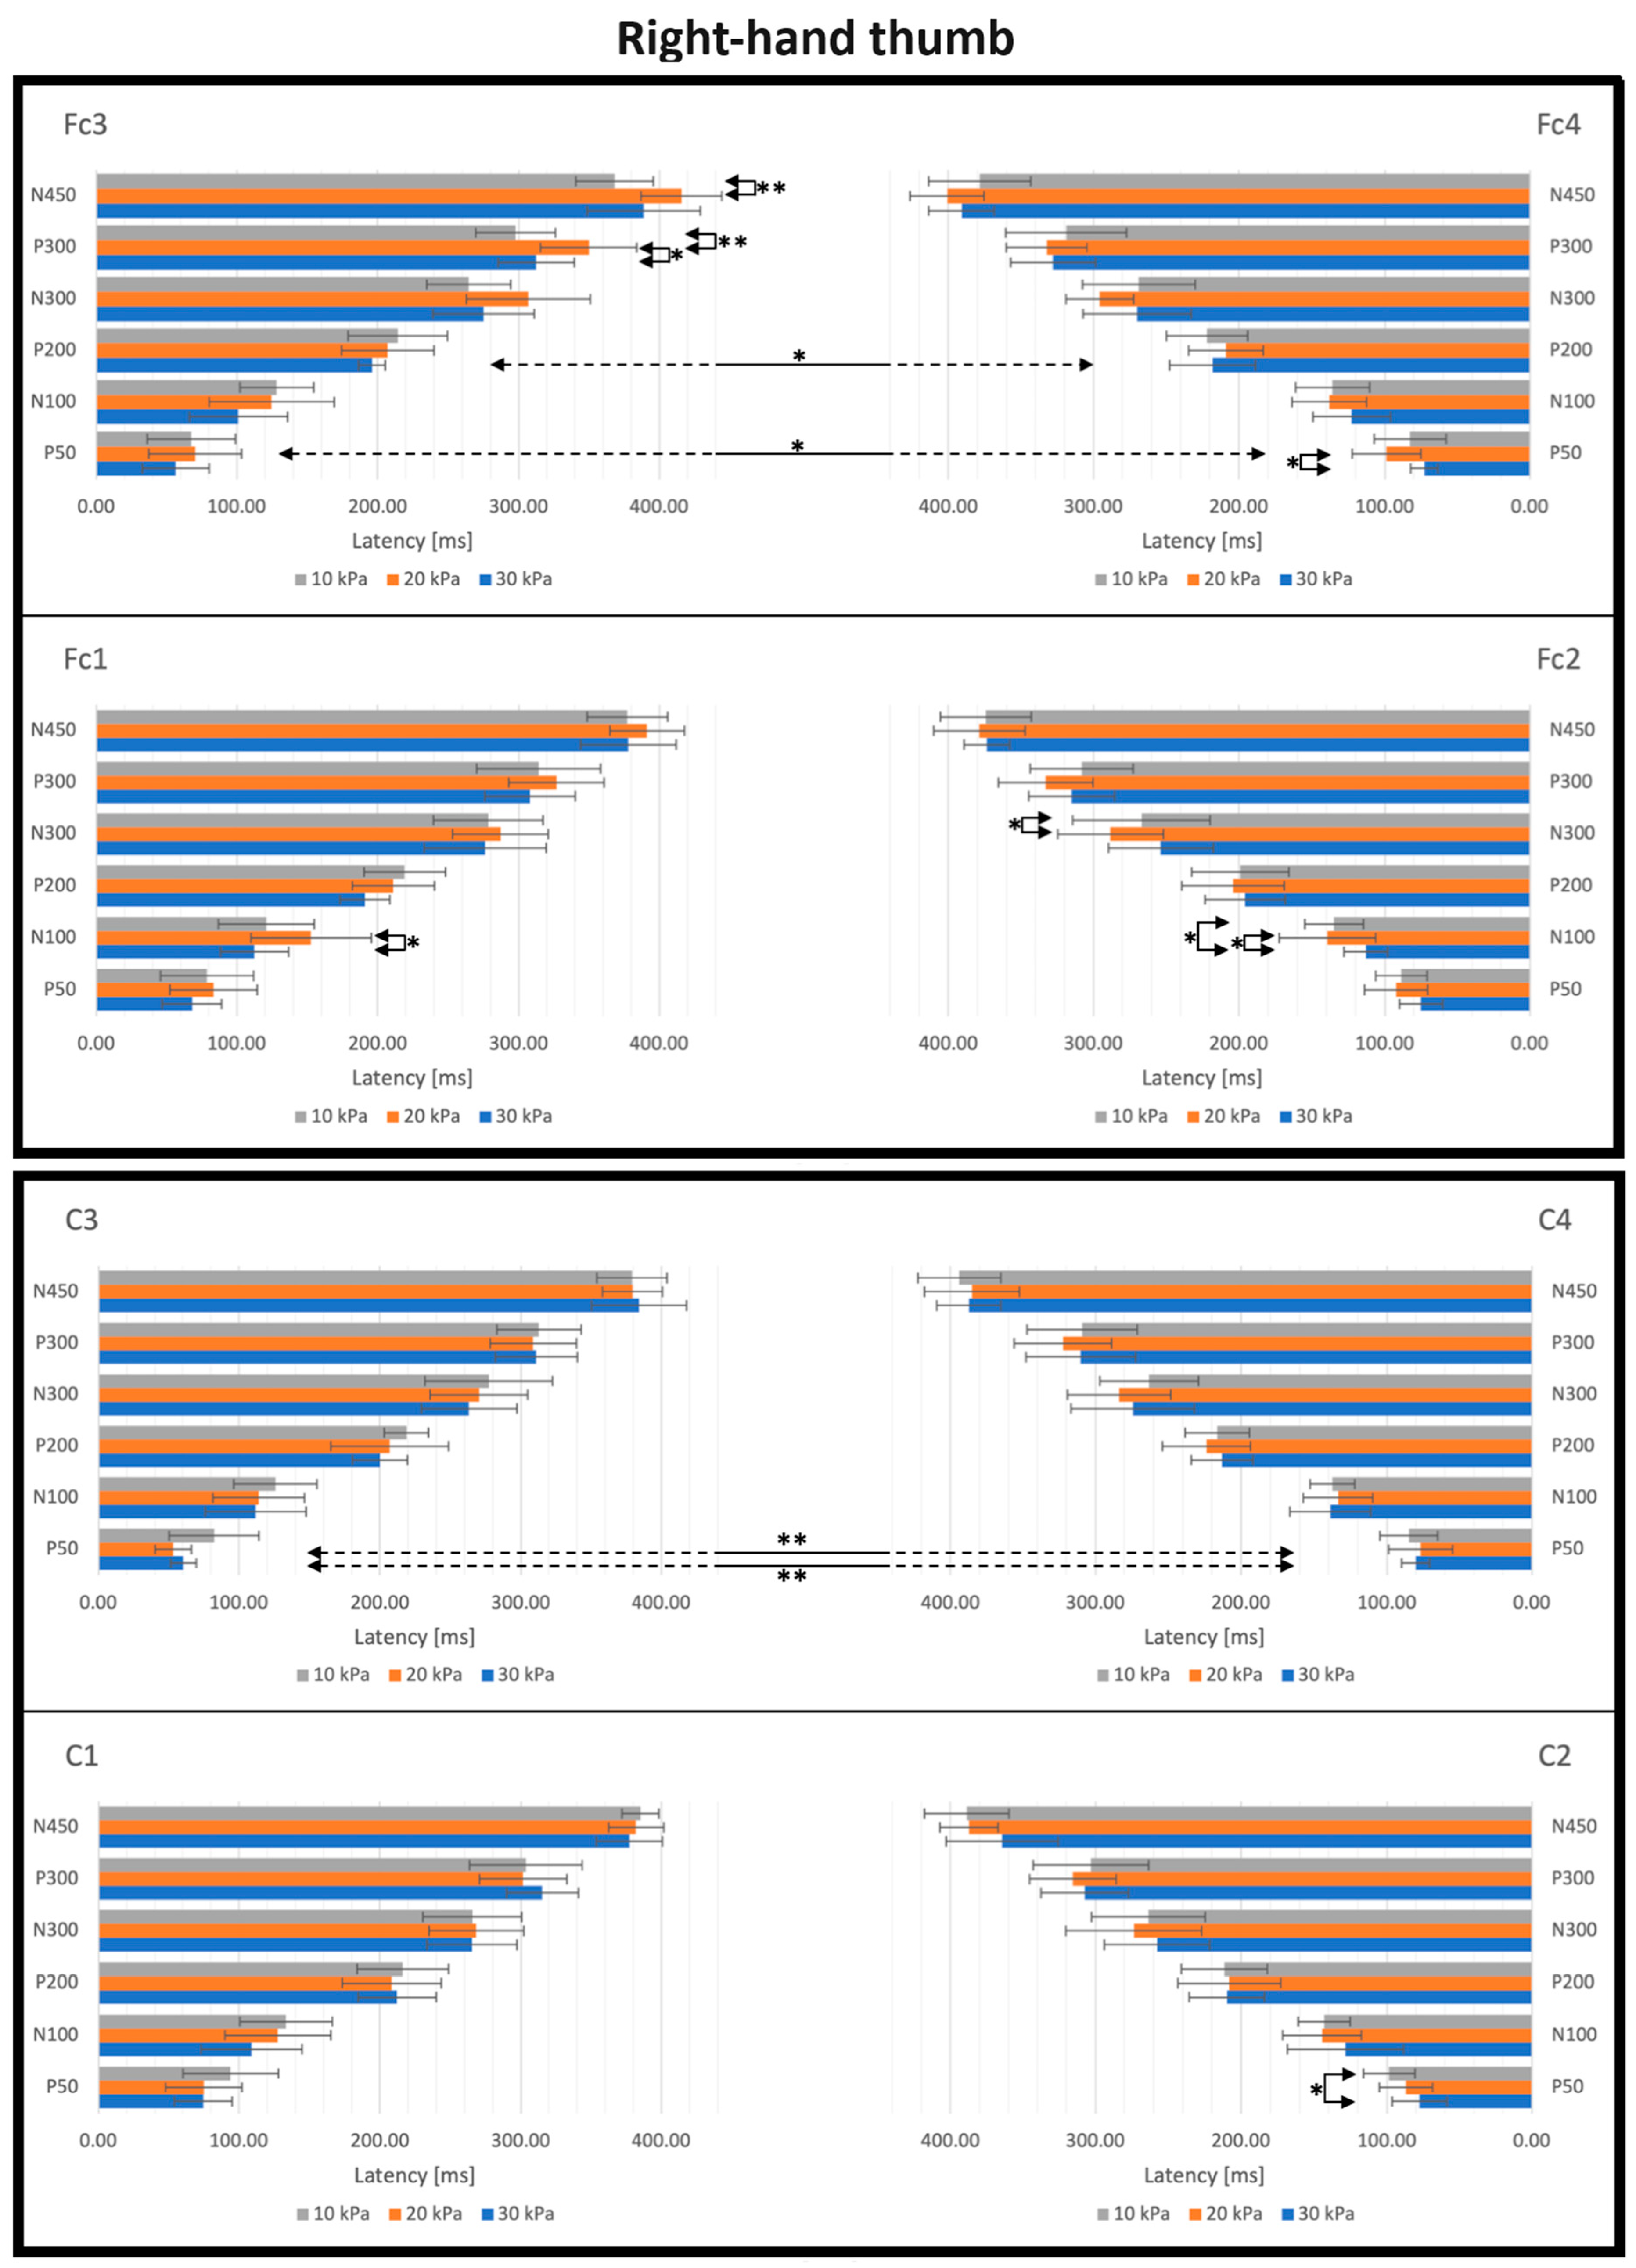
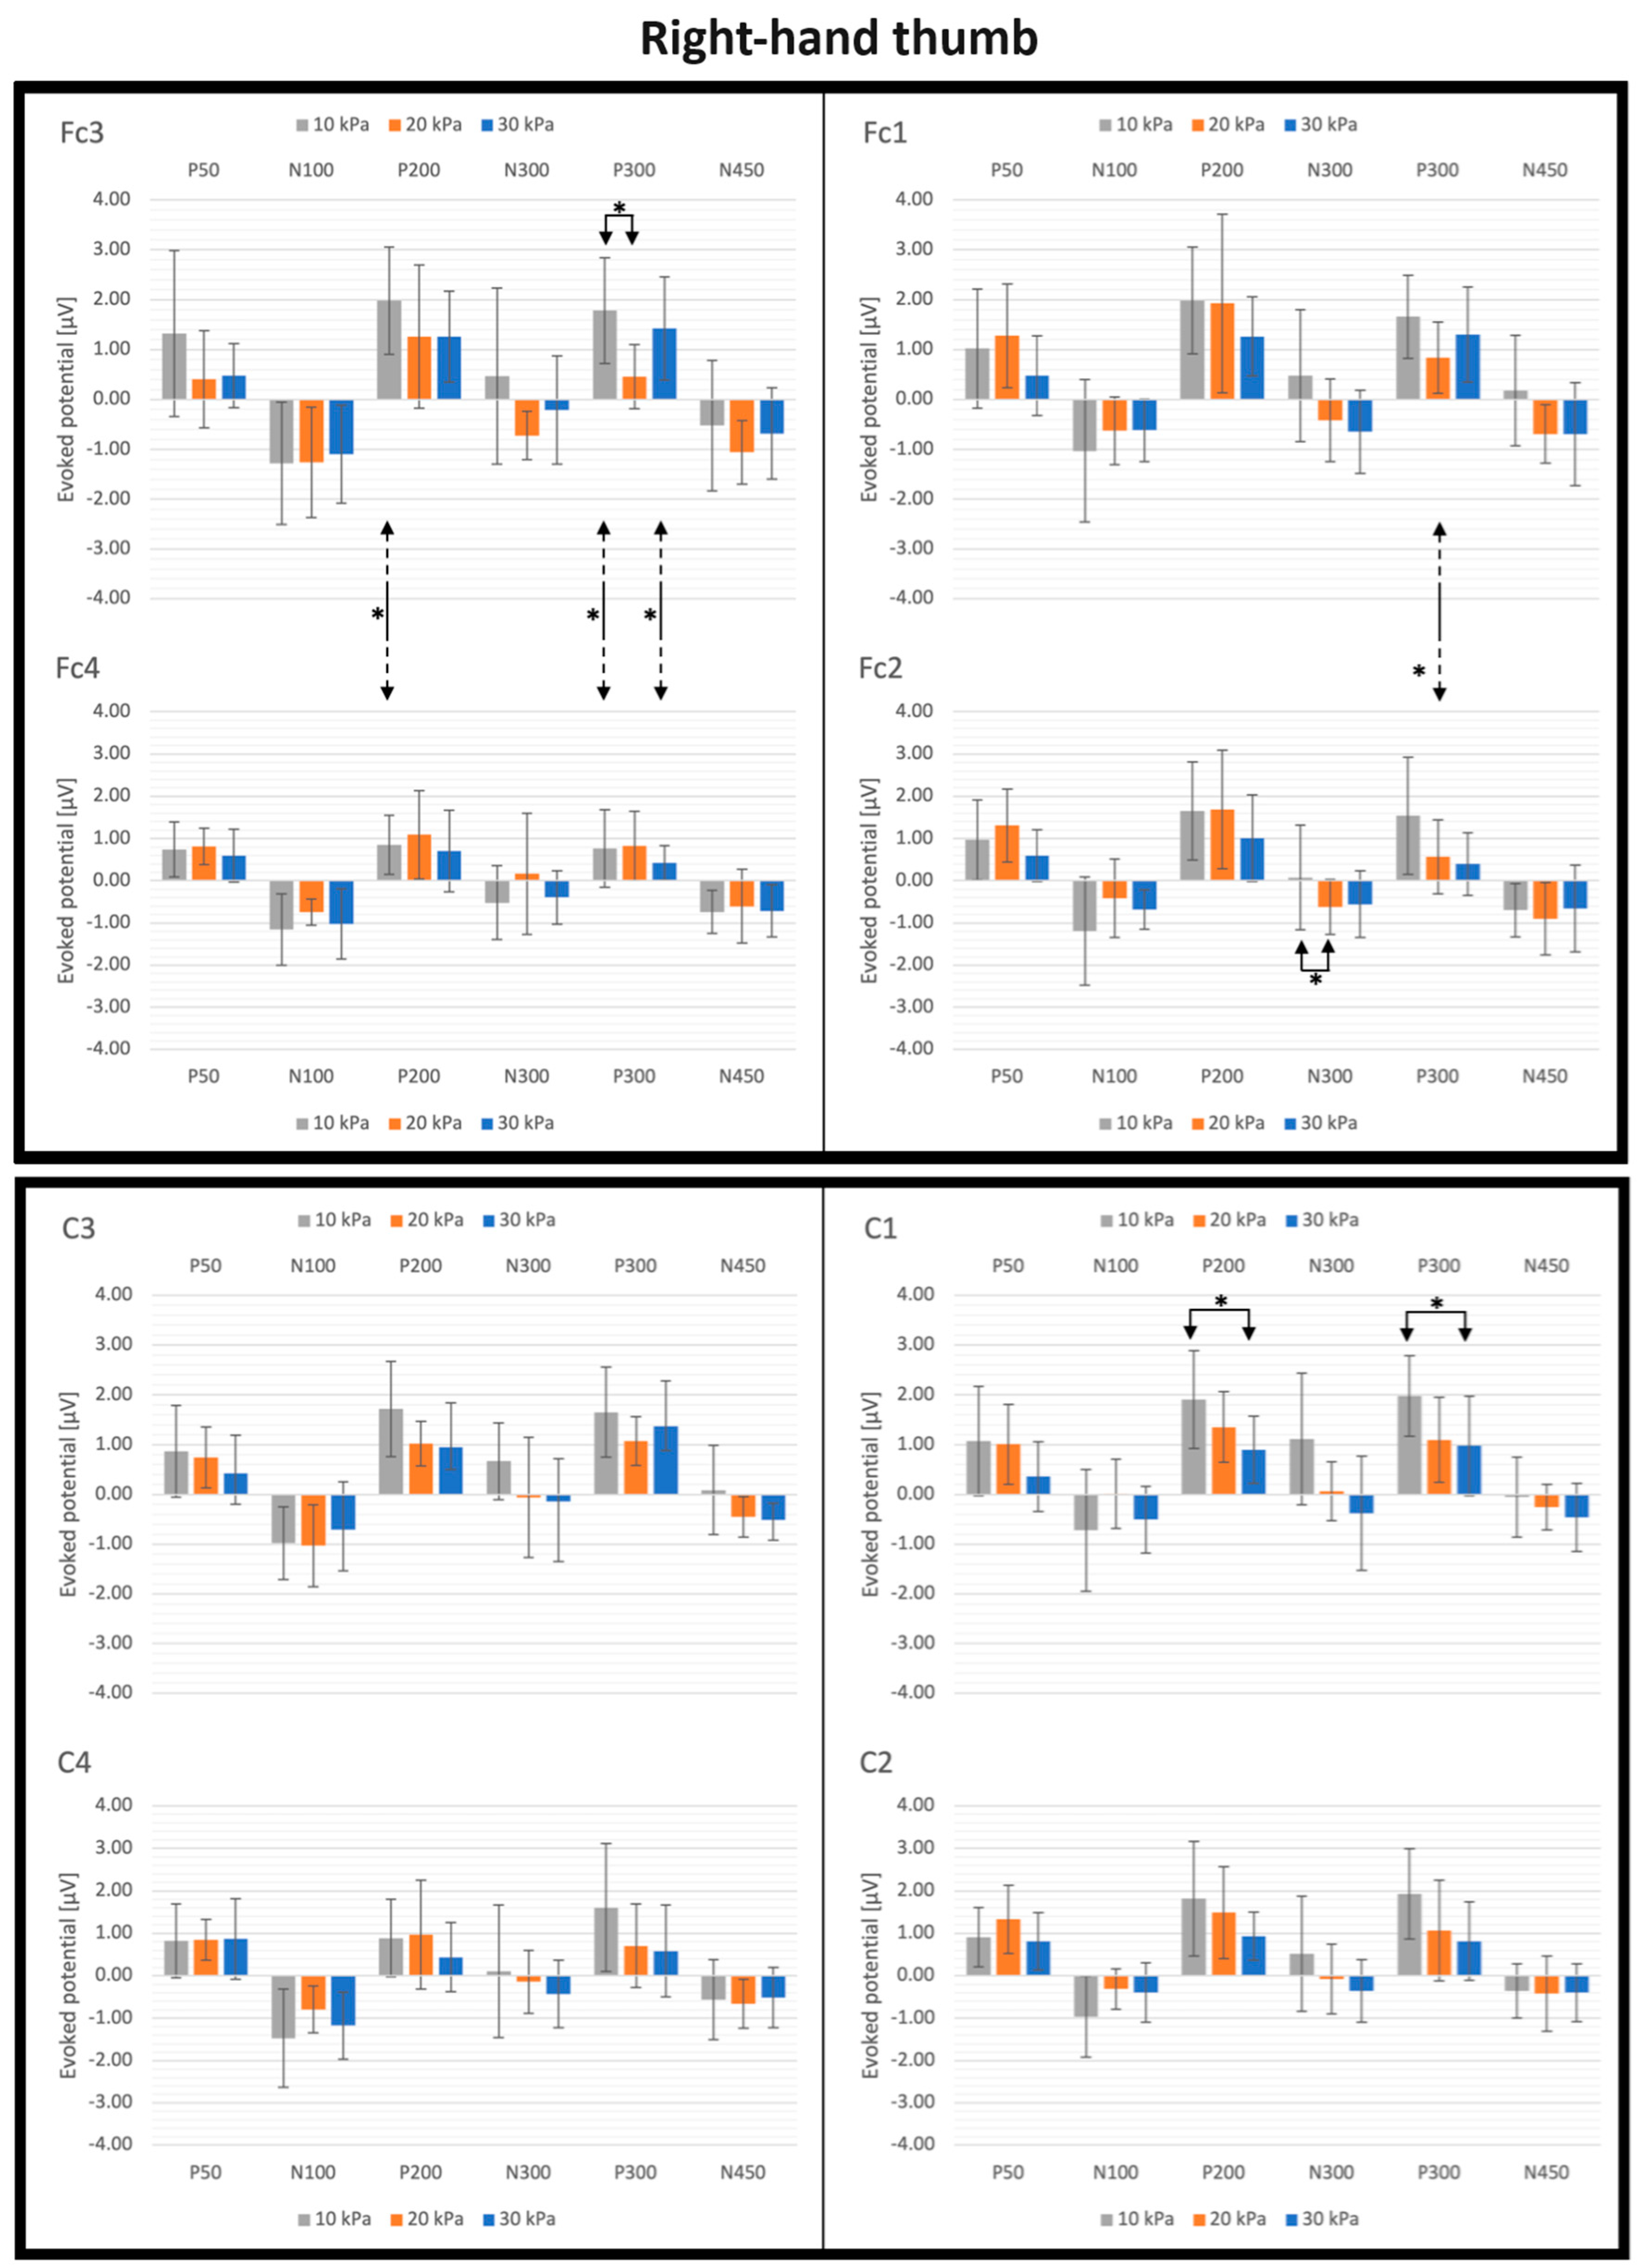
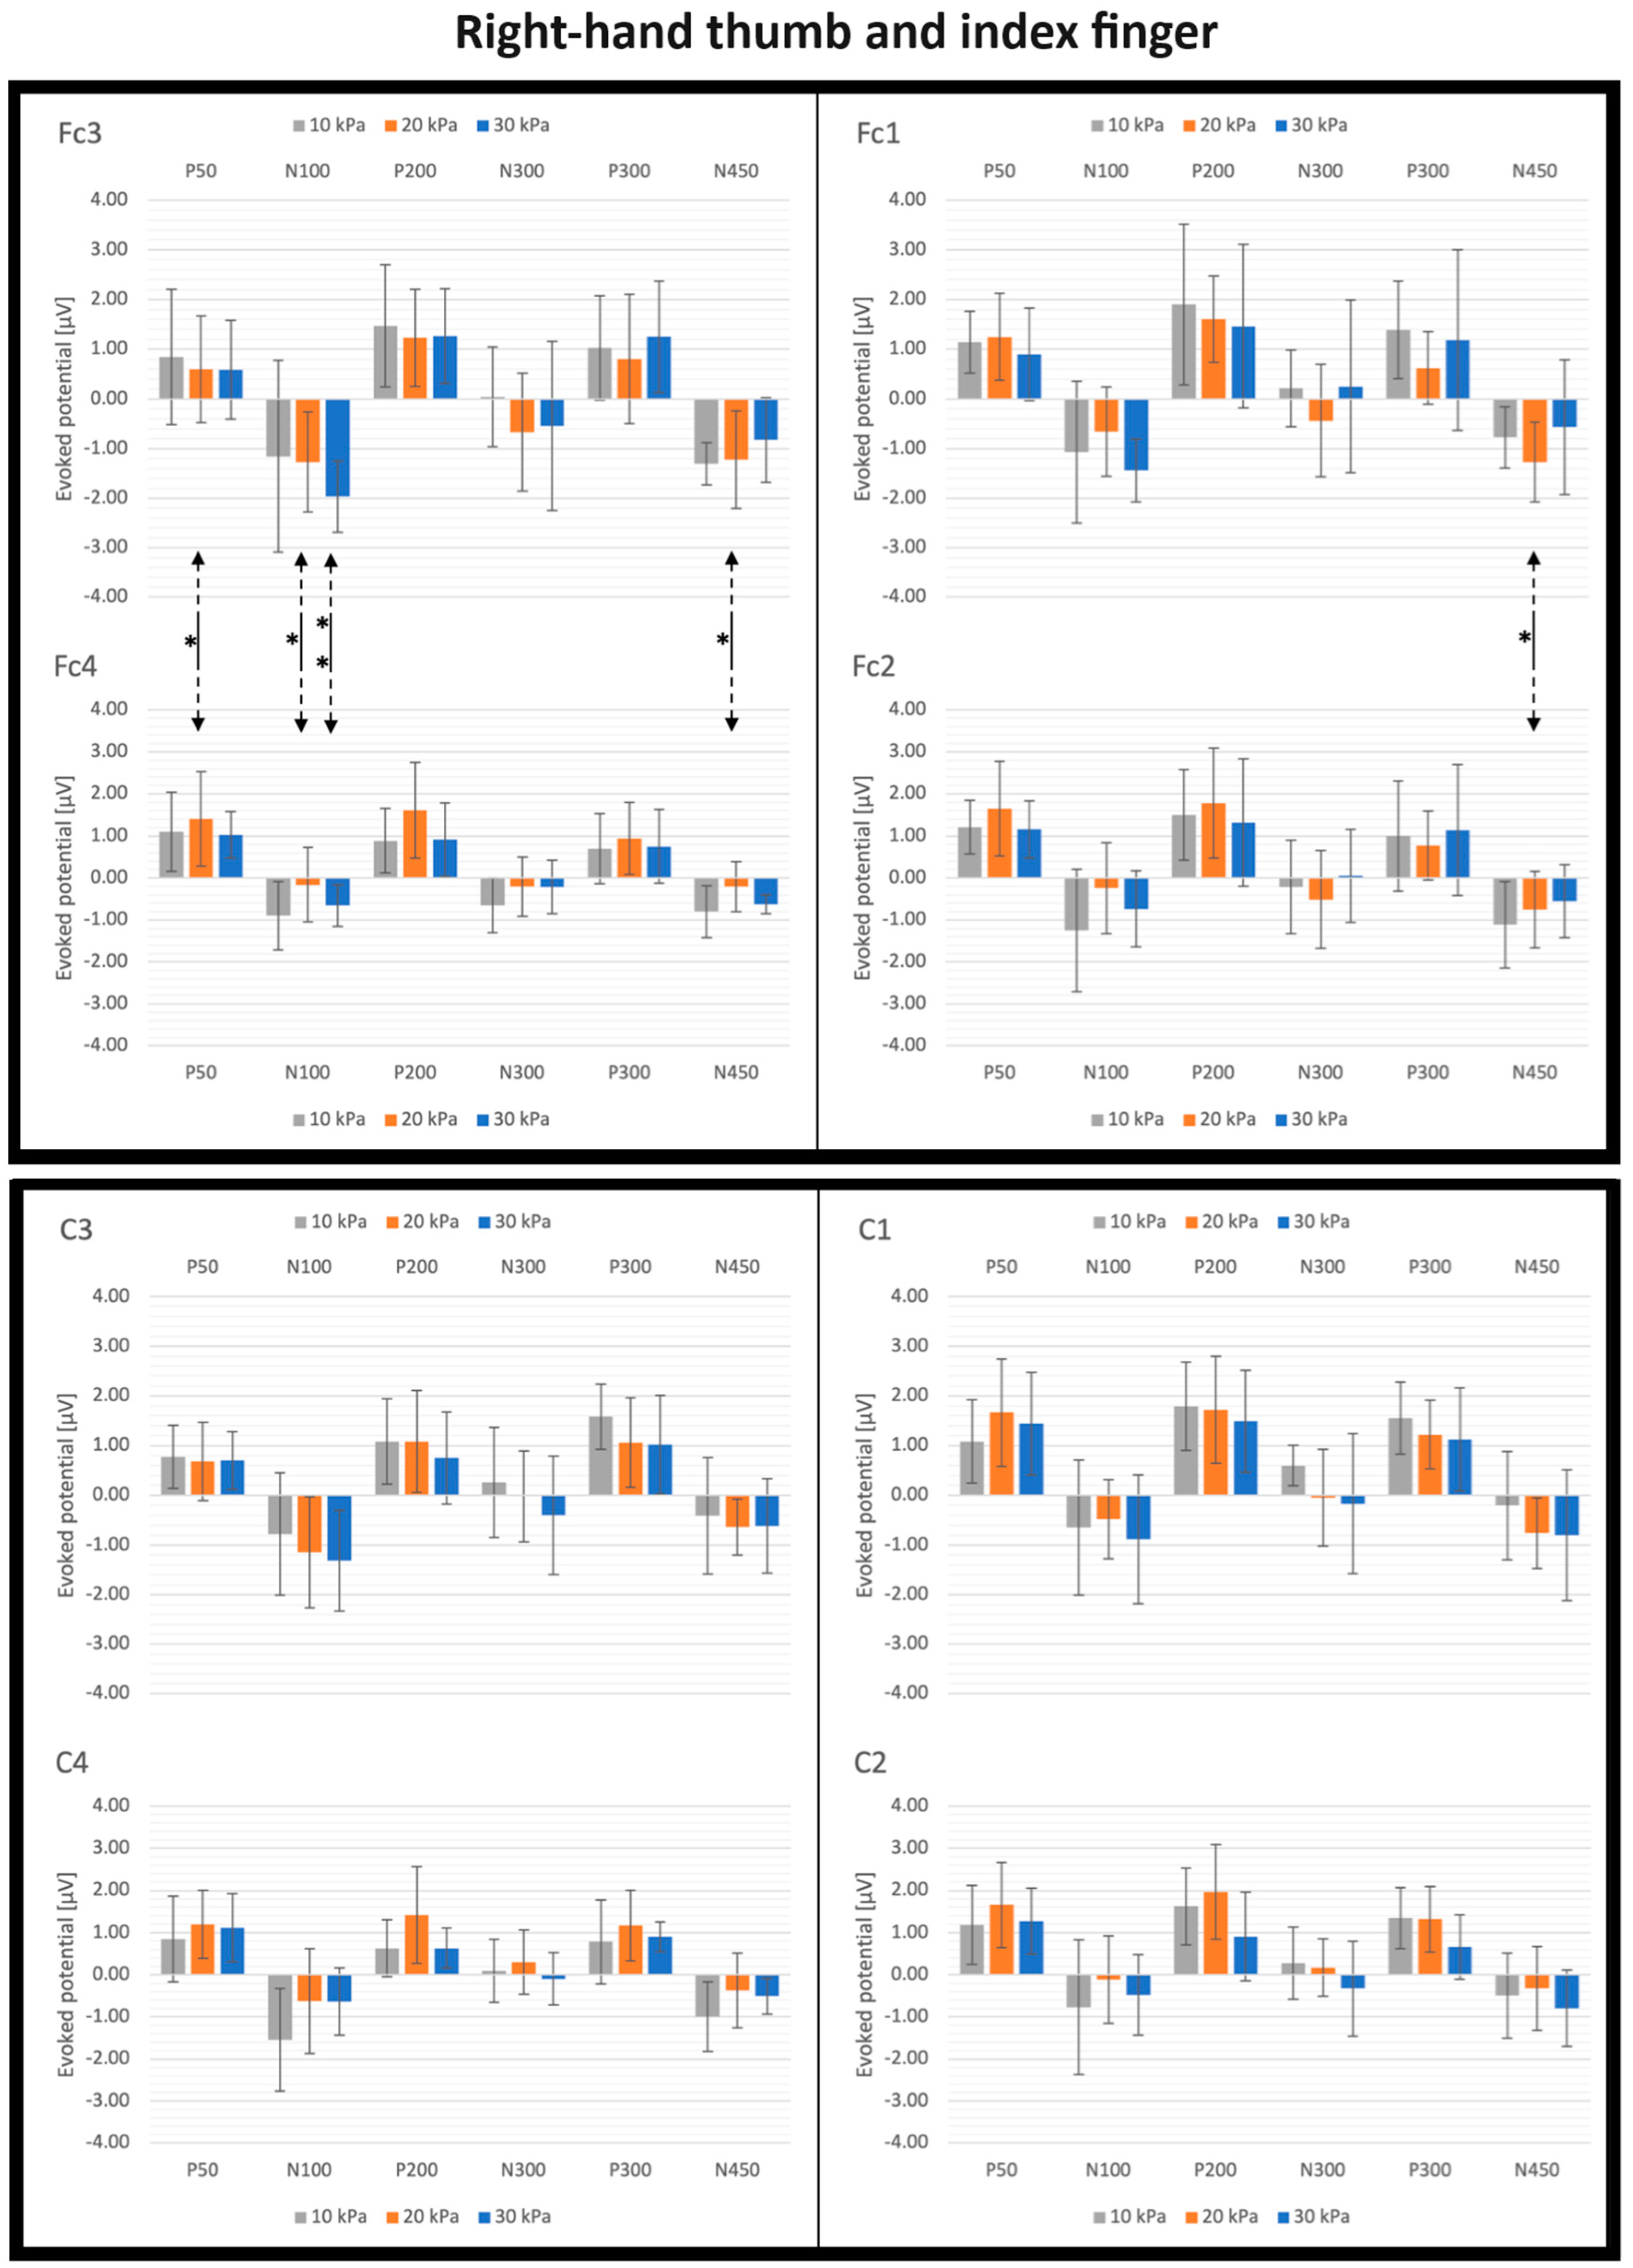
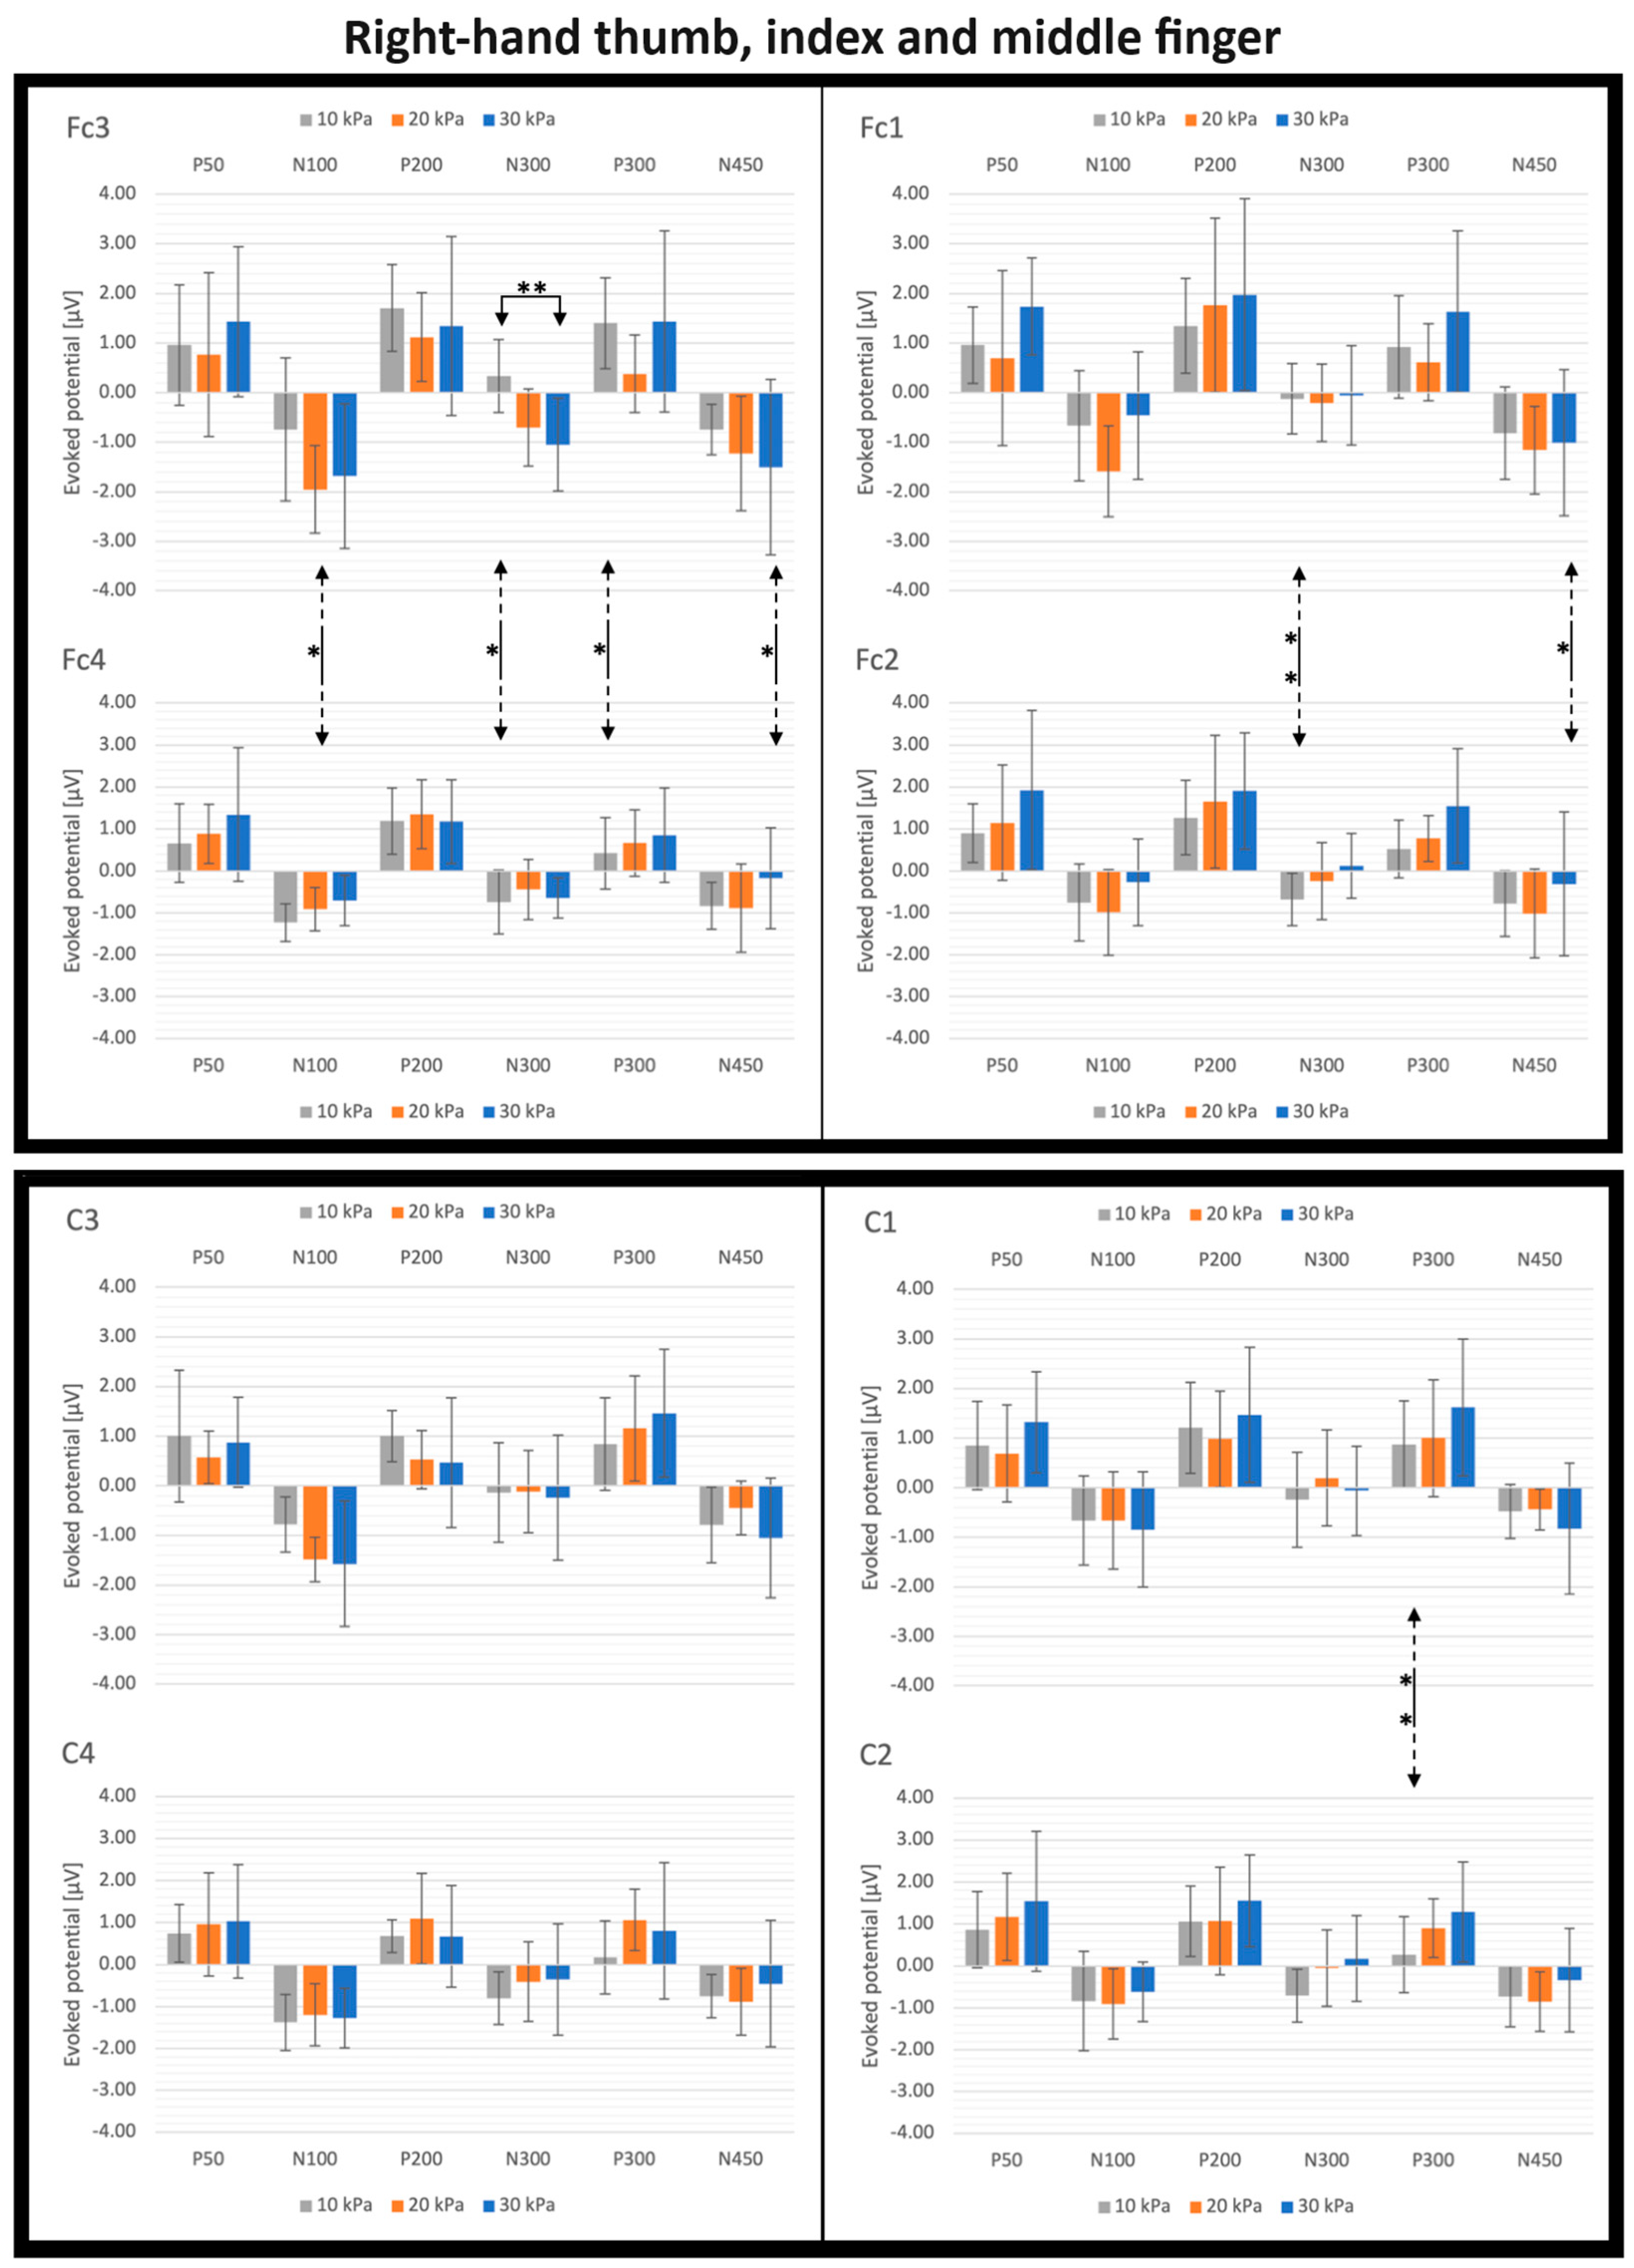
3.2. SEP Latencies and Amplitudes as Functions of Tactile Pressure Intensity
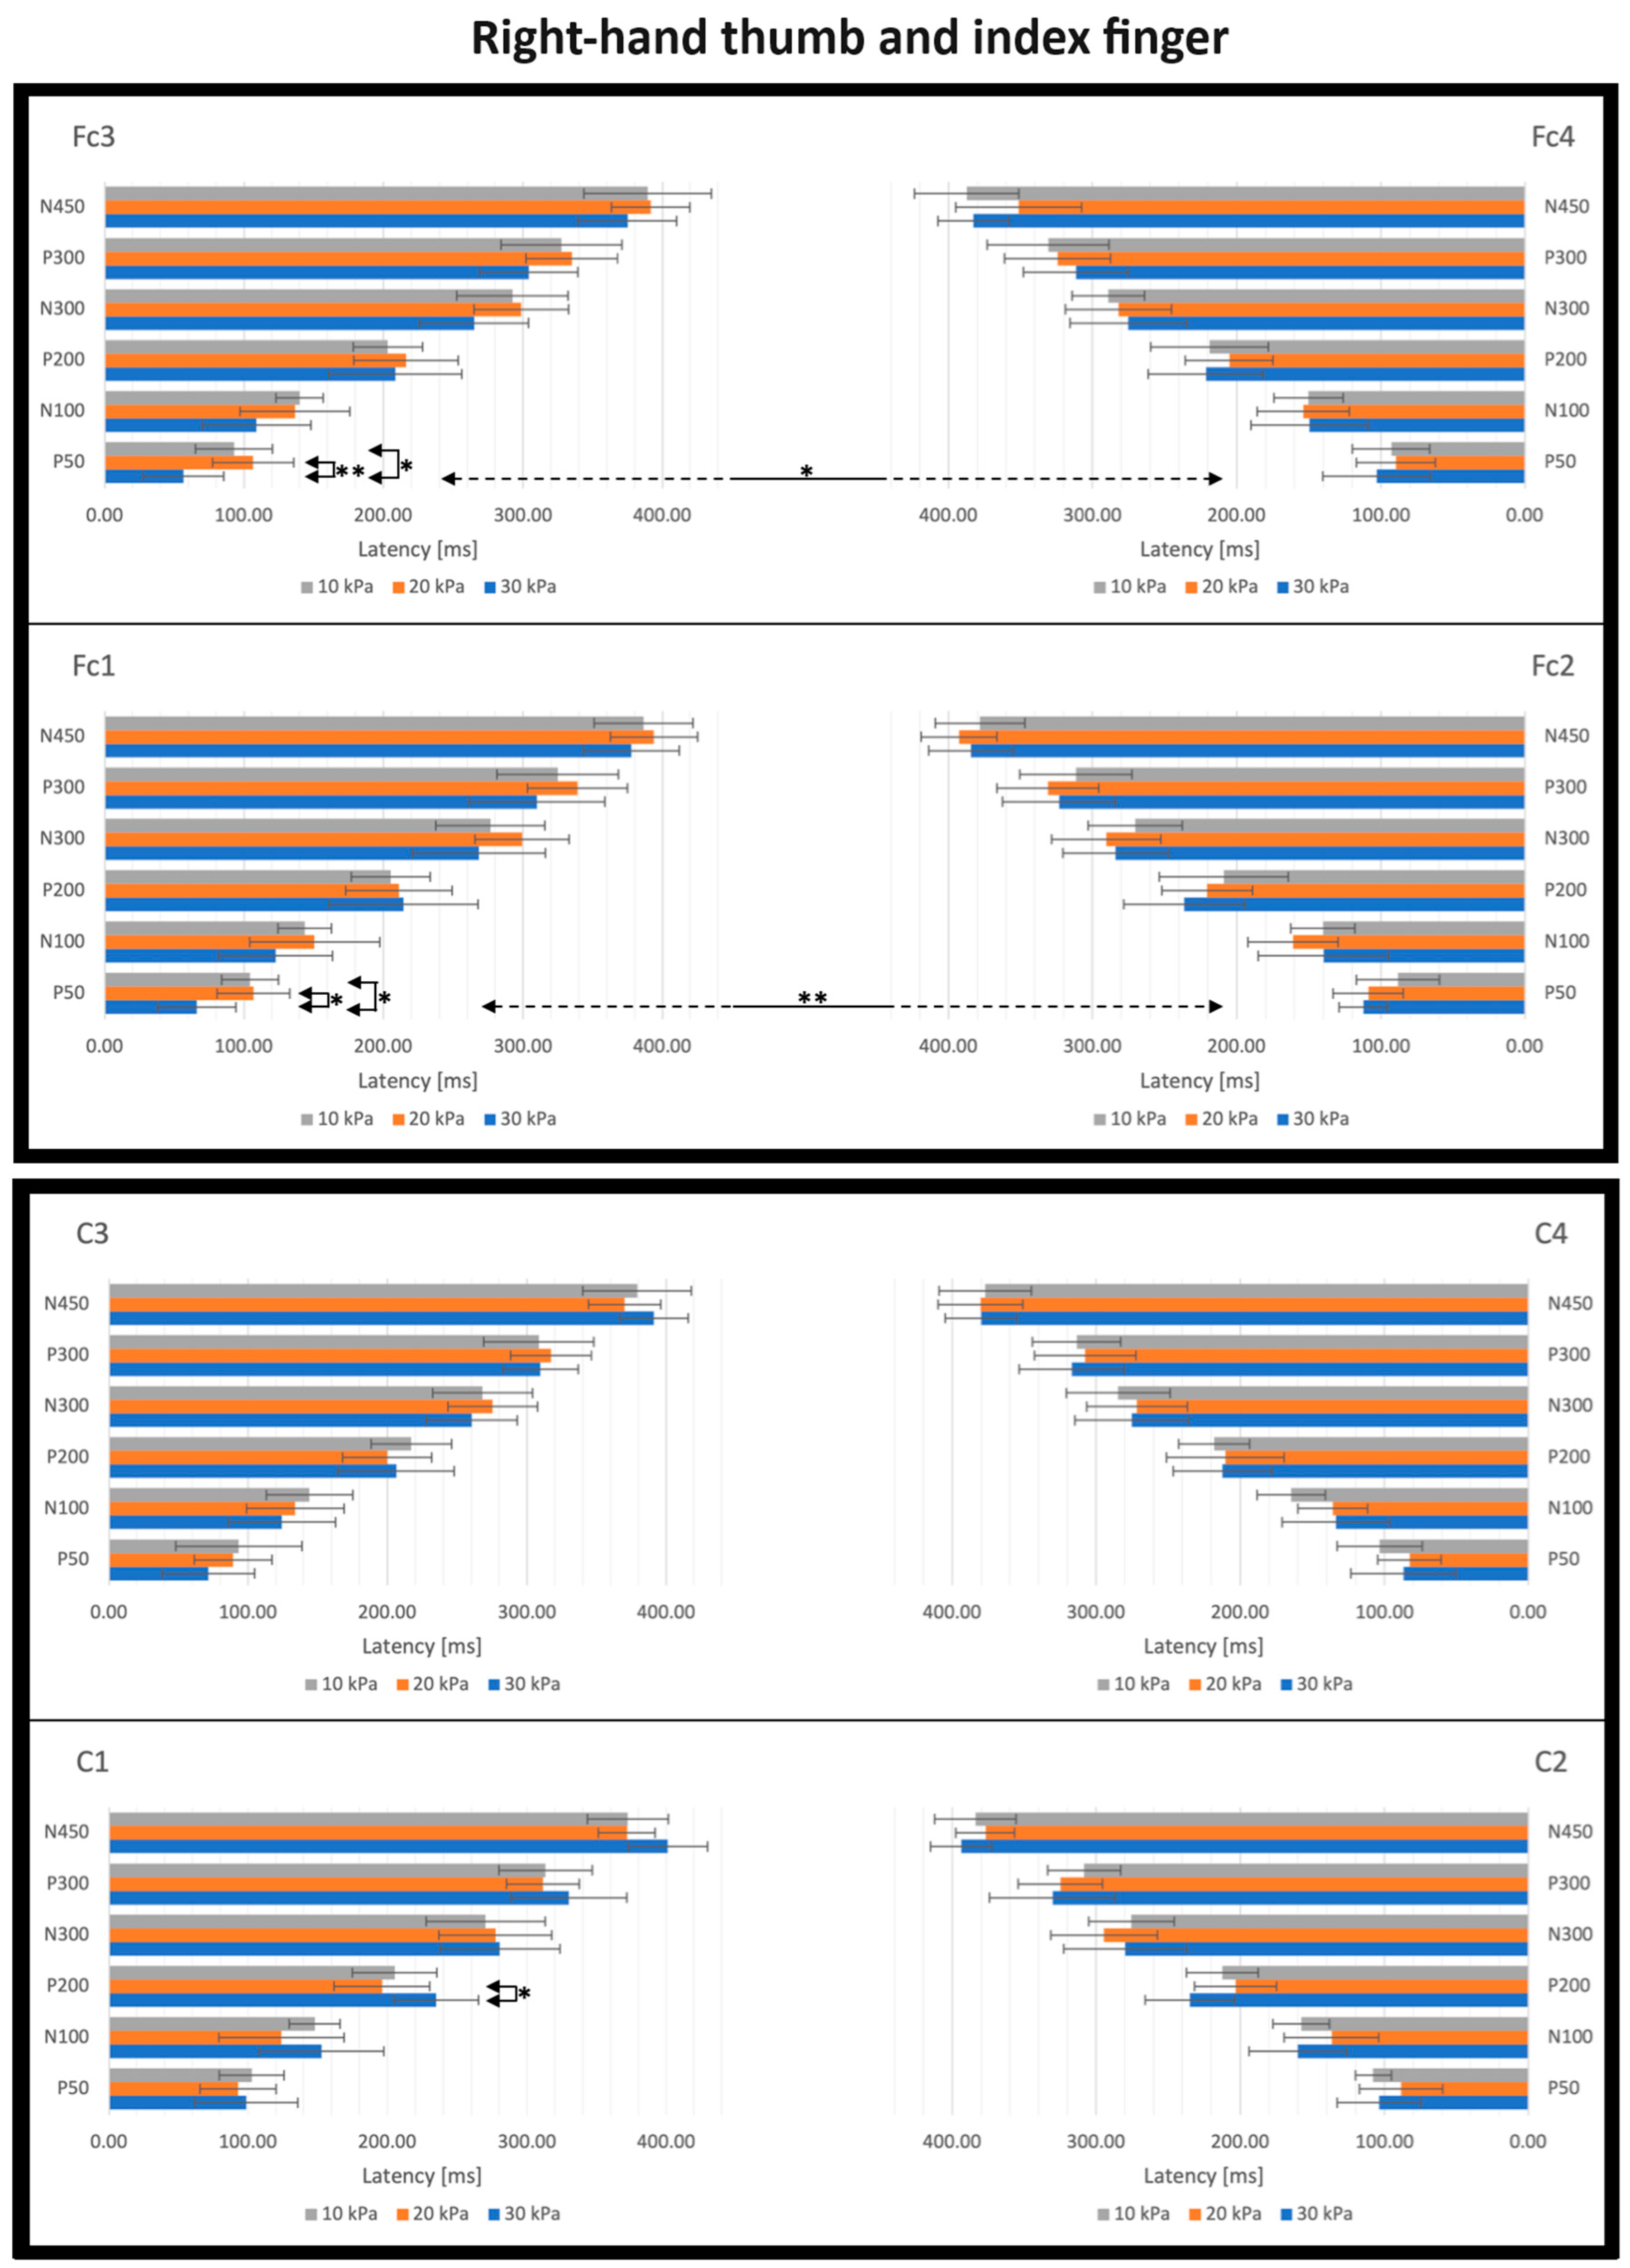
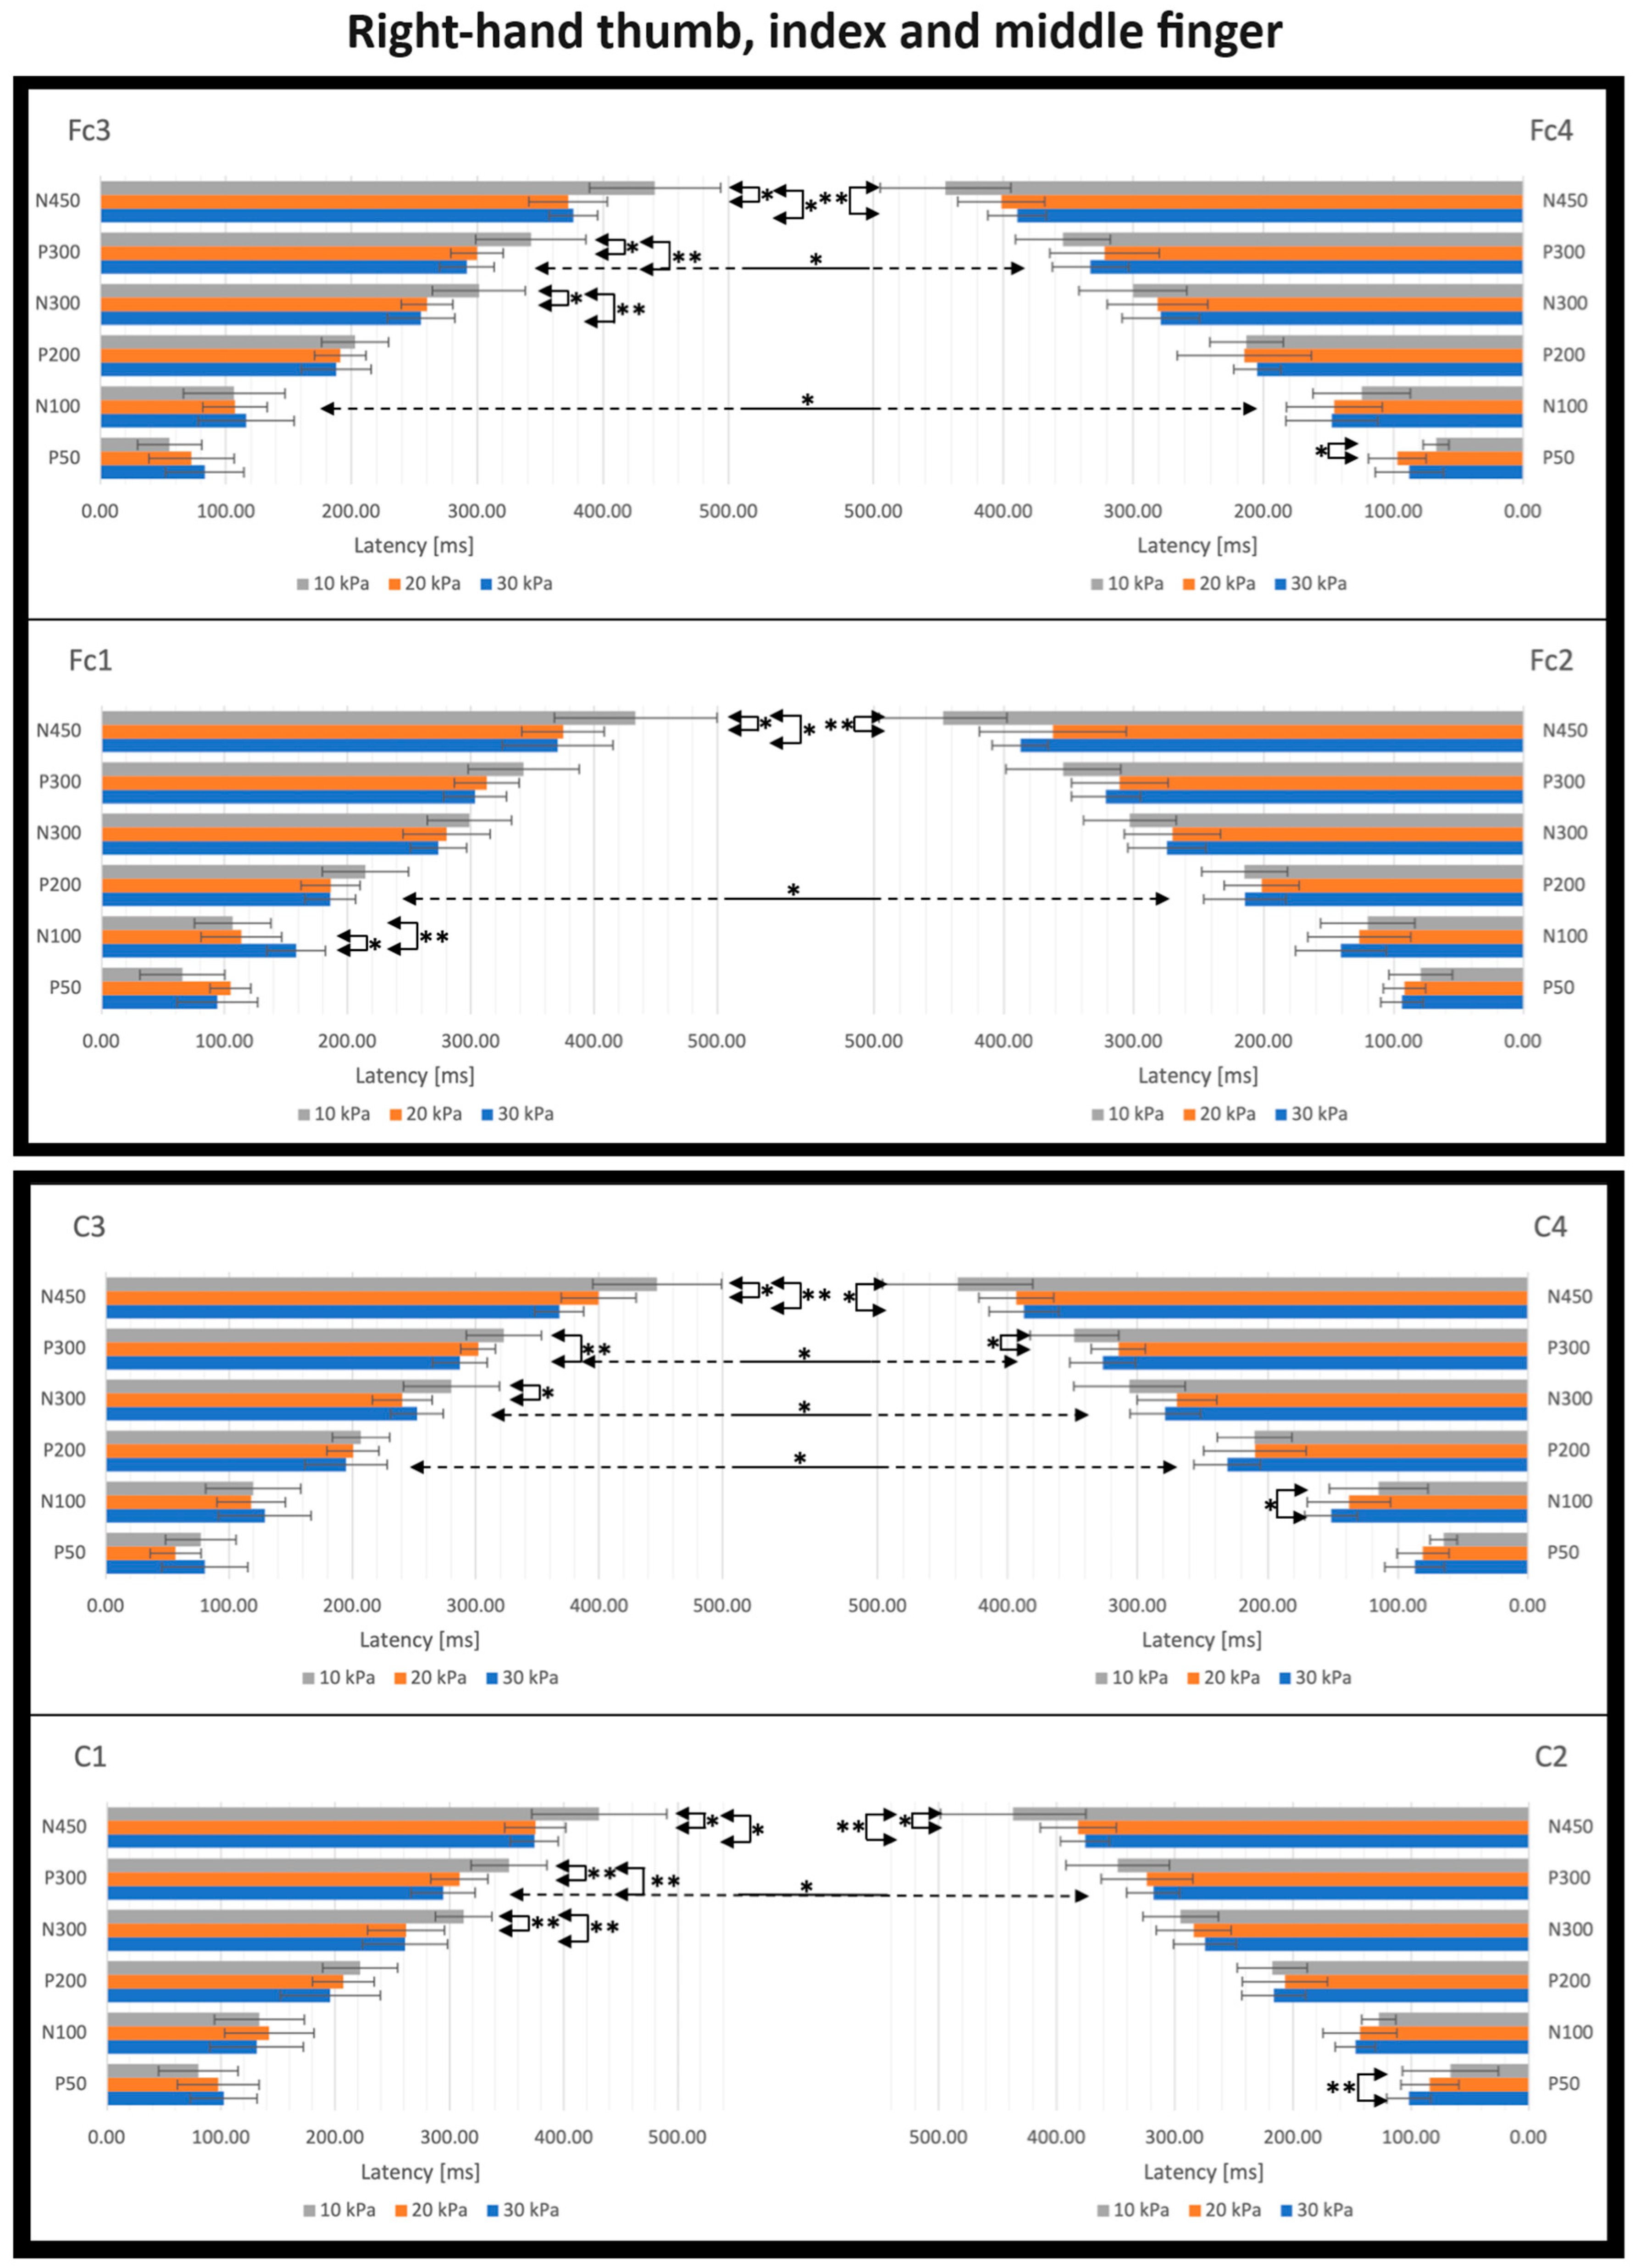
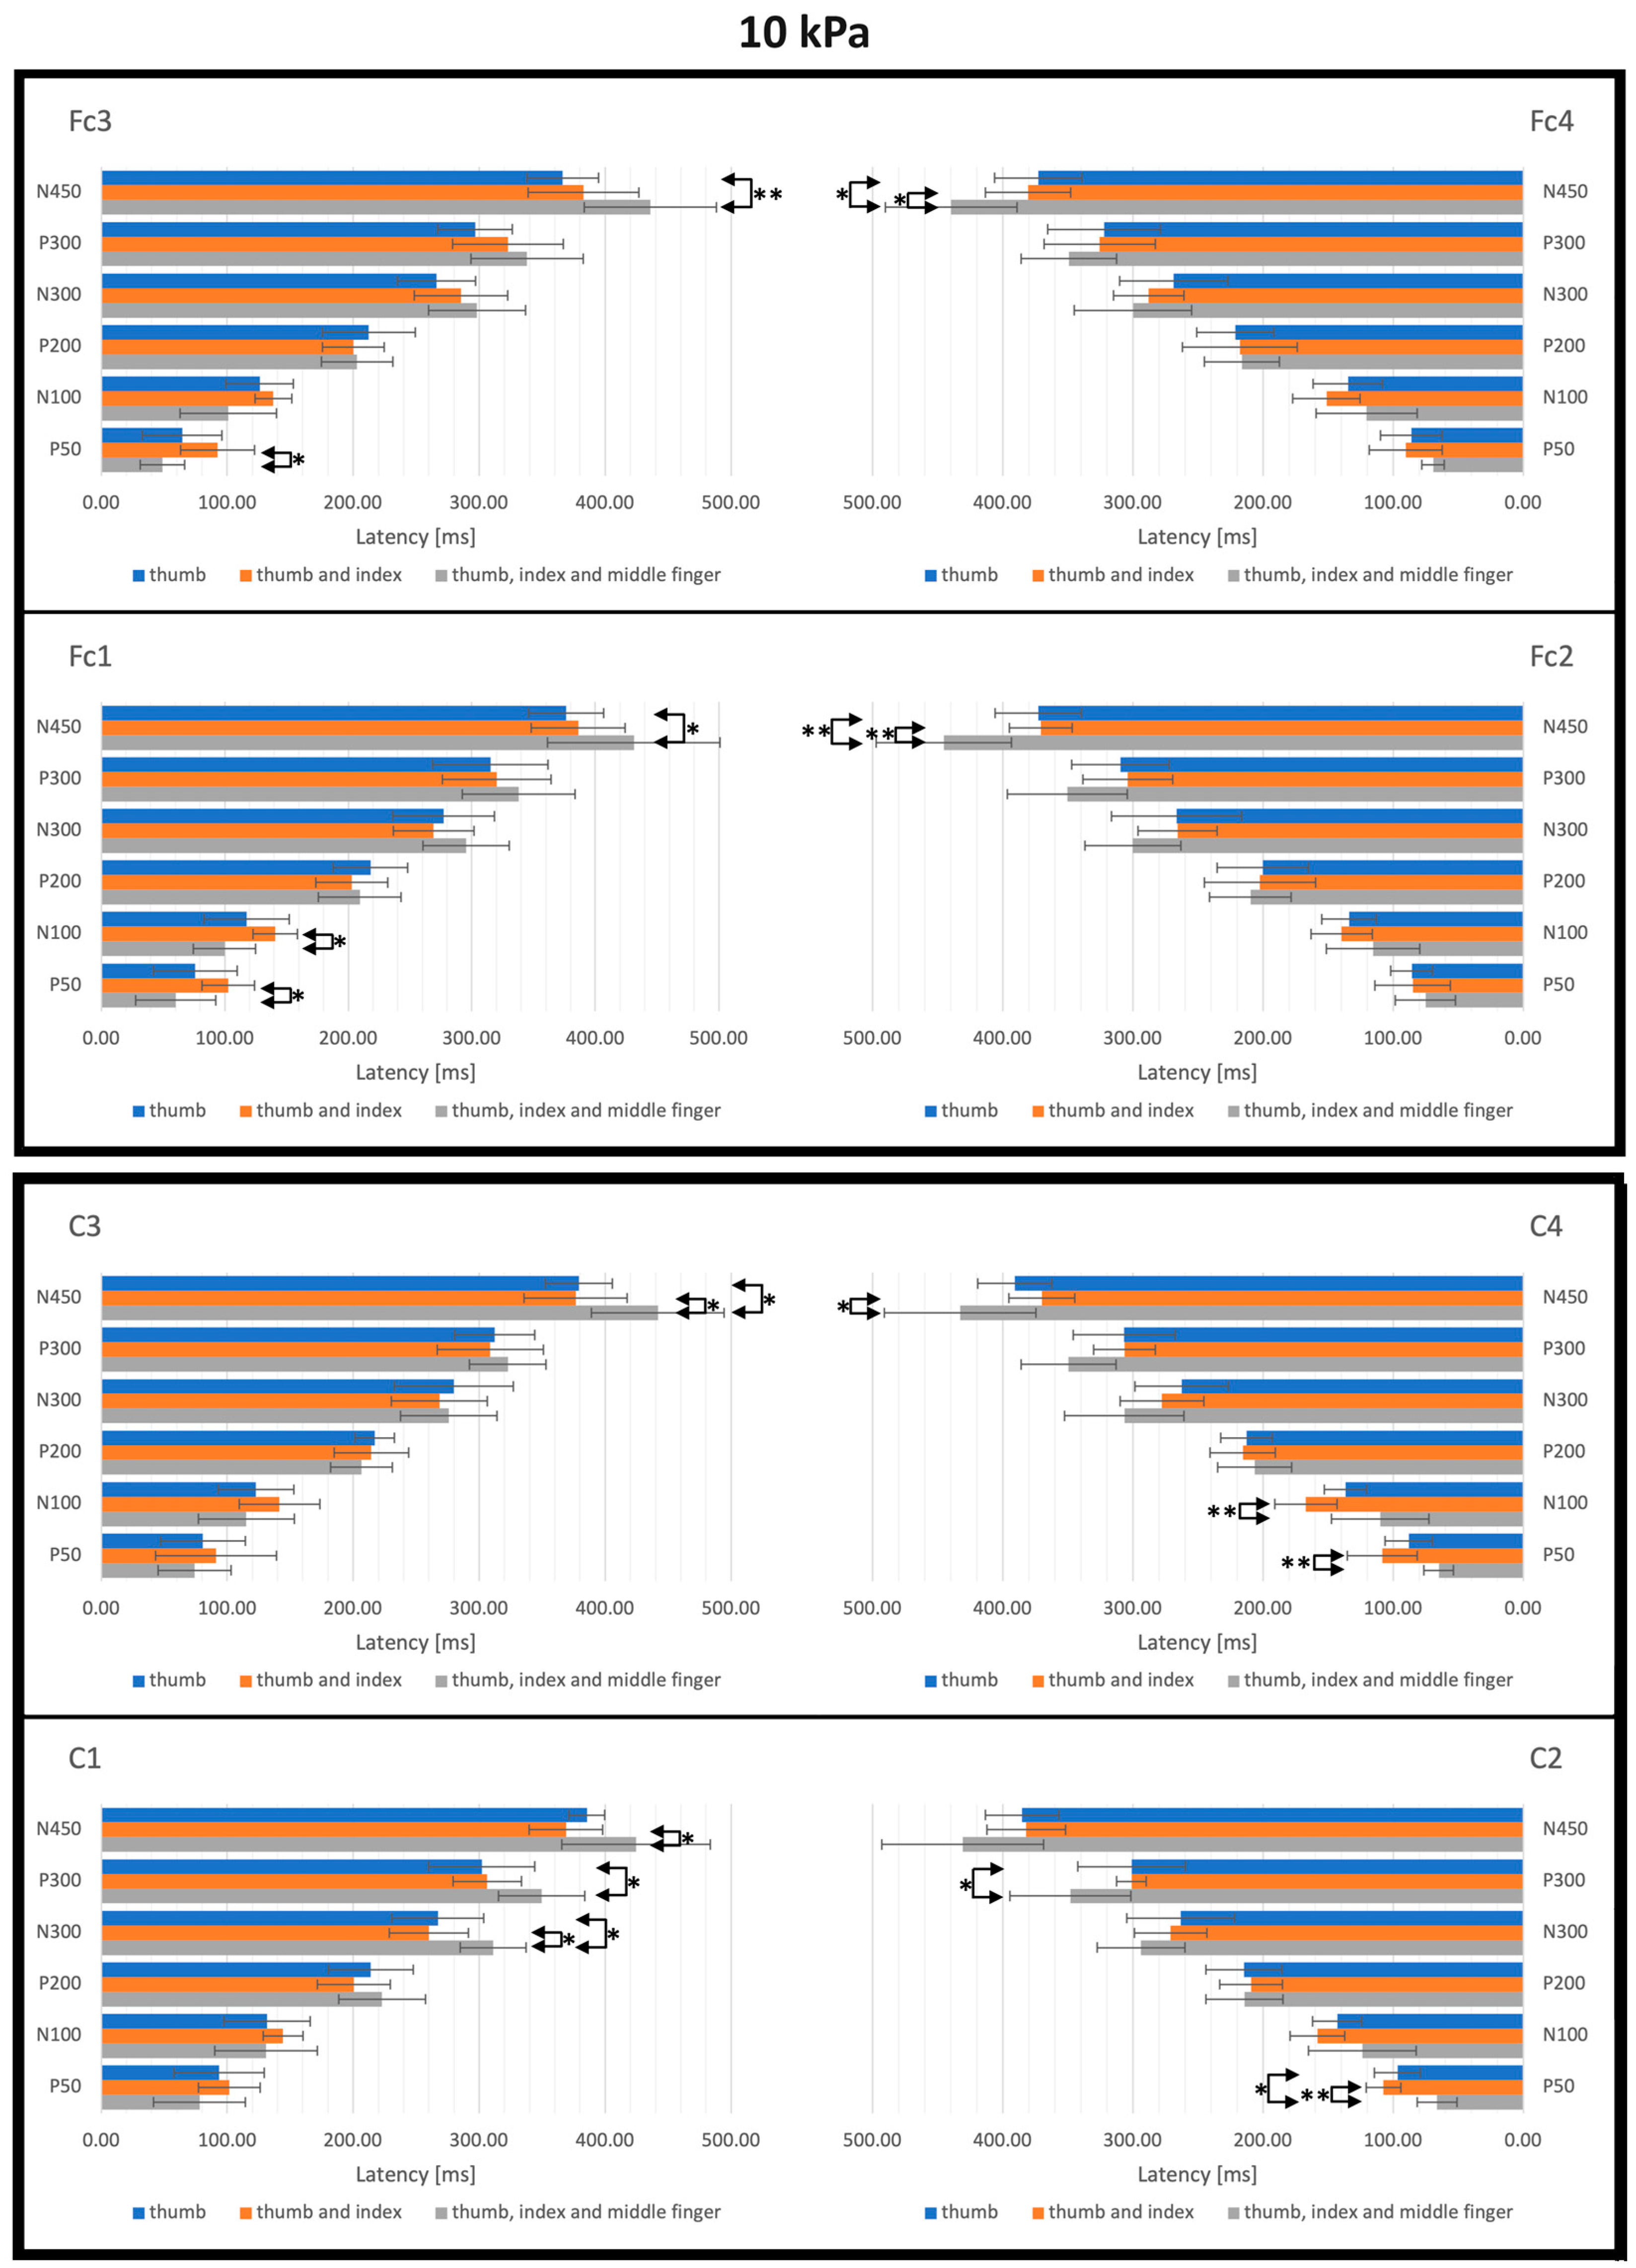
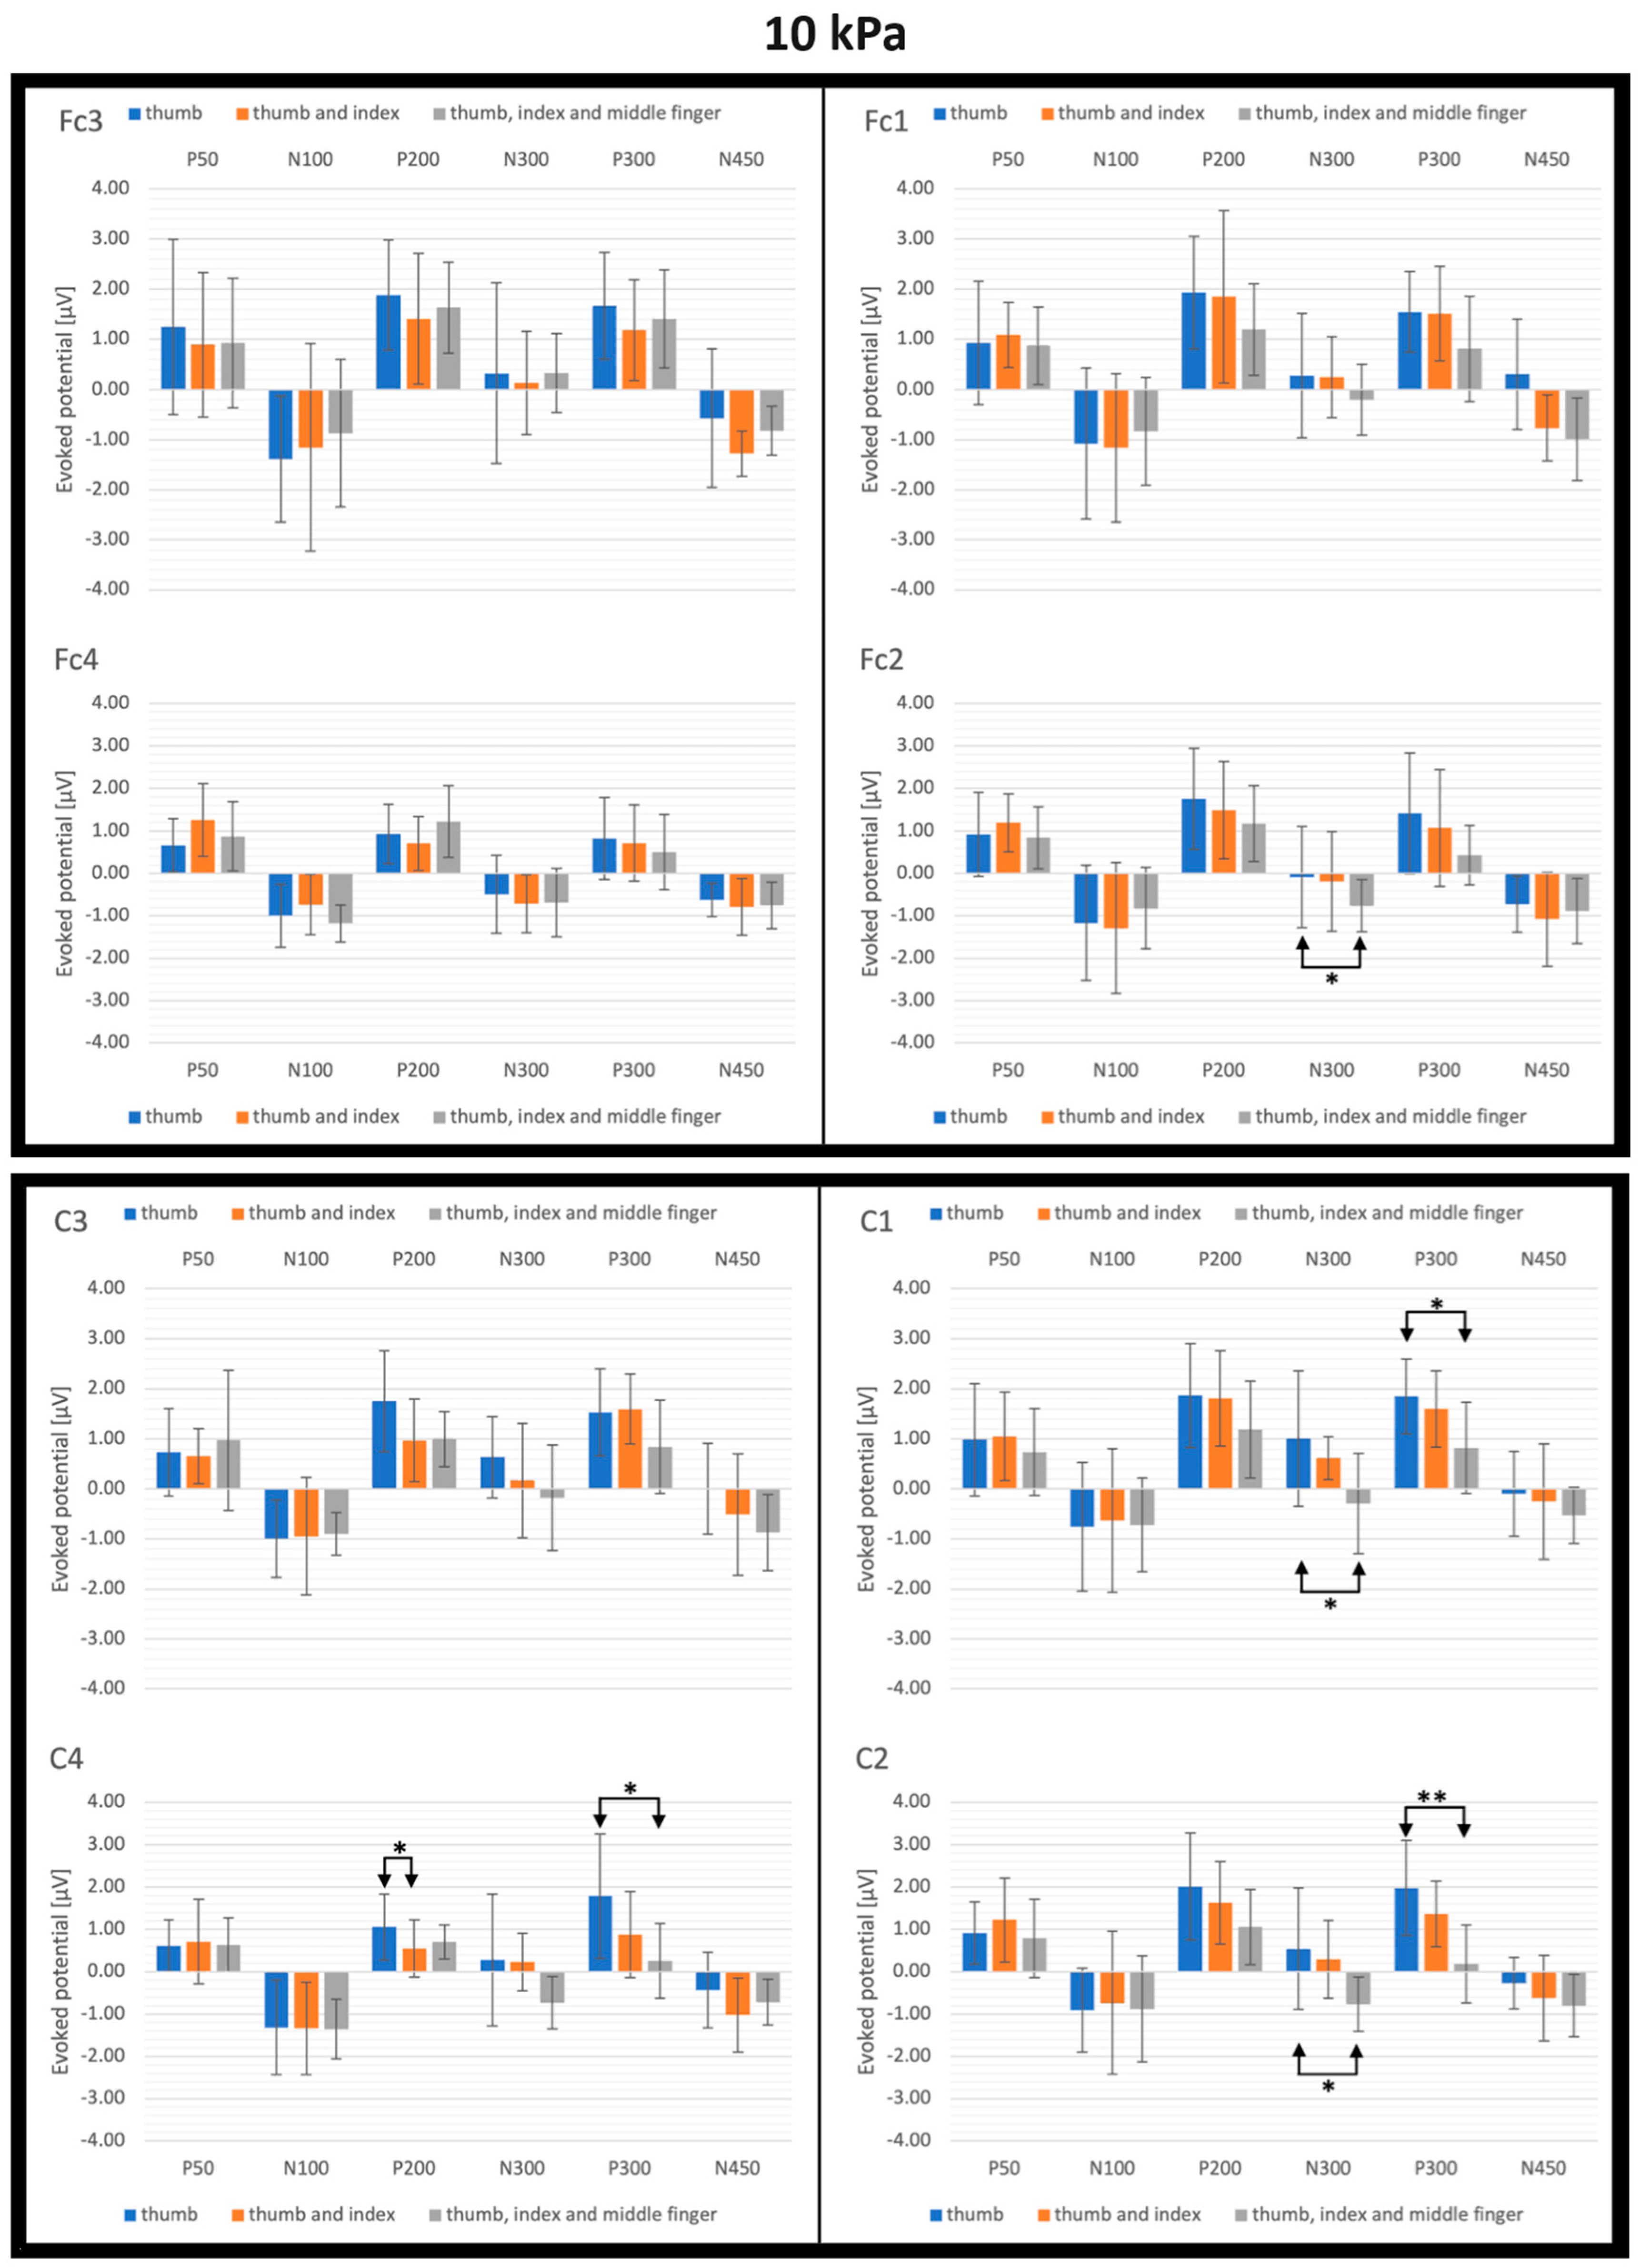
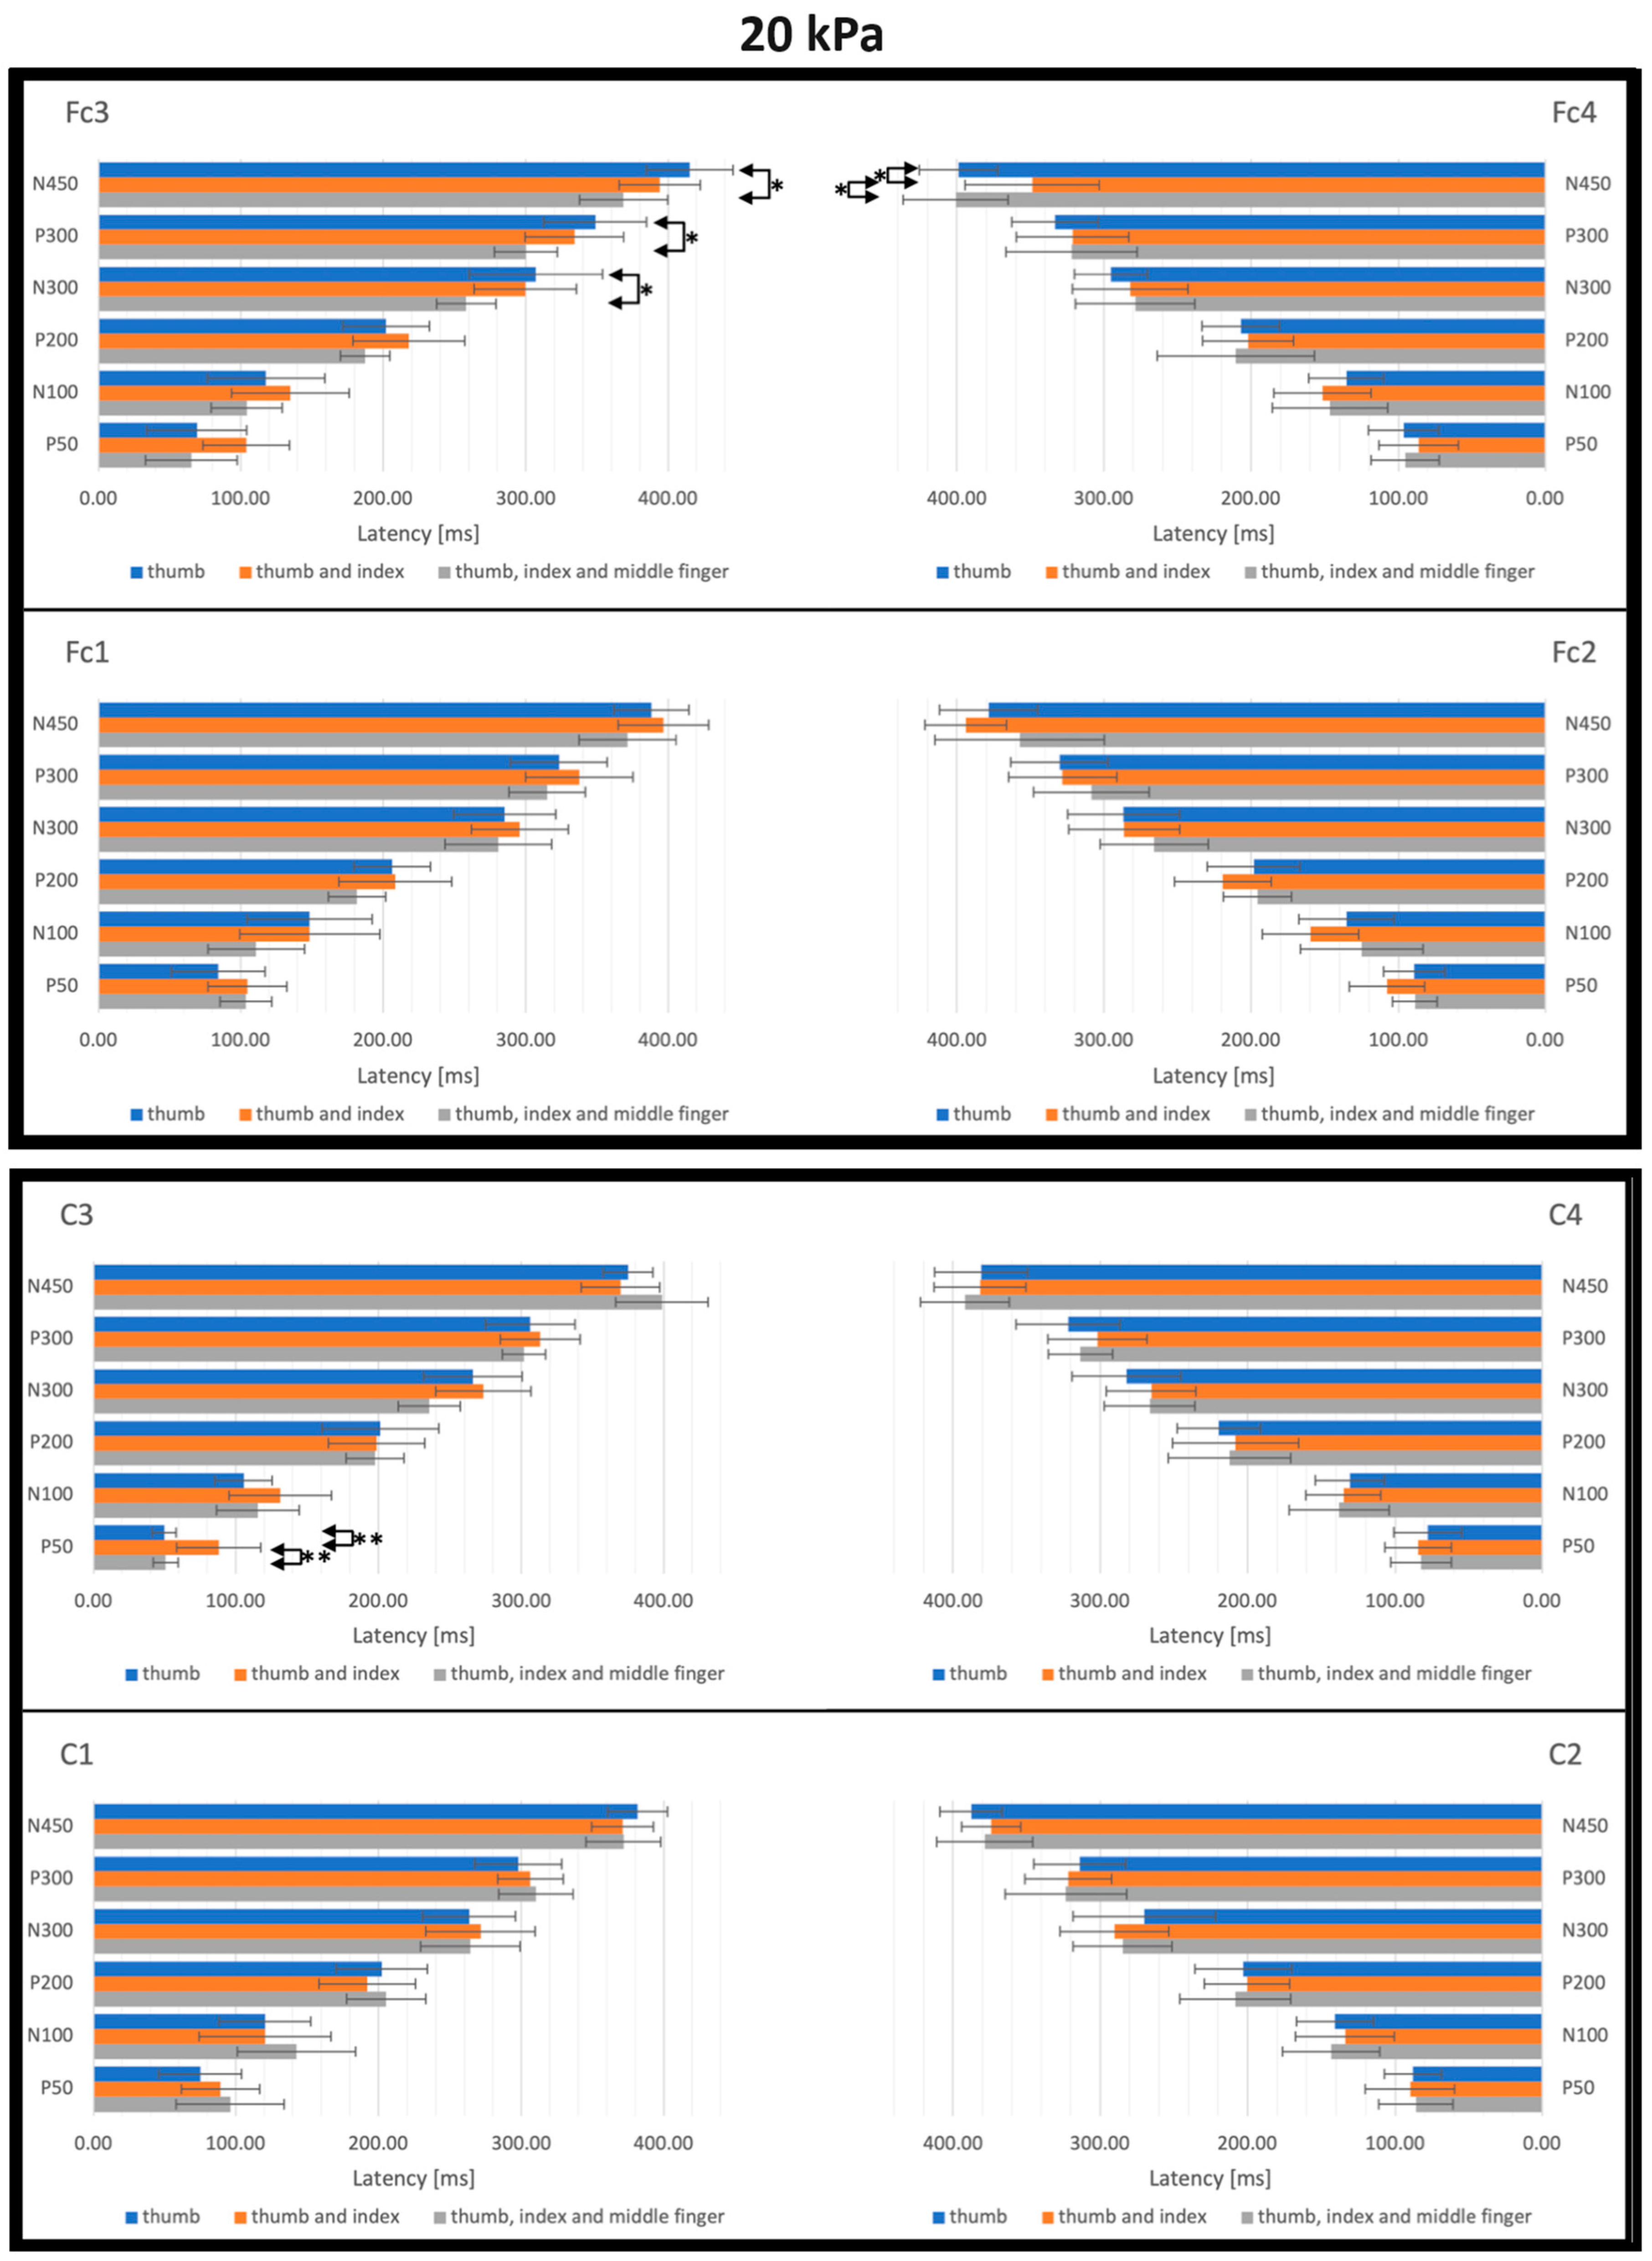
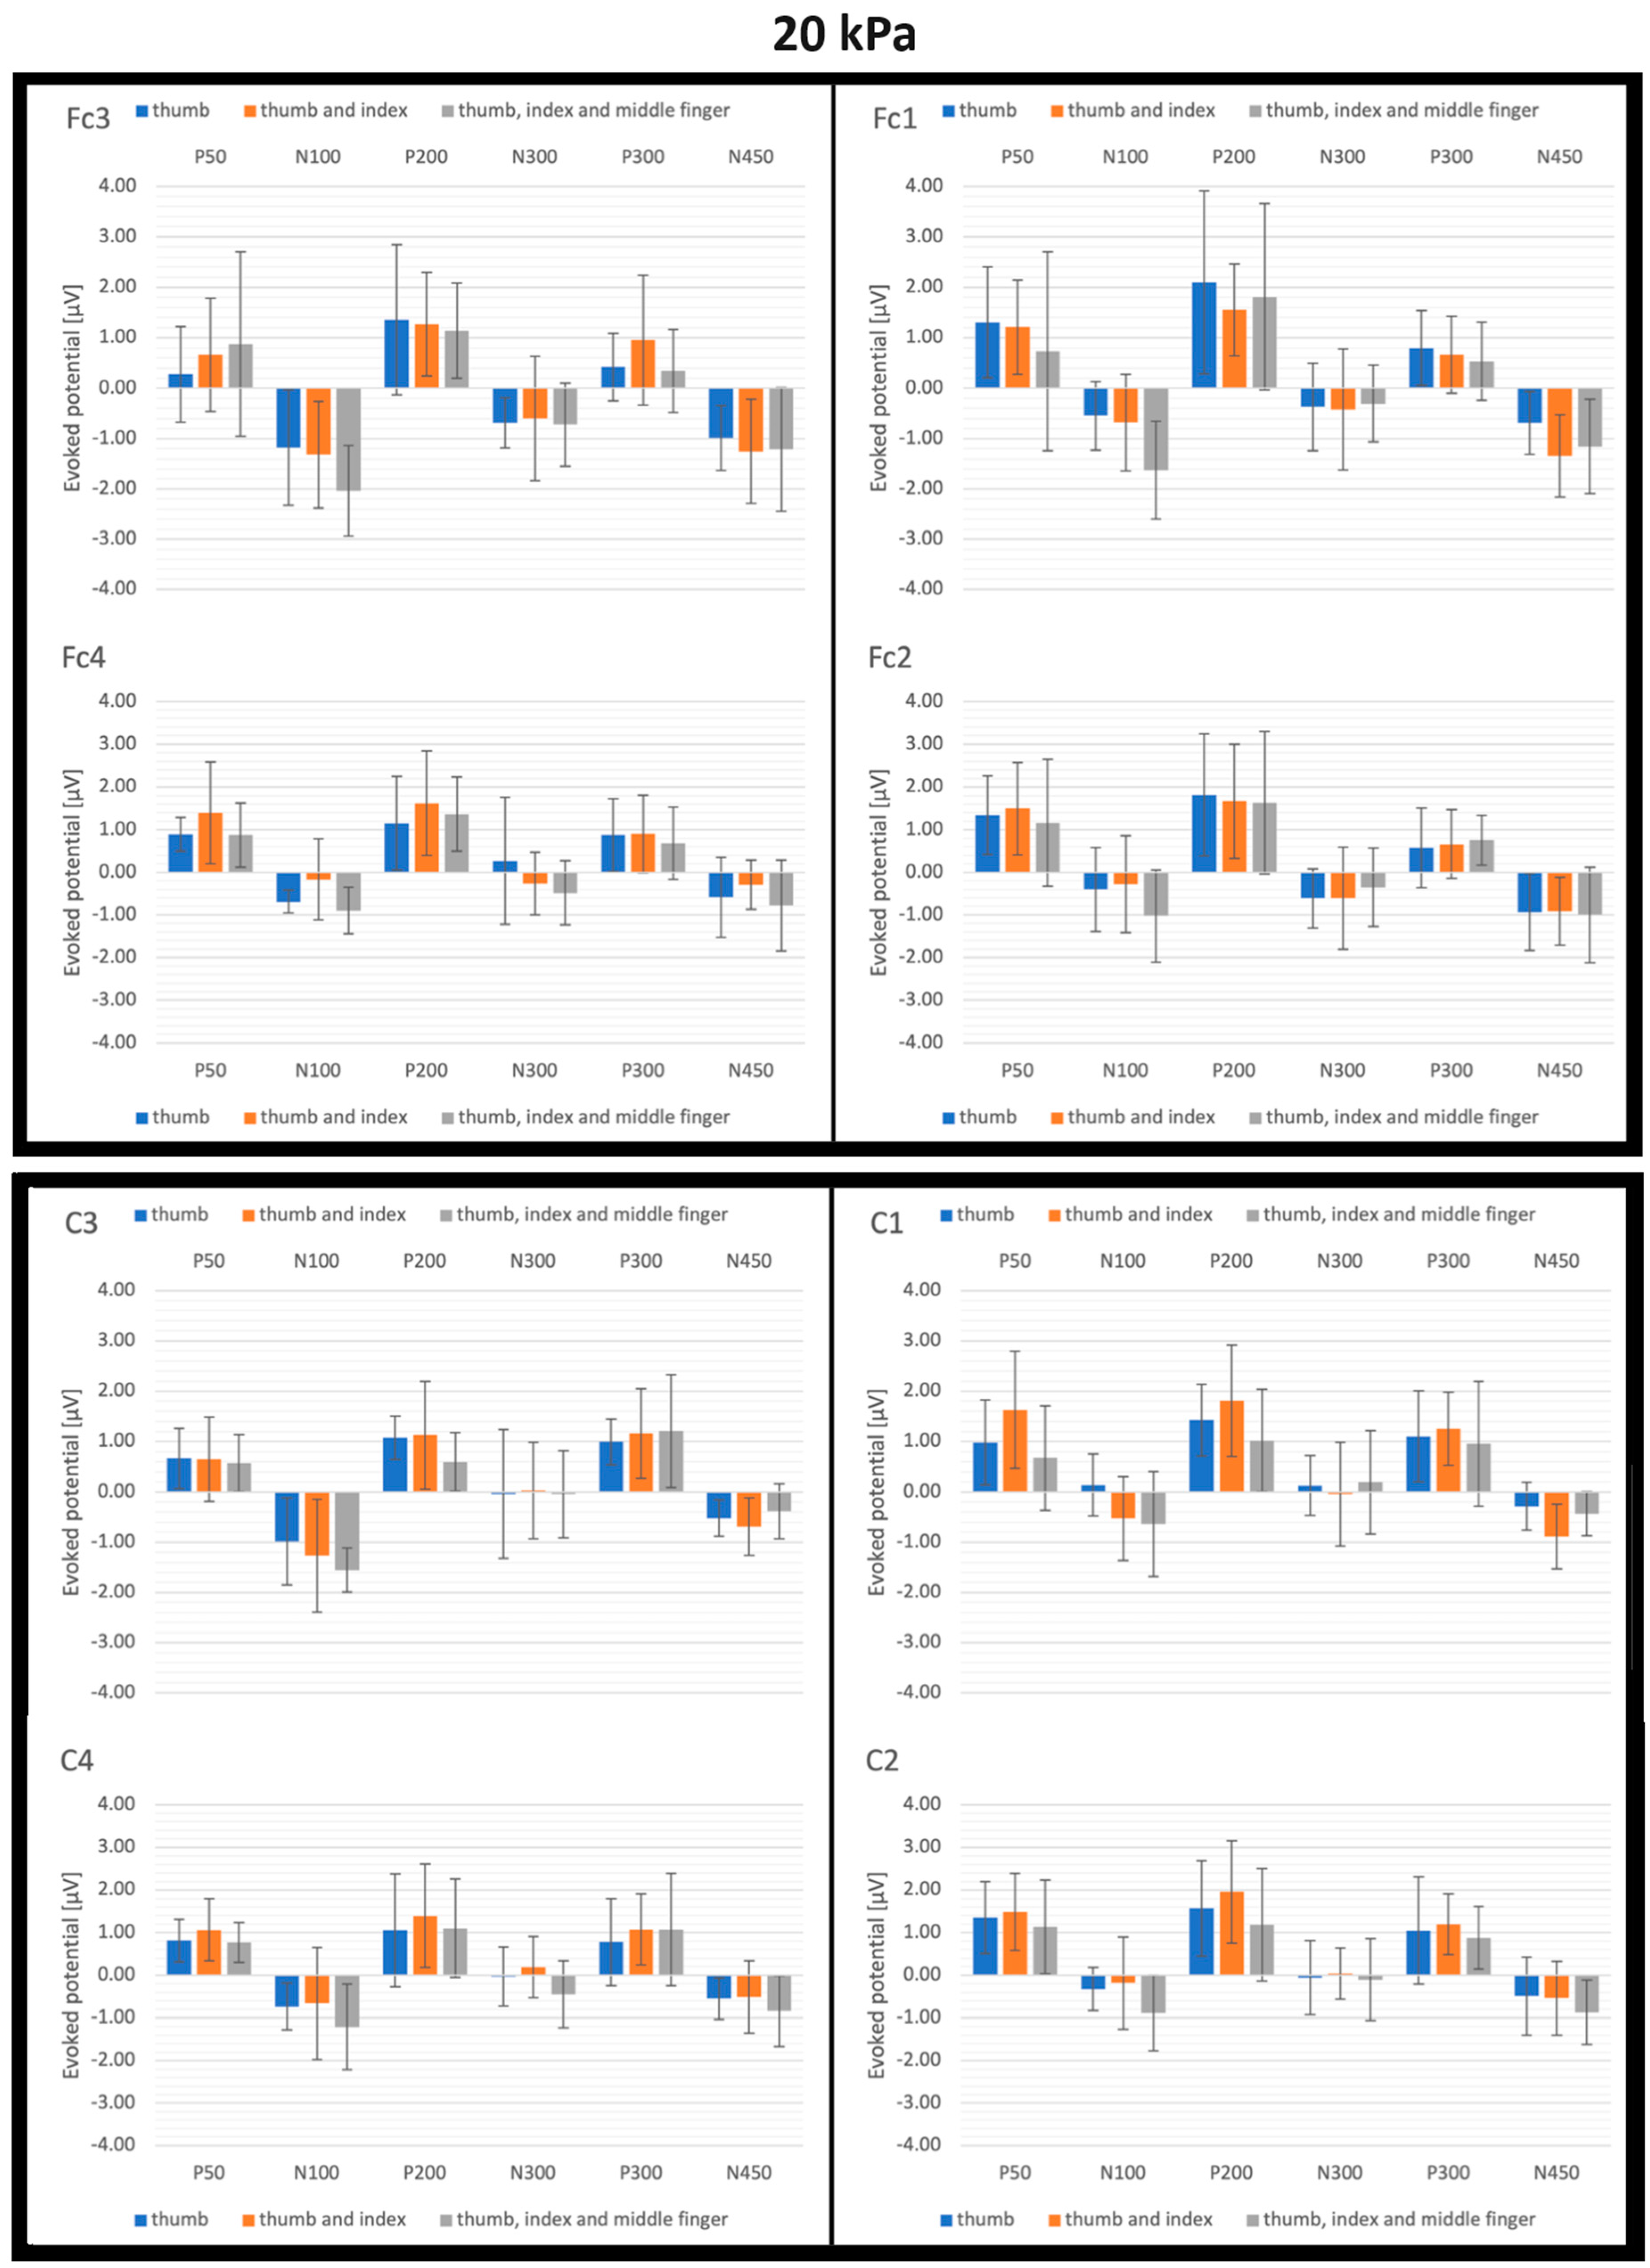
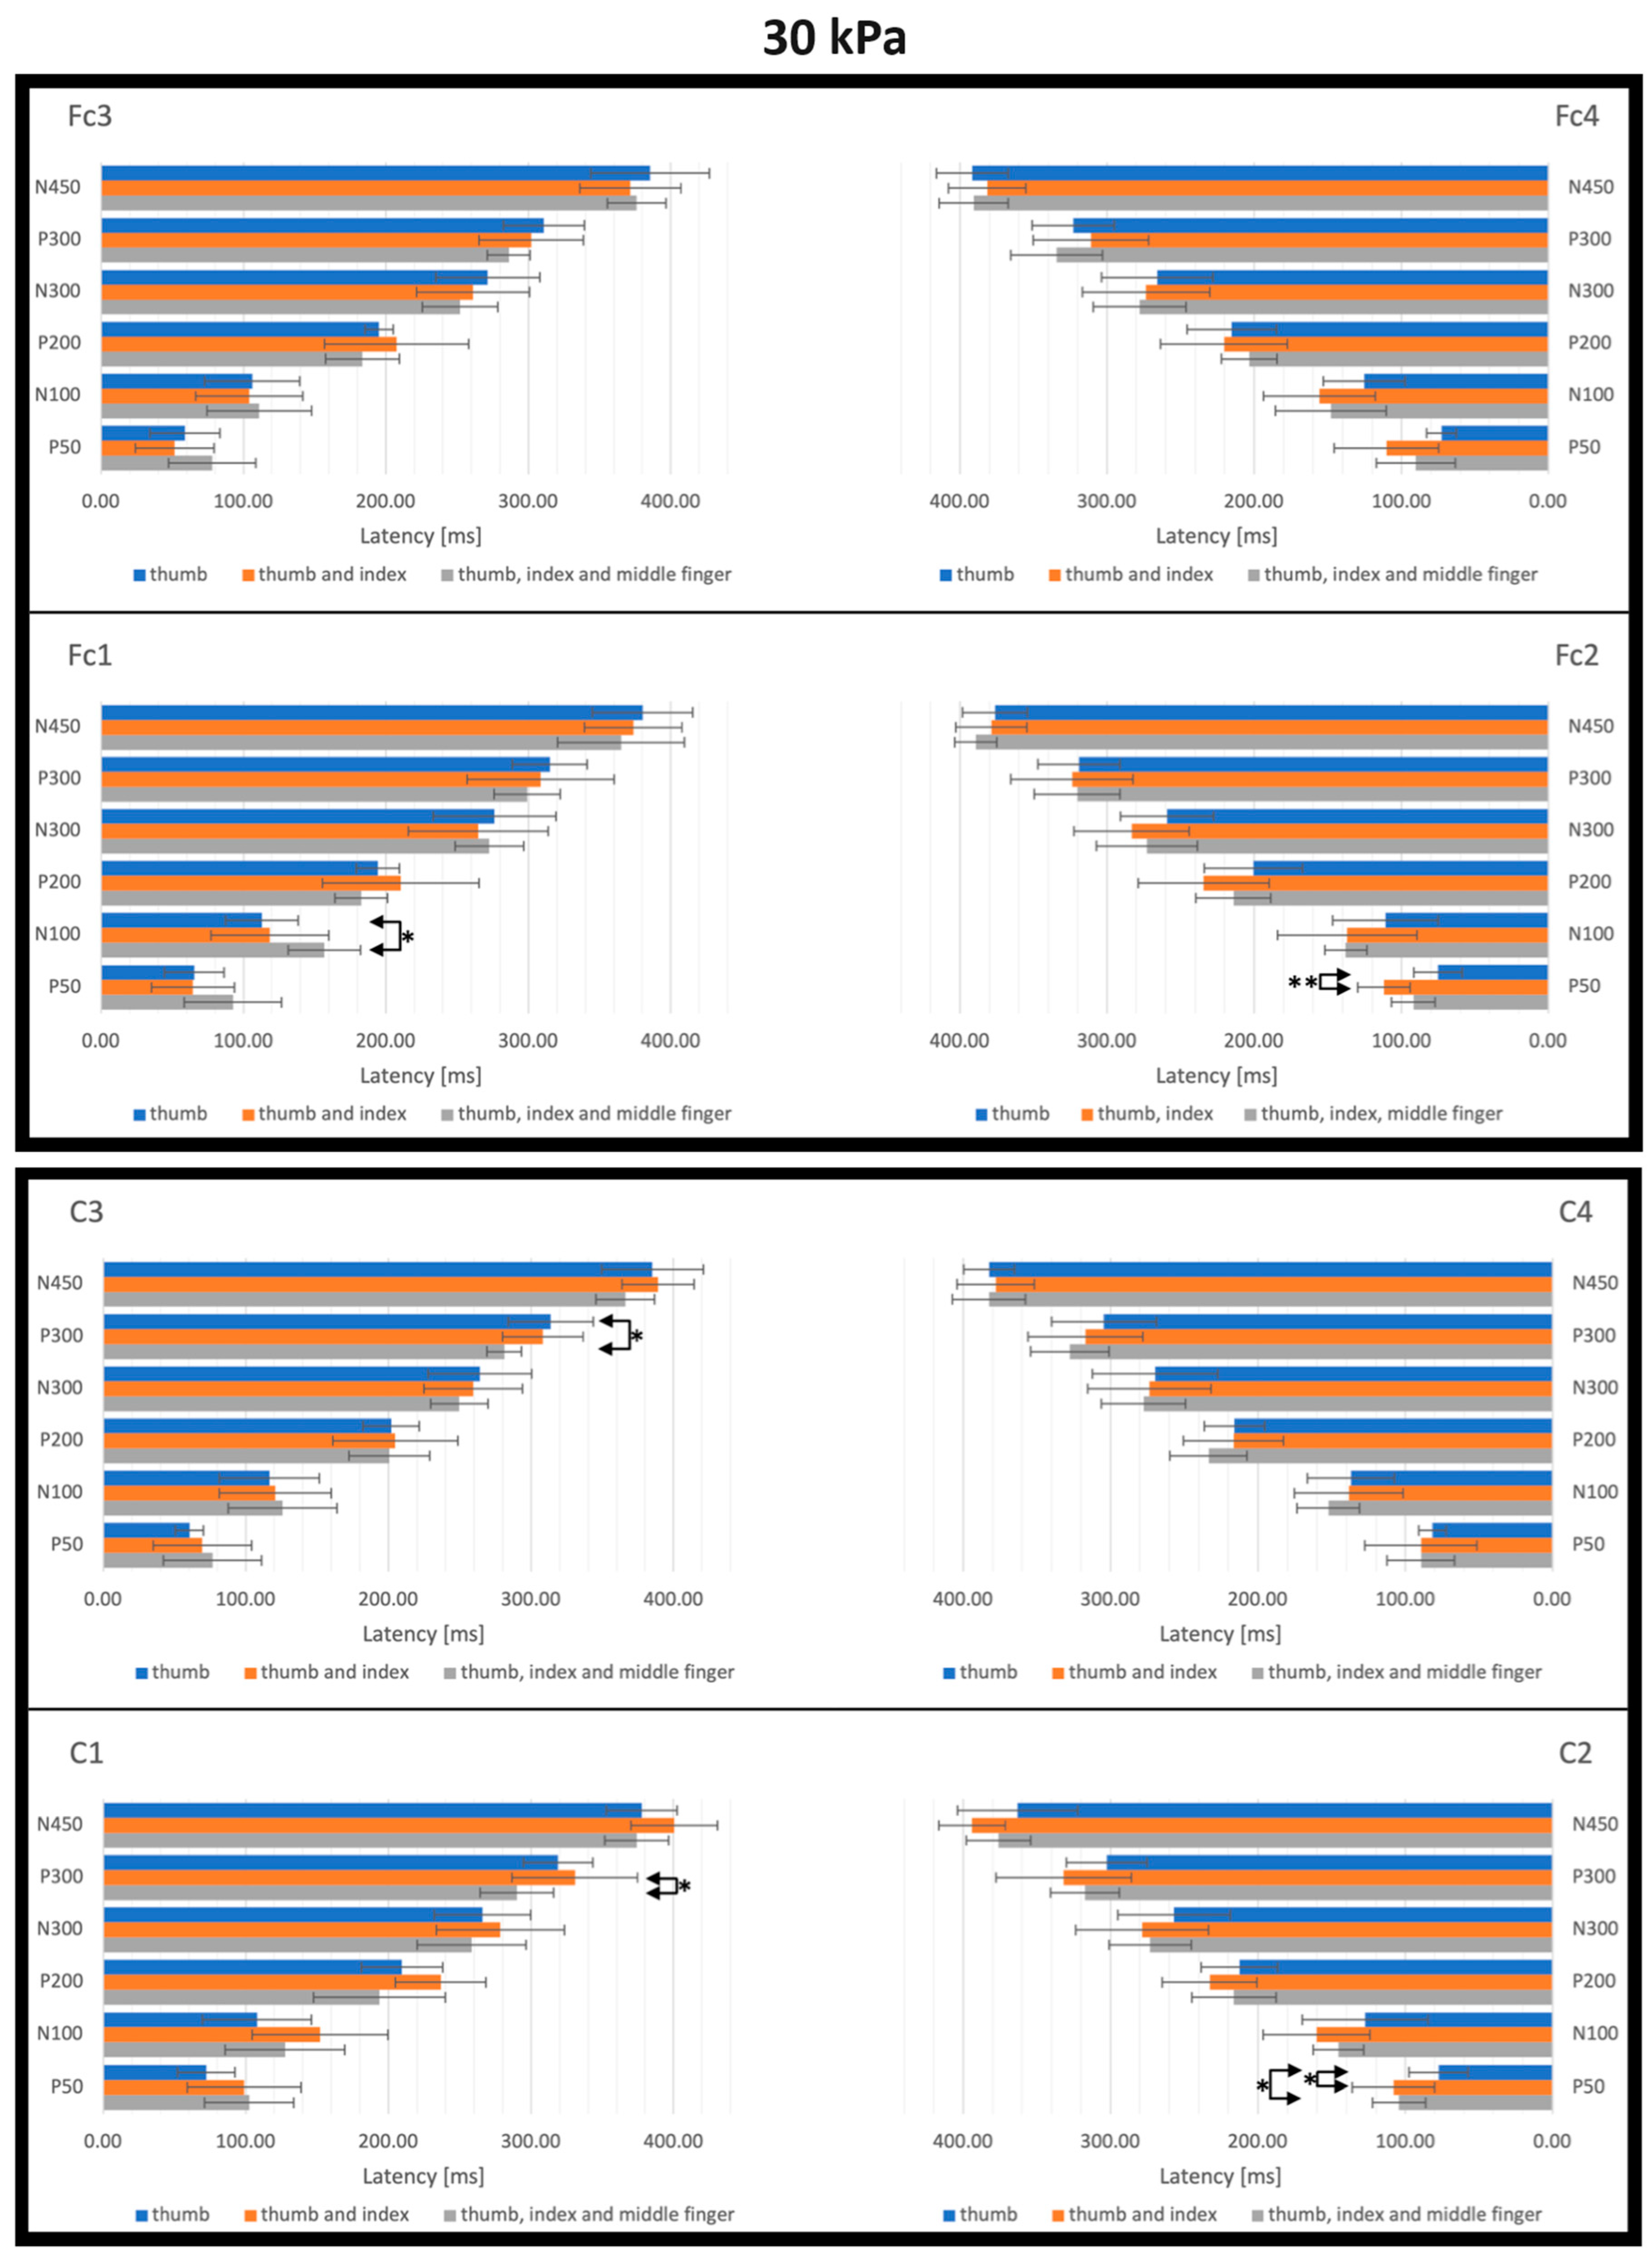
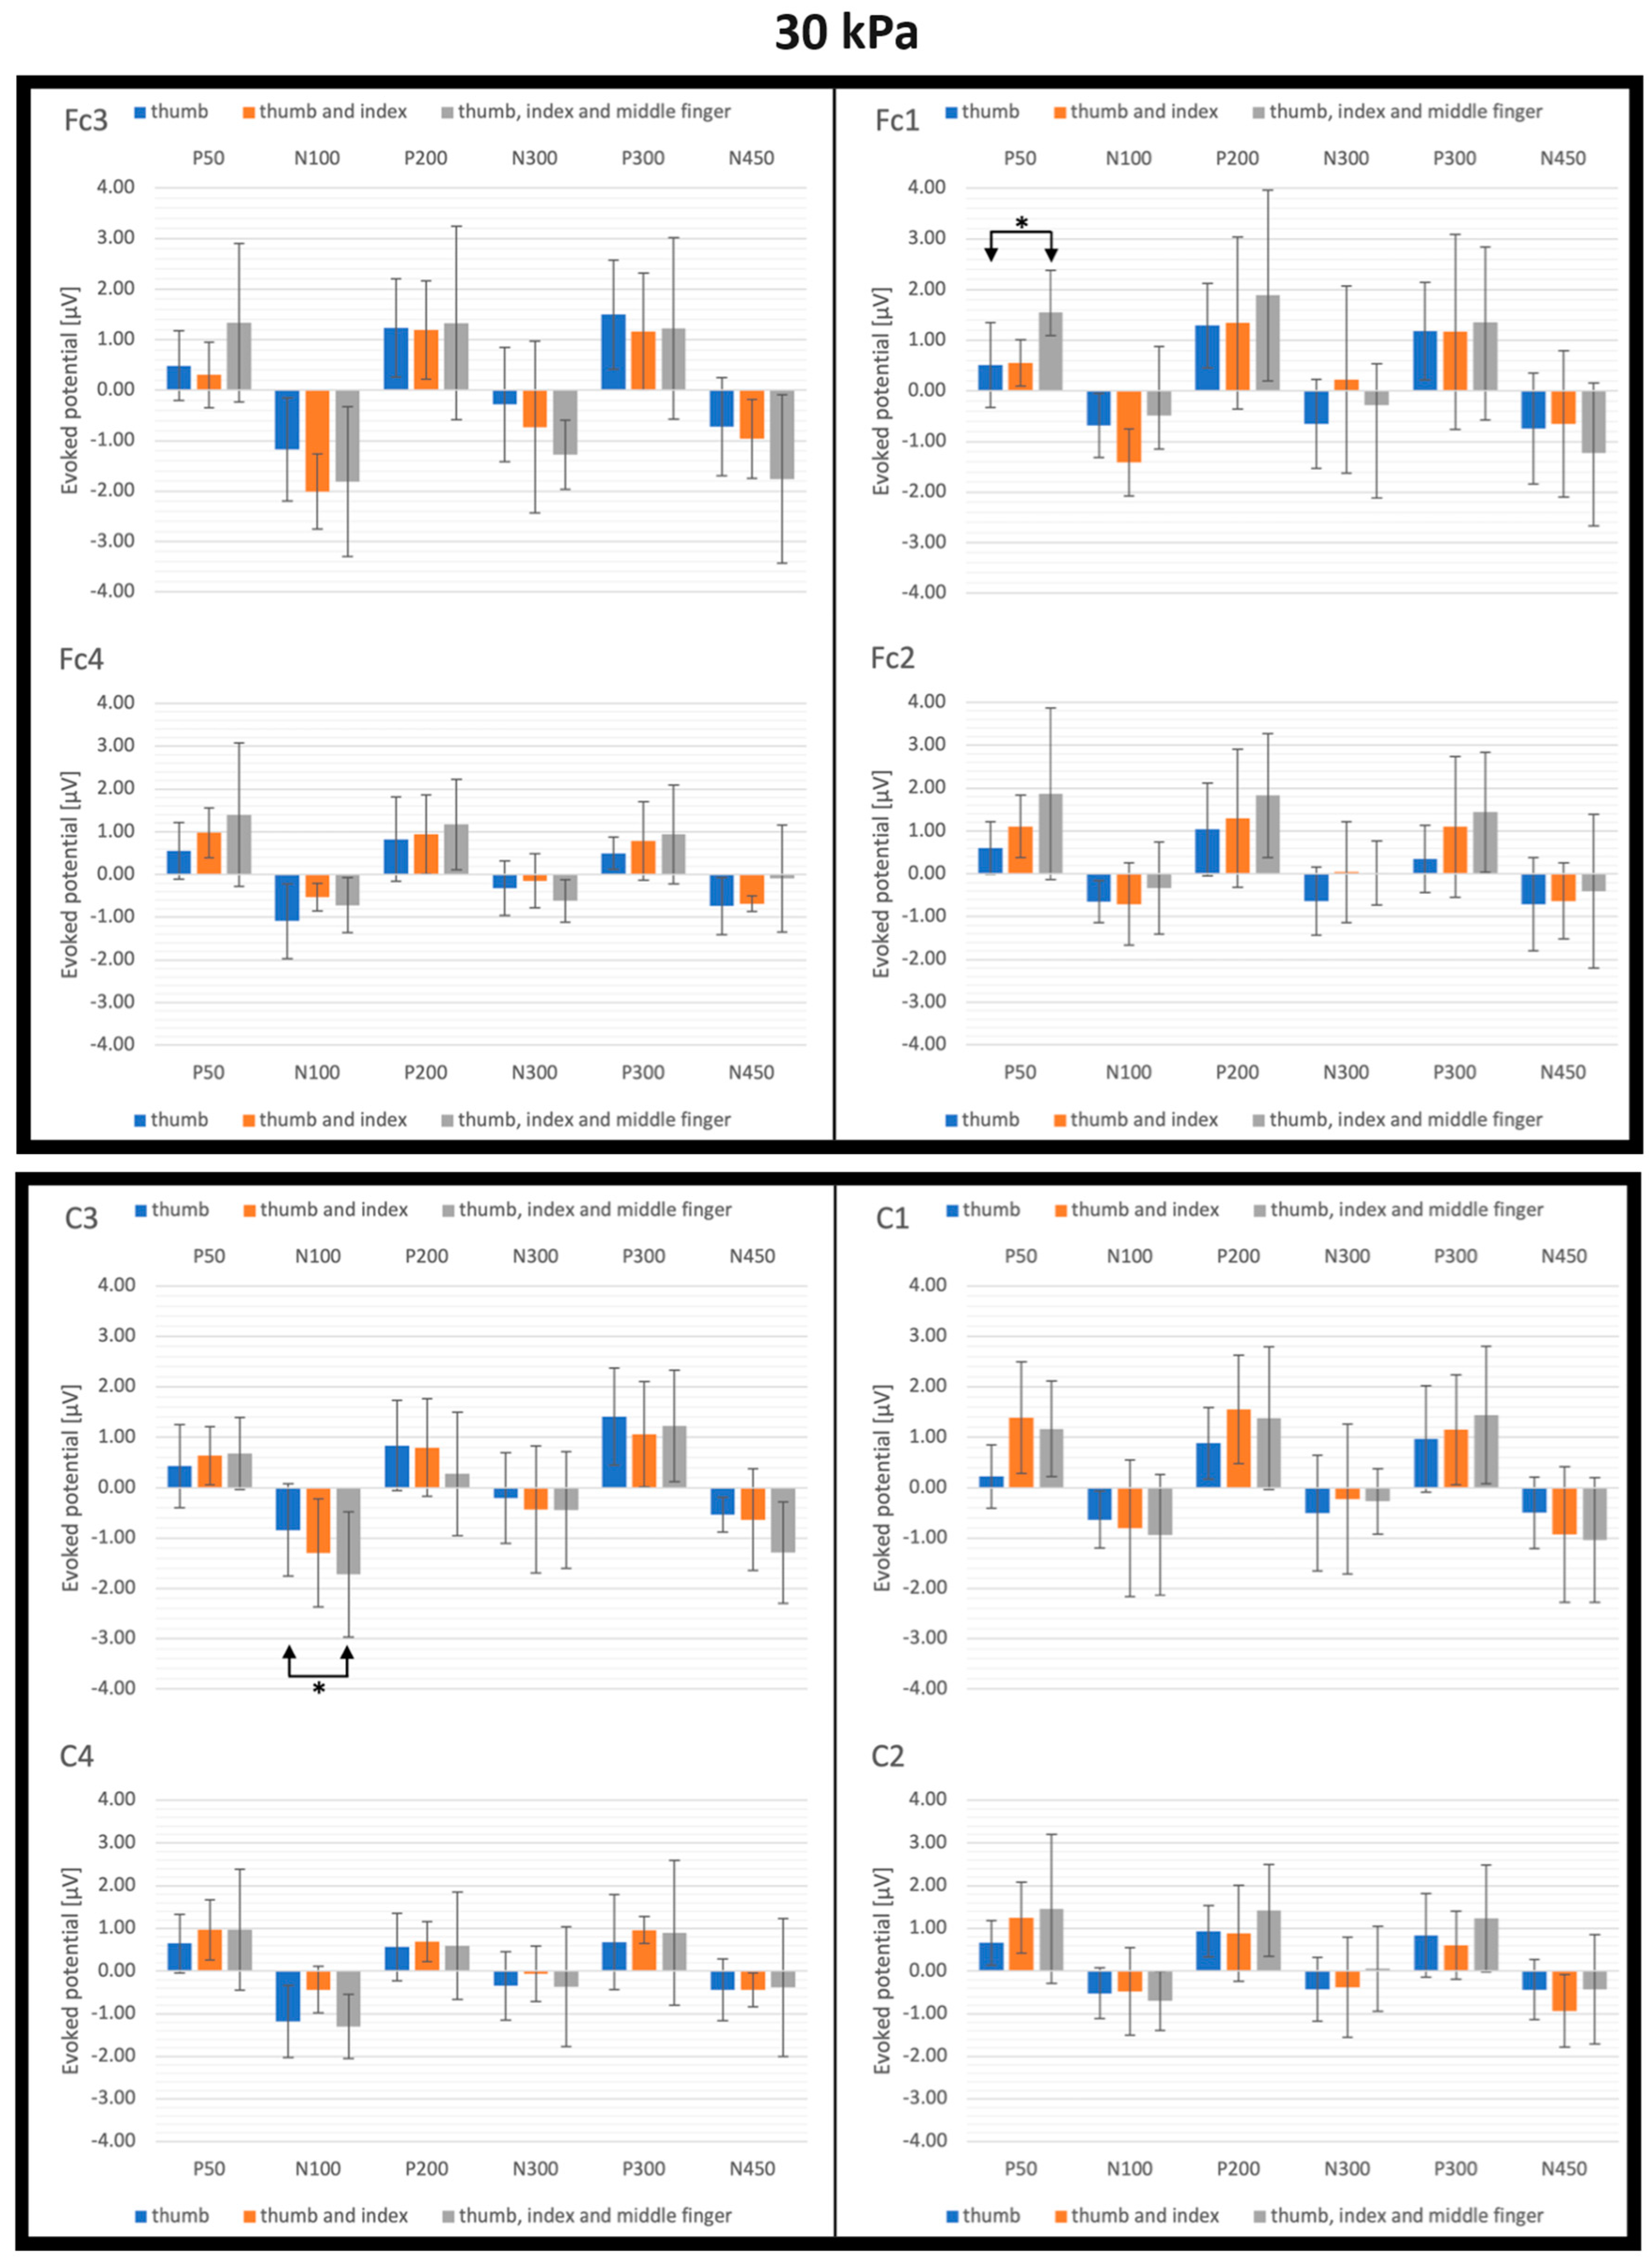
3.3. SEP Latencies and Amplitudes as Functions of the Number of Simultaneously Stimulated Fingers
4. Discussion
4.1. Effect of Signal Recording from the Contralateral Cerebral Hemisphere
4.2. Effect of the Tactile Pressure Intensity
4.3. Effect of the Simultaneous Stimulation of Multiple Fingers
4.4. Possible Influence of the Experimental Conditions and Methodological Choices
5. Conclusions
Author Contributions
Funding
Institutional Review Board Statement
Data Availability Statement
Conflicts of Interest
References
- Palter, V.N.; Grantcharov, T.P. Individualized deliberate practice on a virtual reality simulator improves technical performance of surgical novices in the operating room: A randomized controlled trial. Ann. Surg. 2014, 259, 443–448. [Google Scholar] [CrossRef]
- Sarakoglou, I.; Garcia-Hernandez, N.; Tsagarakis, N.G.; Caldwell, D.G. A high performance tactile feedback display and its integration in teleoperation. IEEE Trans. Haptics 2012, 5, 252–263. [Google Scholar] [CrossRef]
- Liu, X.; Dodds, G.; McCartney, J.; Hinds, B.K. Manipulation of CAD surface models with haptics based on shape control functions. Comput. Aided Des. 2005, 37, 1447–1458. [Google Scholar] [CrossRef]
- Seth, A.; Vance, J.; Oliver, J. Virtual reality for assembly methods prototyping: A review. Virtual Real. 2011, 15, 5–20. [Google Scholar] [CrossRef]
- Oh, S.; Bailenson, J.N.; Welch, G.F. A systematic review of social presence: Definition, antecedents, and implications. Front. Robot. AI 2018, 5, 409295. [Google Scholar] [CrossRef]
- Srinivasan, M.A.; LaMotte, R.H. Tactual discrimination of softness. J. Neurophysiol. 1995, 73, 88–101. [Google Scholar] [CrossRef]
- Dhong, C.; Miller, R.; Root, N.B.; Gupta, S.; Kayser, L.V.; Carpenter, C.W.; Loh, K.J.; Ramachandran, V.S.; Darren, J. Lipomi Role of indentation depth and contact area on human perception of softness for haptic interfaces. Sci. Adv. 2019, 5, eaaw8845. [Google Scholar] [CrossRef]
- Endo, T.; Kusakabe, A.; Kazama, Y.; Kawasaki, H. Haptic interface for displaying softness at multiple fingers: Combining a side-faced-type multifingered haptic interface robot and improved softness-display devices. IEEE/ASME Trans. Mech. 2016, 21, 2343–2351. [Google Scholar] [CrossRef]
- Fani, S.; Ciotti, S.; Battaglia, E.; Moscatelli, A.; Bianchi, M. W-FYD: A wearable fabric-based display for haptic multi-cue delivery and tactile augmented reality. IEEE Trans. Haptics 2018, 11, 304–316. [Google Scholar] [CrossRef]
- Carpi, F.; De Rossi, D.; Kornbluh, R.; Pelrine, R.; Sommer-Larsen, P. (Eds.) Dielectric Elastomers as Electromechanical Transducers. Fundamentals, Materials, Devices, Models and Applications of an Emerging Electroactive Polymer Technology; Elsevier: Oxford, UK, 2008. [Google Scholar]
- Mun, S.; Yun, S.; Nam, S.; Park, S.K.; Park, S.; Park, B.J.; Kyung, K.U. Electro-active polymer based soft tactile interface for wearable devices. IEEE Trans. Haptics 2018, 11, 15–21. [Google Scholar] [CrossRef]
- Koo, I.M.; Jung, K.; Koo, J.C.; Nam, J.D.; Lee, Y.K.; Choi, H.R. Development of soft-actuator-based wearable tactile display. IEEE Trans. Robot. 2008, 24, 549–558. [Google Scholar] [CrossRef]
- Phung, H.; Nguyen, C.T.; Nguyen, T.D.; Lee, C.; Kim, U.; Lee, D.; Moon, H.; Koo, J.C.; Choi, H.R. Tactile display with rigid coupling based on soft actuator. Meccanica 2015, 50, 2825–2837. [Google Scholar] [CrossRef]
- Frediani, G.; Mazzei, D.; De Rossi, D.; Carpi, F. Wearable wireless tactile display for virtual interactions with soft bodies. Front. Bioeng. Biotech. 2014, 2, 31. [Google Scholar] [CrossRef]
- Lee, H.S.; Phung, H.; Lee, D.-H.; Kim, U.; Nguyen, C.T.; Moon, H.; Koo, J.C.; Nam, J.-D.; Choi, H.R. Design analysis and fabrication of arrayed tactile display based on dielectric elastomer actuator. Sens. Act. A 2014, 205, 191–198. [Google Scholar] [CrossRef]
- Boys, H.; Frediani, G.; Ghilardi, M.; Poslad, S.; Busfield, J.; Carpi, F. Soft wearable non-vibratory tactile displays. In Proceedings of the 2018 IEEE International Conference on Soft Robotics (RoboSoft), Livorno, Italy, 24–28 April 2018; pp. 270–275. [Google Scholar]
- Song, K.; Kim, S.H.; Jin, S.; Kim, S.; Lee, S.; Kim, J.S.; Park, J.M.; Cha, Y. Pneumatic actuator and flexible piezoelectric sensor for soft virtual reality glove system. Sci. Rep. 2019, 9, 8988. [Google Scholar] [CrossRef]
- Tanaka, Y.; Yamauchi, H.; Amemiya, K. Wearable haptic display for immersive virtual environment. Proc. JFPS Intl. Symp. Fluid Power 2002, 2002, 309–314. [Google Scholar] [CrossRef]
- Kim, Y.; Oakley, I.; Ryu, J. Design and psychophysical evaluation of pneumatic tactile display. In Proceedings of the 2006 SICE-ICASE International Joint Conference, Busan, Republic of Korea, 18–21 October 2006; pp. 1933–1938. [Google Scholar]
- King, C.H.; Franco, M.; Culjat, M.O.; Higa, A.T.; Bisley, J.W.; Dutson, E.; Grundfest, W.S. Fabrication and characterization of a balloon actuator array for haptic feedback in robotic surgery. J. Med. Dev. 2008, 2, 041006. [Google Scholar] [CrossRef]
- Moy, G.; Wagner, C.; Fearing, R.S. A compliant tactile display for teletaction. In Proceedings of the 2000 ICRA. Millennium Conference. IEEE International Conference on Robotics and Automation, San Francisco, CA, USA, 24–28 April 2000; Volume 4, pp. 3409–3415. [Google Scholar]
- Wienbruch, C.; Candia, V.; Svensson, J.; Kleiser, R.; Kollias, S.S. A portable and low-cost fMRI compatible pneumatic system for the investigation of the somatosensensory system in clinical and research environments. Neurosci. Lett. 2006, 398, 183–188. [Google Scholar] [CrossRef][Green Version]
- Feng, Y.L.; Peiris, R.L.; Fernando, C.L.; Minamizawa, K. 3D printed haptics: Creating pneumatic haptic display based on 3D printed airbags. In Haptics: Science, Technology, and Applications, Proceedings of the 11th International Conference, EuroHaptics 2018, Pisa, Italy, 13–16 June 2018; Proceedings, Part II 11; Prattichizzo, D., Shinoda, H., Tan, H., Ruffaldi, E., Frisoli, A., Eds.; Springer International Publishing: Cham, Switzerland, 2018. [Google Scholar]
- Frediani, G.; Carpi, F. Tactile display of softness on fingertip. Sci. Rep. 2020, 10, 20491. [Google Scholar] [CrossRef]
- Pfurtscheller, G.; Krausz, G.; Neuper, C. Mechanical stimulation of the fingertip can induce bursts of β oscillations in sensorimotor areas. J. Clin. Neurophysiol. 2001, 18, 559–564. [Google Scholar] [CrossRef]
- Severens, M.; Farquhar, J.; Desain, P.; Duysens, J.; Gielen, C.C.A.M. Transient and steady-state responses to mechanical stimulation of different fingers reveal interactions based on lateral inhibition. Clin. Neurophysiol. 2010, 121, 2090–2096. [Google Scholar] [CrossRef]
- Breitwieser, C.; Kaiser, V.; Neuper, C.; Müller-Putz, G.R. Stability and distribution of steady-state somatosensory evoked potentials elicited by vibro-tactile stimulation. Med. Biol. Eng. Comput. 2012, 50, 347–357. [Google Scholar] [CrossRef]
- Genna, C.; Artoni, F.; Fanciullacci, C.; Chisari, C.; Oddo, C.M.; Micera, S. Long-latency components of somatosensory evoked potentials during passive tactile perception of gratings. In Proceedings of the 38th Annual International Conference of the IEEE Engineering in Medicine and Biology Society (EMBC), Orlando, FL, USA, 16–20 August 2016. [Google Scholar]
- Genna, C.; Oddo, C.M.; Fanciullacci, C.; Chisari, C.; Jörntell, H.; Artoni, F.; Micera, S. Spatiotemporal dynamics of the cortical responses induced by a prolonged tactile stimulation of the human fingertips. Brain Topogr. 2017, 30, 473–485. [Google Scholar] [CrossRef]
- Genna, C.; Oddo, C.; Fanciullacci, C.; Chisari, C.; Micera, S.; Artoni, F. Bilateral cortical representation of tactile roughness. Brain Res. 2018, 1699, 79–88. [Google Scholar] [CrossRef]
- Shen, G.; Smyk, N.J.; Meltzoff, A.N.; Marshall, P.J. Neuropsychology of human body parts: Exploring categorical boundaries of tactile perception using somatosensory mismatch responses. J. Cogn. Neurosci. 2018, 30, 1858–1869. [Google Scholar] [CrossRef]
- Inanc, G.; Özgören, M.; Öniz, A. Sensory brain responses and lateralization in nonpainful tactile stimuli during sleep. Neurol. Sci. Neurophysiol. 2021, 38, 12. [Google Scholar] [CrossRef]
- Oniz, A.; Inanc, G.; Guducu, C.; Ozgoren, M. Brain responsiveness to non-painful tactile stimuli prior and during sleep. Sleep Biol. Rhythm. 2016, 14, 87–96. [Google Scholar] [CrossRef]
- Delorme, A.; Makeig, S. EEGLAB: An open-source toolbox for analysis of single-trial EEG dynamics including independent component analysis. J. Neurosci. Methods 2004, 134, 9–21. [Google Scholar] [CrossRef]
- Walsh, P.; Kane, N.; Butler, S. The clinical role of evoked potentials. J. Neurol. Neurosurg. Psychiatry 2005, 76, ii16–ii22. [Google Scholar] [CrossRef]
- Karpiel, I.; Kurasz, Z.; Kurasz, R.; Duch, K. The influence of filters on EEG-ERP testing: Analysis of motor cortex in healthy subjects. Sensors 2021, 21, 7711. [Google Scholar] [CrossRef]
- Li, M.; Chen, J.; He, B.; He, G.; Zhao, C.G.; Yuan, H.; Xie, J.; Xu, G.; Li, J. Stimulation enhancement effect of the combination of exoskeleton-assisted hand rehabilitation and fingertip haptic stimulation. Front. Neurosci. 2023, 17, 1149265. [Google Scholar] [CrossRef]
- Lim, S.; Lee, H.K.; Park, J. Role of combined tactile and kinesthetic feedback in minimally invasive surgery. Int. J. Med. Robot. Comput. Assist. Surg. 2015, 11, 360–374. [Google Scholar] [CrossRef]


Disclaimer/Publisher’s Note: The statements, opinions and data contained in all publications are solely those of the individual author(s) and contributor(s) and not of MDPI and/or the editor(s). MDPI and/or the editor(s) disclaim responsibility for any injury to people or property resulting from any ideas, methods, instructions or products referred to in the content. |
© 2023 by the authors. Licensee MDPI, Basel, Switzerland. This article is an open access article distributed under the terms and conditions of the Creative Commons Attribution (CC BY) license (https://creativecommons.org/licenses/by/4.0/).
Share and Cite
Carpi, F.; Valles, M.C.; Frediani, G.; Toci, T.; Grippo, A. EEG Investigation on the Tactile Perceptual Performance of a Pneumatic Wearable Display of Softness. Actuators 2023, 12, 431. https://doi.org/10.3390/act12120431
Carpi F, Valles MC, Frediani G, Toci T, Grippo A. EEG Investigation on the Tactile Perceptual Performance of a Pneumatic Wearable Display of Softness. Actuators. 2023; 12(12):431. https://doi.org/10.3390/act12120431
Chicago/Turabian StyleCarpi, Federico, Michele C. Valles, Gabriele Frediani, Tanita Toci, and Antonello Grippo. 2023. "EEG Investigation on the Tactile Perceptual Performance of a Pneumatic Wearable Display of Softness" Actuators 12, no. 12: 431. https://doi.org/10.3390/act12120431
APA StyleCarpi, F., Valles, M. C., Frediani, G., Toci, T., & Grippo, A. (2023). EEG Investigation on the Tactile Perceptual Performance of a Pneumatic Wearable Display of Softness. Actuators, 12(12), 431. https://doi.org/10.3390/act12120431