Abstract
This paper presents a miniature Linear Series Elastic Actuator (LSEA), in which two low-cost linear potentiometers were adopted to achieve a compact design. To improve the measurement accuracy of the linear potentiometer, a novel Bezier-based Calibration Method (BCM) and its optimization method were proposed to calibrate the inherent nonlinearity of the linear potentiometer. Calibration efficiency of the BCM was investigated numerically by making a comparison with the widely used Polynomial Calibration method (PCM), and the effect of the BCM calibration on the control performance of the LSEA was investigated experimentally by displacement and force control. Results reveal that the BCM exhibits an excellent local calibration ability for the nonlinearity with knee points. Due to the above characteristic, the BCM could produce a better calibration accuracy than the PCM under the same model order and improve the control performance of the LSEA. In addition, the BCM could calibrate the inherent nonlinearity of the potentiometer in a continuous form rather than that of piecewise ones. The continuous calibration form could bring more convenience to practical applications.
1. Introduction
Series Elastic Actuator (SEA) has wide applications due to its compliant and safety characteristics [1,2]. According to the actuating form, the SEA could be classified into rotary SEA [3,4,5] and linear SEA [6,7]. At present, research on series elastic actuators mainly focuses on the high-power drive system, such as jumping robots [8], exoskeletons [9,10,11], and manipulators [12]. Recently, the miniature series elastic actuator has attracted broad attention due to the increasing requirements for the compact actuator in robotic grasping [7], medical surgical instruments [13,14,15,16], and agricultural [17,18]. How to achieve a miniature design and integration is still a challenging problem in the robotic community since the essential key element of the SEA system, such as motor, elastic element, displacement sensors, force sensors, and transmission parts, will occupy a certain space, miniaturization puts forward high requirements for the overall dimensions of the whole parts of the SEA system.
The potentiometer is widely adopted in compact space measurements, such as robotic grippers [12,19,20] and joints [21]. Since the potentiometer has a simple structure and compact dimension. However, the potentiometer has globally distributed inherent nonlinearity due to manufacturing error. The inherent nonlinearity can affect the measurement accuracy and subsequently the control performance of the electromechanical system. There exist several approaches for compensating for the uncertainty of the control system, such as adaptive compensation [22,23] and hardware calibration techniques [24]. This study focuses on the calibration approach. To reduce the inherent nonlinearity, a linearity amending system has been developed for the linear potentiometer by the mechanical cutting correction method in Ref. [25]. By mechanically correcting the distribution of the resistance, the inherent nonlinearity of the potentiometer could be effectively reduced [26]. However, the mechanical cutting correction method also has some drawbacks, such as the high rejection rate and manufacturing cost [27]. Compared with the mechanical cutting correction method, software calibration could greatly reduce the manufacturing cost and rejection rate. Currently, the research work on the software calibration method for the potentiometer inherent nonlinearity is still rare, and the closest technology is the Polynomial Calibration Method (PCM), which could appropriate input and response data set globally [28,29,30,31]. However, the PCM has the drawback of local fitting ability in addressing the strong nonlinearity calibration problem, such as nonlinear characteristics with knee points.
In this paper, we present a miniature Linear Series Elastic Actuator (LSEA) as depicted in Figure 1. Taking into consideration the compact requirement, two low-cost linear potentiometers were adopted to measure the displacement of the moving parts independently. We obtain a miniature LSEA with a final length, width, and height of 127 mm × 25.6 mm × 27.4 mm, respectively. For the present configuration of the LSEA system, the inherent nonlinearity and nonlinearity distribution characteristic of the linear potentiometers are two main aspects affecting the control performance of the LSEA. To improve the control accuracy of the LSEA, we present a novel Bezier-based Calibrating Method (BCM) to calibrate the inherent nonlinearity of the potentiometer. In this way, we could increase the measurement accuracy of the linear potentiometer without mechanical cutting correction, and the effect of the BCM calibration on the control performance of the LSEA has been investigated experimentally by displacement and force control. The contributions of this paper are as follows:
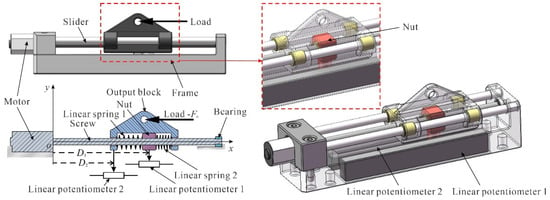
Figure 1.
The composition of the linear series elastic actuator.
- (1)
- Present a miniature LSEA composed of two low-cost linear potentiometers.
- (2)
- Propose a novel BCM for inherent nonlinearity calibration of the potentiometer.
- (3)
- The effect of BCM calibration on LSEA control performance has been experimentally investigated.
The rest of this paper is organized as follows. In Section 2, the proposed LSEA system and its calibration problem are introduced. The system calibration method and the corresponding calibration results are presented in Section 3. The calibration efficiency is experimentally investigated and discussed in Section 4. Conclusions are given in Section 5.
2. Calibration Problem of the LSEA System
The composition of the linear series elastic actuator is depicted in Figure 1. The output block is actuated by the nut in an elastic approach. Two linear springs that are springs 1 and 2 are embedded in the cavity formed by the output block and the nut to transfer the actuating force. To produce a preload, the sum of the length of the two linear springs and the nut should be longer than that of the cavity of the output block. In this way, the two springs will be compressed to yield a preload after assembly. The output block is supported by the slider to move in a straight line. The nut is actuated by the screw which is mounted on the motor output shaft. Two linear potentiometers that are potentiometers 1 and 2 are installed in parallel to measure the displacement of the nut and the output block . As an external load applied to the output block, the spring will be compressed and produce an elastic deformation . The actuating force could be estimated by the spring deformation. The elastic deformation could be measured by
where denotes the initial assembly nonlinearity.
Due to the manufacturing error of the resistance of the potentiometer, it has an inherent nonlinearity over the whole measurement range [24]. As a result, the measurement accuracy of and will be disturbed and affect the displacement control accuracy of the LSEA system directly. The measurement error of and will lead to the estimation error of the and affect the force control accuracy of the LSEA. Since the two potentiometers are installed in parallel, the assembly error of the two potentiometers can lead to the different nonlinearity distribution of and and yield an initial assembly nonlinearity of the spring deformation. As a result, the estimation error of the will be further enlarged due to Equation (1). The estimation error of could affect the force control accuracy of the LSEA. In producing a smaller actuating force, the modeling error could even lead to the instability of the LSEA and appear blocking phenomenon. Therefore, the calibration problem of the LSEA system includes two aspects:
- (1)
- Inherent nonlinearity calibration of the linear potentiometer.
- (2)
- Initial assembly nonlinearity calibration of the spring deformation measurement.
3. Calibration Method
In this section, an experimental platform is established to measure the inherent nonlinearity of the linear potentiometer. A Bezier-based Calibrating Method (BCM), which is suitable for strong nonlinearity modeling, is proposed to model and calibrate the inherent nonlinearity of the linear potentiometer. A displacement control experiment is performed to identify the initial assembly nonlinearity of two linear potentiometers of the LSEA system.
3.1. Inherent Nonlinearity Calibration Method
To calibrate the inherent nonlinearity of the potentiometer, a calibration experiment has been set up, as displayed in Figure 2a. The schematic diagram of the calibration experiment is depicted in Figure 2b. The calibrated linear potentiometer and the reference sensor are installed on the frame parallelly. The output terminal of the calibrated sensor and reference sensor is connected rigidly to produce absolutely the same linear motion. The output of the calibrated sensor and conventional true value from the reference sensor are sampled by the MCU and ADC modules.

Figure 2.
Calibration experiment of the linear potentiometer. (a) Experimental setup; (b) schematic diagram of the calibration experiment; (c) illustration of the rational Bezier calibrating method.
Through the experimental tests, the nonlinear characteristic of the linear potentiometer has been measured and depicted in Figure 2c. Since there are two knee points exist in the measurement range, the general PCM needs a relatively higher ordered calibration model to achieve a certain calibration accuracy. Therefore, a rational Bezier based Calibrating Method (BCM) has been presented to calibrate the nonlinearity with knee points as
where , and denote the number, displacement, and weight coefficients of the handle points of the rational bezier model. As depicted in Figure 2c, and denote the lower and upper bounds of the output of the calibrated sensor. The measurement range . Due to the weight coefficients , the rational bezier model could adjust the local curve turning radius and achieve an ideal approximation of the knee point nonlinearity. The unknown parameter and could be obtained by solving the optimization model:
where the objective function is to minimize the Euclidian two-norm of residual error . and are design variables and constrained to and , respectively, and the optimal results are displayed in Figure 3a,b.
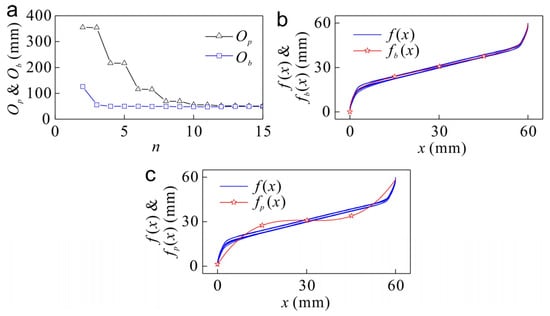
Figure 3.
Calibration results of the inherent nonlinearity of the linear potentiometer. (a) Calibration efficiency comparisons between BCM and PCM by optimal objective functions and with respect to different model order . (b) Comparison between the conventional true value and third-ordered BCM calibration . (c) Comparison between the and third-ordered PCM calibration .
A comparison between the BCM and PCM has been made to evaluate the calibration efficiency of the BCM. Generally, the PCM could be described as
where denotes the fitting order and denote the unknown fitting parameters. Equation (4) could be solved by the polyfit function, which is embedded in the MATLAB software. To quantitatively compare the BCM and PCM, an objective function of the PCM has been defined as , where denote the residual error of the PCM.
The objective function and with respect to different model order from 2–15 are compared in Figure 3a. The smaller or denote the better calibration efficiency of the BCM and PCM. From Figure 3a, it could be observed that to achieve the same calibration accuracy, the calibration model order of the BCM could be lower than that of the PCM. In Figure 3b,c, a third-ordered BCM calibration and PCM calibration are compared to the conventional true value , respectively. From the comparison, it could be observed that the BCM could calibrate the global nonlinearity as well as the two knee points. While the third-ordered PCM calibration model still appears to have global fluctuation and is unable to calibrate the knee point nonlinearity of the linear potentiometer. Figure 3a reveals that the PCM needs about a tenth-ordered model to achieve the equivalent calibration accuracy as that of a third-ordered BCM.
According to the BCM calibration, that is, Equation (2), the displacement of the nut and the output block are calibrated as and respectively. Where the denote the output of the linear potentiometer, and the subscript 1 and 2 denote the linear potentiometer 1 and 2, respectively. Taking into consideration the balance between the computation cost and calibration accuracy, a third-ordered BCM calibration model has been adopted for the and in the present study.
3.2. Calibration of Initial Assembly Nonlinearity of the Spring Deformation
As depicted in Figure 4, due to the manufacturing and assembly error of the LSEA hardware system, the measurements of and don’t coincide over the whole movement range. As a result, the measurement of the spring deformation will have a global error under the no-load condition due to Equation (1). Due to the inherent nonlinearity of the potentiometer, the initial measurement error also has a nonlinear distribution over the whole movement range of the LSEA. can lead to the estimation error of the spring deformation and subsequently the control accuracy of the actuating force . To obtain the distribution characteristic of , the output block is actuated from the lower limit to the upper limit under the no-load condition experimentally, as depicted in Figure 4. The sequences of and are sampled and displayed in Figure 5a. It could be observed that and coincide well in the range of 20–40 mm. However, the difference between and will increase gradually as the and tend to the left and right limits, which are 0 and 60 mm, respectively. The distribution characteristic of could be computed by . The distribution of the with respect to is plotted in Figure 5c, the blue line. To reduce the effect of on the measurement accuracy of , the could be calibrated as
where
denotes the polynomial approximation of the discrete sequence , which is depicted in Figure 5c. Since the nonlinearity of is relatively weak, it could be modeled utilizing polynomial approximation by Matlab fitting toolbox.
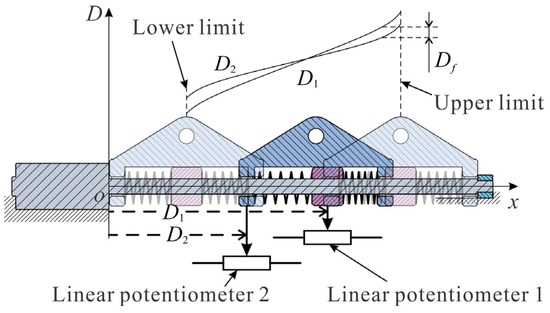
Figure 4.
Initial measurement error of the spring deformation due to the different nonlinearity distribution characteristics of and .
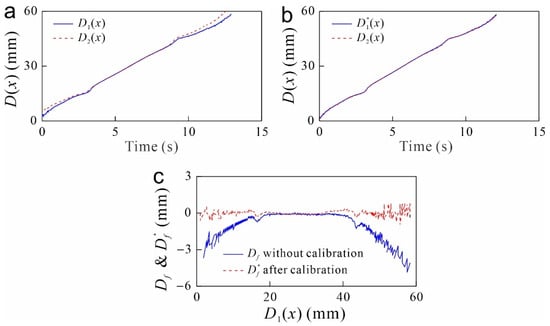
Figure 5.
Calibration results of the nut displacement and initial spring deformation measurement error. (a) The comparisons between the uncalibrated nut displacement and output block displacement ; (b) the comparisons between the calibrated nut displacement and output block displacement ; (c) the comparison of the initial spring deformation measurement error and the residual spring deformation measurement error after calibration.
To verify the calibration efficiency of , the output block is experimentally actuated from the lower limit to the upper limit under the no-load condition. The sequences of the calibrated nut displacement and the output block are sampled and displayed in Figure 5b. Compare Figure 5a,b, it could be observed that coincides better with than that of . A quantitative comparison between and has been displayed in Figure 5c by residual spring deformation measurement error and initial spring deformation measurement error . The residual spring deformation measurement error is computed by . It could be observed that before the calibration, the maximum amplitude of the spring deformation measurement error is about 4.9 mm. After the calibration, the maximum amplitude of the spring deformation measurement error is reduced to about 0.9 mm, with a reduction of about 81.6%. This indicates that Equation (5) could effectively reduce the spring deformation measurement error.
4. Experimental Results and Discussion
Due to the fabrication factors, the spring stiffness always exhibits a nonlinear behavior which is difficult to model theoretically. In this section, a model identification experiment is performed to identify the relation between the actuating force and spring deformation. A Proportional-Integral (PI) controller is utilized to track the trajectory of the spring deformation and achieve actuating force control. Displacement and force control experiments are performed to verify the effectiveness of the calibration models established in Section 3.
4.1. Control Model Identification
To obtain the force control model of the LSEA system, a model identification experiment has been set up to obtain the relationship between the spring deformation and actuating force . As depicted in Figure 6a, the LSEA and force gauge are fixed to the frame rigidly. A kevlar fiber has been adopted to connect the output block of the LSEA to the hook of the force gauge. During the experimental test, the output block is actuated to move leftward. As the kevlar fiber becomes tensioned, an actuating force will appear between the output block and the force gauge to achieve a balance. The actuating force could be measured by the force gauge directly. Under the action of the actuating force , the spring of the LSEA will deforme elastically and produce a elastic deformation . The calibrated elastic deformation is obtained by
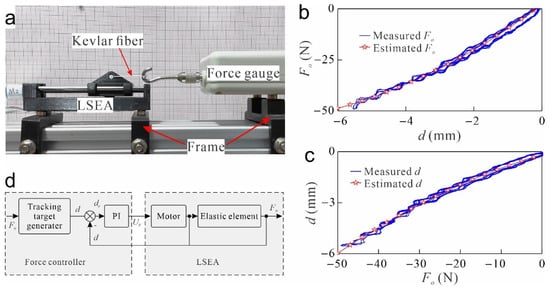
Figure 6.
Control model identification experiment. (a) Experimental platform of the LSEA system; (b) estimation of the actuating force ; (c) approximation of the control target of the spring deformation ; (d) controller structure of the LSEA system.
It should be noted that Equations (1) and (7) denote the measurement of the spring deformation before and after the nonlinearity distribution characteristic calibration, respectively. The loading and unloading process of the actuating force has been performed five rounds to reduce the random error of the measurement. The obtained sequences of actuating force and spring deformation are displayed in Figure 6b, the blue line. A polynomial model has been adopted to fitting the relationship between the actuating force and the spring deformation as
The obtained fitting of and , that are Equations (8) and (9) are compared to the measured ones in Figure 6b,c, respectively. Equation (8) could be adopted to estimate the actuating force of the LSEA system without the help of the external force gauge. A given target actuating force could be controlled by tracking spring deformation which could be generated by Equation (9). In the present study, a PI controller has been adopted to track the spring deformation trajectory as
where denotes the control voltage applied to the motor. and denote the control error and the sum of the control error history. and denote the target spring deformation and current spring deformation. and are two constants of the controller. In the present study, and are optimized and obtained as 90 and 10 respectively by the trial-and-error method. The overall control structure of the LSEA system is depicted in Figure 6d. For a given control target , Equation (9) is utilized to generate the target spring deformation . Then the PI controller, that is, Equation (10), produces and applies a control voltage to the motor to compress the spring to yield an actuating force .
4.2. Displacement Control Accuracy
A series of displacement control tests have been performed to verify the calibration efficiency of the presented BCM. In the displacement control experiments, the control target is the output block displacement . A series of discrete displacement instructions ranging from 1 to 60 mm has been set as the control target. The obtained tracking of before and after calibration is compared to the desired in Figure 7a. The displacement control error of the output block before and after the inherent nonlinearity calibration is compared in Figure 7b.

Figure 7.
Experimental results of the LSEA displacement control. (a) Tracking of the output block displacement before and after inherent nonlinearity calibration of the potentiometer; (b) displacement control error of the output block before and after inherent nonlinearity calibration of the potentiometer.
It could be observed from Figure 7 that before the calibration, the output block displacement control had a maximum error of about 14.4 mm. Through the BCM, the maximum error could be reduced to about 4.2 mm, with an improvement of about 70.8%. Figure 7b reveals that before the BCM calibration, the displacement control error is relatively larger over the whole motion range of the output block. The displacement control is accurate only near the midpoint of the motion range. Through the BCM calibration, the displacement control of the output block will have a larger accurate control range of about 5–55 mm.
4.3. Force Control Performance
As depicted in Figure 5a,c, due to the different distribution characteristics of and , the measurement of the spring deformation could be disturbed and produce an initial measurement error . To investigate the effect of sensor nonlinearity distribution characteristics on the force control performance, force control tests under no-load conditions have been performed based on the LSEA. During the force control tests, the initial displacement of the output block is set as 30 mm, then a series of target force range from 1 to 10 N with a step of 1 N has been tested to observe the force control response of the LSEA. Under normal conditions, the displacement of the output block will increase from 30 to 60 mm continuously under the action of the actuating force since the LSEA works at the no-load condition. However, a blocking phenomenon has been observed in producing smaller actuating forces. A typical motion blocking phenomenon under a 5 N target force is displayed in Figure 8a. During the force control, the output block is actuated to move rightward to respond to the 5 N target actuating force. As the displacement of the output block increase to about 43.1 mm, the motion will stop and appear blocking phenomenon. The blocking phenomenon could be attributed to the initial measurement error of the spring deformation , as discussed in Section 3.2. As depicted in Figure 5c, when the output block moves into the range of about 0–20 and 40–60 mm, the amplitude of will increase due to the inherent nonlinearity distribution difference of the two potentiometers. The increment of will behave as an external load applied to the output block and block its motion. Therefore, the inherent nonlinearity distribution characteristic of the two potentiometers could affect the force control accuracy and stability.

Figure 8.
Blocking phenomenon during the force control process. (a) Blocking phenomenon due to the different sensor nonlinearity distribution characteristic; (b) blocking phenomenon avoidance by sensor nonlinearity distribution characteristic calibration.
To investigate the nonlinearity distribution characteristic calibration efficiency, Equation (7) has been adopted to estimate the spring deformation. To make a comparison, the displacement response under a 5 N target force after the calibration is displayed in Figure 8b. It could be observed that the displacement of the output block increased from 30 to 60 mm continuously under the force control mode. This indicates the blocking phenomenon could be avoided by sensor nonlinearity distribution characteristic calibration.
After the calibration, the step force control experiment is performed to investigate the dead zone of the LSEA system by increasing the target actuating force from 0 to 5 N with a step of 0.2 N. Results reveal that the fabricated LSEA system has a dead zone of about 0.4 N. To evaluate the control response characteristic of the LSEA system, the target force is set to range from 5 to 15 N with a step of 5 N. Before the force control tests, the output block is driven to the mid stroke of the LSEA. During the force control tests, Equation (8) has been adopted to estimate the actuating force , and the actual actuating force is measured directly by the external force gauge. The response of the actuating force obtained from the Equation (8) and the force gauge is compared in Figure 9. From Figure 9, it could be observed that the estimated and measured actuating force responses have good agreement in general. At the steady-state, the force gauge suffers from its drift characteristic and leads to the measured response diverging from the estimated ones. The corresponding external force estimation and force control performance are given in Table 1. The maximum estimation error of Equation (8) is about −5.6%.
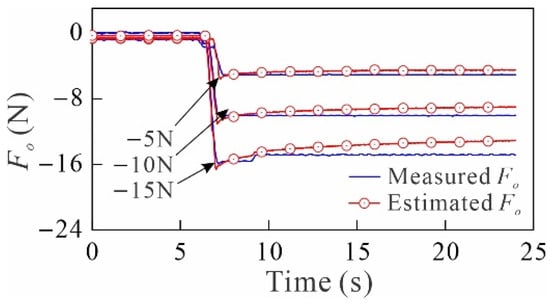
Figure 9.
The comparison of the actuating force obtained from Equation (8) and force gauge.

Table 1.
External force estimation and force control performance of the LSEA system.
5. Conclusions
In this work, we present a miniature linear series elastic actuator in which two low-cost linear potentiometers have been adopted to achieve a compact design. For the present configuration, the inherent nonlinearity and nonlinearity distribution characteristics of the potentiometers are two main aspects affecting the displacement and force control performance of the LSEA.
A novel BCM calibration method and its optimization method have been presented to calibrate the inherent nonlinearity of a linear potentiometer. For the inherent nonlinearity with local knee points, the BCM could exhibit an excellent local calibration ability. Compared to the widely used PCM, the BCM could achieve better calibration accuracy than that of the PCM under the same model order for addressing knee points’ nonlinearity calibration problem. The BCM could calibrate the strong inherent nonlinearity in a continuous form rather than that of piecewise ones. The continuous calibration form could bring more convenience to practical applications.
In the present study, the output block displacement control has a maximum error of about 14.4 mm before the inherent nonlinearity calibration of the potentiometer. Through the BCM calibration, the maximum error could be reduced to about 4.2 mm, with an improvement of about 70.8%.
Due to the parallel configuration of the two potentiometers, the measurement accuracy of the spring deformation could be disturbed by the nonlinearity distribution characteristic and, as a result, affect the LSEA force control stability to appear motion blocking phenomenon. To address the blocking phenomenon, we further calibrate the spring deformation measurement by compensating the nut displacement with the initial measurement error of the spring deformation. The effectiveness of the spring deformation measurement calibration has been experimentally investigated.
This work could provide a new calibration method for the low-cost potentiometer with inherent nonlinearity and serve as a guide for measurement calibration of the miniature linear sensor elastic actuator with two parallel potentiometers.
Author Contributions
Conceptualization, J.S., P.S., H.H. and M.Q.; methodology, J.S. and P.S.; software, J.S.; validation, J.S. and H.H.; writing—original draft preparation, J.S.; writing—review and editing, J.S. and P.S.; visualization, J.S. and H.H.; supervision, J.S. and M.Q.; project administration, J.S. and M.Q.; funding acquisition, J.S., M.Q. and H.H. All authors have read and agreed to the published version of the manuscript.
Funding
This research is funded by the National Natural Science Foundation of China (Grant No. 12072161), Basic scientific research projects of the State Administration of science, technology, and industry for national defense (Grant No. JCKY2021209B016), and the Fundamental Research Funds for the Central Universities (Grant No. 30920021104), natural science research projects of colleges and universities in Jiangsu Province (No. 20KJB460023).
Institutional Review Board Statement
Not applicable.
Informed Consent Statement
Not applicable.
Data Availability Statement
Not applicable.
Conflicts of Interest
The authors declare no conflict of interest.
References
- Kong, D.; Wang, W.; Shi, Y.; Kong, L. Flexible Control Strategy for Upper-Limb Rehabilitation Exoskeleton Based on Virtual Spring Damper Hypothesis. Actuators 2022, 11, 138. [Google Scholar] [CrossRef]
- Su, Y.; Zou, H.; Lu, H.; Hu, B.; Yu, H. Design and Control of a Nonlinear Series Elastic Cable Actuator Based on the Hill Muscle Model. Actuators 2022, 11, 68. [Google Scholar] [CrossRef]
- Murat, R.; Ebrahimi, N.; Jafari, A. Elastic Actuator Design Based on Bending of Cylindrical Beam for Robotic Applications. Actuators 2020, 9, 80. [Google Scholar] [CrossRef]
- Hua, H.; Liao, Z.; Chen, Y.; Xu, C. Design and Test of Compact Series Elastic Force Actuator for Grasping Mechanism. Trans. Chin. Soc. Agric. Mach. 2021, 52, 426–432, 442. [Google Scholar]
- Hua, H.; Liao, Z.; Chen, Y. A 1-Dof bidirectional graspable finger mechanism for robotic gripper. J. Mech. Sci. Technol. 2020, 34, 4735–4741. [Google Scholar] [CrossRef]
- Hua, H.; Liao, Z.; Wu, X.W.; Chen, Y.; Feng, C. A Back-drivable Linear Force Actuator for Adaptive Grasping. J. Mech. Sci. Technol. 2022, 1, 1–10. [Google Scholar]
- Hua, H.; Liao, Z. Design, Analysis, and Experiment of an Underactuated Robotic Gripper Actuated by Linear Series Elastic Actuator. J. Mech. Robot. 2022, 15, 021002. [Google Scholar] [CrossRef]
- Haldane, D.W.; Plecnik, M.M.; Yim, J.K.; Fearing, R.S. Robotic vertical jumping agility via series-elastic power modulation. Sci. Robot. 2016, 1, eaag2048. [Google Scholar] [CrossRef] [Green Version]
- Kim, S.; Bae, J. Force-mode control of rotary series elastic actuators in a lower extremity exoskeleton using model-inverse time delay control. IEEE/ASME Trans. Mechatron. 2017, 22, 1392–1400. [Google Scholar] [CrossRef]
- Chen, B.; Zhao, X.; Ma, H.; Qin, L.; Liao, W.-H. Design and characterization of a magneto-rheological series elastic actuator for a lower extremity exoskeleton. Smart Mater. Struct. 2017, 26, 105008. [Google Scholar] [CrossRef] [Green Version]
- Lee, H.D.; Park, H.; Hong, D.H.; Kang, T.H. Development of a Series Elastic Tendon Actuator (SETA) Based on Gait Analysis for a Knee Assistive Exosuit. Actuators 2022, 11, 166. [Google Scholar] [CrossRef]
- Zhang, X.; Gu, X.; Zhao, H.; Wang, K. Design of a compliant robotic arm based on series elastic actuator. Robot 2016, 38, 385–394. [Google Scholar]
- Sun, Y.; Liu, Y.; Xu, L.; Zou, Y.; Faragasso, A.; Lueth, T.C. Automatic design of compliant surgical forceps with adaptive grasping functions. IEEE Robot. Autom. Lett. 2020, 5, 1095–1102. [Google Scholar] [CrossRef]
- Guo, J.; Low, J.-H.; Liang, X.; Lee, J.S.; Wong, Y.-R.; Yeow, R.C.H. A Hybrid Soft Robotic Surgical Gripper System for Delicate Nerve Manipulation in Digital Nerve Repair Surgery. IEEE/ASME Trans. Mechatron. 2019, 24, 1440–1451. [Google Scholar] [CrossRef]
- George, B.L.; Bharanidaran, R. Design of compliant gripper for surgical applications. Aust. J. Mech. Eng. 2019, 1, 256–262. [Google Scholar] [CrossRef]
- Takizawa, T.; Kanno, T.; Miyazaki, R.; Tadano, K.; Kawashima, K. Grasping force estimation in robotic forceps using a soft pneumatic actuator with a built-in sensor. Sens. Actuators A Phys. 2018, 271, 124–130. [Google Scholar] [CrossRef]
- Zhang, B.; Xie, Y.; Zhou, J.; Wang, K.; Zhang, Z. State-of-the-art robotic grippers, grasping and control strategies, as well as their applications in agricultural robots: A review. Comput. Electron. Agric. 2020, 177, 105694. [Google Scholar] [CrossRef]
- Redekar, A.; Deb, D.; Ozana, S. Functionality Analysis of Electric Actuators in Renewable Energy Systems—A Review. Sensors 2022, 22, 4273. [Google Scholar] [CrossRef]
- Ballesteros, J.; Pastor, F.; GómezDeGabriel, J.M.; Gandarias, J.M.; Urdiales, C. Proprioceptive Estimation of Forces Using Underactuated Fingers for Robot-Initiated pHRI. Sensors 2020, 20, 2863. [Google Scholar] [CrossRef]
- Memar, A.H.; Esfahani, E.T. A Robot Gripper with Variable Stiffness Actuation for Enhancing Collision Safety. IEEE Trans. Ind. Electron. 2020, 67, 6607–6616. [Google Scholar] [CrossRef]
- Freitas, B.; Silva, M.; Carvalho, Ó.; Renjewski, D.; Fonseca, J.; Flores, P.; Espregueira-Mendes, J. Design, Modelling and Control of an Active Weight-Bearing Knee Exoskeleton with a Series Elastic Actuator. In Proceedings of the 2019 IEEE 6th Portuguese Meeting on Bioengineering (ENBENG), Lisbon, Portugal, 22–23 February 2019; pp. 1–4. [Google Scholar]
- Deb, D.; Burkholder, J.; Tao, G. Adaptive Compensation of Nonlinear Actuators for Flight Control Applications; Springer: Berlin, Germany, 2022; Volume 386. [Google Scholar]
- Sengupta, I.; Gupta, S.; Deb, D.; Ozana, S. Dynamic Stability of an Electric Monowheel System Using LQG-Based Adaptive Control. Appl. Sci. 2021, 11, 9766. [Google Scholar] [CrossRef]
- Hua, H.; Liao, Z.; Wu, X.; Chen, Y. A Bezier based state calibrating method for low-cost potentiometer with inherent nonlinearity. Measurement 2021, 178, 109325. [Google Scholar] [CrossRef]
- Pan, G.; Guan, E.G.; Yang, F.; Zhan, S.T.; Fu, Z.; Zhao, Y.Z. Research on a novel linearity amending system for the precise film potentiometer. Proc. Inst. Mech. Eng. Part B J. Eng. Manuf. 2013, 227, 1039–1048. [Google Scholar] [CrossRef]
- Li, Y.; Wang, H.; Wang, G.; Sun, L. Automatic Trimming Algorithm and Process Testing of Precise Carbon Film Potentiometer. In Proceedings of the 2017 5th International Conference on Machinery, Materials and Computing Technology (ICMMCT 2017), Beijing, China, 25–26 March 2017; pp. 426–429. [Google Scholar]
- Yan, B. Research on Linearity Continuous Correction Technology of Carbon Film Potentiometer Linearity. Master’s Thesis, Harbin Institute of Technology, Harbin, China.
- Ye, C.; Feng, S.; Xue, Z.; Guo, C.; Zhang, Y. Defeating runge problem by coefficients and order determination method with various approximation polynomials. In Proceedings of the 2018 37th Chinese Control Conference (CCC), Wuhan, China, 25–27 July 2018; pp. 8622–8627. [Google Scholar]
- Boyd, J.P.; Ong, J.R. Exponentially-convergent strategies for defeating the Runge Phenomenon for the approximation of non-periodic functions, part two: Multi-interval polynomial schemes and multidomain Chebyshev interpolation. Appl. Numer. Math. 2011, 61, 460–472. [Google Scholar] [CrossRef]
- Sergi, P.N.; De la Oliva, N.; del Valle, J.; Navarro, X.; Micera, S. Physically Consistent Scar Tissue Dynamics from Scattered Set of Data: A Novel Computational Approach to Avoid the Onset of the Runge Phenomenon. Appl. Sci. 2021, 11, 8568. [Google Scholar] [CrossRef]
- Fornberg, B.; Zuev, J. The Runge phenomenon and spatially variable shape parameters in RBF interpolation. Comput. Math. Appl. 2007, 54, 379–398. [Google Scholar] [CrossRef] [Green Version]
Publisher’s Note: MDPI stays neutral with regard to jurisdictional claims in published maps and institutional affiliations. |
© 2022 by the authors. Licensee MDPI, Basel, Switzerland. This article is an open access article distributed under the terms and conditions of the Creative Commons Attribution (CC BY) license (https://creativecommons.org/licenses/by/4.0/).