Article

Force Characteristics of Centrifugal Pump as Turbine during Start-Up Process under Gas–Liquid Two-Phase Conditions

1
School of Energy and Power Engineering, Lanzhou University of Technology, Lanzhou 730050, China
2
School of Chemistry and Chemical Engineering, Lanzhou Jiaotong University, Lanzhou 730070, China
*
Author to whom correspondence should be addressed.
Actuators 2022, 11(12), 370; https://doi.org/10.3390/act11120370
Submission received: 8 November 2022 / Revised: 4 December 2022 / Accepted: 6 December 2022 / Published: 8 December 2022
(This article belongs to the Special Issue 10th Anniversary of Actuators)

Abstract

:
The start-up process of a centrifugal pump as turbine (PAT) under gas–liquid two-phase conditions was simulated based on Fluent, and the evolution mechanism of the internal flow field and the variation law of force characteristics were studied in its start-up process under gas–liquid two-phase conditions. The results show that the area with high gas phase concentration corresponds to a strong vortex at the beginning of the start-up. The vortex intensity in the impeller gradually decreases with an increase in rotational speed. The gas volume fraction of the blade suction surface is more significant than that of the blade pressure surface. The higher the inlet gas volume fraction (IGVF) is, the more severely the blade load will fluctuate during the start-up process. As the rotational speed increases, the fluctuation of the blade load gradually weakens, and the maximum load is distributed near the inner edge of the blade after the rotational speed is stable. The periodic unbalanced radial force is produced in the start-up process. From the pure liquid conditions to the gas–liquid two-phase conditions with increasing IGVF, the dominant frequency amplitude of radial force shows a similar trend of decreasing first but then increasing. After the rotational speed tends to be stable, the dominant frequency of radial force is equal to the rotational frequency of the blade. With the increase in rotational speed, the dominant frequency amplitude of axial force decreases gradually. The higher the IGVF, the greater the dominant frequency amplitude of axial force at the same time.

1. Introduction

A centrifugal pump as turbine (PAT) is generally applied to residual pressure energy recovery of various devices in the petrochemical industry. The recovered medium of PAT usually contains a certain amount of gas. Gas–liquid two-phase flow can not only affect the external characteristics of PAT but also cause instability phenomena such as vibration and noise. Under gas–liquid two-phase conditions, the magnitude and direction of force acting on the PAT impeller can change with time during its start-up process. These unsteady forces directly affect the stability of the PAT start-up process [1,2,3]. Therefore, it is particularly essential to analyze the force characteristics of the PAT start-up process under gas–liquid two-phase conditions.
Some scholars have studied the force characteristics of a centrifugal pump under gas–liquid two-phase conditions. Barrios [4] and Gamboa [5] used visual experiments to observe that the bubble size in the impeller of the centrifugal pump increases with the increase in inlet gas volume fraction (IGVF) and decrease in rotational speed. Li et al. [6] obtained the variation law of a centrifugal pump blade load under different IGVFs. They pointed out that the imbalance of radial force on the impeller intensified, and the torque on the impeller reduced with the increase in IGVF. Yuan et al. [7] proposed that the gas volume fraction in the front shroud near the trading edge increased significantly with the rise in IGVF than in the back shroud. Luo et al. [8] found that the radial force of the centrifugal pump impeller and its pulsation amplitude increased first and then decreased with the increase in IGVF. The frequency corresponding to the peak value of radial force pulsation under each working condition was a multiple of the blade rotational frequency. Michael et al. [9] found that increasing the rotational speed would be beneficial to gas–liquid two-phase mixing. Due to the increase in flow rate, the occurrence of buzz and cavitation would increase with the growth of rotational speed. Yan et al. [10] proposed that a large number of gas blockages would appear in the centrifugal pump impeller with the rise in IGVF at a low flow rate, resulting in uneven pressure load on the blade surface and some large vortices in the flow channel. Zhang et al. [11] found that the gas in the centrifugal pump impeller mainly aggregated near the suction surface of the outlet area. The gas inhomogeneity and the interphase force in the impeller increased with the rise in IGVF.
Some papers have introduced force characteristics of PAT under stable working conditions. Anthony et al. [12] pointed out that the radial force of PAT at a low flow rate was a rotating force centered on the impeller, and the average amplitude of radial force increased with decreasing flow rate. Shi et al. [13] found that adding guide vanes could reduce the radial force of PAT and make the radial force distribution more uniform. Qu et al. [14] proposed that the shroud force of the PAT impeller at each level became smaller and smaller with the increase in stages at the best efficiency point, and the axial force at each level increased with the rise in the incoming flow head. Yang et al. [15] pointed out that the radial force of the double-volute turbine was higher than that of the single-volute turbine overall, while its balance was much poorer. Dai et al. [16] found that the radial force on the volute reduced and moved to the fourth quadrant as the blade warp angle increased. Shi et al. [17,18] pointed out that with the increase in IGVF, the relative average static pressure and pressure pulsation in the volute and impeller of PAT gradually decreased. In contrast, the hydraulic loss increased in the flow process. Shi et al. [19] found that with the increase in IGVF, the efficiency and power of PAT gradually decreased while the head steadily increased. The larger the flow rate, the greater the radial force, and the fluctuation of radial force under gas–liquid two-phase conditions was more significant than that under the pure liquid phase. However, the computational analysis of forces during the start-up process at different IGVFs is also crucial to the PAT.
Overall, the research on the force characteristics under gas–liquid two-phase conditions mainly focuses on centrifugal pumps, while the research on PAT mainly focuses on steady conditions and pure liquid phase conditions. There are few studies on the transient characteristics of the PAT start-up process, especially the force characteristics under gas–liquid two-phase conditions. Therefore, the PAT start-up process under gas–liquid two-phase conditions was studied using numerical simulation and experimental investigation. In this study, the combination of water and ideal gas was used as the medium to investigate the pressure distribution, the velocity streamline distribution, and the gas volume fraction distribution during the PAT start-up process. The main objective of the present study was to develop an in-depth understanding of the gas–liquid phase force characteristics and analyze the variation law of blade load, radial force, and axial force during the PAT start-up process at different IGVFs, which will help to improve the hydraulic performance of the PAT.

2. Numerical Simulation and Verification

2.1. Control Equation

The Mixture model can be used to simulate multiphase flow with different and same velocities of each phase. When the dispersed phase has a wide distribution and the interphase drag law is unknown, the Mixture model is the most desirable. The working medium of this paper is water and ideal gas. The gas–liquid two-phase is assumed to be homogeneous and consecutive. Water is the primary phase, and perfect gas is the secondary phase. There is no phase transition and mass transfer between the two phases. Considering the stability and economy of calculation, the Mixture model is used to study the PAT start-up process under gas–liquid two-phase conditions. The continuity equation of the Mixture model is [18]:
t ( ρ m ) + ( ρ m v m ) = 0
where v m is the mass-averaged velocity and can be calculated as:
v m = k = 1 n α k ρ k v k ρ m
α k , ρ k and v k represent the volume fraction, the density, and the averaged velocity of the kth phase component, respectively. ρ m is the mixture density and can be written as:
ρ m = k = 1 n α k ρ k
By summing the momentum equations for all phases, the momentum equation of the Mixture model can be obtained and expressed as [18]:
t ( ρ m v m ) + ( ρ m v m v m ) = p + μ m v m + v m T + ρ m g + F + k = 1 n α k ρ k v d r , k v d r , k
where n is the phase number, and F is the body force. μ m is the mixture viscosity and can be expressed as:
μ m = k = 1 n α k μ k
μ k represents the viscosity of the kth phase component. v dr, k is the slip velocity of the second phase and can be expressed as:
v d r , k = v k v m

2.2. Calculation Model

To analyze the force characteristics of the PAT start-up process under gas–liquid two-phase conditions, the IS80-50-315 centrifugal pump reversed as the turbine is selected as the study subject. The main design parameters of PAT are the rated speed nt = 1450 r/min, the rated head Ht = 50 m, and the rated flow rate Qt = 50 m3/h. Figure 1 shows the structure of PAT, and its main structure parameters are the inlet diameter of impeller D1 = 315 mm, the outlet diameter of impeller D2 = 80 mm, the inlet width of blade b1 = 10 mm, the inlet offset angle of blade β1 = 32°, the wrap angle of blade θ = 150°, the number of blades z = 6, the base circle diameter D0 = 320 mm, the inlet diameter of volute Din = 50 mm, and the outlet width of volute b0 = 24 mm.
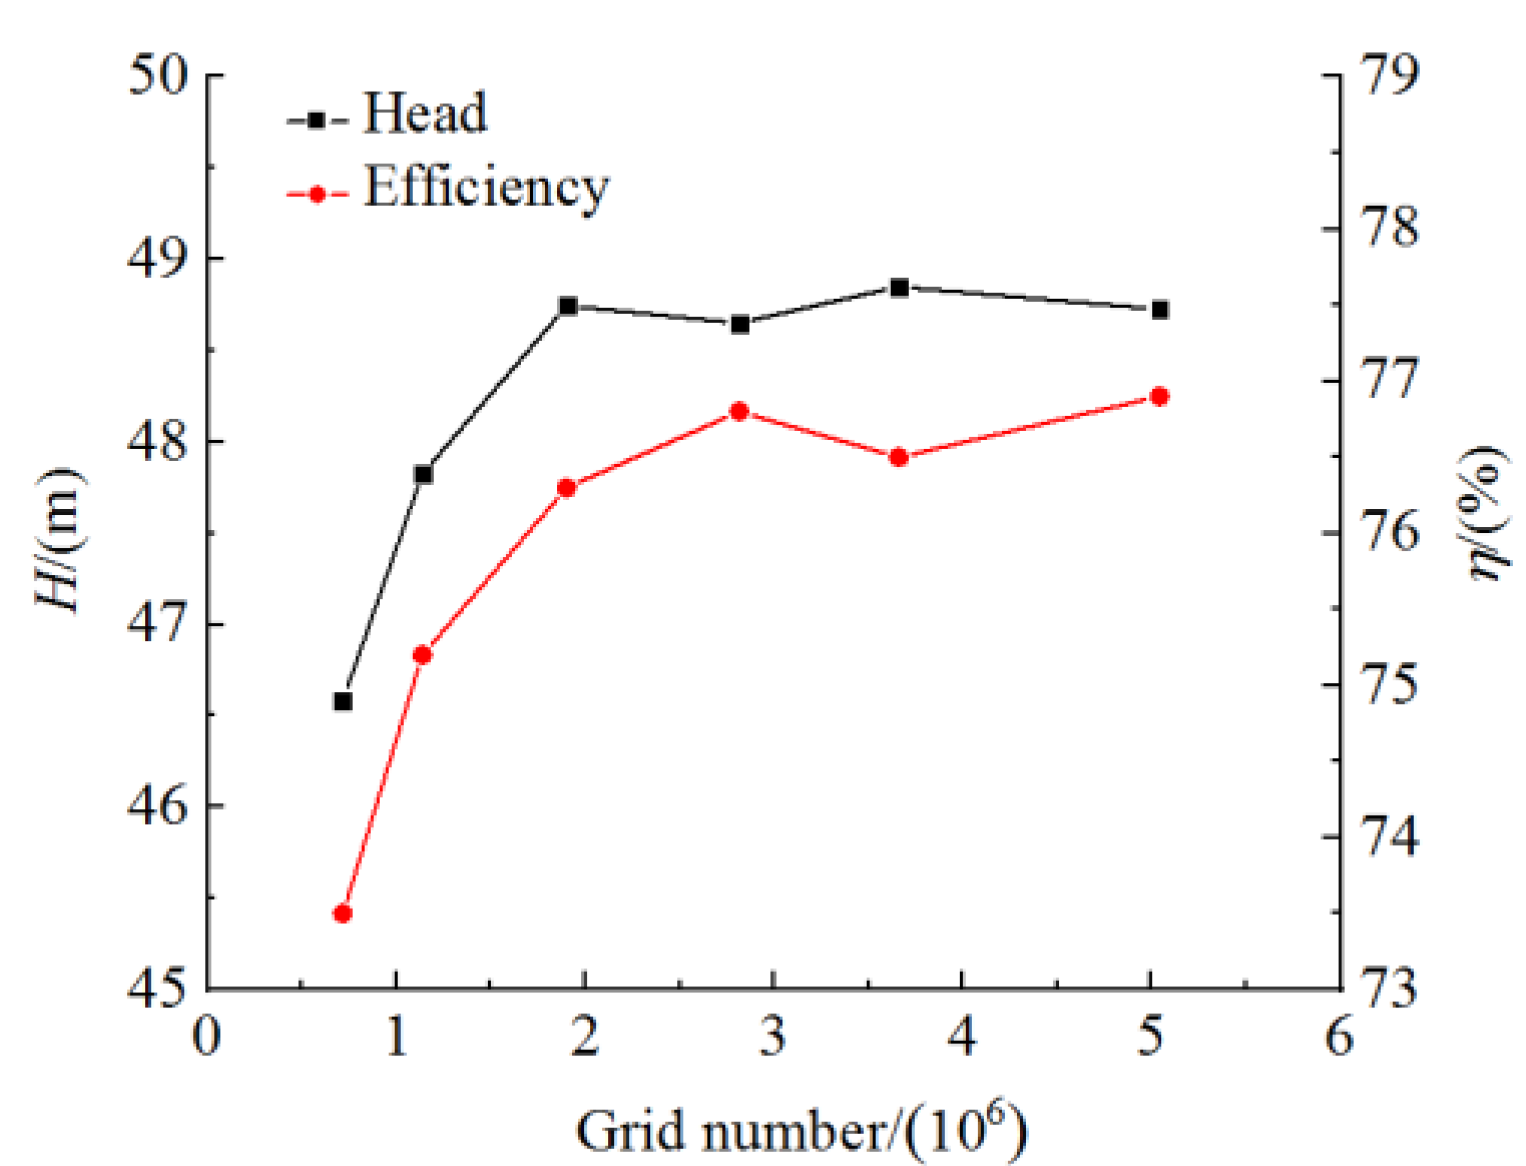
The entire fluid domain of PAT is modeled in CREO software. The hexahedral structured grids of the impeller, volute, and outlet pipe are generated by ICEM CFD, as shown in Figure 2. Fine boundary layer meshes are generated on the blade surface and the flow surface inside the volute, and mesh refinement is performed at the inlet and outlet sides of the blade and the volute tongue. The grid independence at IGVF of 0.15 has been verified, as shown in Figure 3. The X-axis represents the grid number, and the left Y-axis and the right Y-axis represent head and efficiency, respectively. As the number of grids increases, the head and efficiency of PAT gradually tend to be stable. When the number of grids reaches 1.9 million, the relative changes in head and efficiency are less than 1%. So it is reasonable that the grid numbers of the fluid domain are determined to be 1.9 million.

2.3. Calculation Method

The rotational speed of PAT is accelerated in its start-up process under the action of the incoming flow. In addition to the torque provided by the incoming flow, the rotating parts are also subjected to the load torque and the friction resistance torque. The rotation equation of the rotor is based on the d’Alembert principle [20]:
J d ω d t = M t M l M f
where J is the rotational inertia of the rotor, ω is the angular velocity of the rotor, t is the time, Mt, Ml, and Mf are the fluid flow torque, the load torque, and the frictional resistance torque acting on the rotor, respectively. Mt can be calculated as:
M t = 1 ω ρ g H Q t t η t
where ρ is the fluid density, g is the acceleration of gravity, Ht is the head of PAT, Qt is the flow rate of PAT, and ηt is the efficiency of PAT.
The variation of angular velocity with time during PAT start-up is obtained by integrating Equation (7) as follows:
ω = [ 2 J 0 t ( ρ g H t Q t η t N l N f ) d t ] 1 2
where Nl and Nf are the load consumption power and the frictional resistance loss power, respectively.
Based on the rotation equation of the rotor and the sliding mesh technique, the UDF program for calculating angular velocity is written and compiled in Fluent [21]. The angular velocity variation with time is transferred into the flow field solver, and the impeller domain is accelerated rotationally. The resultant torque on the impeller decreases with the increase in iteration times, and then the rotational speed gradually increases until the rated speed.

2.4. Boundary Condition

The Mixture model, RNG k-ε turbulence model, and SIMPLEC algorithm are employed to simulate the start-up process of PAT under gas–liquid two-phase conditions using Fluent software. The walls of the impeller, volute, and outlet pipe adopt adiabatic non-slip boundary conditions. The standard wall function method is used to modify the turbulence model for the near wall region. The residual convergence target is set at 10−5.
It is assumed that the velocity and void fraction distribution of gas–liquid two-phase flow at the inlet is uniform and equal. The velocity inlet boundary condition is set at the inlet of the domain. The IGVF is set as 0, 0.05, 0.10, and 0.15, respectively. The IGVF is defined as:
α g + α l = 1
α g = Q g Q g + Q l
where αg is the IGVF, αl is the inlet liquid volume fraction, Qg is the gas volume flow, and Ql is the liquid volume flow.
The outlet boundary condition is set to 0.5 MPa static pressure to avoid cavitation in industrial processes [17]. The rotational speeds during the start-up process under different time steps are compared to verify their independence [22]. When the time step is 0.0005 s, it has little effect on rotational speed in the start-up process. So the time step of the transient calculation is set at 0.0005 s. Steady results are used as initial conditions for transient calculation. Starting from the stationary state, the rotational speed of PAT increases with the iteration of the time step. When the resultant torque on the impeller reduces to nearly 0, the rotational speed no longer increases and keeps stable near the rated speed. It indicates that the transient calculation of the PAT start-up process is completed.

2.5. Experimental Verification

The test device for PAT characteristics is shown in Figure 4. The test device and equipment meet the II-level accuracy requirements in GB/T 3216-2005. Based on ensuring that the liquid flow rate is at a constant value, the gas flow rate is controlled by the gas regulating valve to obtain the gas–liquid mixture with different gas content so as to carry out the gas–liquid two-phase test of PAT. The water in the water storage tank is mixed with the air generated by the compressor in the gas–liquid mixing device after passing through the electromagnetic flowmeter, and then they are transported to the PAT. Taking αg = 0.15 as an example, the head and efficiency of PAT after the end of the start-up are tested under different flow rates and compared with the simulated results, as shown in Figure 5. The rotational speeds are acquired by testing once every 0.1 s during the start-up process. Figure 6 shows the comparison of rotational speed during the start-up process between simulated and experimental results at αg = 0.15. The simulated results are consistent with the experimental results; this indicates that the simulation method in this study is reliable. Since the inlet flow rate of PAT decreases with the increase in IGVF, the start-up time under gas–liquid two-phase conditions is longer than that under pure water conditions.

3. Results and Analysis

3.1. Internal Flow Field Distribution

Whether the pressure distribution is uniform in the impeller channel directly affects the force of the impeller. The pressure distribution in the impeller is related to the change in rotational speed. The starting process is an accelerated motion with smaller and smaller acceleration. At the beginning of starting, the acceleration is rather big, and the pressure distributes more unevenly in the impeller. With the decrease in acceleration, the pressure distributes more uniformly and gradually becomes a gradient distribution in the impeller. From the most uneven at the beginning to the gradual gradient distribution afterward, the variation trend of pressure distribution during the start-up process is similar at different IGVFs. Thus the IGVF αg = 0.15 is taken as an example for analysis. Figure 7 shows the static pressure distribution of the axial vertical plane in the flow field domain during the start-up process. From the diagram, it is observed that a lot of low-pressure areas appear in the impeller flow channel at t = 1 s. At t = 2 s, with the increase in rotational speed, the low-pressure area in the impeller gradually decreases and converges to the inner edge of the impeller. After t = 3 s, the rotational speed tends to be stable, and the pressure decreases gradually from the volute inlet to the impeller outlet in gradient distribution along the channel direction. The low-pressure area is mainly concentrated on the inner edge of the impeller. The pressure on the suction surface of the blade is more significant than that on the pressure surface of the blade.
Figure 8 shows the velocity streamline distribution of the axial vertical surface in the flow field during the start-up process. From the diagram, it is observed that large-scale high-intensity vortices are formed in the impeller flow channel at t = 1 s. At t = 2 s, with the increase in rotational speed, the vortex intensity in the impeller decreases, and the vortices aggregate near the outer edge of the impeller. After t = 3 s, the rotational speed tends to be stable, the vortex intensity in the impeller decreases further, and the vortices show a stability trend. They are mainly concentrated on the outer edge of the impeller.
Figure 9 shows the gas volume fraction distribution of the axial vertical plane in the flow field during the start-up process. From the diagram, it is observed that the gas phase distribution in the whole flow field is not uniform at t = 1 s. The gas volume fraction in the middle area of the impeller flow channel is high, and the distribution range is wide. Compared with the velocity streamline in Figure 8, it is found that the area with high gas phase concentration corresponds to a strong vortex at the beginning of start-up, which shows that the generation of vortex in the impeller flow channel has a great relationship with the accumulation of gas. At t = 2 s, the area of high gas phase concentration decreases significantly, and the gas phase gradually gathers to the central region of the impeller. After t = 3 s, the gas volume fraction increases gradually from the volute inlet to the draft tube outlet. The gas phase will gather more in the inner edge of the impeller, and the gas volume fraction near the blade suction surface is more significant than that near the blade pressure surface. It is indicated that the gas phase tends to move along the blade suction toward the impeller outlet. After entering the impeller, the liquid phase is subjected to a sizeable inertial force and centrifugal force, deviating from the typical streamlined trajectory and moving to the blade pressure surface. In comparison, the inertial and centrifugal force of the gas phase subjected is relatively less. Under the squeezing action of the liquid phase, the gas phase is forced to shift to the suction surface, so the gas volume fraction of the suction surface is higher.

3.2. Blade Load Distribution

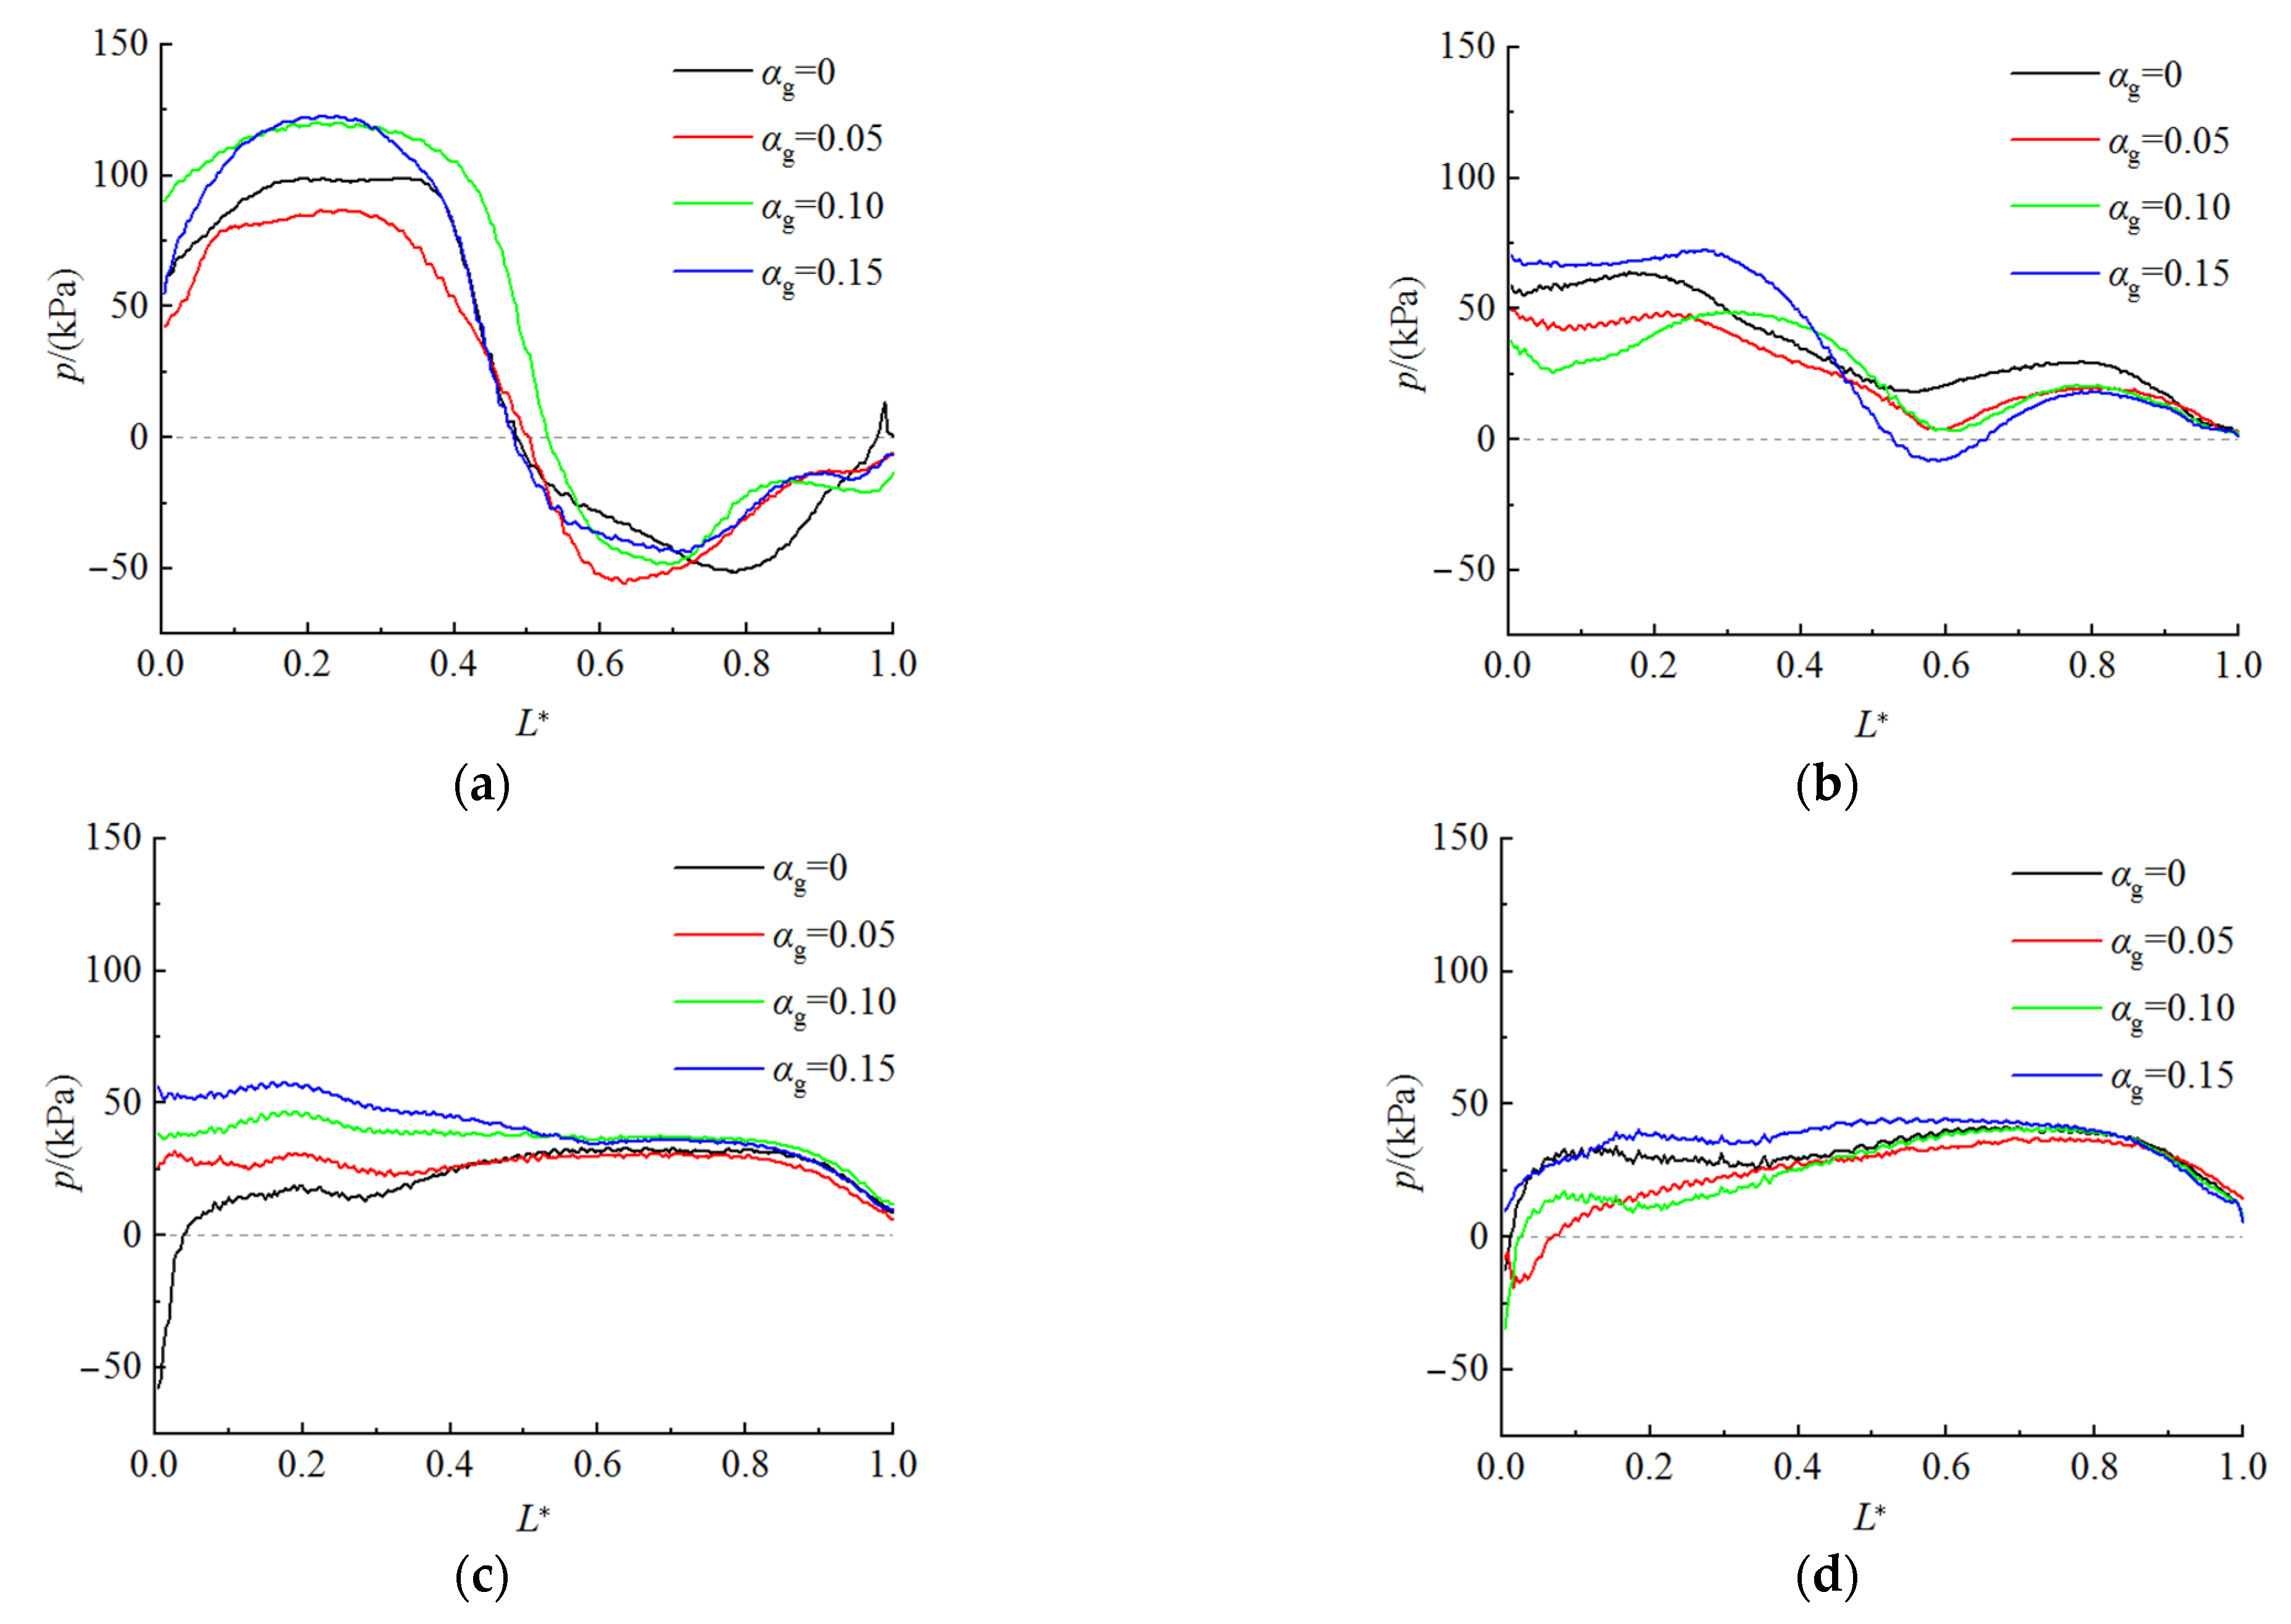
The size and distribution characteristics of the PAT blade load directly affect the conversion efficiency between fluid and mechanical energy and the stable operation of the equipment. The blade load is obtained by calculating the pressure difference between the blade pressure surface and the blade suction surface. Figure 10 shows the distribution of blade load during the start-up process under different inlet volume fractions. The ordinate p in the figure is the blade load, and the abscissa L* is the dimensionless parameter representing the blade position. The 0 position defines the blade inlet, and the 1 position defines the blade outlet. From the diagram, it is observed that the blade load will oscillate violently from blade inlet to blade outlet under pure water and gas–liquid two-phase conditions at t = 1 s. The maximum positive load is generated at the position of 0.24~0.34. At this moment, the pressure on the pressure surface is more significant than on the suction surface, resulting in the maximum dynamic torque. The blade load becomes 0 at the position of 0.48~0.53. The maximum negative load is generated at the position of 0.63~0.78. At this moment, the pressure on the pressure surface is less than that on the suction surface, resulting in the maximum resistance torque. At t = 2 s, the oscillation of the blade load distribution curve obviously weakens. The amplitude of the blade load is the largest under the condition of αg = 0.15. The wave peak of the blade load curve is at 0.27 position, and its wave trough is at 0.59 position. The maximum amplitude of the blade load is reduced to 0.59 times that at t = 1 s. At t = 3 s, the blade load distribution is relatively flat under gas–liquid two-phase conditions. The blade load is the largest under the condition of αg = 0.15, and the maximum blade load is 0.47 times that at t = 1 s. At t = 4 s, the distribution of blade load shows a similar trend of steady condition. The blade load increases rapidly along the flow direction of the fluid firstly and then changes gently to the maximum load at the position of 0.6~0.8. The maximum blade load is 0.36 times that at t = 1 s, and then the blade load decreases gradually to 0. It is proposed that the maximum load at the initial start-up moment is distributed near the outer edge of the blade. With the increase in the rotational speed, the oscillation of the blade load gradually weakens. After the rotational speed is stable, the maximum load is distributed near the inner edge of the blade. At the initial start-up moment, the greater the IGVF, the greater the amplitude of the blade load. The crowding effect of the gas phase on the liquid phase increases with the increase in the IGVF, which results in the uneven distribution of the liquid pressure in the impeller flow channel and weakens the workability of the liquid phase to the impeller. Therefore, decreasing the IGVF is helpful in reducing the oscillation of the blade load during the start-up process, and thus the stability of the start-up process will be improved.

3.3. Radial Force Analysis

When the fluid enters the PAT impeller through the spiral volute, the fluid pressure distribution is not uniform around the impeller. Thus, the radial force acting on the impeller will be produced. The vibration is caused by dynamic and static interference between the rotating and stationary parts in the start-up process [23]. By monitoring the x-direction force Fx and y-direction force Fy of the entire impeller during the start-up process, their resultant force is the radial force Fr. Figure 11 shows the radial force vector distribution of a rotation period during the start-up process at αg = 0.15. The magnitude and direction of the radial force on the impeller change during the start-up process. At t = 1 s, the amplitude of radial force fluctuation is the largest. Due to the uneven distribution of the local vortex formed by the liquid flow in the impeller flow channel, the unbalanced radial force is produced on the impeller, and the vector trajectory of radial force is in the fourth quadrant. At t = 2 s, the vector trajectory of radial force reduces and is still in the fourth quadrant, but its center shifts to the lower left side compared to t = 1 s. When t ≥ 3 s, the vector trajectory of radial force is slightly enlarged, and its shape is approximately elliptical. This is because the PAT IGVF reaches a certain level, and the bubble destroys the symmetry of the internal flow of the impeller, resulting in uneven distribution of the liquid flow in each flow channel, and thus causing periodic unbalanced radial force, which will affect the stability of the start-up process.
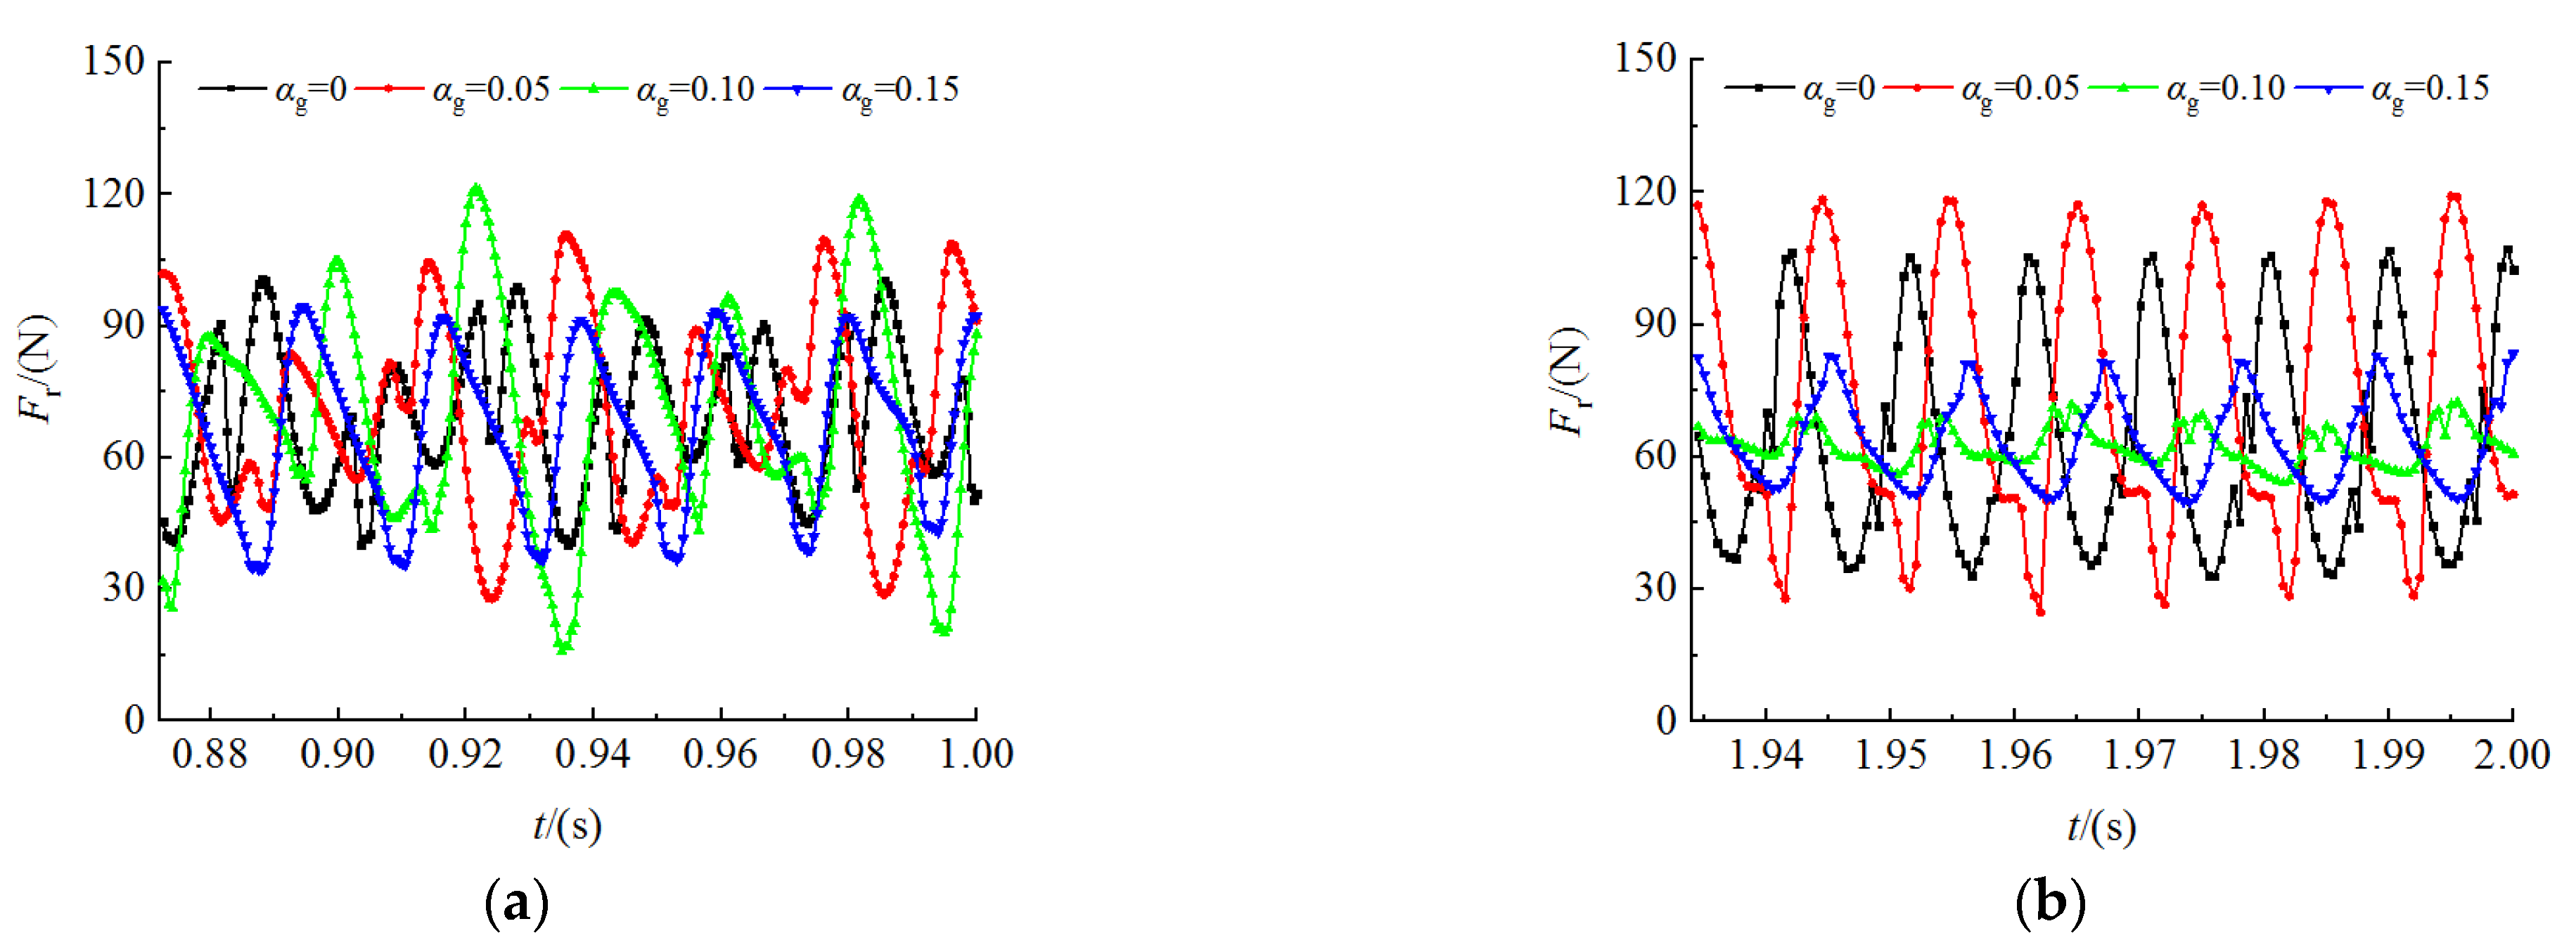
To compare the effect of different IGVFs on the radial force time domain of the PAT start-up process, the start-up process has been respectively calculated under four conditions of αg = 0, αg = 0.05, αg = 0.10, and αg = 0.15. The time domain characteristic of radial force during the start-up process is shown in Figure 12. The abscissa is a rotation period when αg = 0.15, and the ordinate is the radial force. Due to the lower IGVF, the greater the liquid inlet flow rate, the faster the PAT accelerates during the start-up process. At the same time, the more minor the IGVF, the more the number of radial force fluctuation. At t = 1 s, the time domain distribution of radial force is not uniform under different IGVFs. The amplitude of radial force is the largest under the condition of αg = 0.10. At t = 2 s, the amplitude of radial force under αg = 0 and αg = 0.05 is much larger than that under αg = 0.10 and αg = 0.15. When t ≥ 3 s, the time domain distribution of radial force tends to be stable and oscillates periodically. The amplitude of radial force at low IGVF is slightly larger than at high IGVF. The number of radial force fluctuations is consistent with the blade number in each change period. The impeller rotates one cycle, and the radial force fluctuates six times.
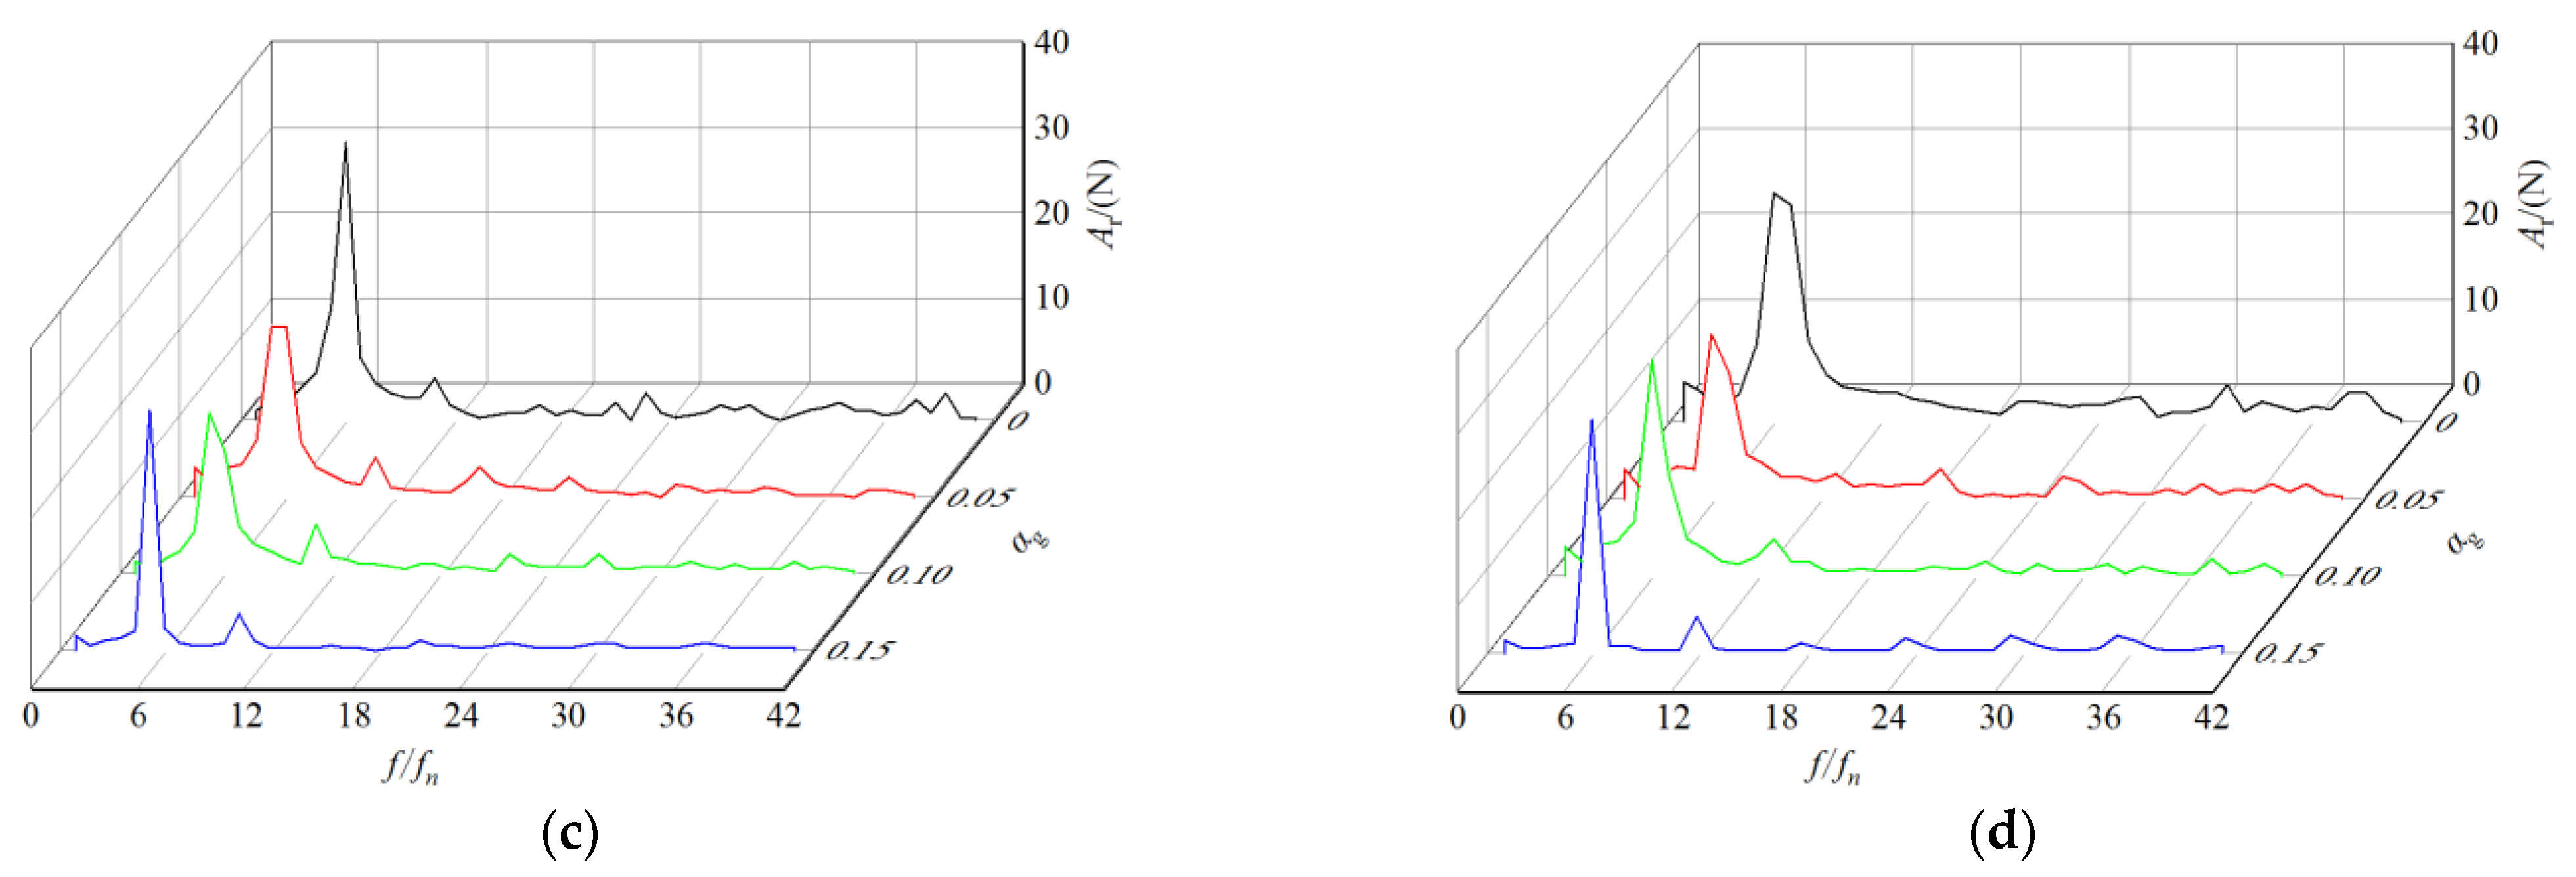
The frequency domain diagram of radial force is obtained by the Fast Fourier transform (FFT) for the time domain diagram of radial force in Figure 12, as shown in Figure 13. In the graph, the abscissa represents the multiple between the radial force frequency (f) and the impeller rotation frequency (fn), and the ordinate represents the amplitude of radial force pulsation (Ar). At t = 1 s, the dominant frequency of radial force is 2 fn, and its amplitude under gas–liquid two-phase conditions is more significant than that under pure water conditions. At t = 2 s, the dominant frequency of radial force is 4 fn. At t = 3 s, the dominant frequency of radial force is 5 fn. Its amplitude is the largest under the pure water conditions and the smallest under the condition of αg = 0.10. At t = 4 s, the dominant frequency of radial force is 6 fn, that is, the blade rotation frequency and the secondary frequency is two times the blade rotation frequency. With the increase in IGVF, the dominant frequency amplitude of radial force increases slightly. From the pure liquid conditions to the gas–liquid two-phase conditions with increasing IGVF, at the same time, the dominant frequency amplitude shows a similar trend of decreasing firstly but then increasing. This is because a small number of bubbles will increase the non-uniformity of the flow rate, which prompts the mainstream direction to change, and causes the radial velocity of the internal fluid particles in the impeller to change. The amplitude of radial force pulsation becomes lower under gas–liquid two-phase conditions than pure water conditions. When the IGVF increases, the tiny bubbles rise and merge to form an unstable bubble flow. These bubbles continue to rupture or merge, which will exacerbate the oscillation of radial force.

3.4. Axial Force Analysis

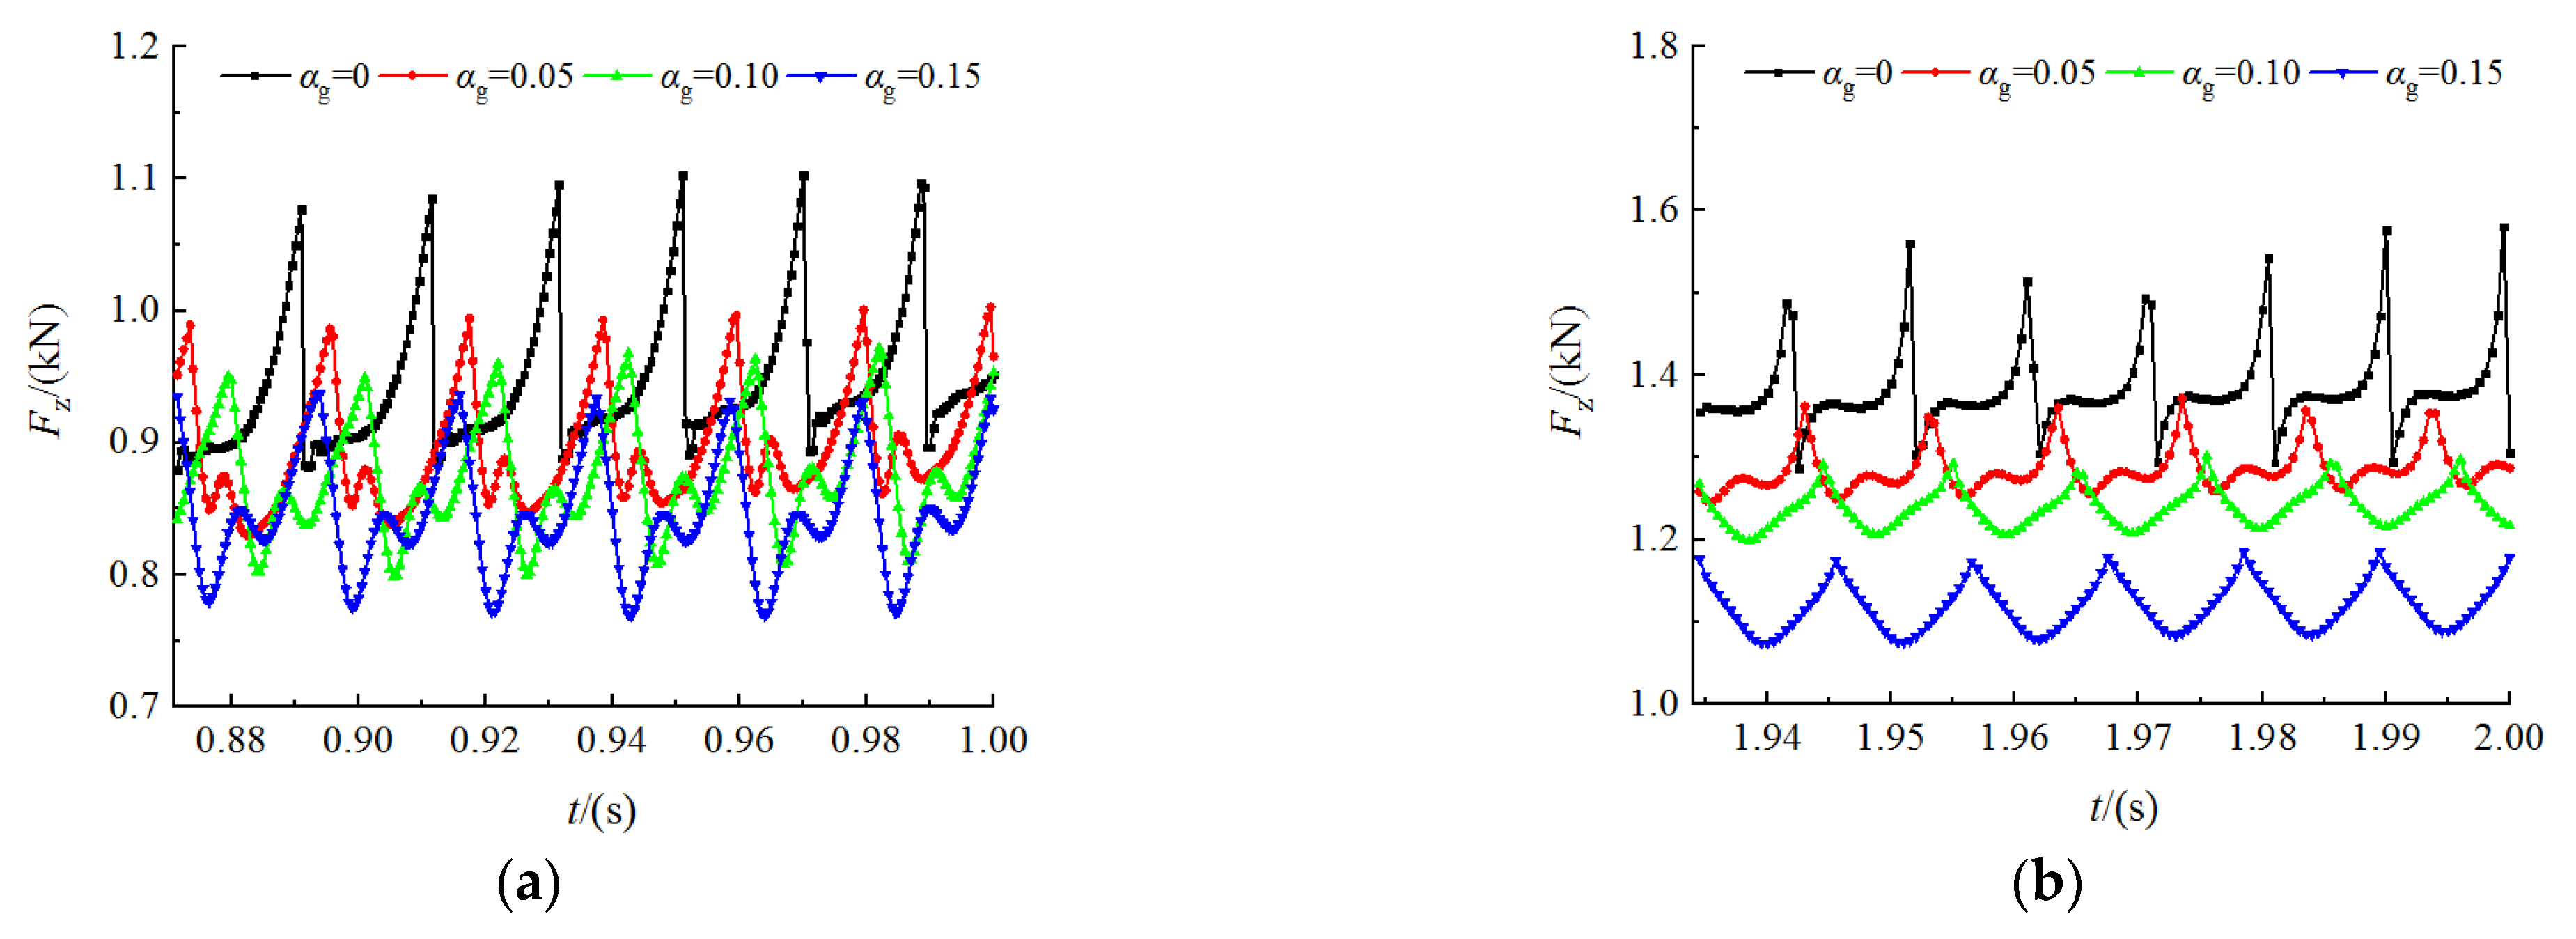
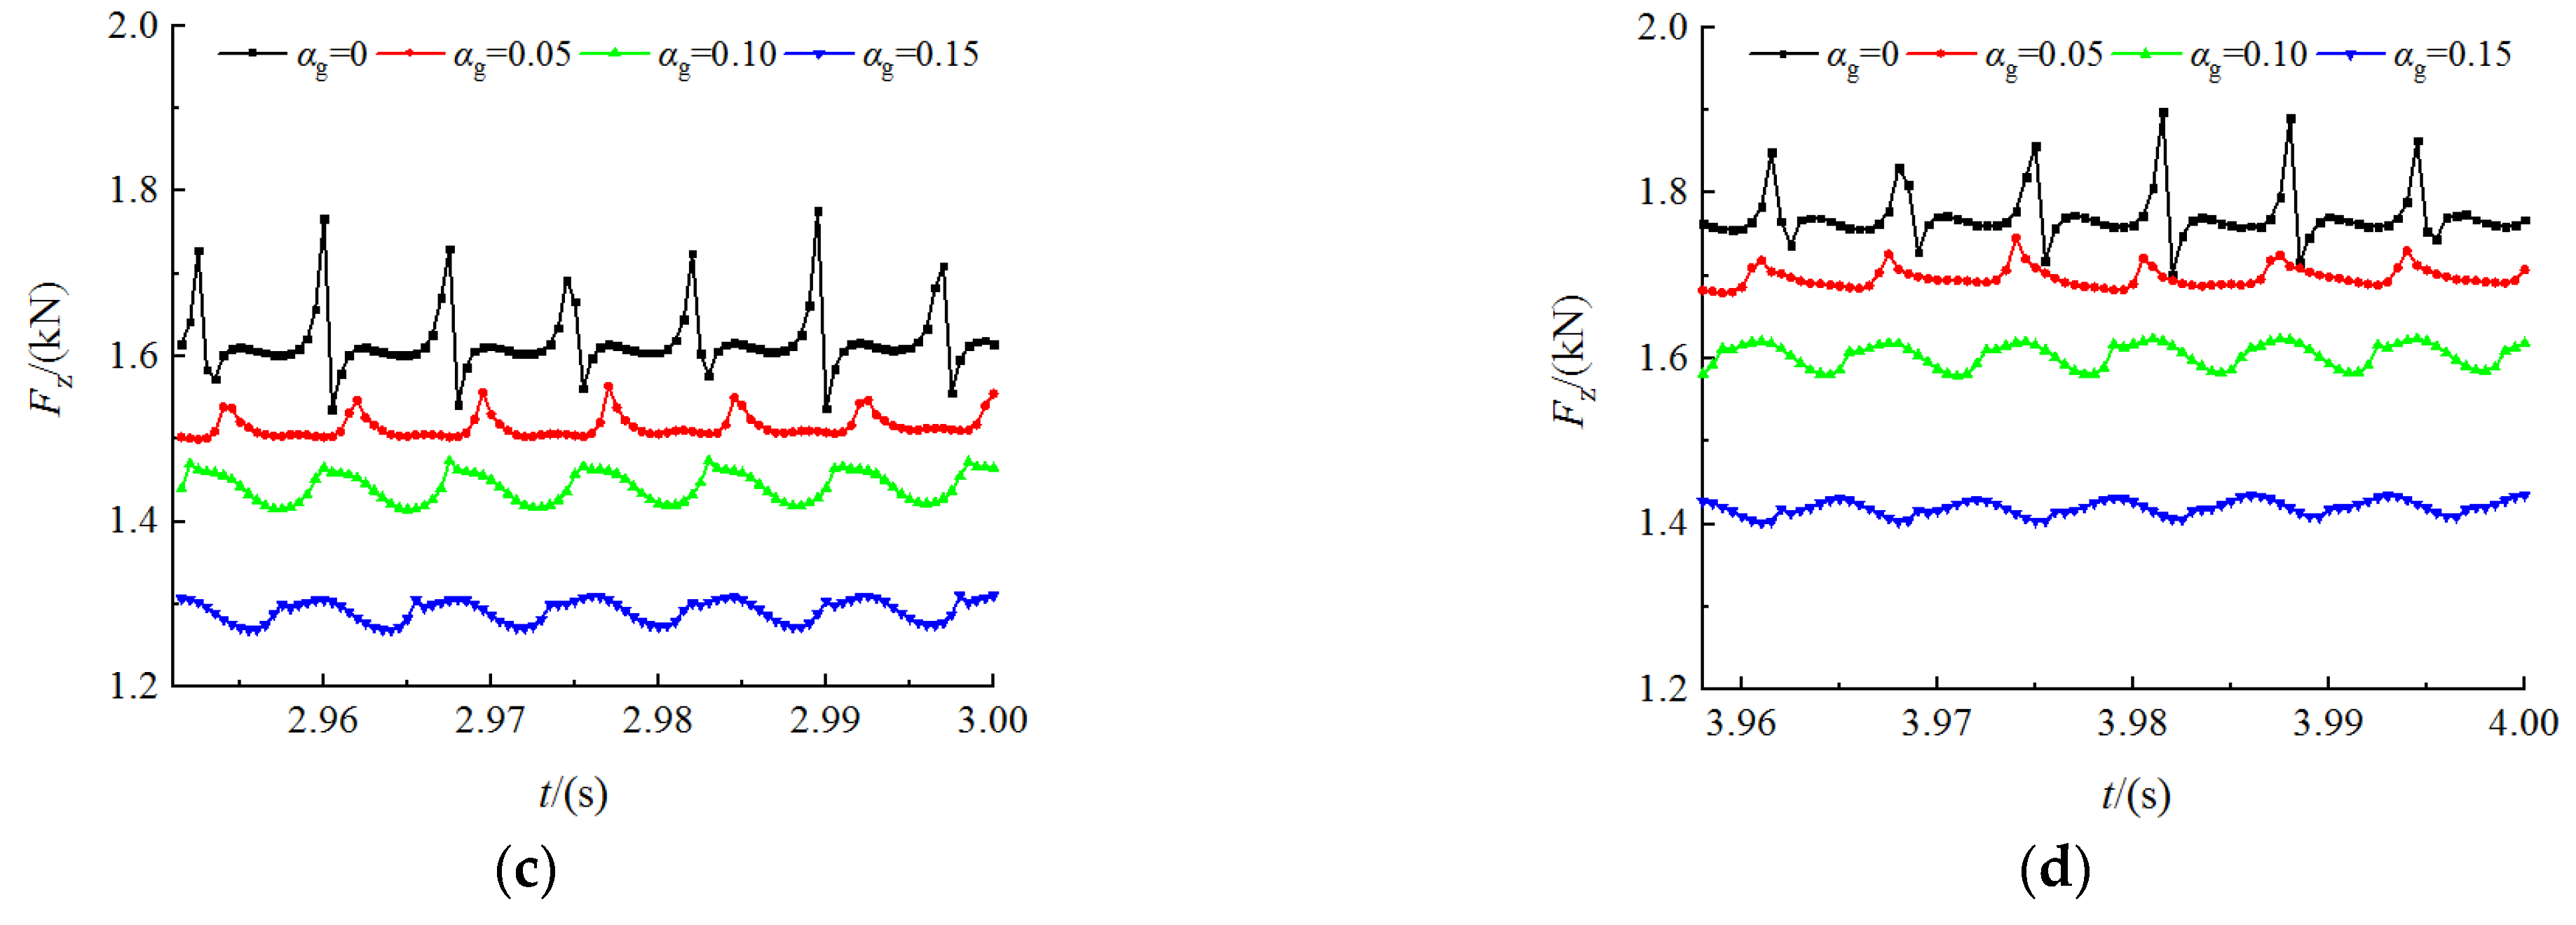
Due to the asymmetry between the front and the back shroud of the impeller and the difference in compression area, the axial force acting on the PAT impeller is produced in its start-up process. The axial force is mainly composed of the internal force acting on the front and the back shroud of the impeller, the external force acting on them, and the force acting on the blade [14]. The start-up process has been respectively calculated under four conditions of αg = 0, αg = 0.05, αg = 0.10, and αg = 0.15. The time domain characteristic of axial force during the start-up process is shown in Figure 14. At t = 1 s, the axial force shows the maximum amplitude and fluctuates twice in a fluctuation cycle under gas–liquid two-phase conditions. The magnitude and amplitude of the axial force under pure water conditions are greater than those under gas–liquid two-phase conditions. At t = 2 s, the axial force at αg = 0 and αg = 0.05 has a secondary fluctuation in a fluctuation period, and the axial force at αg = 0.1 and αg = 0.15 has a periodic oscillation. When t ≥ 3 s, the axial force oscillates periodically under different IGVFs, and the amplitude of the axial force decreases gradually. The magnitude of axial force under low IGVF is more significant than those under high IGVF. The number of axial force fluctuations in each change cycle is consistent with the blade number.
The frequency domain diagram of axial force is obtained by the FFT for the time domain diagram of axial force in Figure 14, as shown in Figure 15. At t = 1 s, the dominant frequency of axial force is 2 fn, and its amplitude under the gas–liquid two-phase conditions is more significant than that under the pure water conditions. At t = 2 s, the dominant frequency of axial force is 4 fn, and its amplitude is the largest at αg = 0.15. The frequency domain amplitude of axial force under pure water conditions attenuates slowly. The axial force still has a large frequency domain amplitude at the high-order frequency multiplication of the blade rotation frequency. At t = 3 s, the dominant frequency of axial force is 5 fn. At t = 4 s, the dominant frequency of axial force is 6 fn, that is, the blade rotation frequency, and the secondary frequency is equal to 2 times the blade rotation frequency. At the beginning of start-up, the dominant frequency amplitude of axial force is the largest, gradually decreasing with the increase in rotational speed. The higher the IGVF, the greater the dominant frequency amplitude of axial force at the same time.

4. Conclusions

In this study, the evolution mechanism of the internal flow field and the force characteristics during the PAT start-up process under gas–liquid two-phase conditions were proposed using numerical simulation and experiments. The major findings are as follows:
(1)
At the beginning of start-up, the gas volume fraction is high, its distribution is uneven in the impeller, and the area with high gas phase concentration corresponds to a strong vortex. With the increase in rotational speed, the low-pressure area, the high-concentration gas phase region, and the vortex intensity in the impeller gradually decrease. The gas phase gradually converges to the inner edge of the impeller, and the gas volume fraction of the blade suction surface is more significant than that of the blade pressure surface.
(2)
At the beginning of start-up, the blade load oscillates violently, and the maximum load is distributed near the outer edge of the blade. As the rotational speed increases, the oscillation of the blade load gradually weakens, and the maximum load is distributed near the inner edge of the blade after the rotational speed is stable. The larger the IGVF, the more severe the blade load oscillation during the start-up process. Therefore, reducing the IGVF is helpful in improving the stability of the PAT start-up process.
(3)
The periodic unbalanced radial force is produced in the start-up process. From the pure liquid conditions to the gas–liquid two-phase conditions with increasing IGVF, the dominant frequency amplitude of radial force shows a similar trend of decreasing first but then increasing. After the rotational speed tends to be stable, the dominant frequency of radial force is equal to the rotational frequency of the blade. With the increase in IGVF, the dominant frequency amplitude of radial force decreases slightly at the same time.
(4)
At the beginning of start-up, the axial force shows the maximum amplitude and fluctuates twice in a fluctuation cycle under gas–liquid two-phase conditions. With the increase in rotational speed, the dominant frequency amplitude of axial force decreases gradually. The higher the IGVF, the greater the dominant frequency amplitude of axial force at the same time.

Author Contributions

Conceptualization, B.C. and J.Y.; methodology, B.C. and J.Y.; software, B.C.; validation, B.C. and X.W.; formal analysis, B.C.; investigation, B.C. and X.W.; writing—original draft preparation, B.C.; writing—review and editing, B.C.; project administration, J.Y.; funding acquisition, J.Y. All authors have read and agreed to the published version of the manuscript.

Funding

This research was funded by the National Natural Science Foundation of China (grant number: 52169019) and the University Industry Support Project of Gansu Province (grant number: 2020C-20).

Data Availability Statement

The data presented in this study are available on request from the corresponding author.

Acknowledgments

The authors would like to express sincere appreciation to the editor and the anonymous reviewers for their valuable comments and suggestions for improving the presentation of the manuscript.

Conflicts of Interest

The authors declare no conflict of interest.

References

  1. Jain, S.; Patel, R. Investigations on pump running in turbine mode: A review of the state-of-the-art. Renew. Sustain. Energy Rev. 2014, 30, 841–868. [Google Scholar] [CrossRef]
  2. Wang, X.; Yang, J.; Shi, F. Status and prospect of study on energy recovery hydraulic turbines. J. Drain. Irrig. Mach. Eng. 2014, 32, 742–747. [Google Scholar]
  3. Maxime, B.; Su, W.; Li, X.; Li, F.; Wei, X.; An, S. Investigation on pump as turbine (PAT) technical aspects for micro hydropower schemes: A state of the art review. Renew. Sustain. Energy Rev. 2017, 79, 148–179. [Google Scholar]
  4. Barrios, L. Visualization and Modeling of Multiphase Performance Inside an Electrical Submersible Pump. Ph.D. Thesis, The University of Tulsa, Tulsa, OK, USA, 2007. [Google Scholar]
  5. Gamboa, J. Prediction of the Transition in Two-Phase Performance of an Electrical Submersible Pump. Ph.D. Thesis, The University of Tulsa, Tulsa, OK, USA, 2008. [Google Scholar]
  6. Li, G.; Wang, Y.; Zheng, Y.; Ma, X.; Liang, L.; Hu, R. Unsteady internal flow and thrust analysis of centrifugal pump under gas-liquid two-phase flow conditions. J. Drain. Irrig. Mach. Eng. 2016, 34, 369–374. [Google Scholar]
  7. Yuan, J.; Zhang, K.; Si, Q.; Zhou, B.; Tang, Y.; Jin, Z. Numerical investigation of gas-liquid two-phase flow in centrifugal pumps based on inhomogeneous model. Trans. Chin. Soc. Agric. Mach. 2017, 48, 89–95. [Google Scholar]
  8. Luo, X.; Yan, S.; Feng, J.; Zhu, G.; Sun, S.; Chen, S. Force characteristics of gas-liquid two-phase centrifugal pump. Trans. Chin. Soc. Agric. Eng. 2019, 35, 66–72. [Google Scholar]
  9. Michael, M.; Saketh, K.; Dominique, T. Investigations on the effect of rotational speed on the transport of air-water two-phase flows by centrifugal pumps. Int. J. Heat Fluid Flow 2022, 94, 108939. [Google Scholar]
  10. Yan, S.; Luo, X.; Feng, J.; Zhu, G.; Zhang, L.; Chen, S. Numerical simulation of a gas-liquid centrifugal pump under different inlet gas volume fraction conditions. Int. J. Fluid Mach. Syst. 2019, 12, 56–63. [Google Scholar]
  11. Zhang, W.; Yu, Z.; Zahid, M.; Li, Y. Study of the gas distribution in a multiphase rotodynamic pump based on interphase force analysis. Energies 2018, 11, 1069. [Google Scholar] [CrossRef] [Green Version]
  12. Anthony, C.; Laurent, G.; Daniel, P. Characteristics of centrifugal pumps working in direct or reverse mode: Focus on the unsteady radial thrust. Int. J. Rotating Mach. 2013, 2013, 279049. [Google Scholar]
  13. Shi, F.; Yang, J.; Wang, X. Numerical prediction of radial force in hydraulic turbine based on fluent. Adv. Mater. Res. 2013, 716, 717–720. [Google Scholar] [CrossRef]
  14. Qu, X.; Kong, F.; Chen, H. A numerical simulation and analysis of impeller axial force of pumps as turbines. China Rural. Water Hydropower 2013, 7, 96–102. [Google Scholar]
  15. Yang, J.; Li, T. Influence of volute configurations on radial force of hydraulic turbine. J. Drain. Irrig. Mach. Eng. 2015, 33, 651–656. [Google Scholar]
  16. Dai, C.; Kong, F.; Dong, L.; Zhang, H.; Feng, Z. Effect of blade wrap angle on the radial force of centrifugal pump as turbine. J. Vib. Shock 2015, 34, 69–72. [Google Scholar]
  17. Shi, F.; Yang, J.; Wang, X. Unsteady analysis of on effect hydraulic turbine under variable gas content. J. Aerosp. Power 2017, 32, 2265–2272. [Google Scholar]
  18. Shi, F.; Yang, J.; Miao, S.; Wang, X. Investigation on the power loss and radial force characteristics of pump as turbine under gas-liquid two-phase condition. Adv. Mech. Eng. 2019, 11, 1687814019843732. [Google Scholar]
  19. Shi, G.; Liu, Y.; Luo, K. Analysis of gas-liquid two-phase flow field in hydraulic turbine considering gas compressibility. J. Eng. Therm. Energy Power 2018, 33, 40–45. [Google Scholar]
  20. Sun, K.; Li, Y.; Zhao, J. Transient starting performance analysis of vertical axis tidal turbine. Huazhong Univ. Sci. Tech. Nat. Sci. Ed. 2017, 45, 51–56. [Google Scholar]
  21. Chen, W.; Liu, Y.; Chen, L.W. Study on hydrodynamic performance of horizontal tidal turbine rotating passively based on UDF. Ocean Eng. 2018, 36, 119–126. [Google Scholar]
  22. Untaroiu, A.; Wood, H.; Allaire, P.; Ribando, R. Investigation of self-starting capability of vertical axis wind turbines using a computational fluid dynamics approach. J. Sol. Energy Eng. 2011, 133, 125–134. [Google Scholar] [CrossRef]
  23. Barrio, R.; Fernandez, J.; Blanco, E.; Parrondo, J. Estimation of radial load in centrifugal pumps using computational fluid dynamics. Eur. J. Mech.-B/Fluids 2011, 3, 316–324. [Google Scholar] [CrossRef]
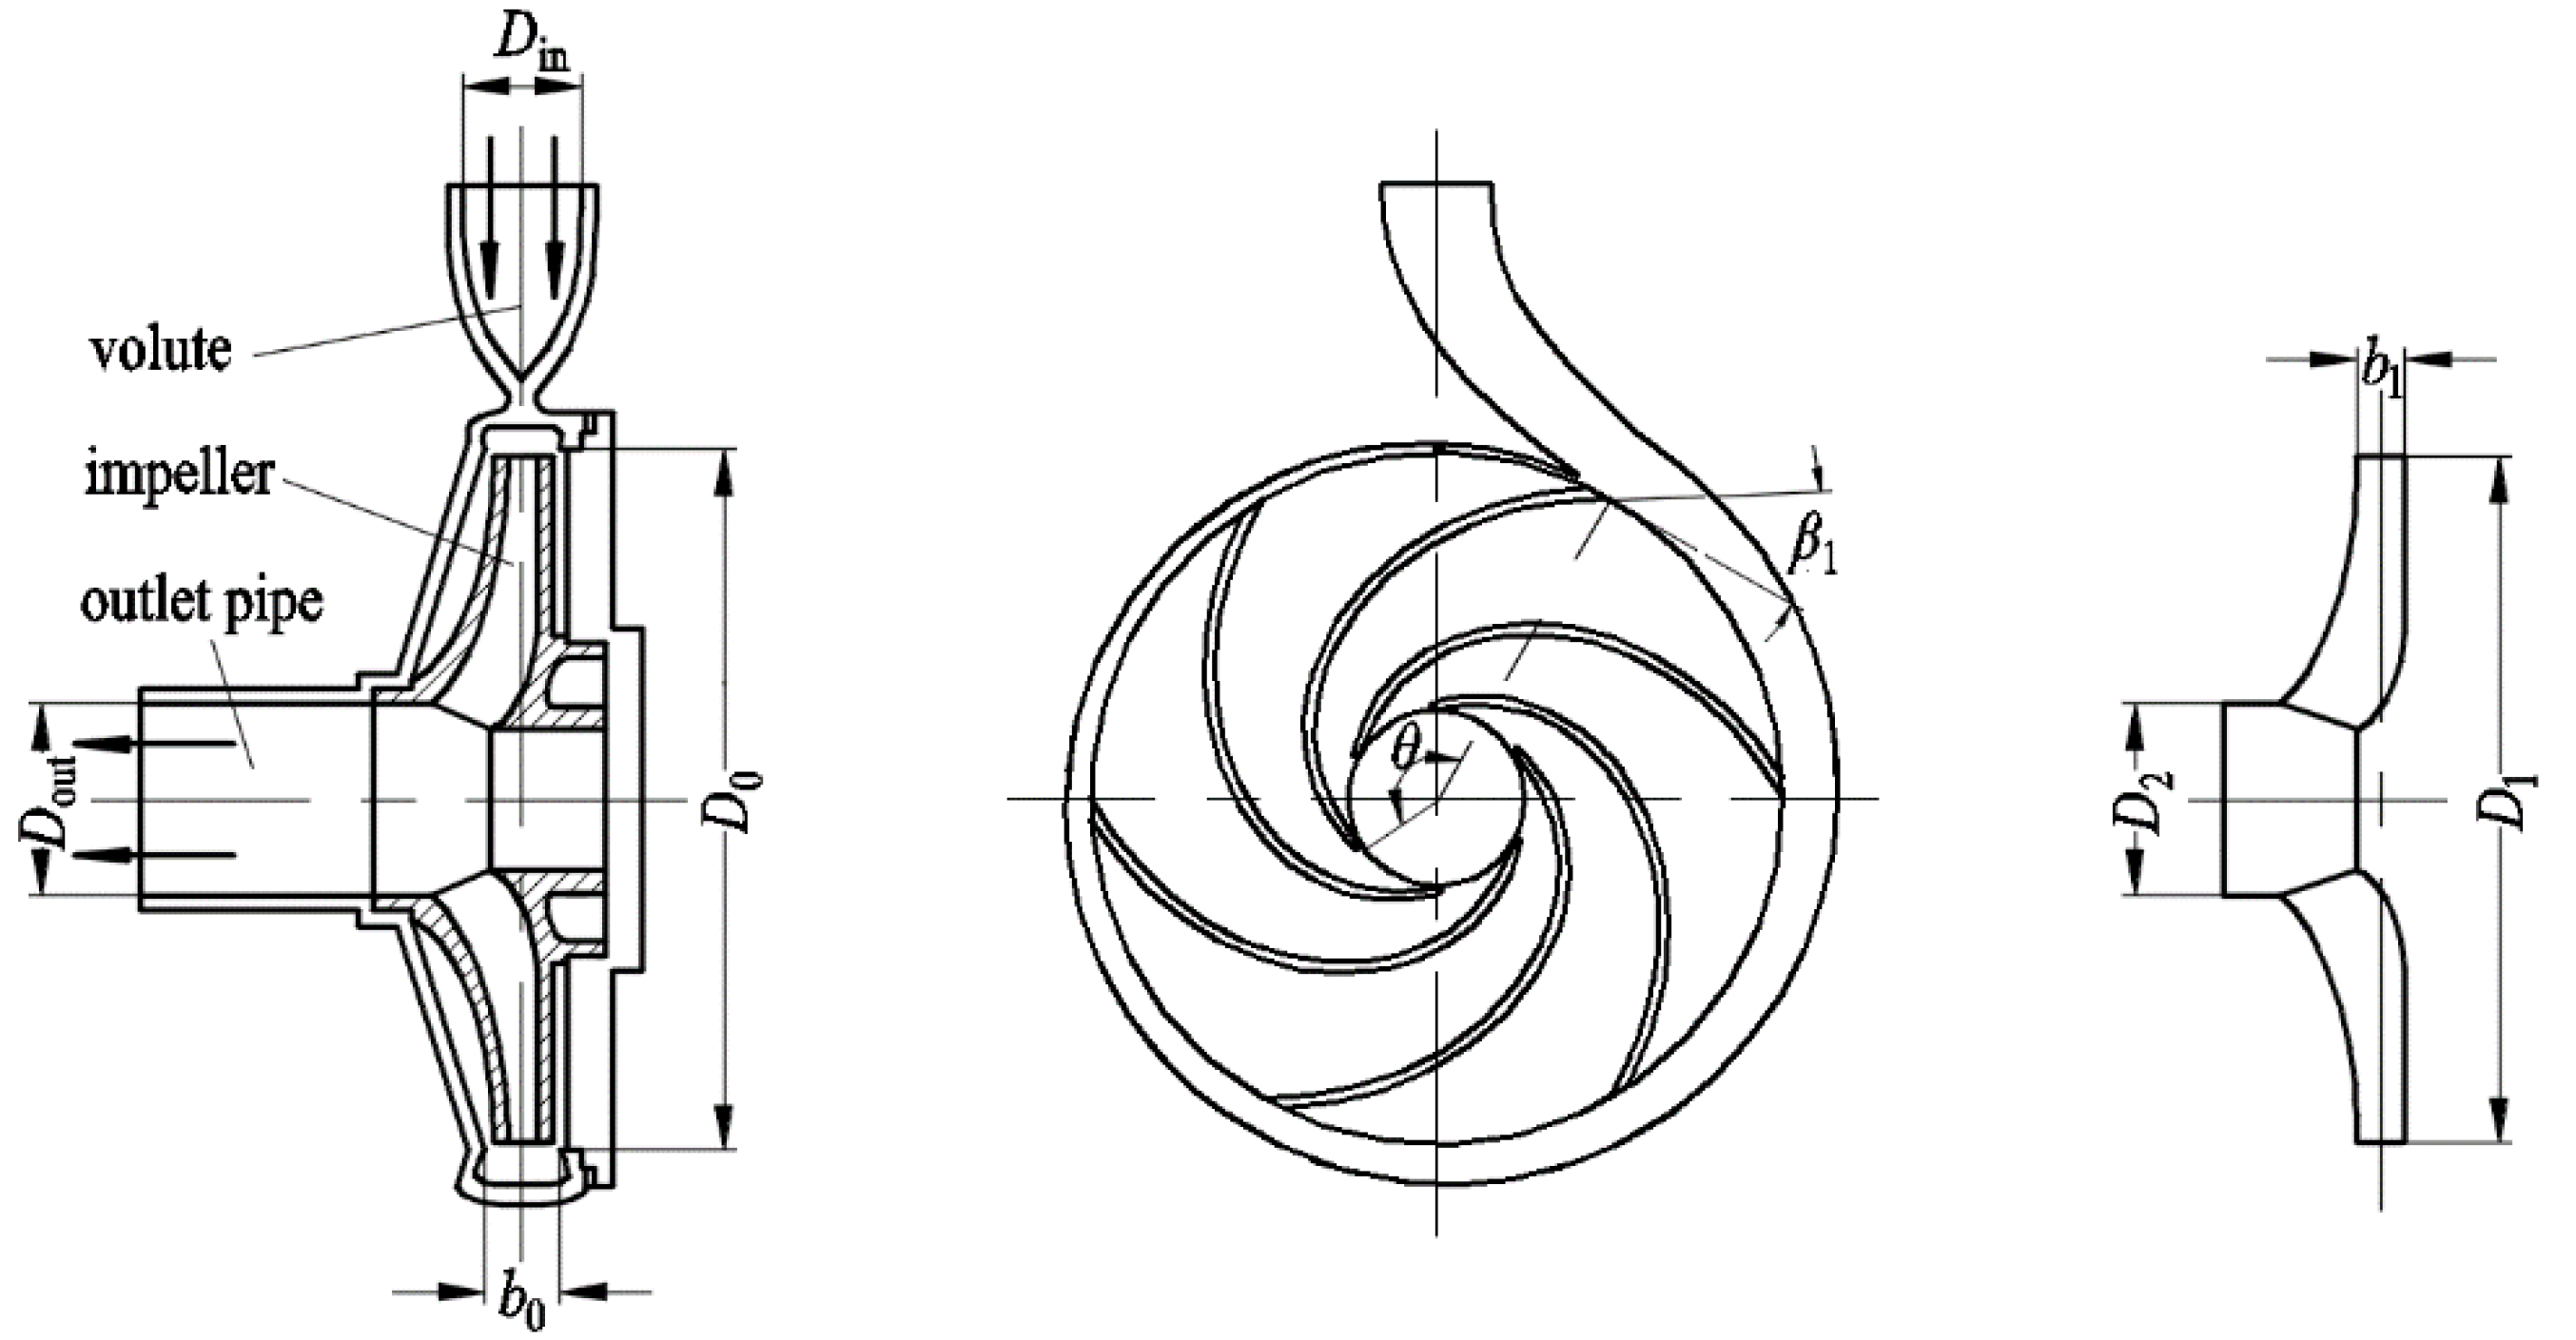
Figure 1. Structure of PAT.
Actuators 11 00370 g001
Figure 2. Fluid domain grid of PAT.
Actuators 11 00370 g002
Figure 3. Check of grid independence at IGVF of 0.15.
Actuators 11 00370 g003
Figure 4. Test device for PAT characteristics.
Actuators 11 00370 g004
Figure 5. Comparison of performance between simulated and experimental results at αg = 0.15.
Actuators 11 00370 g005
Figure 6. Comparison of rotational speed during the start-up process between simulated and experimental results at αg = 0.15.
Actuators 11 00370 g006
Figure 7. Pressure distribution of axial vertical plane at αg = 0.15. (a) t = 1 s; (b) t = 2 s; (c) t = 3 s; (d) t = 4 s.
Actuators 11 00370 g007
Figure 8. Velocity streamlines distribution of the axial vertical plane at αg = 0.15. (a) t = 1 s; (b) t = 2 s; (c) t = 3 s; (d) t = 4 s.
Actuators 11 00370 g008
Figure 9. Gas volume fraction distribution of axial vertical plane at αg = 0.15. (a) t = 1 s; (b) t = 2 s; (c) t = 3 s; (d) t = 4 s.
Actuators 11 00370 g009
Figure 10. Blade load of PAT during the start-up process. (a) t = 1 s; (b) t = 2 s; (c) t = 3 s; (d) t = 4 s.
Actuators 11 00370 g010
Figure 11. Vector distribution of radial force during the start-up process at αg = 0.15. (a) t = 1 s; (b) t = 2 s; (c) t = 3 s; (d) t = 4 s.
Actuators 11 00370 g011
Figure 12. Time domain characteristic of radial force during the start-up process. (a) t = 1 s; (b) t = 2 s; (c) t = 3 s; (d) t = 4 s.
Actuators 11 00370 g012aActuators 11 00370 g012b
Figure 13. Frequency domain characteristic of radial force pulsation during the start-up process. (a) t = 1 s; (b) t = 2 s; (c) t = 3 s; (d) t = 4 s.
Actuators 11 00370 g013aActuators 11 00370 g013b
Figure 14. Time domain characteristic of axial force during the start-up process. (a) t = 1 s; (b) t = 2 s; (c) t = 3 s; (d) t = 4 s.
Actuators 11 00370 g014aActuators 11 00370 g014b
Figure 15. Frequency domain characteristic of axial force pulsation during the start-up process. (a) t = 1 s; (b) t = 2 s; (c) t = 3 s; (d) t = 4 s.
Actuators 11 00370 g015
Publisher’s Note: MDPI stays neutral with regard to jurisdictional claims in published maps and institutional affiliations.