Article

Mechanism of Thrust–Power Ratio Improvement Using Plasma Actuator with Discretized Encapsulated Electrodes

1
Research Institute for Energy Conservation, National Institute of Advanced Industrial Science and Technology (AIST), Ibaraki 305-8564, Japan
2
Graduate School of Engineering, Tokyo University of Science, Tokyo 125-8585, Japan
3
Department of Engineering, Tokyo University of Science, Tokyo 125-8585, Japan
*
Author to whom correspondence should be addressed.
Actuators 2022, 11(10), 296; https://doi.org/10.3390/act11100296
Submission received: 16 September 2022 / Revised: 11 October 2022 / Accepted: 12 October 2022 / Published: 14 October 2022
(This article belongs to the Special Issue Dielectric Barrier Discharge Plasma Actuator for Active Flow Control)

Abstract

:
Plasma actuators (PA) can be utilized as fluid control devices without moving parts, but further improvement in drive efficiency is necessary. Herein, string-type PAs with up to 12 insulated conductive wires were evaluated to replace sheet-type PAs having a single encapsulated electrode. The thrust–power ratio of string-type PAs with eight or more wires is nine times that of a single-wire PA. This is due to the substantial increase in the width of the encapsulated electrode and the discrete arrangement of conductors in the streamwise direction. To determine the factors influencing the performance of PAs with discrete encapsulated electrodes, sheet-type PAs with and without discretized encapsulated electrodes and with the same configuration as string-type PAs were characterized. The measurement results revealed that no significant difference exists in the plasma extension length (LDBD) between sheet-type PAs without and with discretization under the same applied voltage, but 25% and 45% decreases in the thrust and power consumption, respectively, were observed compared to those of string-type PAs. The discretization of the encapsulated electrodes in the sheet-type plasma actuator increased the thrust–power ratio by 30%. Efficient non-mechanical fluid control using dielectric barrier discharge is therefore possible with string-type PAs with discrete electrodes.

1. Introduction

Plasma actuators (PAs) utilizing dielectric barrier discharge (DBD) are attracting attention as fluid control devices without mechanical moving parts. The basic structure of a PA was proposed by Roth et al. in 1998 [1]. Since Corke et al. demonstrated the application of PAs for flow separation control on an airfoil in 2002, basic and applied research on this technology have been carried out extensively [2,3]. Conventional PAs (hereinafter referred to as sheet-type PAs) have an extremely simple structure wherein the electrodes are asymmetrically installed on both surfaces of a dielectric material (Figure 1). A typical sheet-type PA consists of a dielectric material sandwiched between exposed and encapsulated electrodes. When these electrodes are asymmetrically arranged in an xy cross-section, DBD plasma is generated near the edge of the exposed electrode, and the emitted electrons repeatedly collide with neutral particles when a radio frequency high voltage alternating current (AC) is applied between the bipolar electrodes. Impact ionization occurs when the collision energy is high, and an electron avalanche phenomenon occurs, whereby the electrons emitted from the neutral particles cause the next ionization collision. The charged particles generated in these processes are accelerated by an electric field at that moment, undergo momentum exchange owing to a collision with neutral particles, and transform into a one-way tangential flow along the wall surface. Sheet-type PAs offer several advantages over other flow control devices, such as weight reduction, high responsiveness via electrical control, and minimal influence on aerodynamic performance via thinning. However, as long as PAs are considered as devices for improving energy efficiency, improving their drive efficiency is essential. Therefore, many studies have performed detailed analyses on parameters such as the induced flow velocity, thrust, power consumption, DBD plasma spatial distribution, and extension length, which are indicators of PA performance [4,5,6].
On the other hand, when PAs are considered as fluid control devices, their mountability on the three-dimensional (3D) surfaces of fluidic systems is essential. When a sheet-type PA is attached to a 3D surface, wrinkles and steps develop which deteriorate the aerodynamic characteristics of the fluidic system. To solve these technical issues, string-type PAs (Figure 2a), which primarily comprise a conductive wire coated with a highly flexible insulation material, were proposed [7]. If a groove for embedding a metal wire is structured on the surface of the test piece, string-type PAs can be flush-mounted. As examples of active flow control utilizing string-type PAs, flow separation control on an airfoil [7] and a car door mirror model with half-cylindrical and quarter-spherical surfaces [8] have been experimentally demonstrated. String-type PAs are low cost, have high durability, and can be easily mounted onto 3D curved surfaces; these properties can be realized by utilizing conductive wires coated with silicone rubber. An additional advantage of string-type PAs is that the conductive wire is pre-insulated, except at both ends. This reduces the risk of short circuits caused by creep discharge. Furthermore, by grounding the exposed electrode and applying a high-voltage AC to the wire, electric shocks can be prevented during practical use, which significantly improves safety. However, the maximum induced flow velocity of string-type PAs is limited to ~2 m/s even when the applied voltage is increased [8]. Studies have suggested that this flow velocity limitation is caused by the wire diameter being similar to the width of the encapsulated electrode of sheet-type PAs. For example, Forte et al. investigated the effect of the width of an encapsulated electrode on the induced flow velocity in a conventional sheet-type PA and reported that the maximum flow velocity decreased with the width of the encapsulated electrode [9].
Therefore, this paper proposes that the induced flow velocity can be improved by substantially extending the encapsulated electrode arrangement downstream of the single wire by increasing the number of insulated conductive wires.

2. Experimental Setup

2.1. Specifications of the Three Types of Plasma Actuators

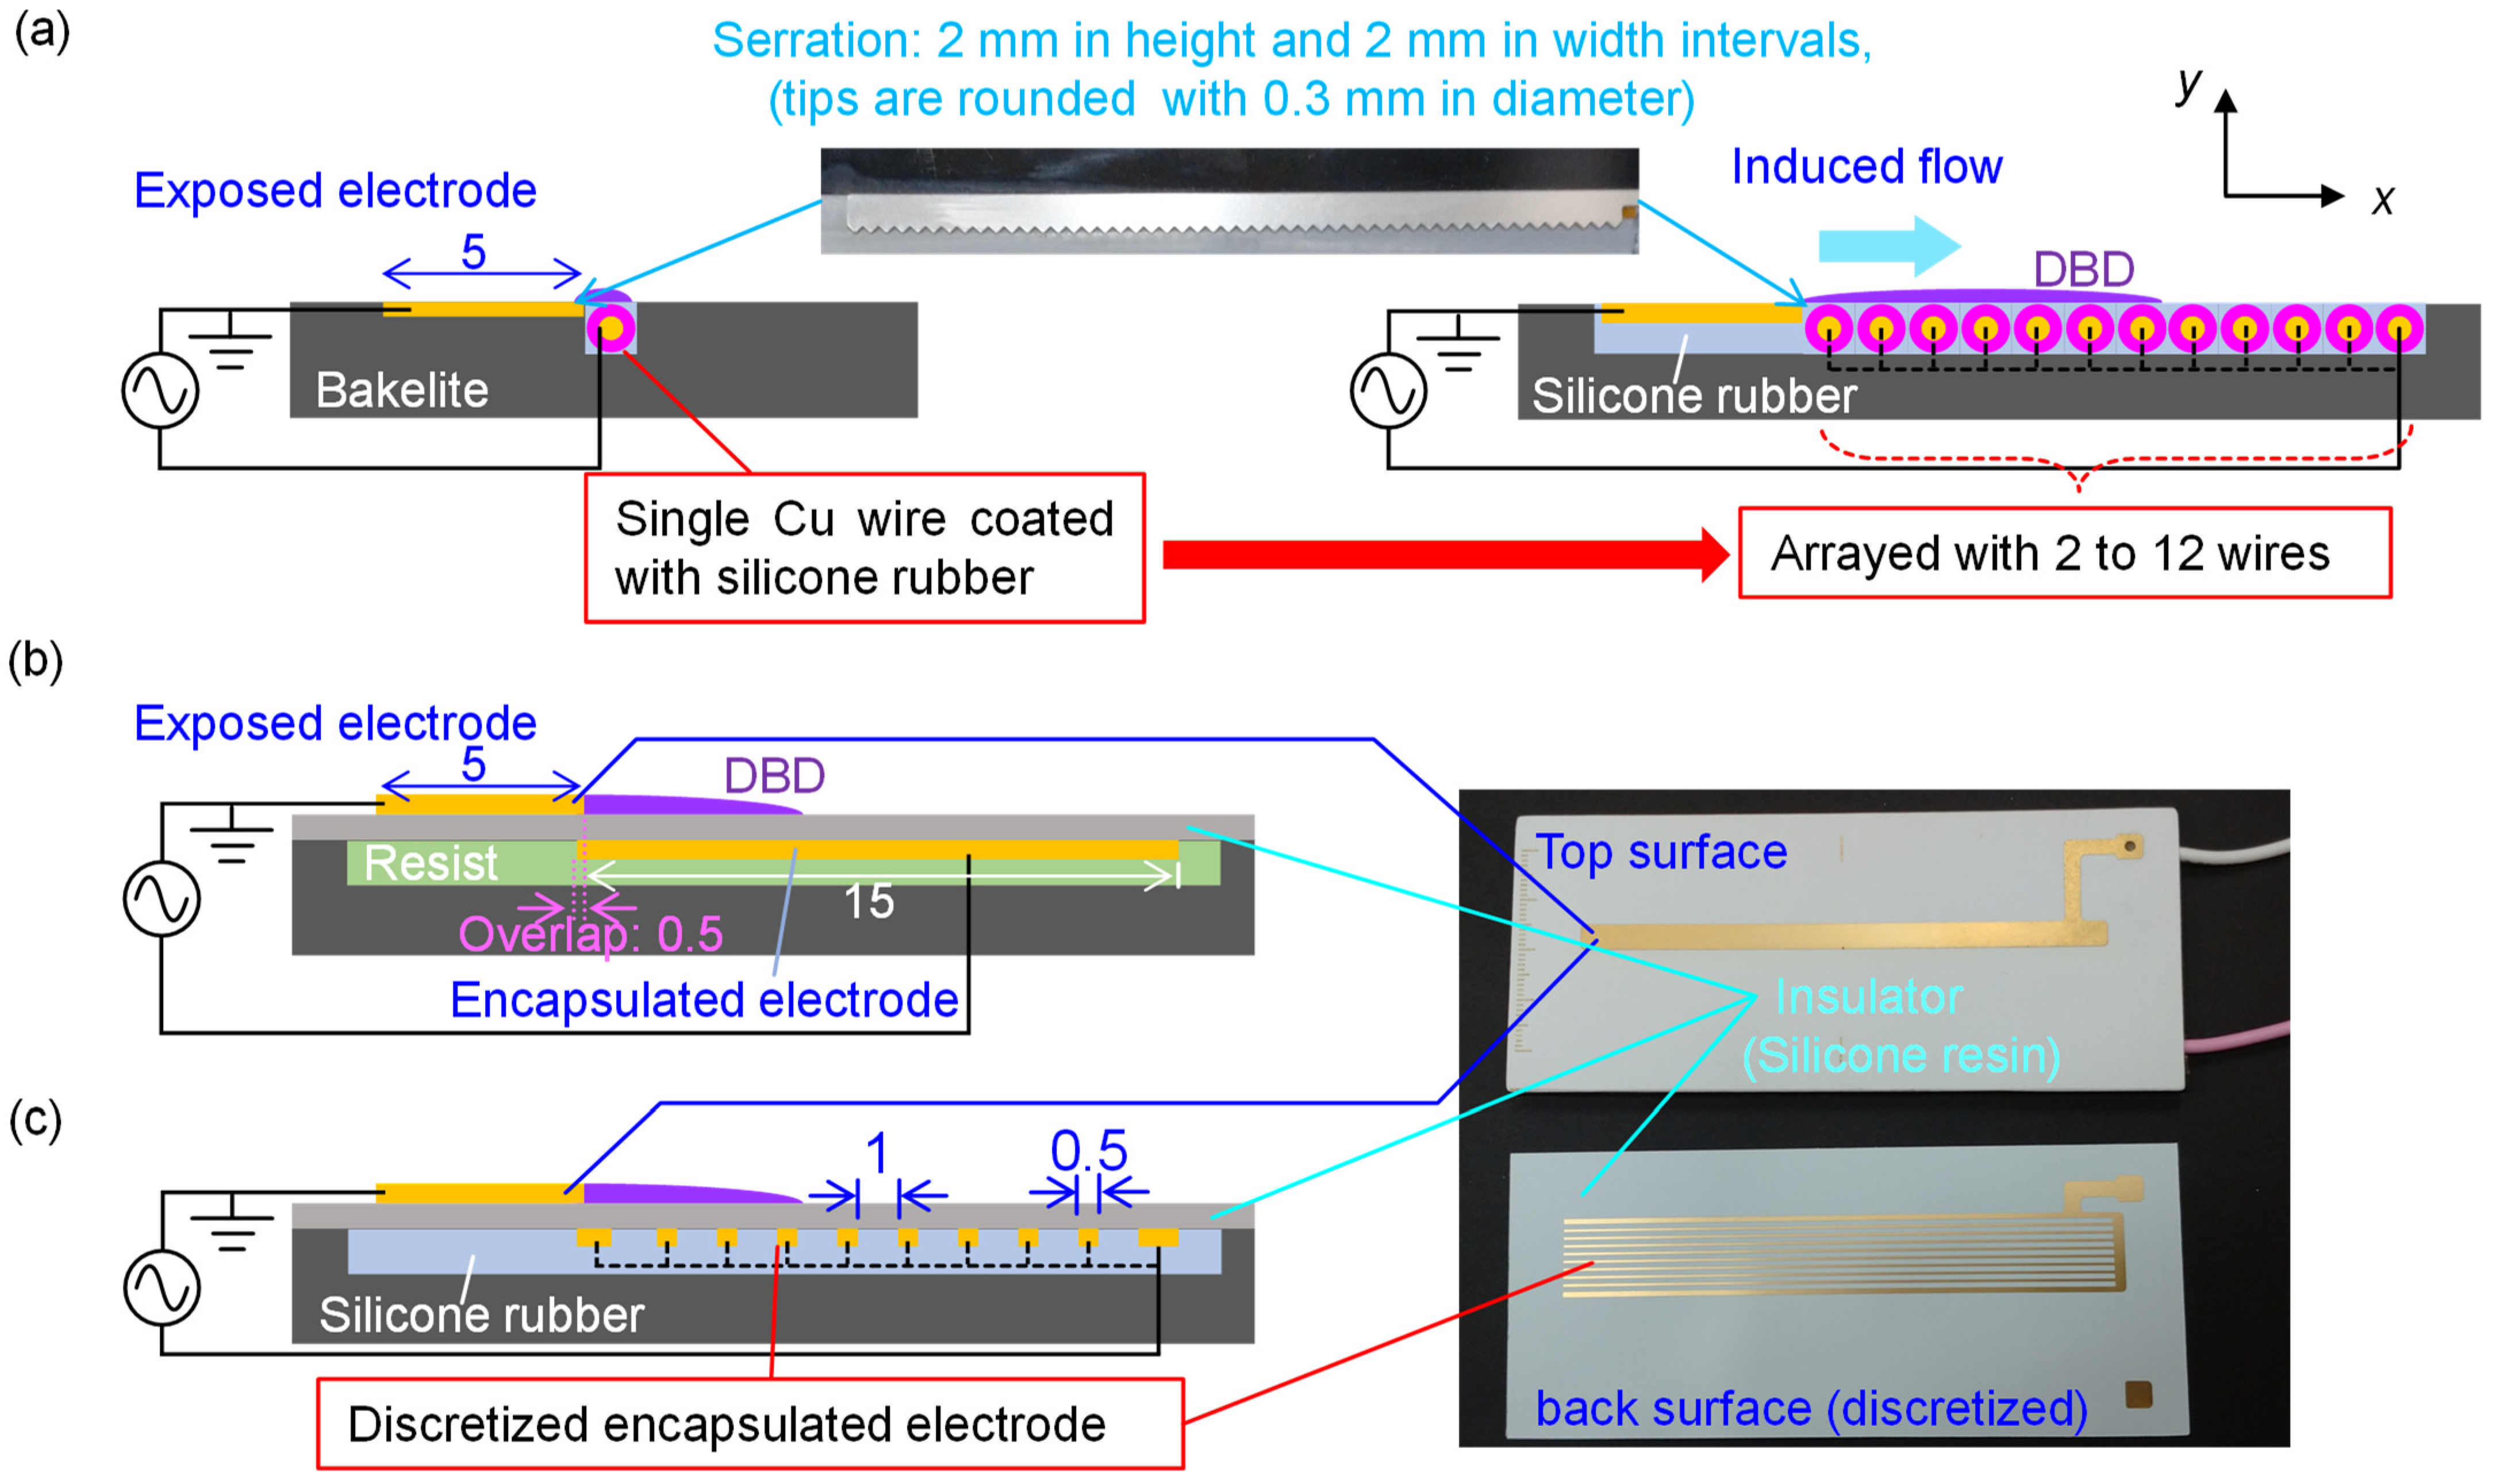
Figure 2a schematically illustrates a string-type PA comprising a copper wire coated with silicone rubber (Nissei Electric Co., Ltd., Hamamatsu, Japan: UL-3725, outer diameter: 1.3 mm, Cu diameter: 0.6 mm) and a conductive plate made of stainless steel (SUS304; streamwise width: 5 mm, thickness: 0.3 mm) as the exposed electrode. One-component room-temperature-curable silicone rubber (Shin-Etsu Chemical Co., Ltd., Tokyo, Japan, KE-3494) was used to fill the gaps between the wires and exposed electrode to eliminate step features on the test piece surface. Using the same manufacturing process, string-array-type PAs with multiple wires from two to a maximum of 12 were prototyped. Because the wires were fixed and molded using a custom molding jig, the distance between the exposed electrode edge and the conductive part of the wire of the string-array-type PA tended to be slightly uneven, unlike in the sheet-type PA. Previous studies have shown that the induced flow is accelerated and the velocity distribution is uniform when serrations exist on the exposed electrode edge where DBD occurs [4,10]. Therefore, exposed electrodes with serrations at intervals of 2 mm along the height and width, with 0.3 mm diameter rounded tips, were formed by etching the exposed side.
Figure 2b depicts a reference sheet-type PA (labeled as “Reference” in the figures) developed using a printed circuit board (PCB) process. The alignment accuracy of the electrode patterns formed on the front and back surfaces of the dielectric is less than 0.1 mm. The reference PA (PAK-Ref03) [11,12,13,14] facilitates comparison with the other PAs and several studies have already reported results on flow control using this type of PA. By etching double-sided copper-clad laminates (Risho Kogyo Co., Ltd., Osaka, Japan, CS-3975A; dielectric layer: 0.44 mm thick silicone resin, conductive layers: 0.018 mm thick copper), exposed and encapsulated electrodes were fabricated with streamwise widths of 5 and 15 mm, respectively, and a spanwise length of 100 mm. The electrodes were arranged asymmetrically in the streamwise direction and overlapped with a gap of 0.5 mm. In addition, the back electrode was coated with a 50 μm thick resist to prevent DBD generation.
However, a direct comparison is not possible between sheet-type and string-array-type PAs because the materials and structures are different. Therefore, a sheet-type PA with a discretized encapsulated electrode (labeled as “Discretized” in the figures, conductor width: 0.5 mm, and gap: 1.0 mm intervals), whose configuration was the same as those of the reference sheet-type PA except for the encapsulated electrode, was developed (Figure 2c). DBD generation on the back surface of the dielectric was prevented by filling with one-component room-temperature-curable silicone rubber.
Silicone resin and rubber are more durable against DBD due to siloxane (Si–O) bonds compared to C–C bonded polymers such as polyimide and polytetrafluoroethylene (PTFE). Therefore, noticeable erosions or deformations on the surfaces of PAs were not observed during the PA-driven period in this study.

2.2. Experimental System for Evaluating Flow and Electrical Characteristics

As mentioned in the introduction, safety must be considered for future practical use of plasma actuators; companies, in particular, are concerned about electric shock that may be caused by high voltage on the plasma actuator surface. Therefore, a series of experiments for clarifying the discretized effects of the encapsulated electrode using three types of PAs were conducted, by grounding the exposed electrodes and applying a high voltage to the encapsulated electrodes, as was adopted in our previous studies [7,8]. Reverse polarity has rarely been used in previous studies on PAs; Berendt et al. used reverse polarity for PAs with additional floating electrodes on the surface of the dielectric sheet to induce flow in the same direction as that under forward polarity [15].
The PAs were continuously driven (duty ratio 100%) with a sinusoidal waveform from a power supply (Matsusada Precision Inc., Tokyo, Japan, HAPS-10B40), and the input peak-to-peak voltage (Vp-p) was varied from 6 to 20 kV. The frequency of the input voltage (fp) was fixed at 6.4 kHz. As shown in Figure 3, the thrust generated during PA drive was measured using an electronic balance (AS ONE corp., Osaka, Japan, IUZ-101, maximum weight: 101 g, minimum display: 0.01 mg) as a load due to the reactive force of the thrust [4,6,16,17,18]. For the thrust measurements, the load was recorded for 60 s on a PC after it was balanced at zero. Five seconds after the start of the measurement, the PA was driven for 25 s; however, it took approximately 5 s for the load to become constant. Therefore, the thrust was calculated from the average load value during the 15 s (sampling rate: 8.3 Hz, 125-point load data) span from 10 to 25 s after driving the PA. A series of thrust measurements were performed five times separately for the string-array-type PA with 12 wires and for the reference and discretized sheet-type PAs; the standard deviations of the five measurements were evaluated as the uncertainty. The high-voltage AC applied to the PAs was measured using a high-voltage probe (Tektronix P6105A). The power consumption was estimated using the voltage–charge (V–Q) Lissajous method [19,20]. A capacitor, Cr = 22 nF, was connected in series with the PAs to estimate the electric charges on the PAs (QPA), and PPA was calculated as the product of fp and the area encompassed by the Lissajous figure (SVQ). The V-Q data time series was recorded 10 times from 5 to 20 s after the PA drive, SVQ was averaged 10 times to estimate the PA power consumption (PPA), and the uncertainty was evaluated as their standard deviations.
To analyze the velocity distributions of the induced flow by using particle image velocimetry (PIV), dioctyl sebacate (DOS) droplets atomized by a Laskin nozzle were used as seeding particles, and the two-dimensional velocity field in the x–y cross-section was visualized using a double-pulse Nd:YAG laser (Litron Lasers Ltd., Rugby, UK, Nano S 30-15PIV, 15 mJ per pulse). Three-hundred pairs of flow images were captured using a cross-correlation camera (TSI, Inc., Shoreview, MN, USA, PIV CAM 13-8) with a pixel resolution of 1280 × 1024 and a frame rate of 3.75 Hz. Velocity components (u,v) in each interrogation window corresponding to a square grid of 16 × 16 pixels were analyzed with 50% Nyquist overlap between adjacent interrogation windows using PIV software (TSI Inc., Insight ver. 3.53). The flow image resolution of each pixel was fixed at dpx (=dpy) = 25.1 μm per pixel in the xy cross-section. The laser pulse intervals yielding a pair of flow images (Δt) were varied such that the maximum displacement of the seeding particles in an interrogation window was less than 4 pixels during Δt. According to the applied peak-to-peak voltage, Δt was properly set in the range of 14 ≤ Δt ≤ 160 μs to acquire a pair of images. Because the minimum displacement of the seeding particles calculated using sub-pixel interpolation in PIV image processing is ~0.1 pixels, the uncertainties of the velocity components (u,v) in the xy cross-section were evaluated as 0.02 m/s for the minimum Vp-p and 0.18 m/s for the maximum Vp-p by calculating 0.1dpx/Δt.

3. Results

3.1. Performance Comparison between String-Type and Sheet-Type PAs without and with a Discretized Encapsulated Electrode

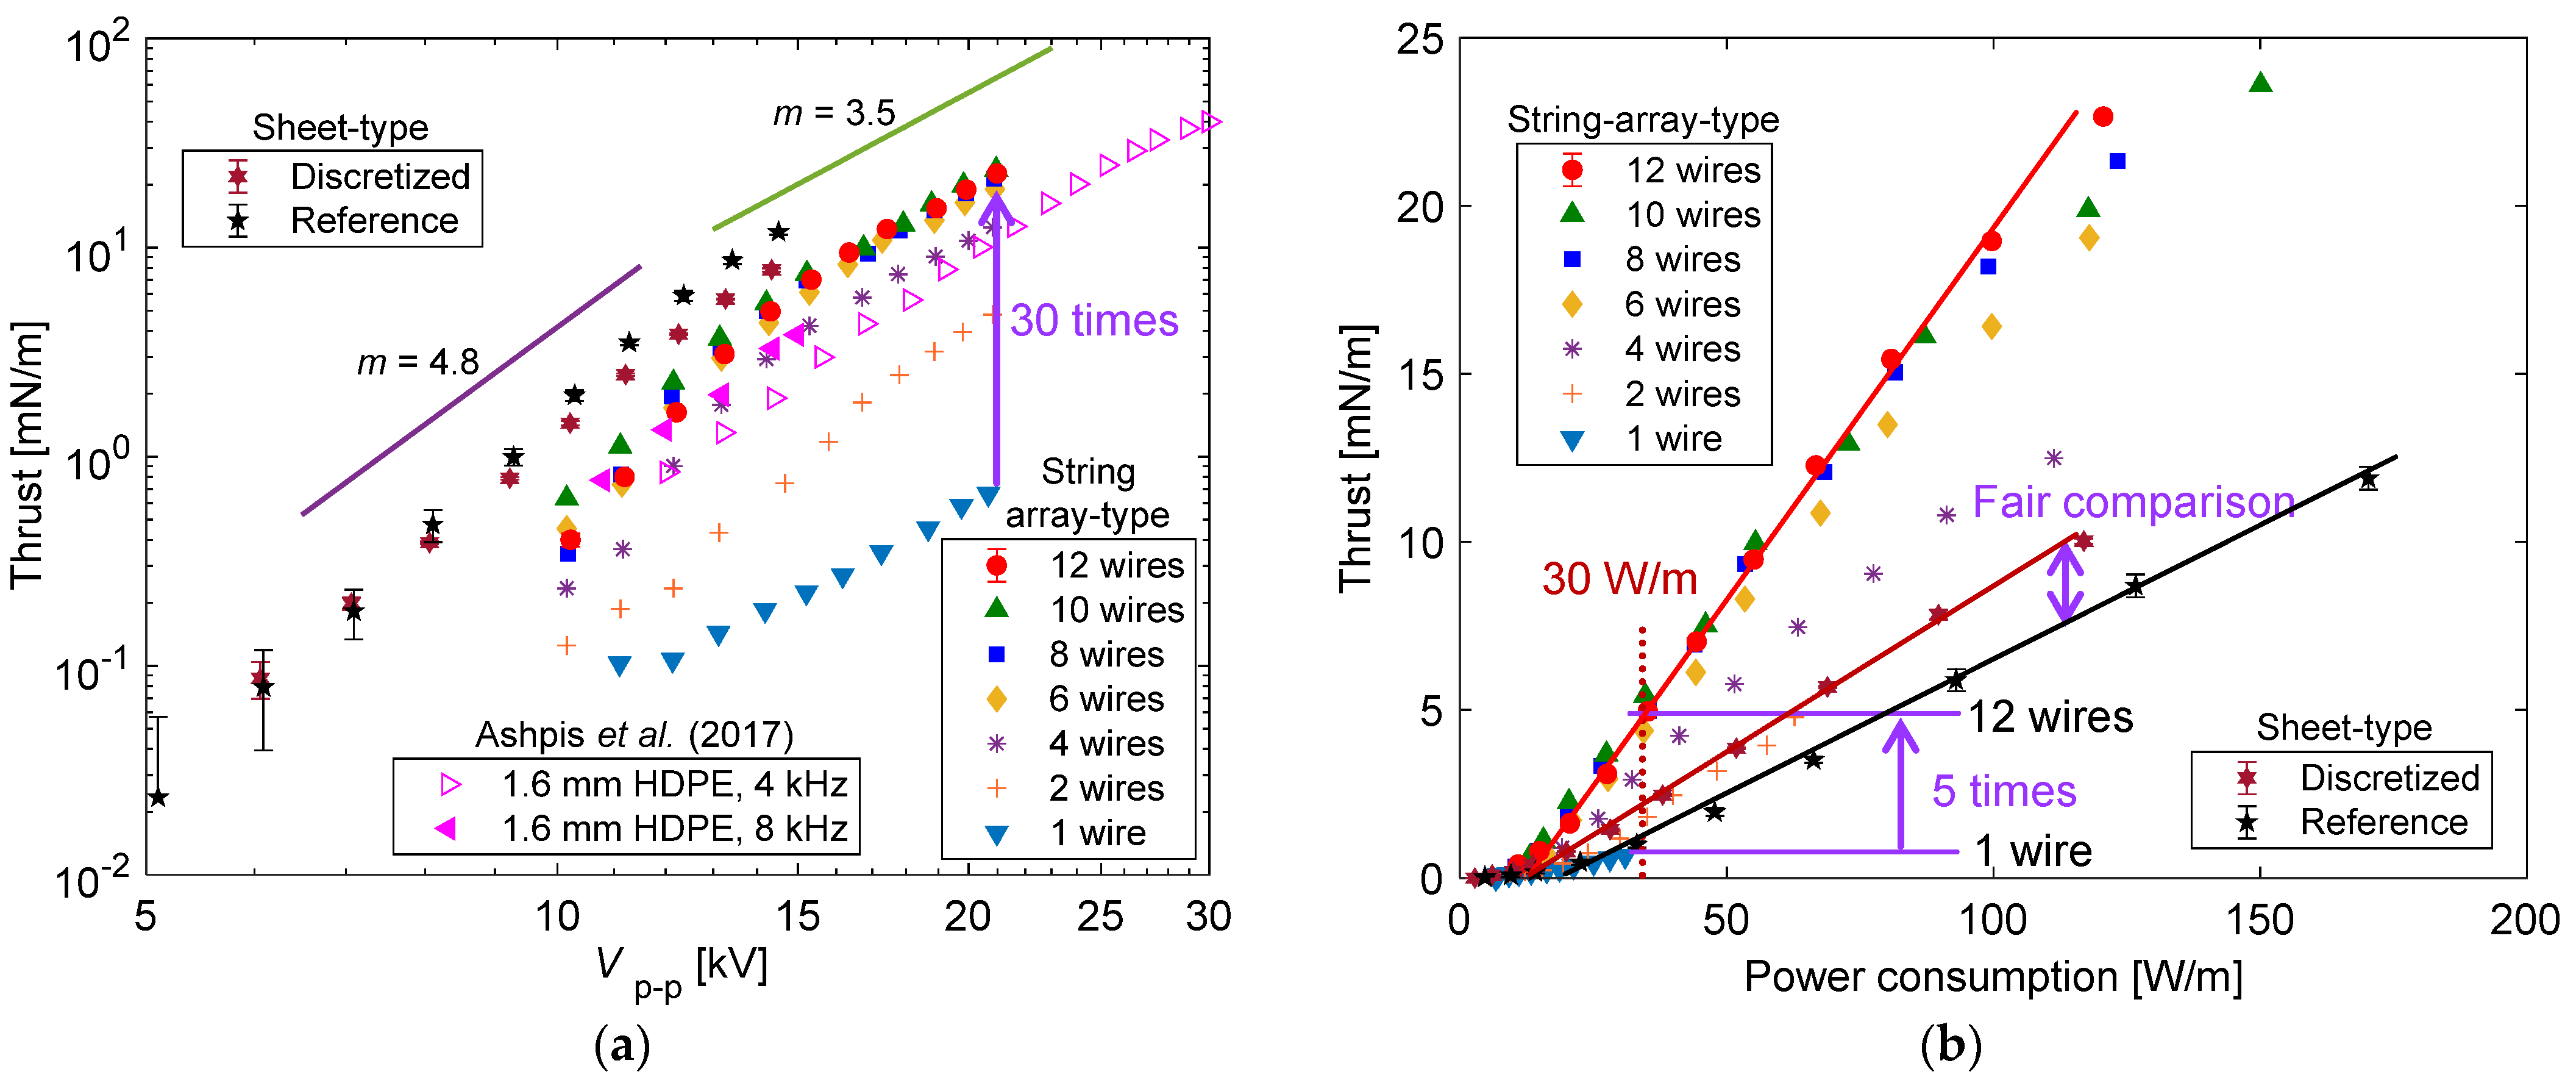
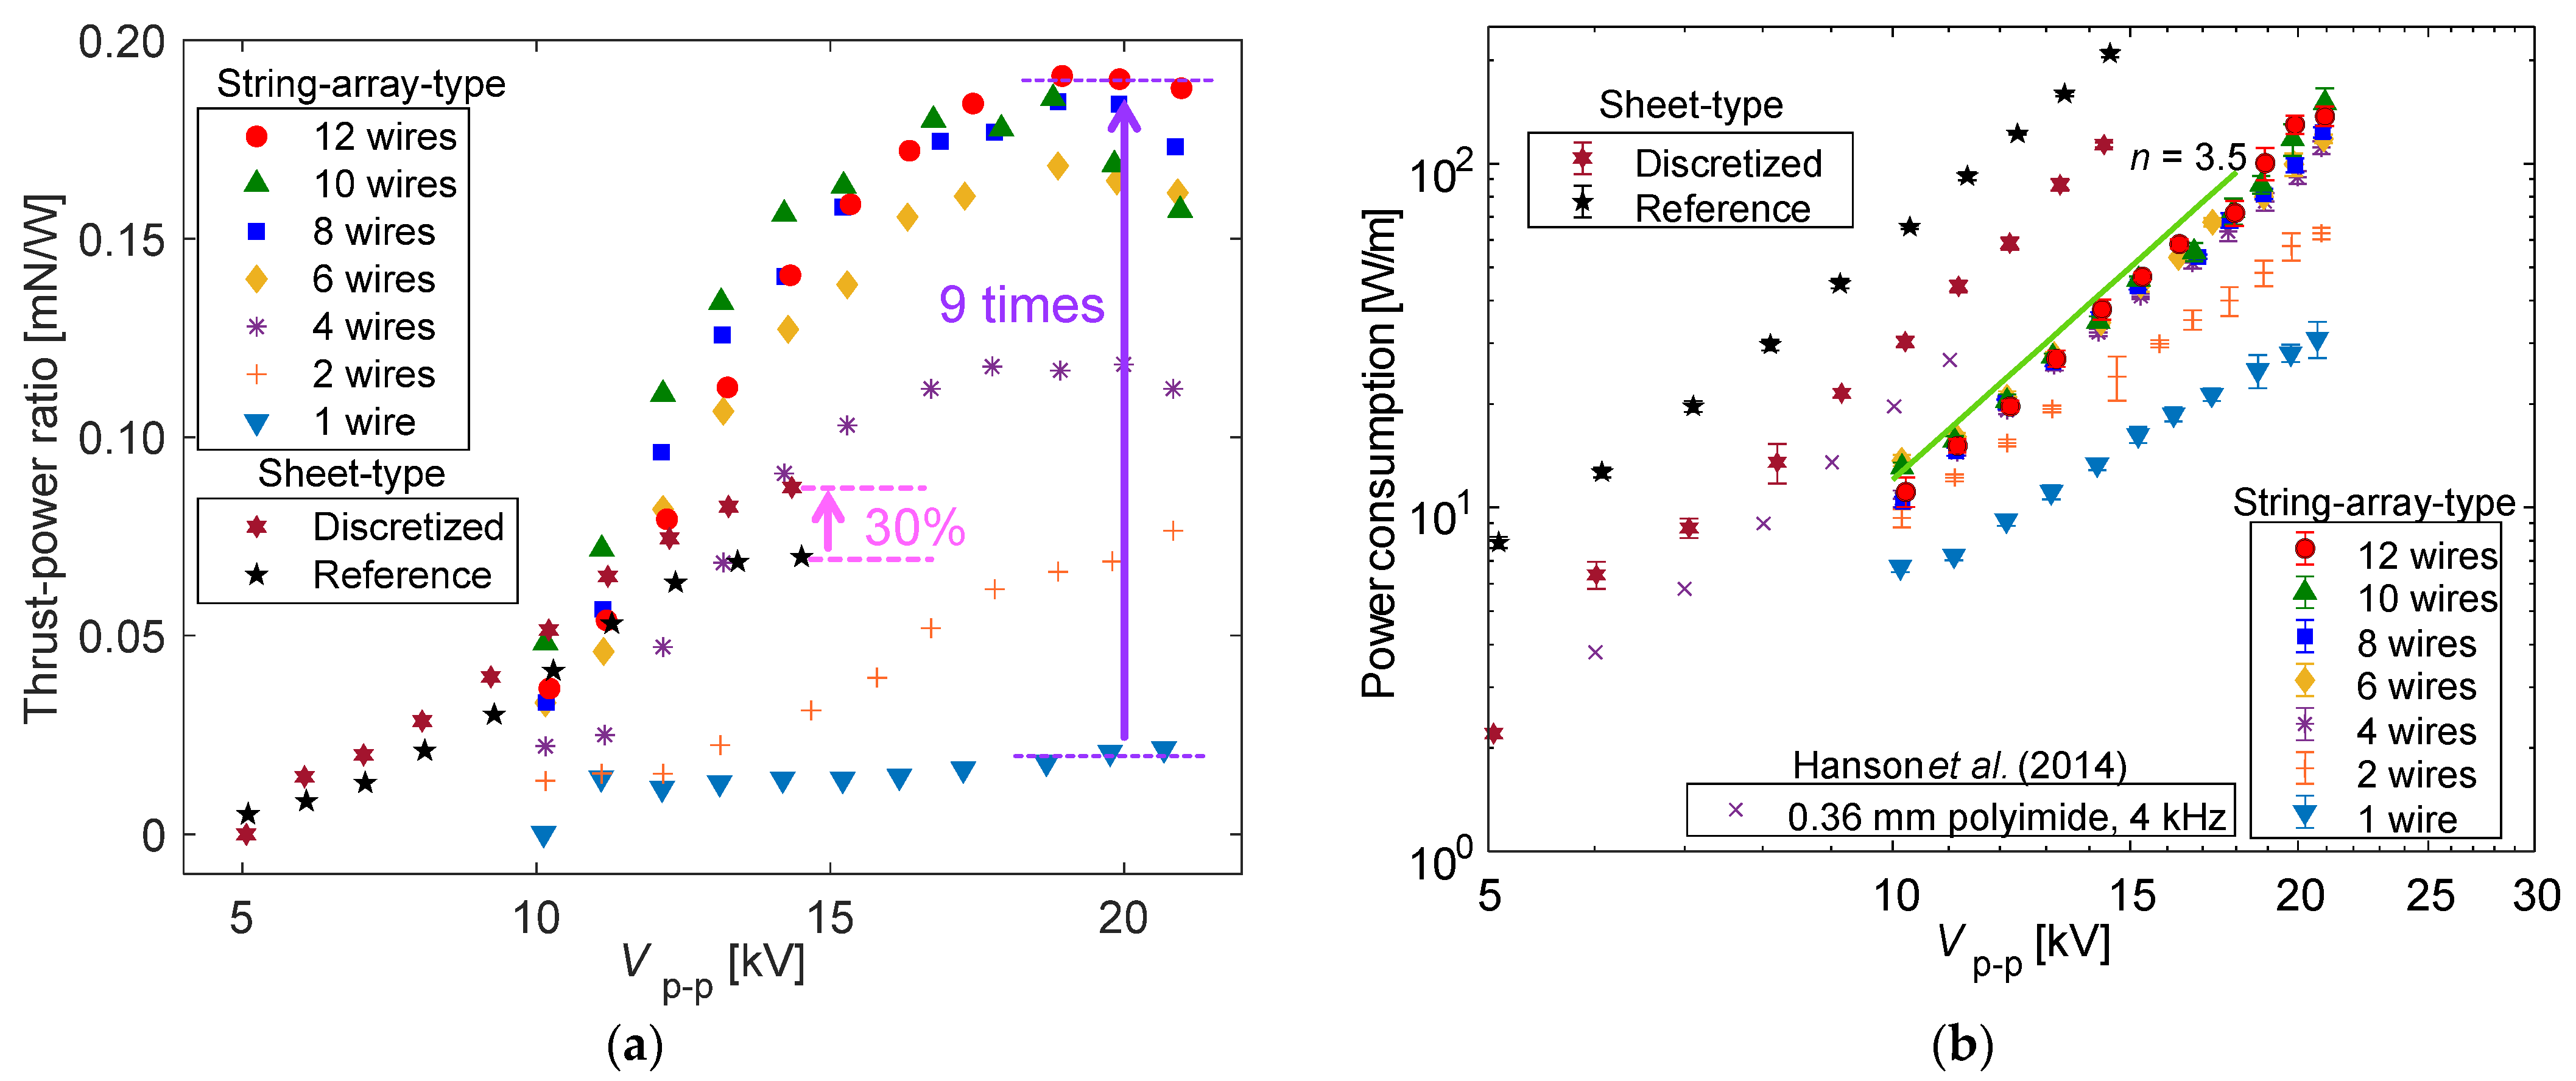
We investigated whether the thrust can be increased by increasing the width of the encapsulated electrode substantially by increasing the number of insulation-coated conductive wires. Figure 4a graphs thrust as a function of Vp-p. The thrust increases with the number of conductive wires in the string-array-type PA, and the thrust for the string-array-type PA with 12 wires is 30 times larger than that for one wire for Vp-p = 20 kV. Meanwhile, as shown in Figure 4b, the thrust of the string-array-type PA for different numbers of wires tends to increase linearly with power consumption, and the thrust of string-array-type PAs with eight or more wires increased by approximately five times at PPA = 30 W/m, compared with that of the string-type PA with a single wire. In addition, the gradients of these thrust values increase with the number of wires from 1 to 8, although they are almost the same for 8–12 wires. As shown in Figure 5a, the thrust–power ratio tends to increase from 0.02 mN/W for a PA with one wire to 0.18 mN/W for PAs with eight or more wires. Thus, in the case of Vp-p ≥ 18 kV, the thrust–power ratio increased nine-fold for eight or more wires, as compared to that for a PA with one wire. This is caused by a substantial increase in the encapsulated electrode width by increasing the number of insulation-coated conductive wires and by the discretization effect of the encapsulated electrode structure.
The slope (m) of the fitting curve is proportional to Vp-pm. The slopes for string-array-type PAs and reference and discretized sheet-type PAs in this study are compared in Figure 4a, as in a previous study. Ashpis et al. [21] showed that m = 4.8 for Vp-p < 20 kV and m = 3.5 for Vp-p ≥ 20 kV by using a sheet-type PA with an insulating layer composed of high-density polyethylene (HDPE, thickness: 1.6 mm) under fp = 4 and 8 kHz, which are close to fp = 6.4 kHz used in this study.
Next, the performances of the reference and discretized sheet-type PAs with the same configurations (except for a discretized back electrode) were compared. The increase in thrust due to discretizing the encapsulated electrode under the same power consumption was confirmed, as shown in Figure 4b. The thrust–power ratios (Figure 5a) of both the sheet-type PAs increased with Vp-p, but the discretized PA exhibited better performance than the reference PA at all Vp-p. For Vp-p > 10 kV, the discretized PA had a larger value (up to ~30%) compared with that of the reference sheet-type PA. As for the exponent m of thrust ~Vp-pm in Figure 4a, m = 4.8 was found for Vp-p ≥ 11 kV using the reference and discretized sheet-type PAs, as shown by Ashpis et al. [21].
In Figure 5b, the exponent n, when PPA is proportional to Vp-pn, is estimated by data fitting. For the reference sheet-type PA, n = 3.4 obtained in this study is consistent with n = 3.5 obtained by Hanson et al. (PA with a 0.36 mm thick polyimide insulating layer) [22]; however, n = 3.8 for the discretized sheet-type PA. In contrast, when using string-array-type PAs, n increased from 2.2 to 3.1 as the number of wires increased from one to six, and saturated to n = 3.5 for eight or more wires.
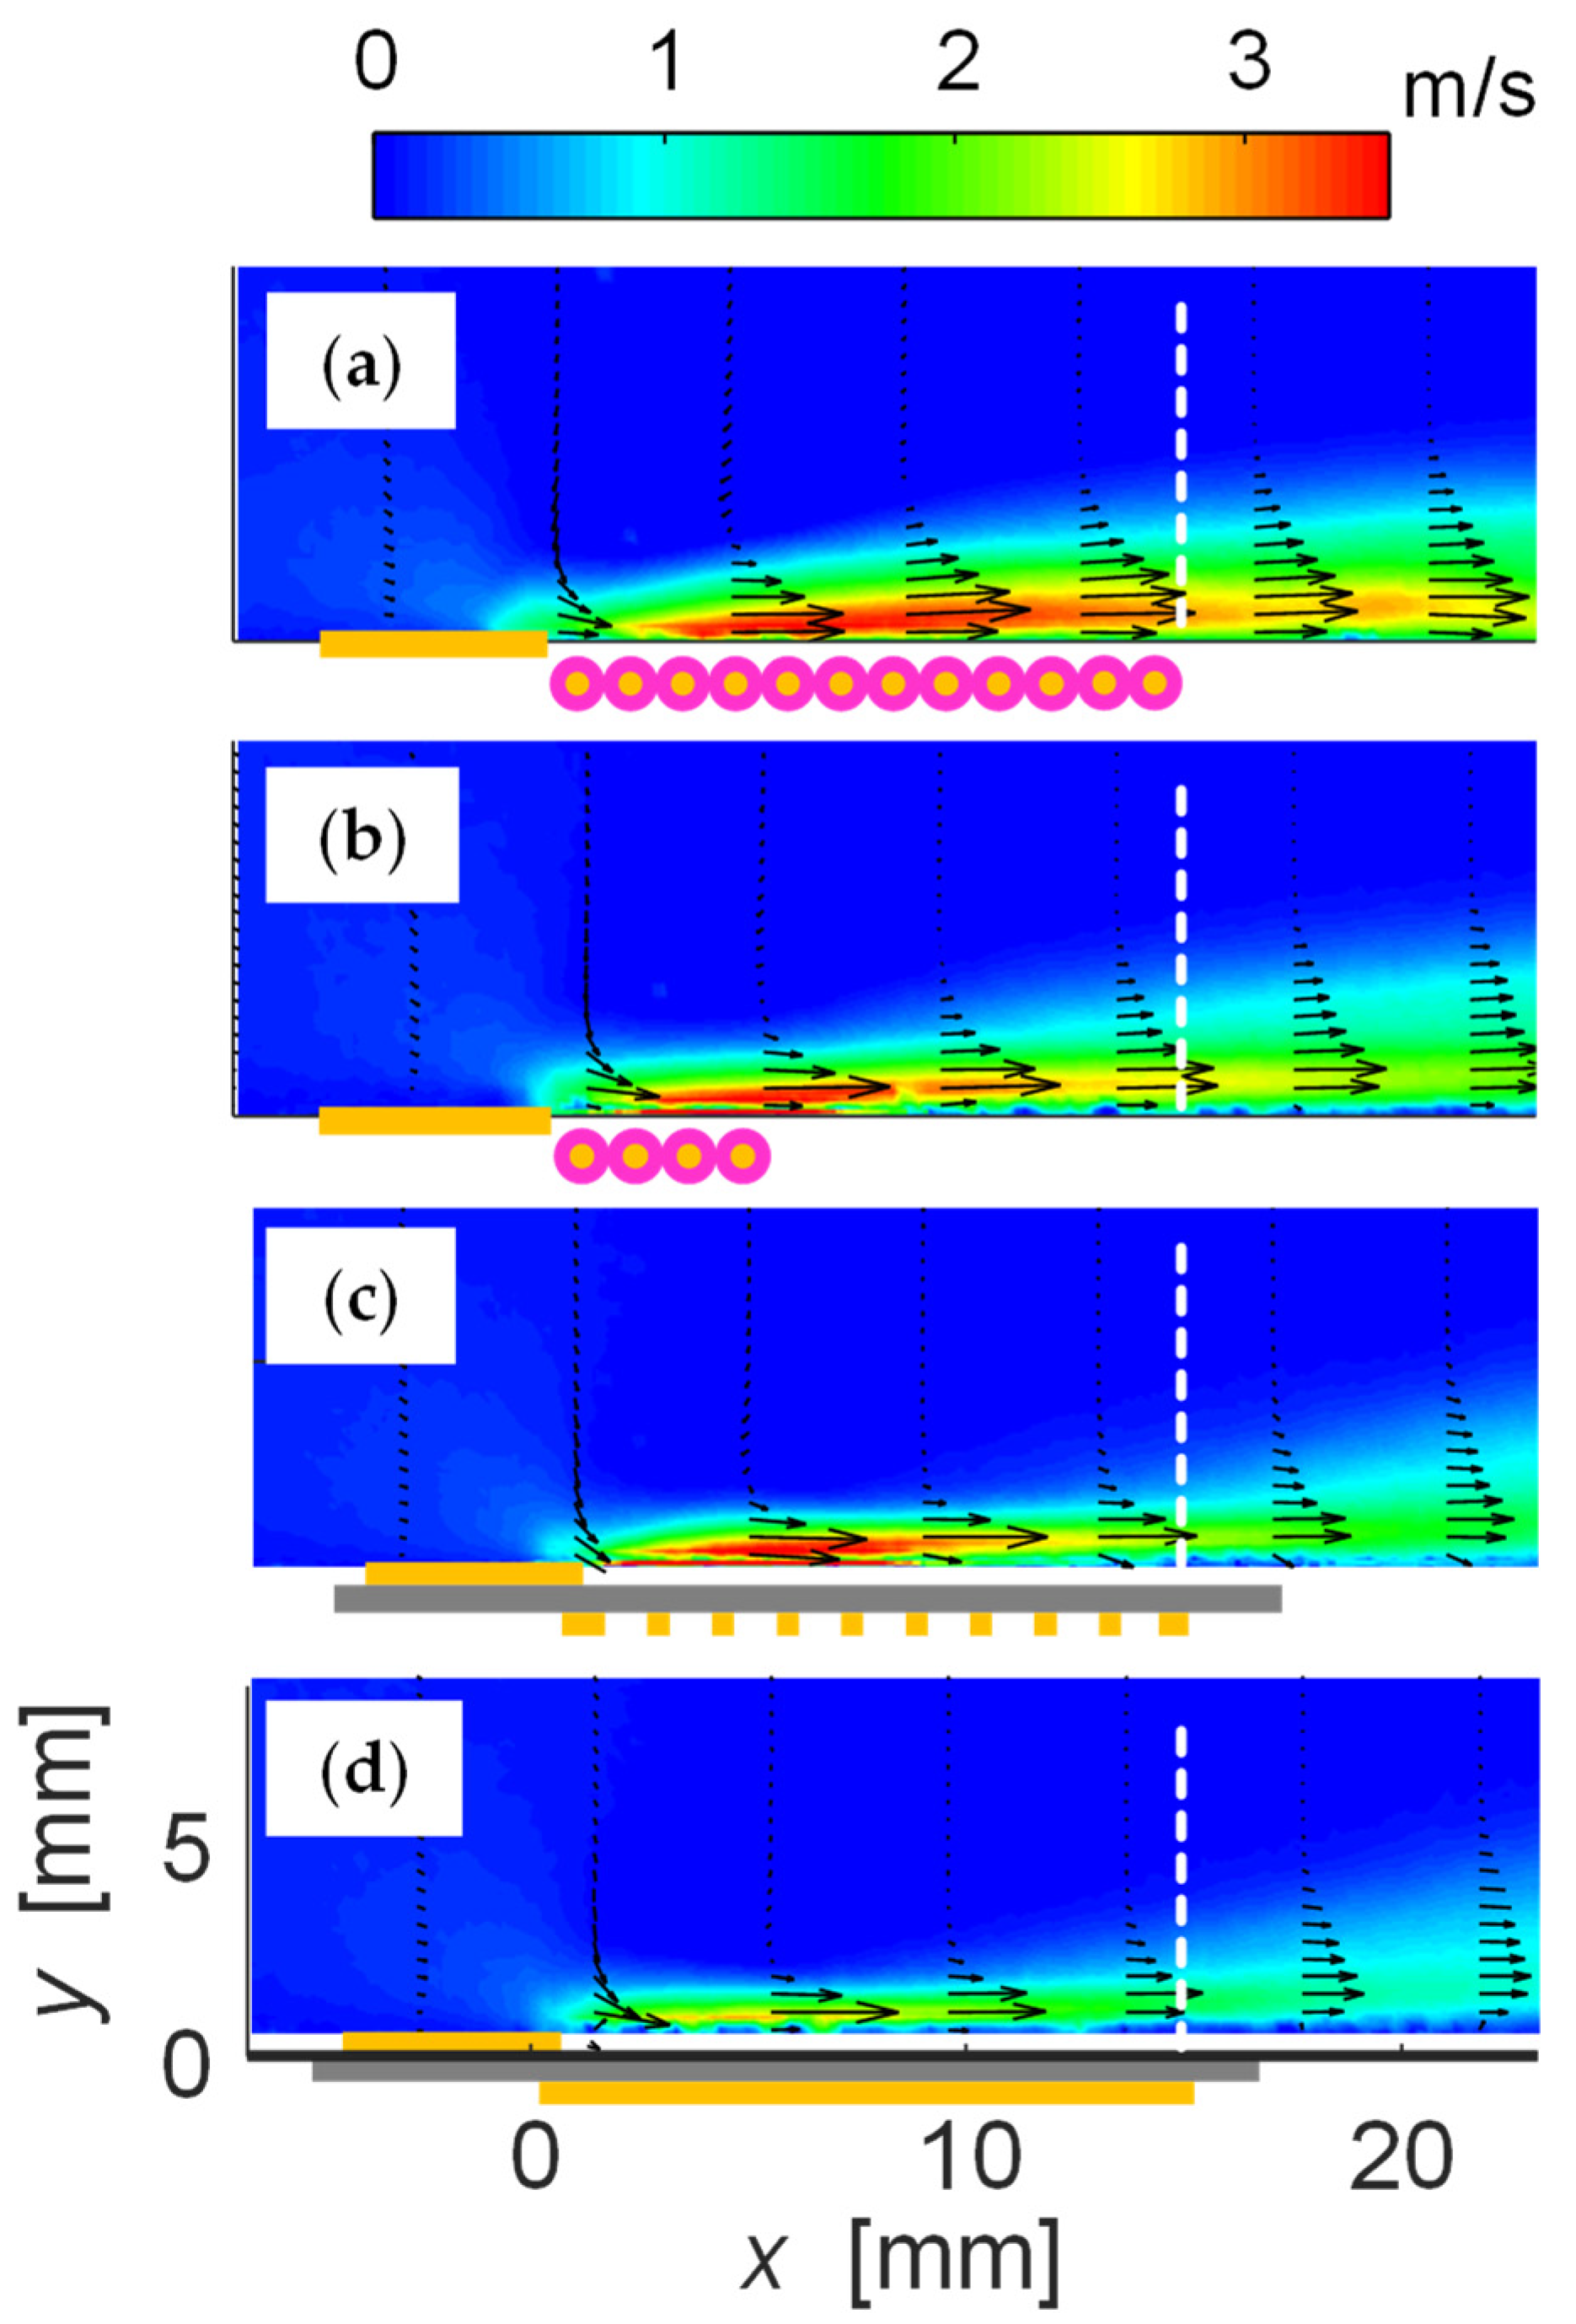
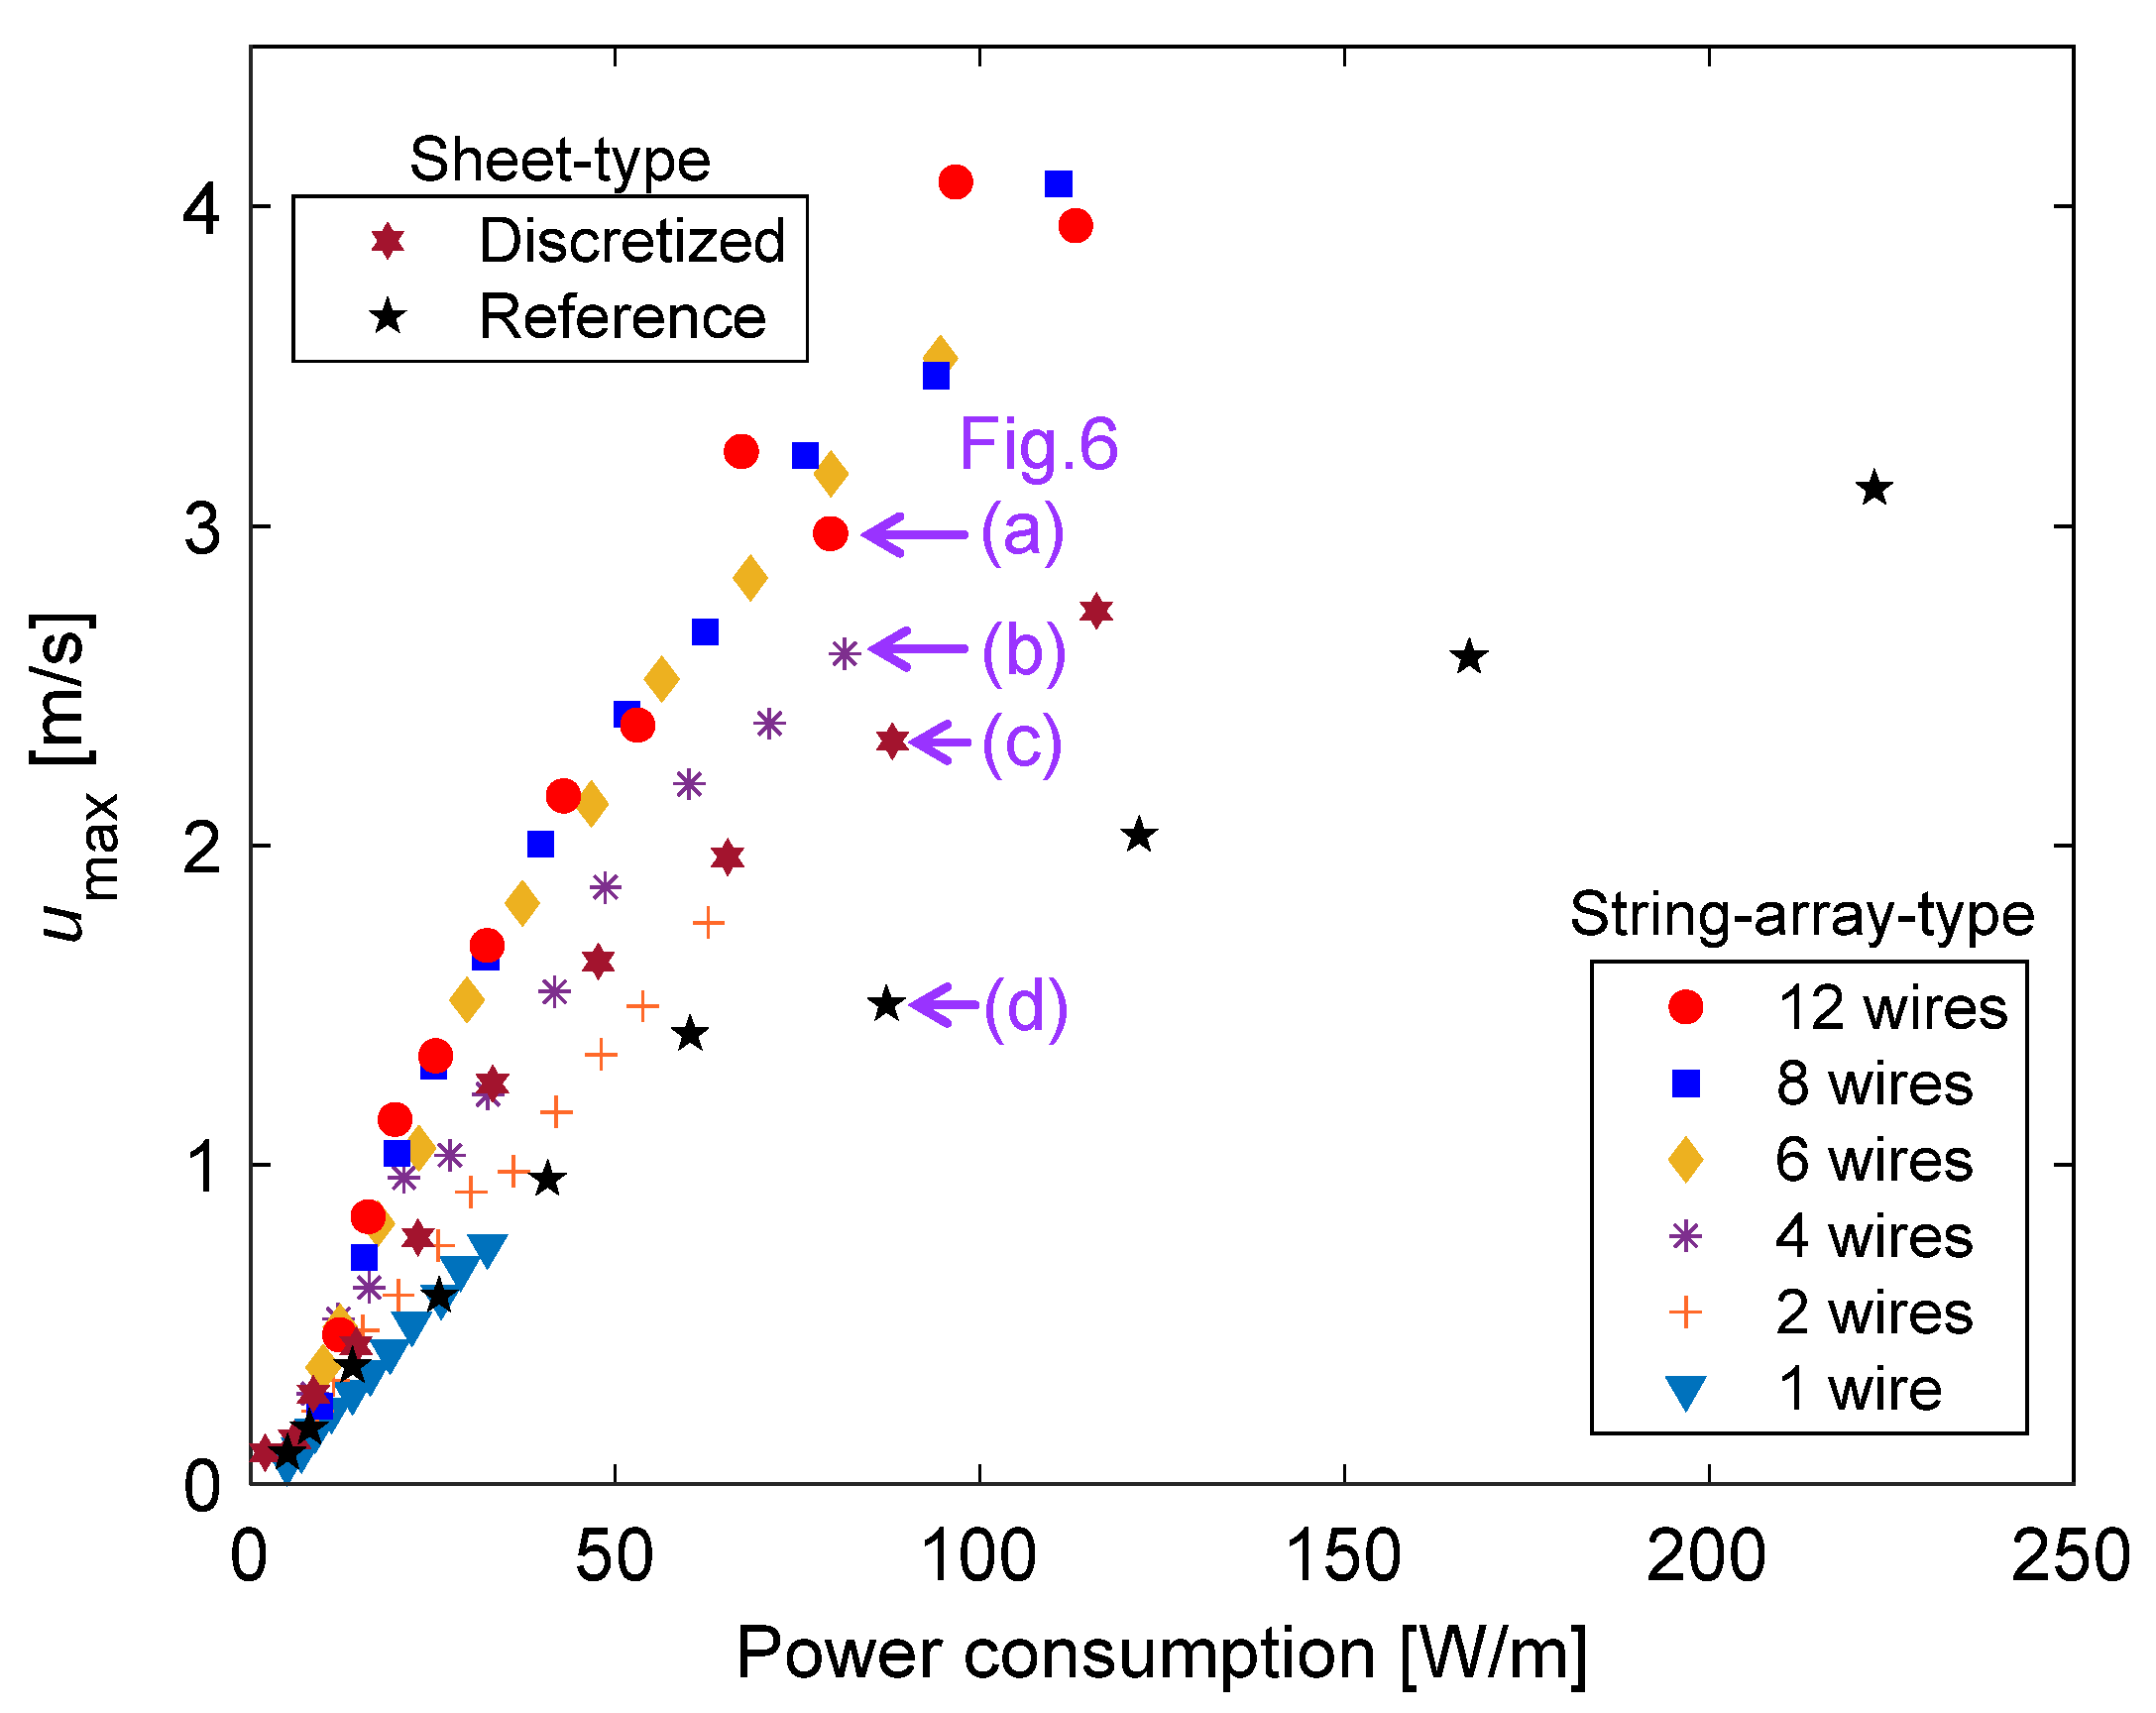
Figure 6 shows the averaged velocity distributions in the xy cross-section determined by PIV analysis for the power consumption in the range of 80 < PPA < 90 W/m. Although the power consumption of the string-array-type PA with 12 wires (Figure 6a, PPA = 79.5 ± 5.1 W/m at Vp-p = 18 kV) is slightly lower than that of the string-array-type PA with four wires (Figure 6b, 81.5 ± 4.3 W/m at 20 kV), the u component of the maximum flow velocity (umax) accelerated at x = 15 mm downstream from the exposed electrode edge from 2.6 m/s (four wires) to 3.0 m/s (12 wires), and the expansion of the high-speed region was confirmed. On the other hand, the induced flow caused by the discretized PA accelerated significantly to umax = 2.3 m/s (Figure 6c, 88.0 ± 2.4 W/m at 13 kV) in comparison with umax = 1.5 m/s (Figure 6d, 87.2 ± 2.0 W/m at 11 kV), caused by the reference PA at x = 15 mm. As shown in Figure 7, the trend of umax at x = 15 mm downstream of the exposed electrode edge as a function of power consumption was analyzed and confirmed to be consistent with the relationship between the thrust and power consumption characteristics shown in Figure 4b.

3.2. Changes in Plasma Extension Length with Respect to Power Consumption and Thrust

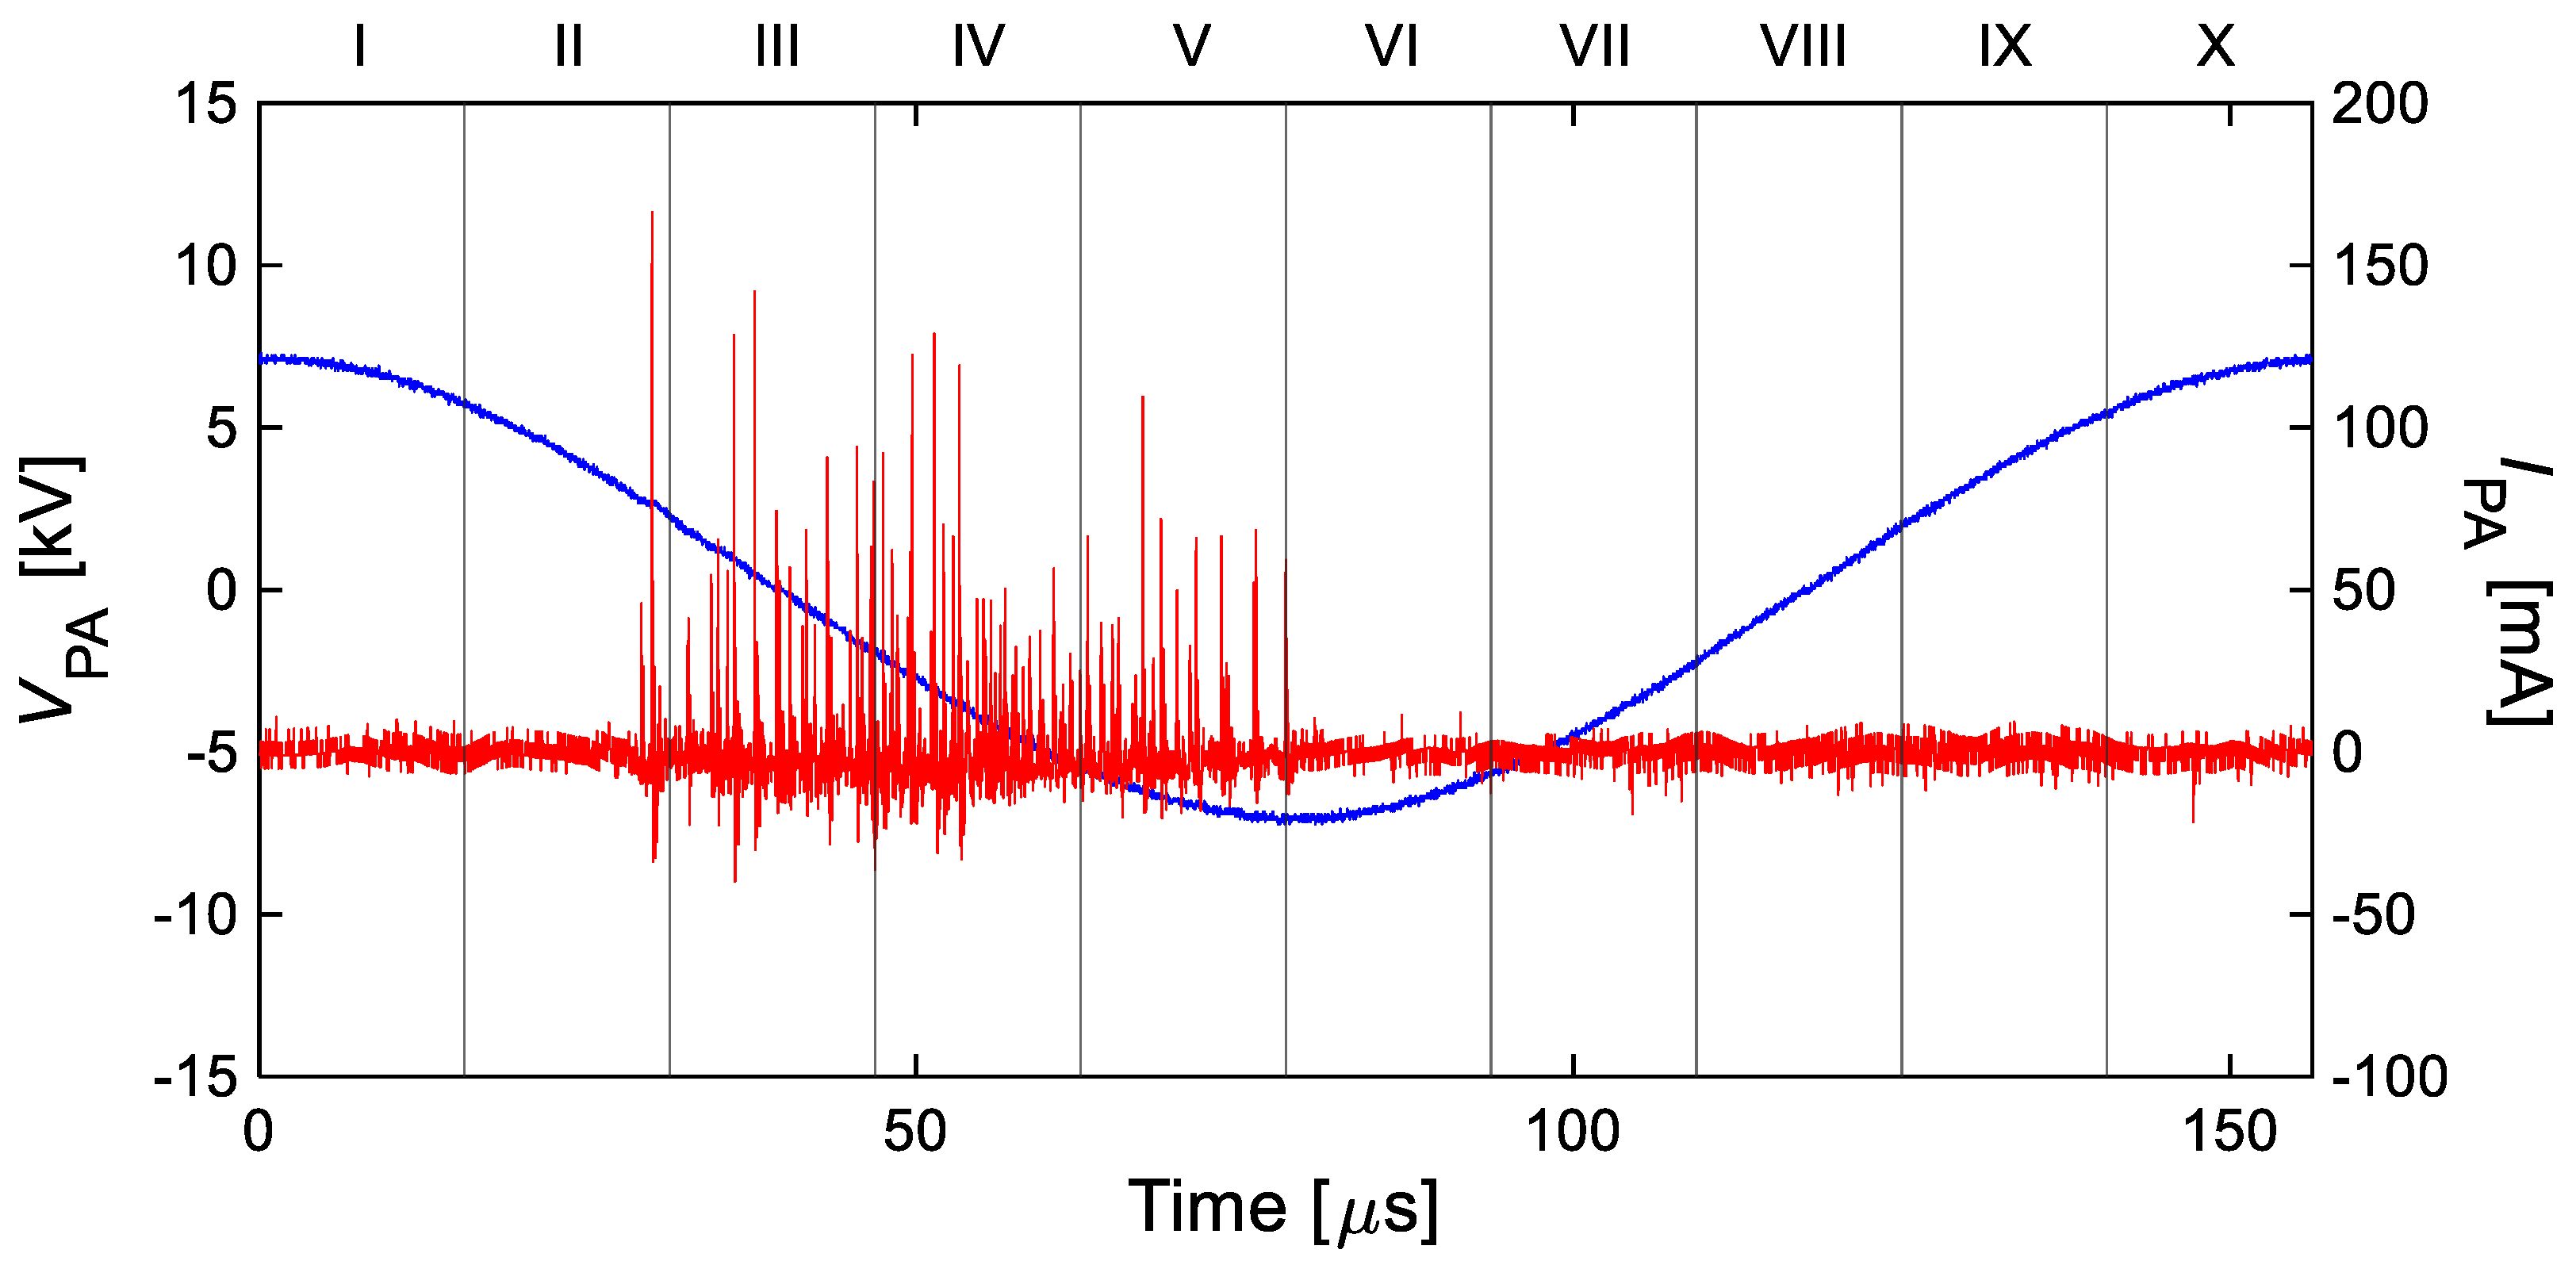
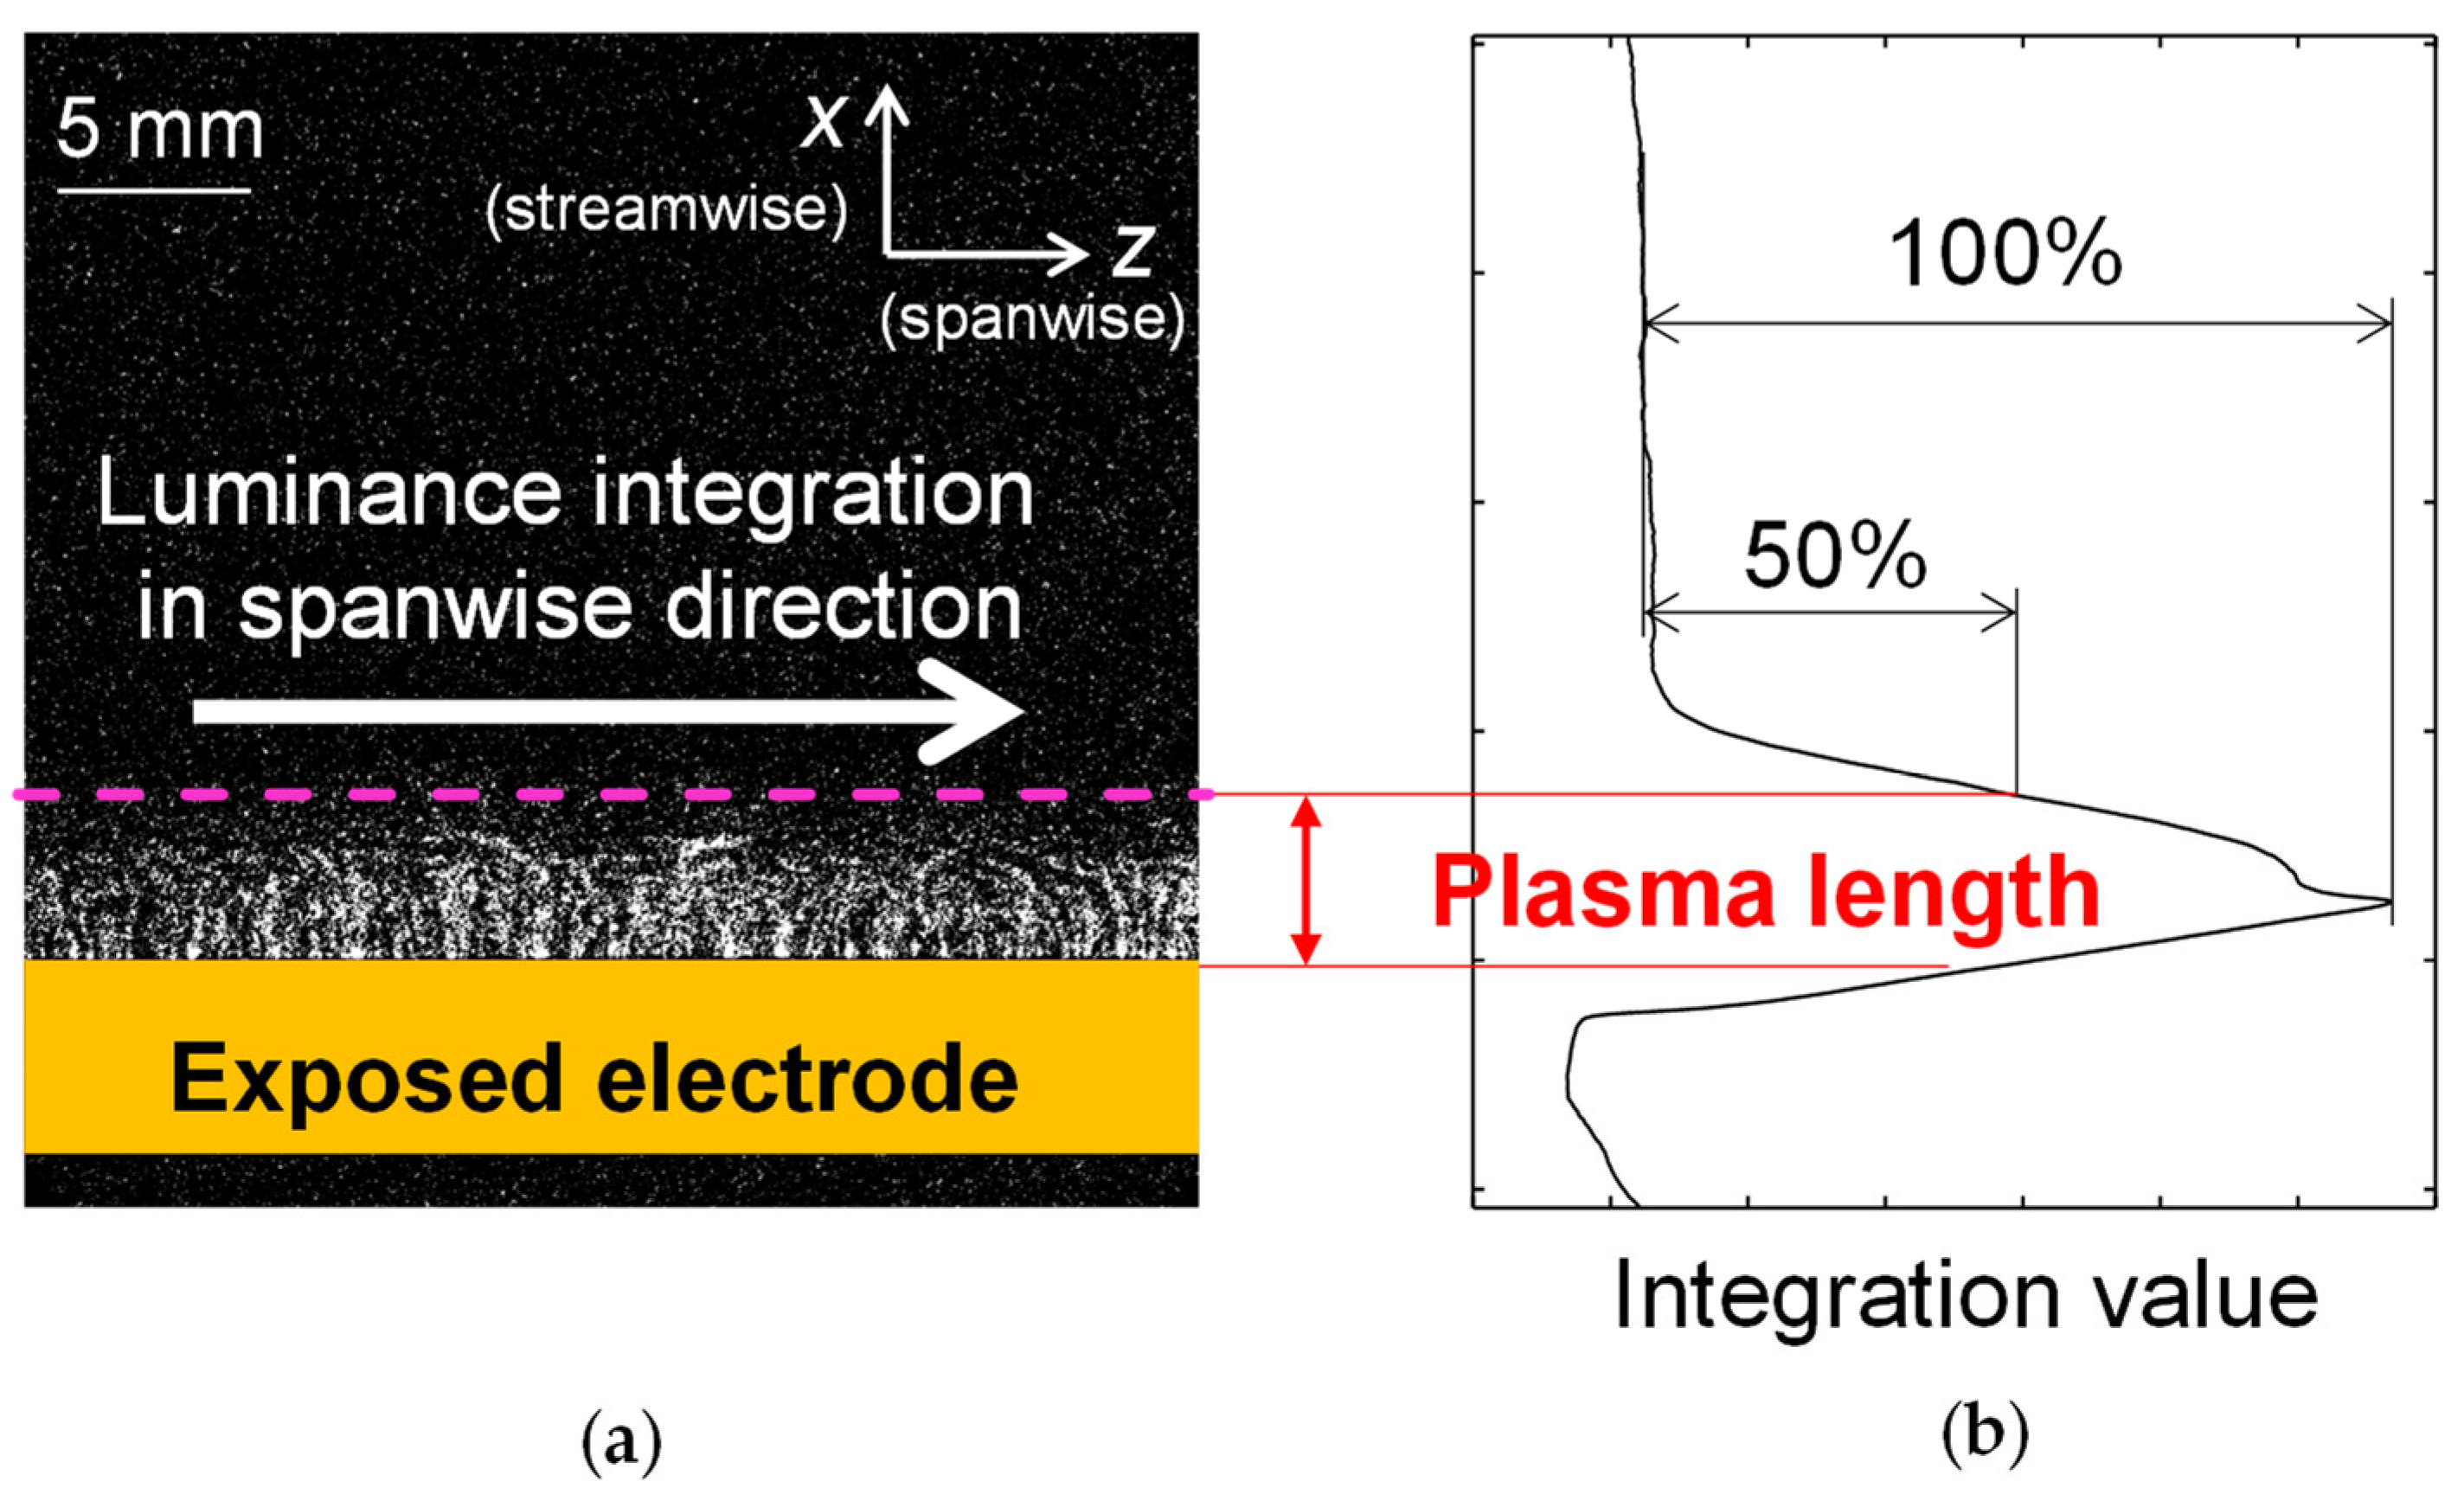
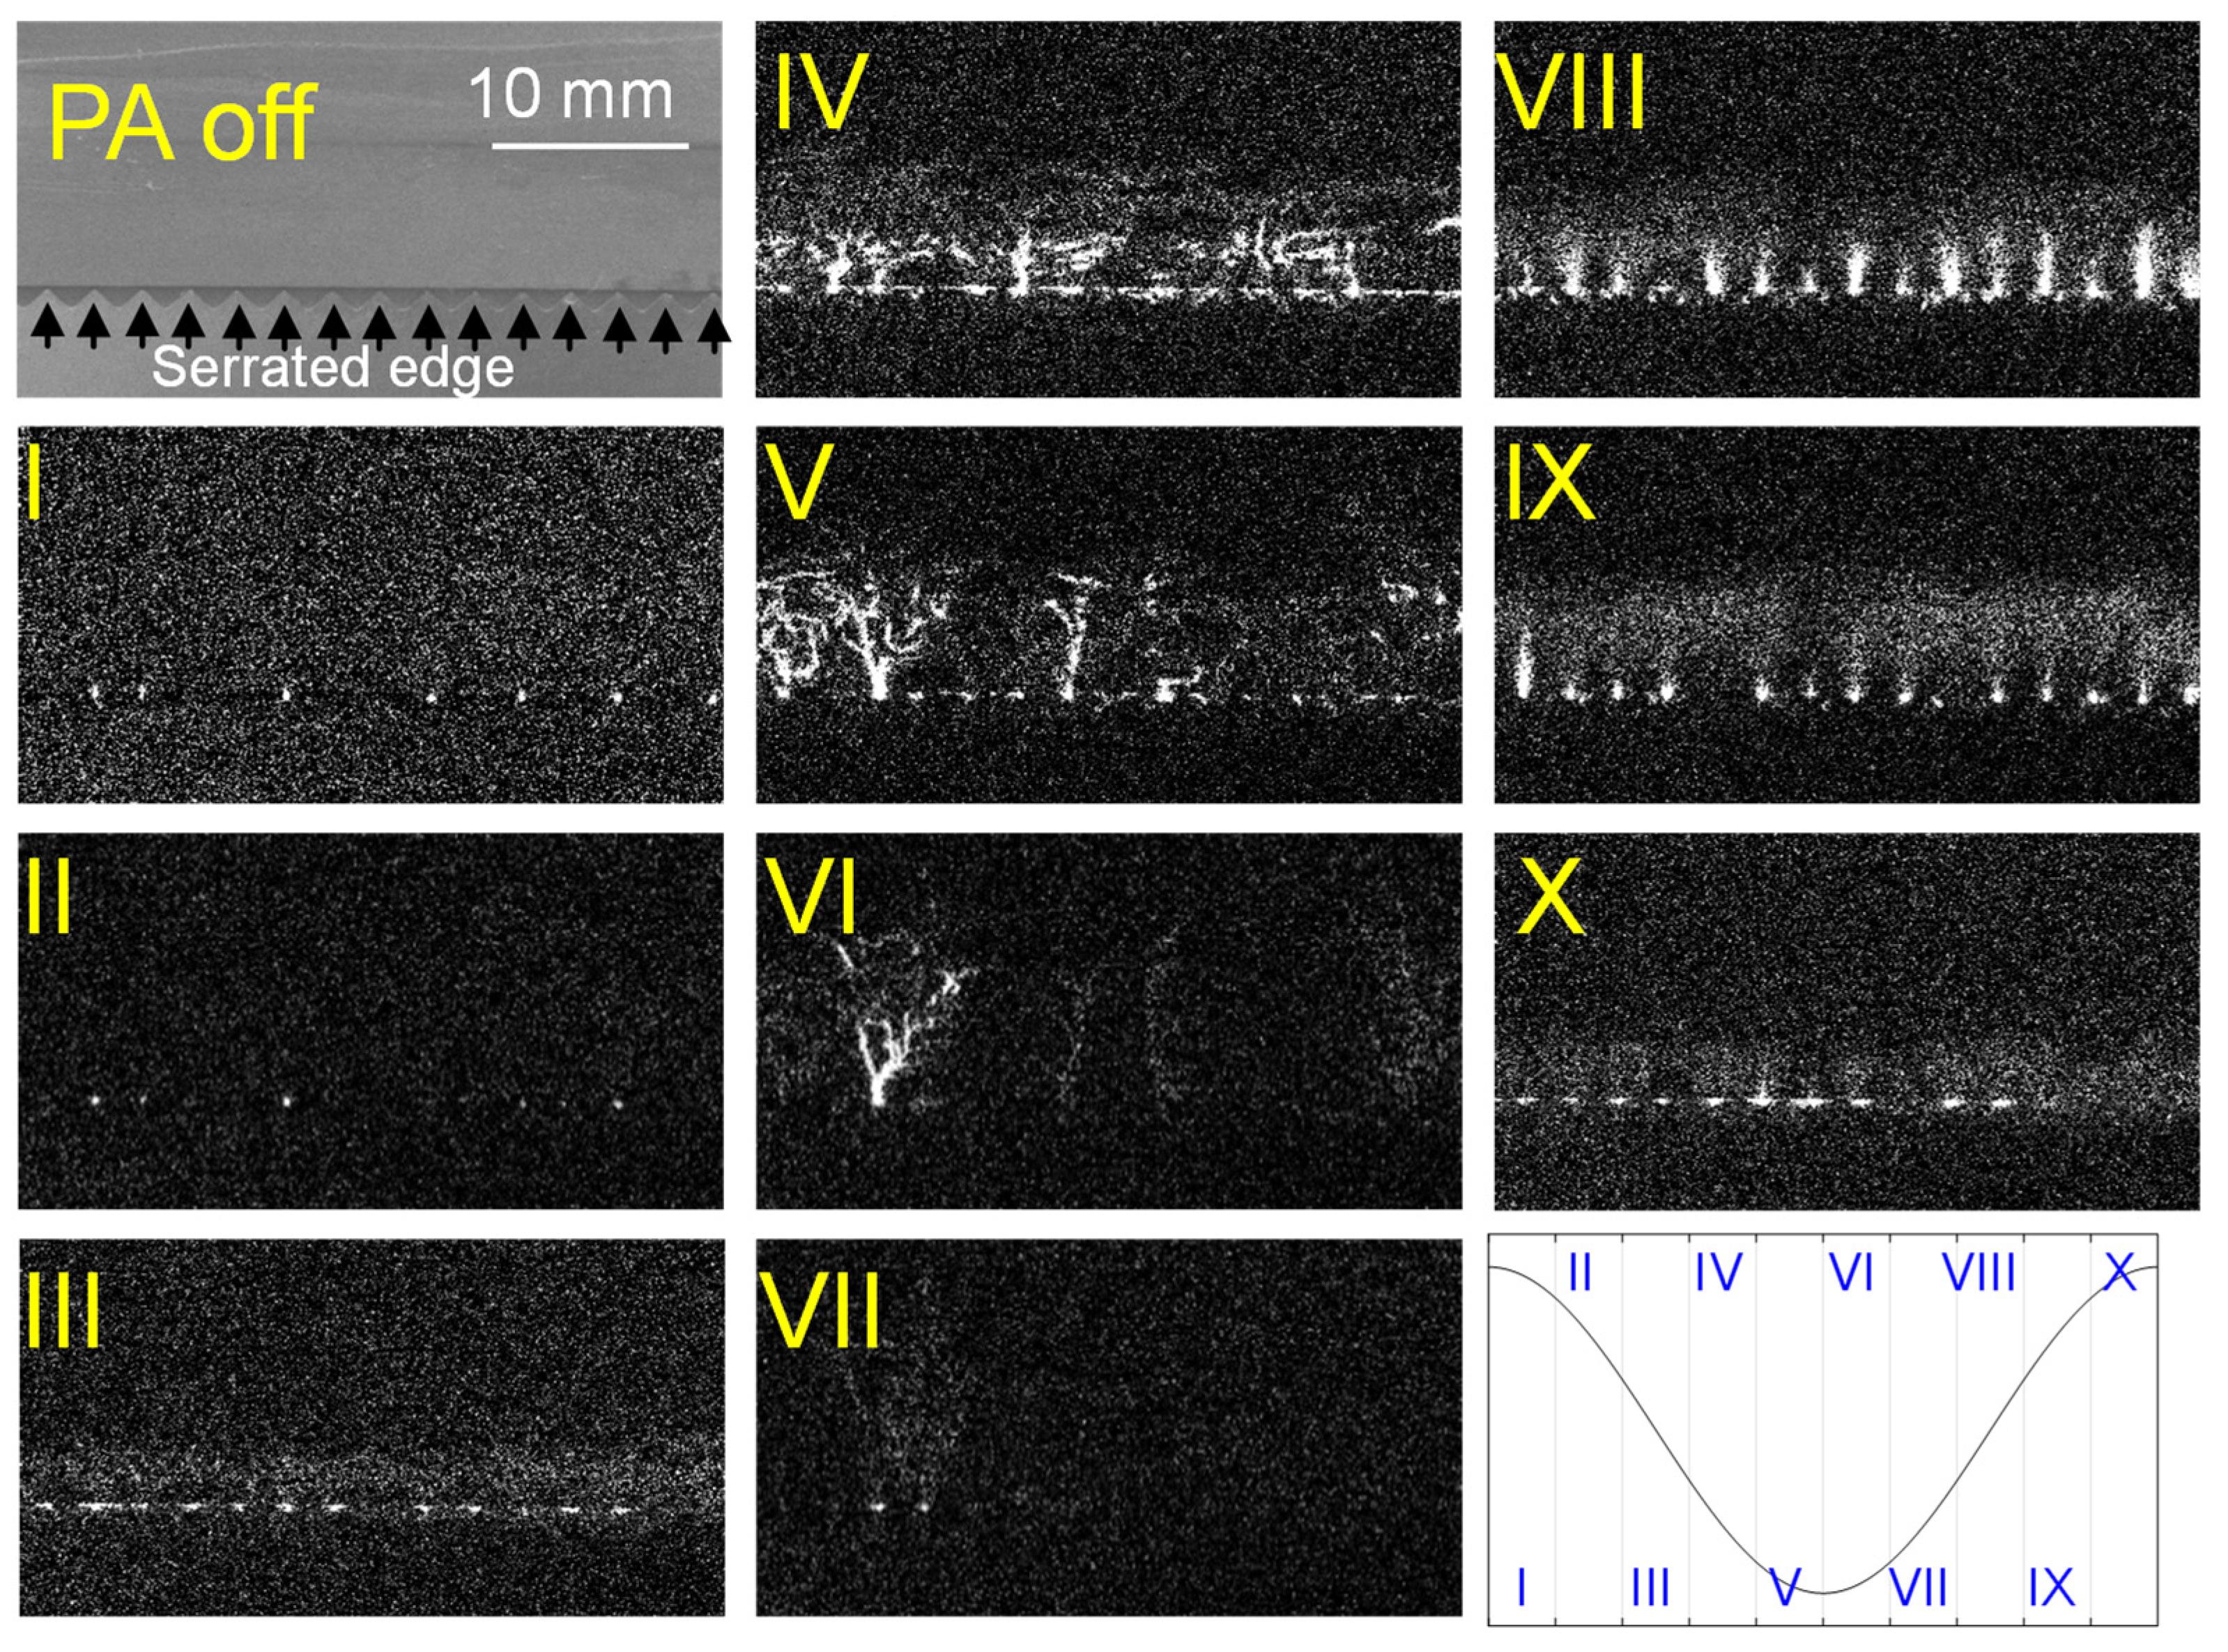
The plasma extension length (plasma length) has been analyzed in many studies to elucidate the acceleration mechanism of the flow induced by PAs [23,24]. To visualize the DBD plasma formed near the edge of the exposed electrode, one cycle of the applied sinusoidal voltage was divided into 10 sections from (I) to (X), as shown in Figure 8, following the method of Benard et al. [24], and discharge images were acquired using an ICCD camera (Andore: iStar DH734i-18F-03, 1024 × 1024 pixels) during each period with an exposure time of 15.625 μs (Figure 9a). The brightness (luminance value) at each x value was integrated along the spanwise direction and averaged for the images acquired five times under the same PA driving conditions. A carving line smoothed by the moving average of integrated values in the x direction is plotted in Figure 9b. The x value corresponding to half of the maximum and minimum values of the brightness integration is indicated by the pink dashed line in the discharge image. In this study, the distance from the exposed electrode edge to this position is the plasma length.
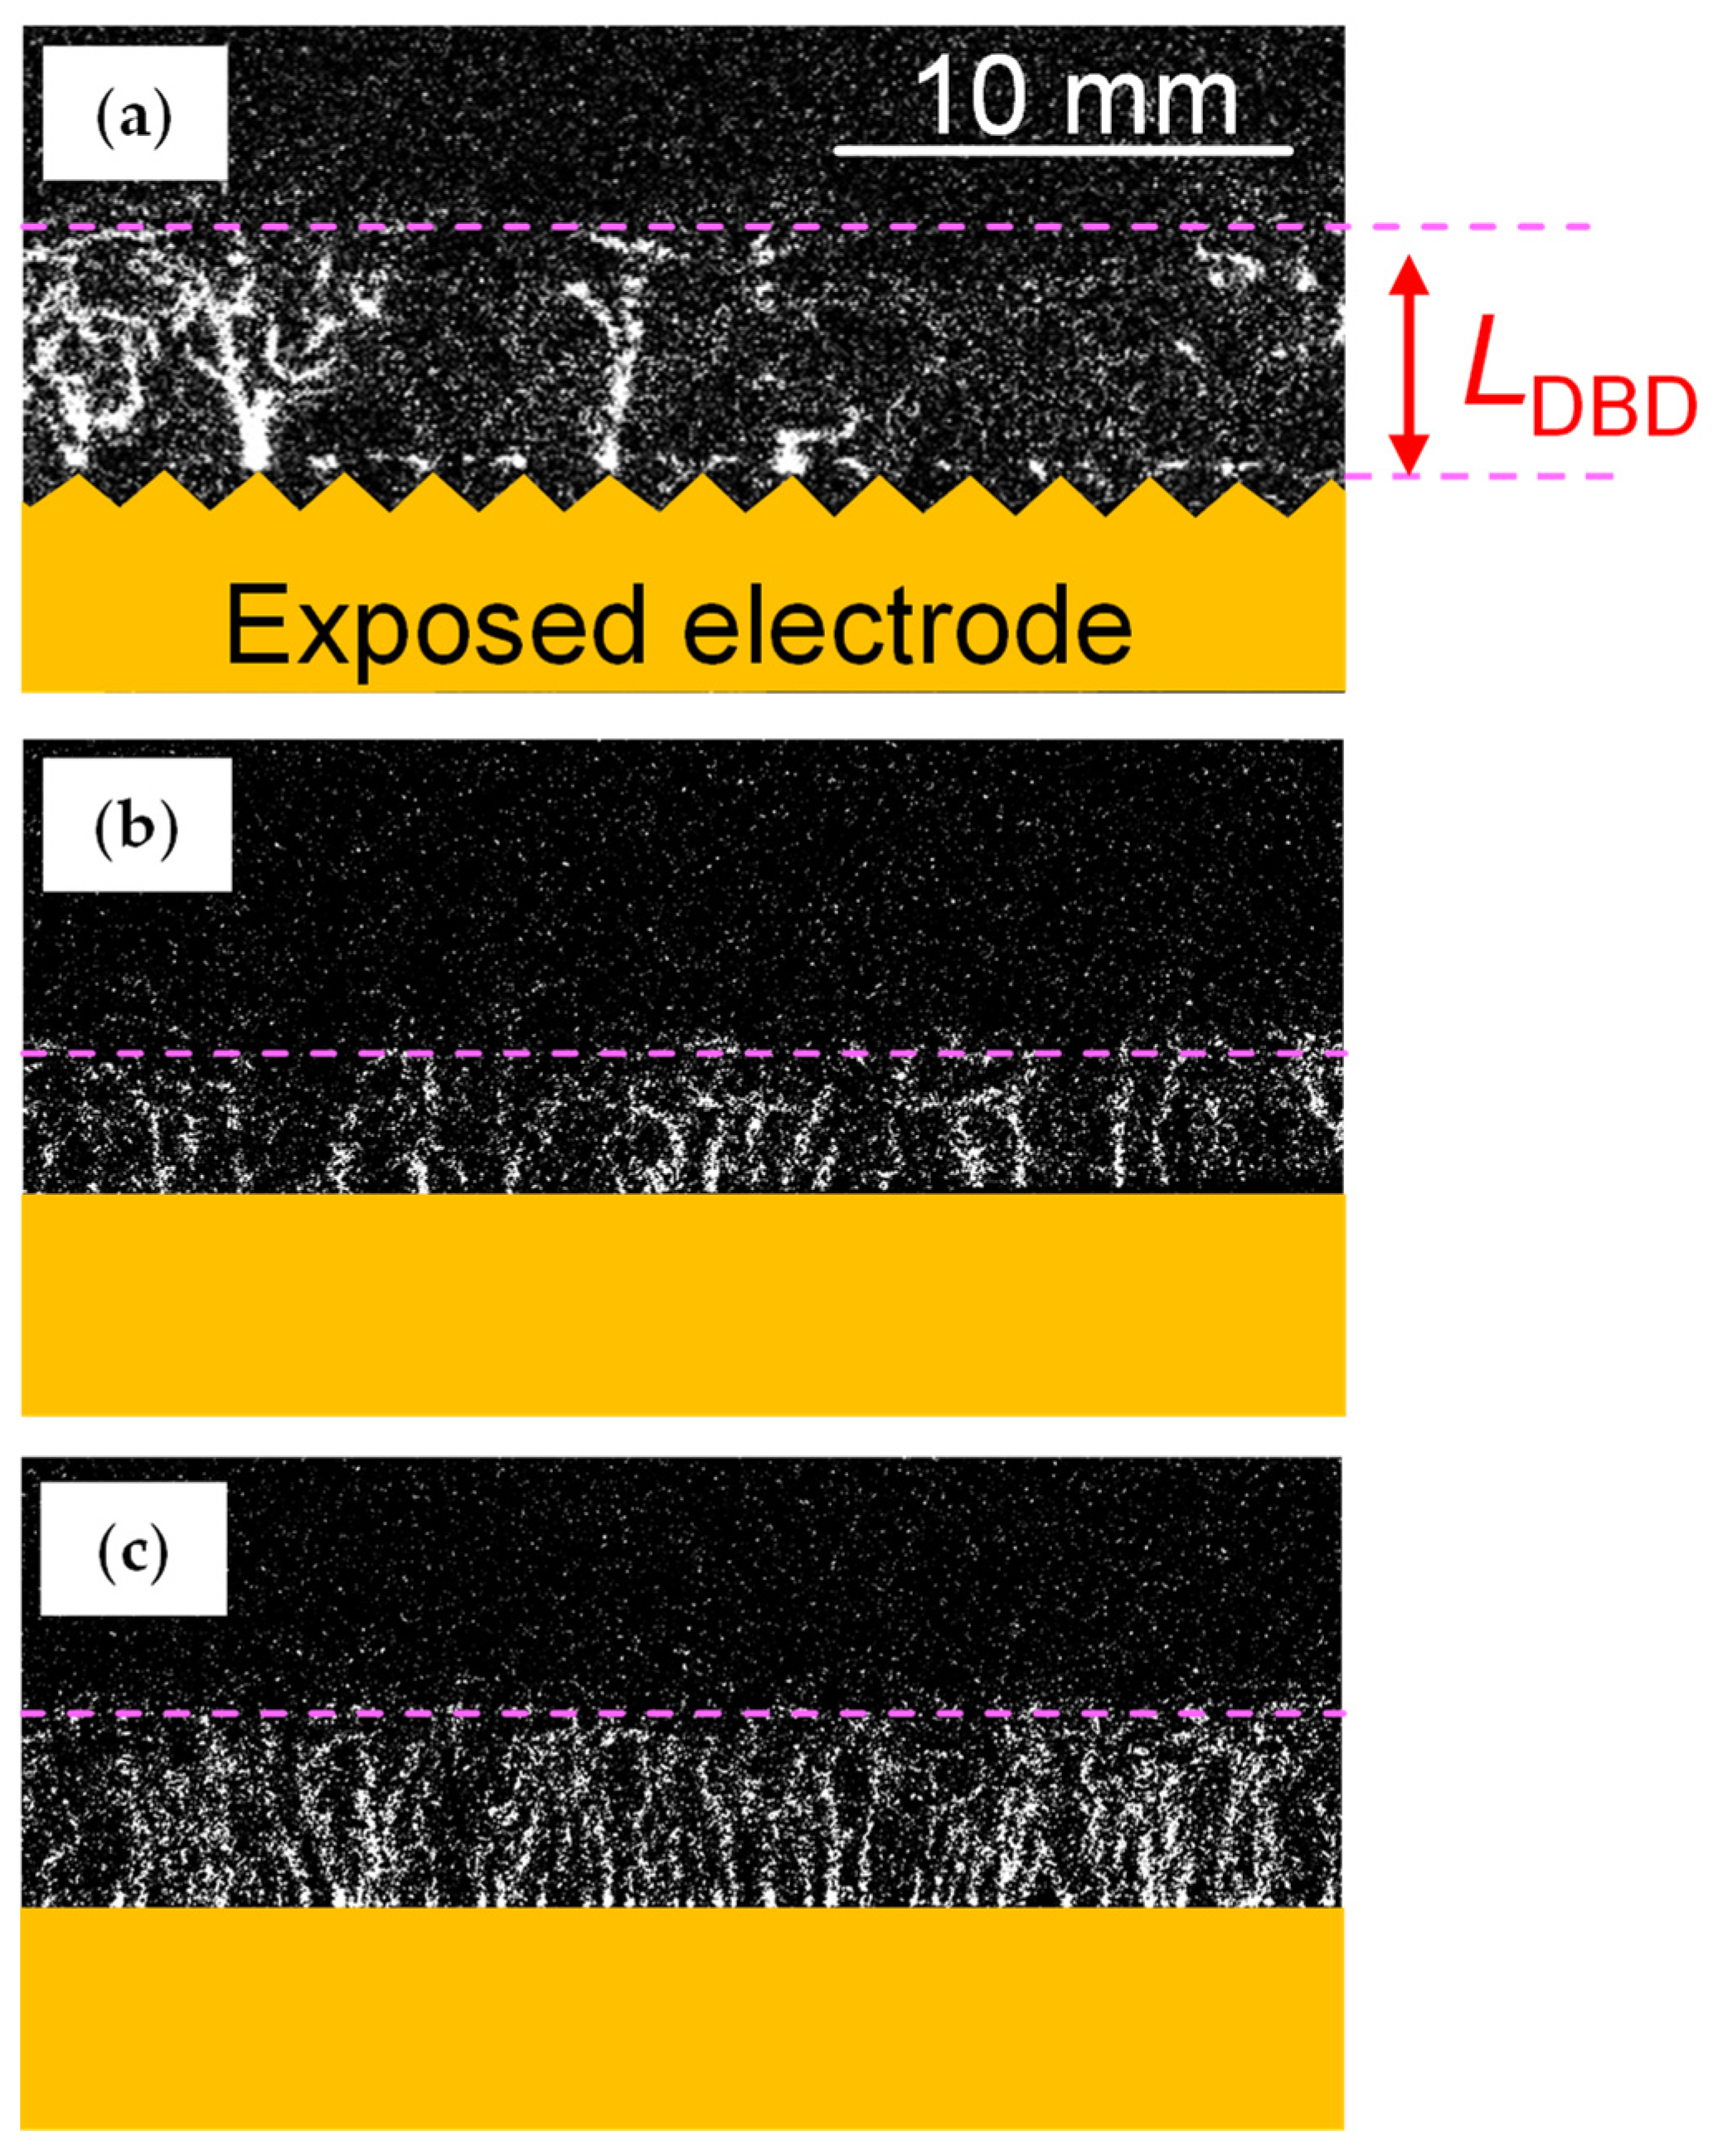
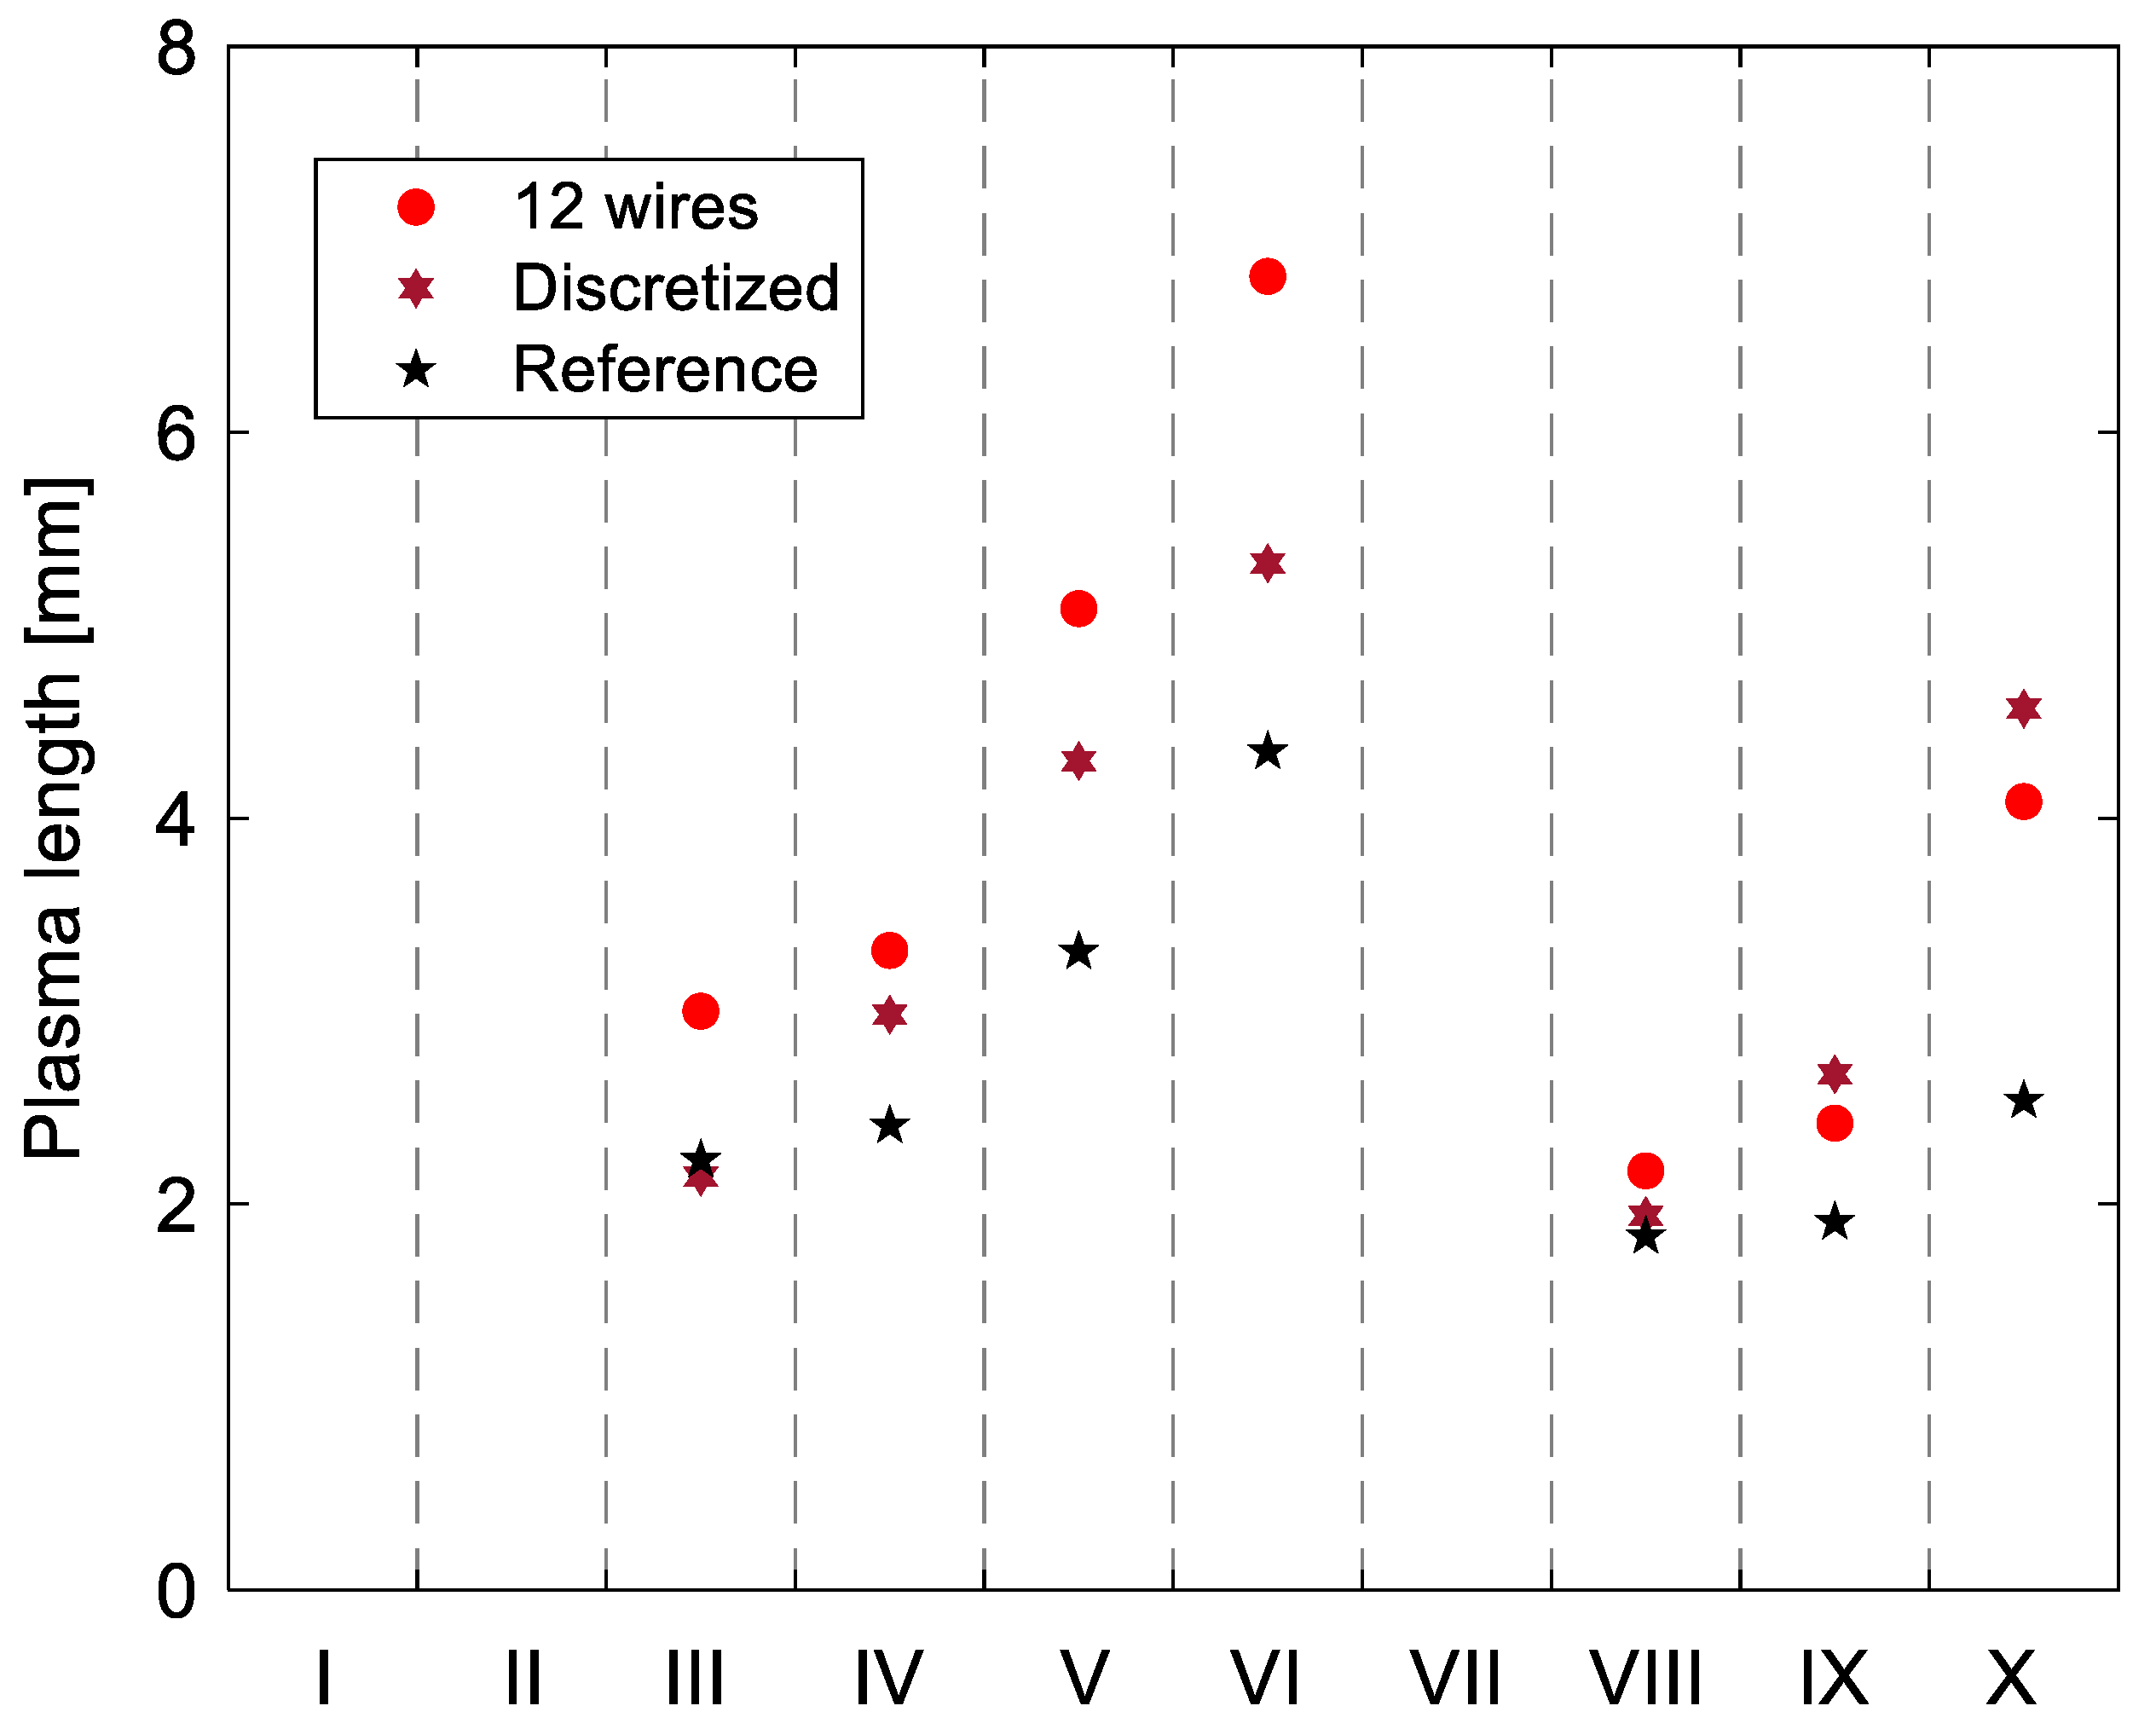
Visualization images of the DBD plasma were acquired for the string-array-type PA with 12 wires, and for the reference and discretized sheet-type PAs. Figure 10 shows the DBD emission images for PPA = 115.6 ± 1.6 W/m (Vp-p = 20 kV) on the surface of the string-array-type PA with 12 wires in 10 sections. Figure 11 shows a DBD visualization image in section V, when the power consumptions of the three types of PAs are close to PPA = 115 W/m; the dashed lines indicate the evaluated LDBD. The variations in plasma length in each section for the string-array-type PA with 12 wires are plotted in Figure 12, which also shows LDBD when using reference sheet-type PAs for PPA = 114.0 ± 1.3 W/m (Vp-p = 12 kV) and discretized sheet-type PAs for PPA = 117.3 ± 2.5 W/m (Vp-p = 14 kV); their variation in each section shows the same trend as that for the string-array-type PA. Regardless of the PA, streamer discharge-like light emission can be confirmed in the sections from (III) to (V) under the voltage drops, and the extension length is maximized in (VI) even under the voltage rises, the plasma extension length increases in the sections from (VIII) to (X); however, LDBD in section (X) is smaller than that in section (V).

3.3. Mechanism of Thrust–Power Ratio Increase by Discretizing Encapsulated Electrode

Because the brightness distribution in section (VI) is spatially non-uniform, LDBD analyzed in section (V) is adopted here as the representative plasma extension length to present the mechanism of the thrust–power ratio increase due to the discretized encapsulated electrodes.
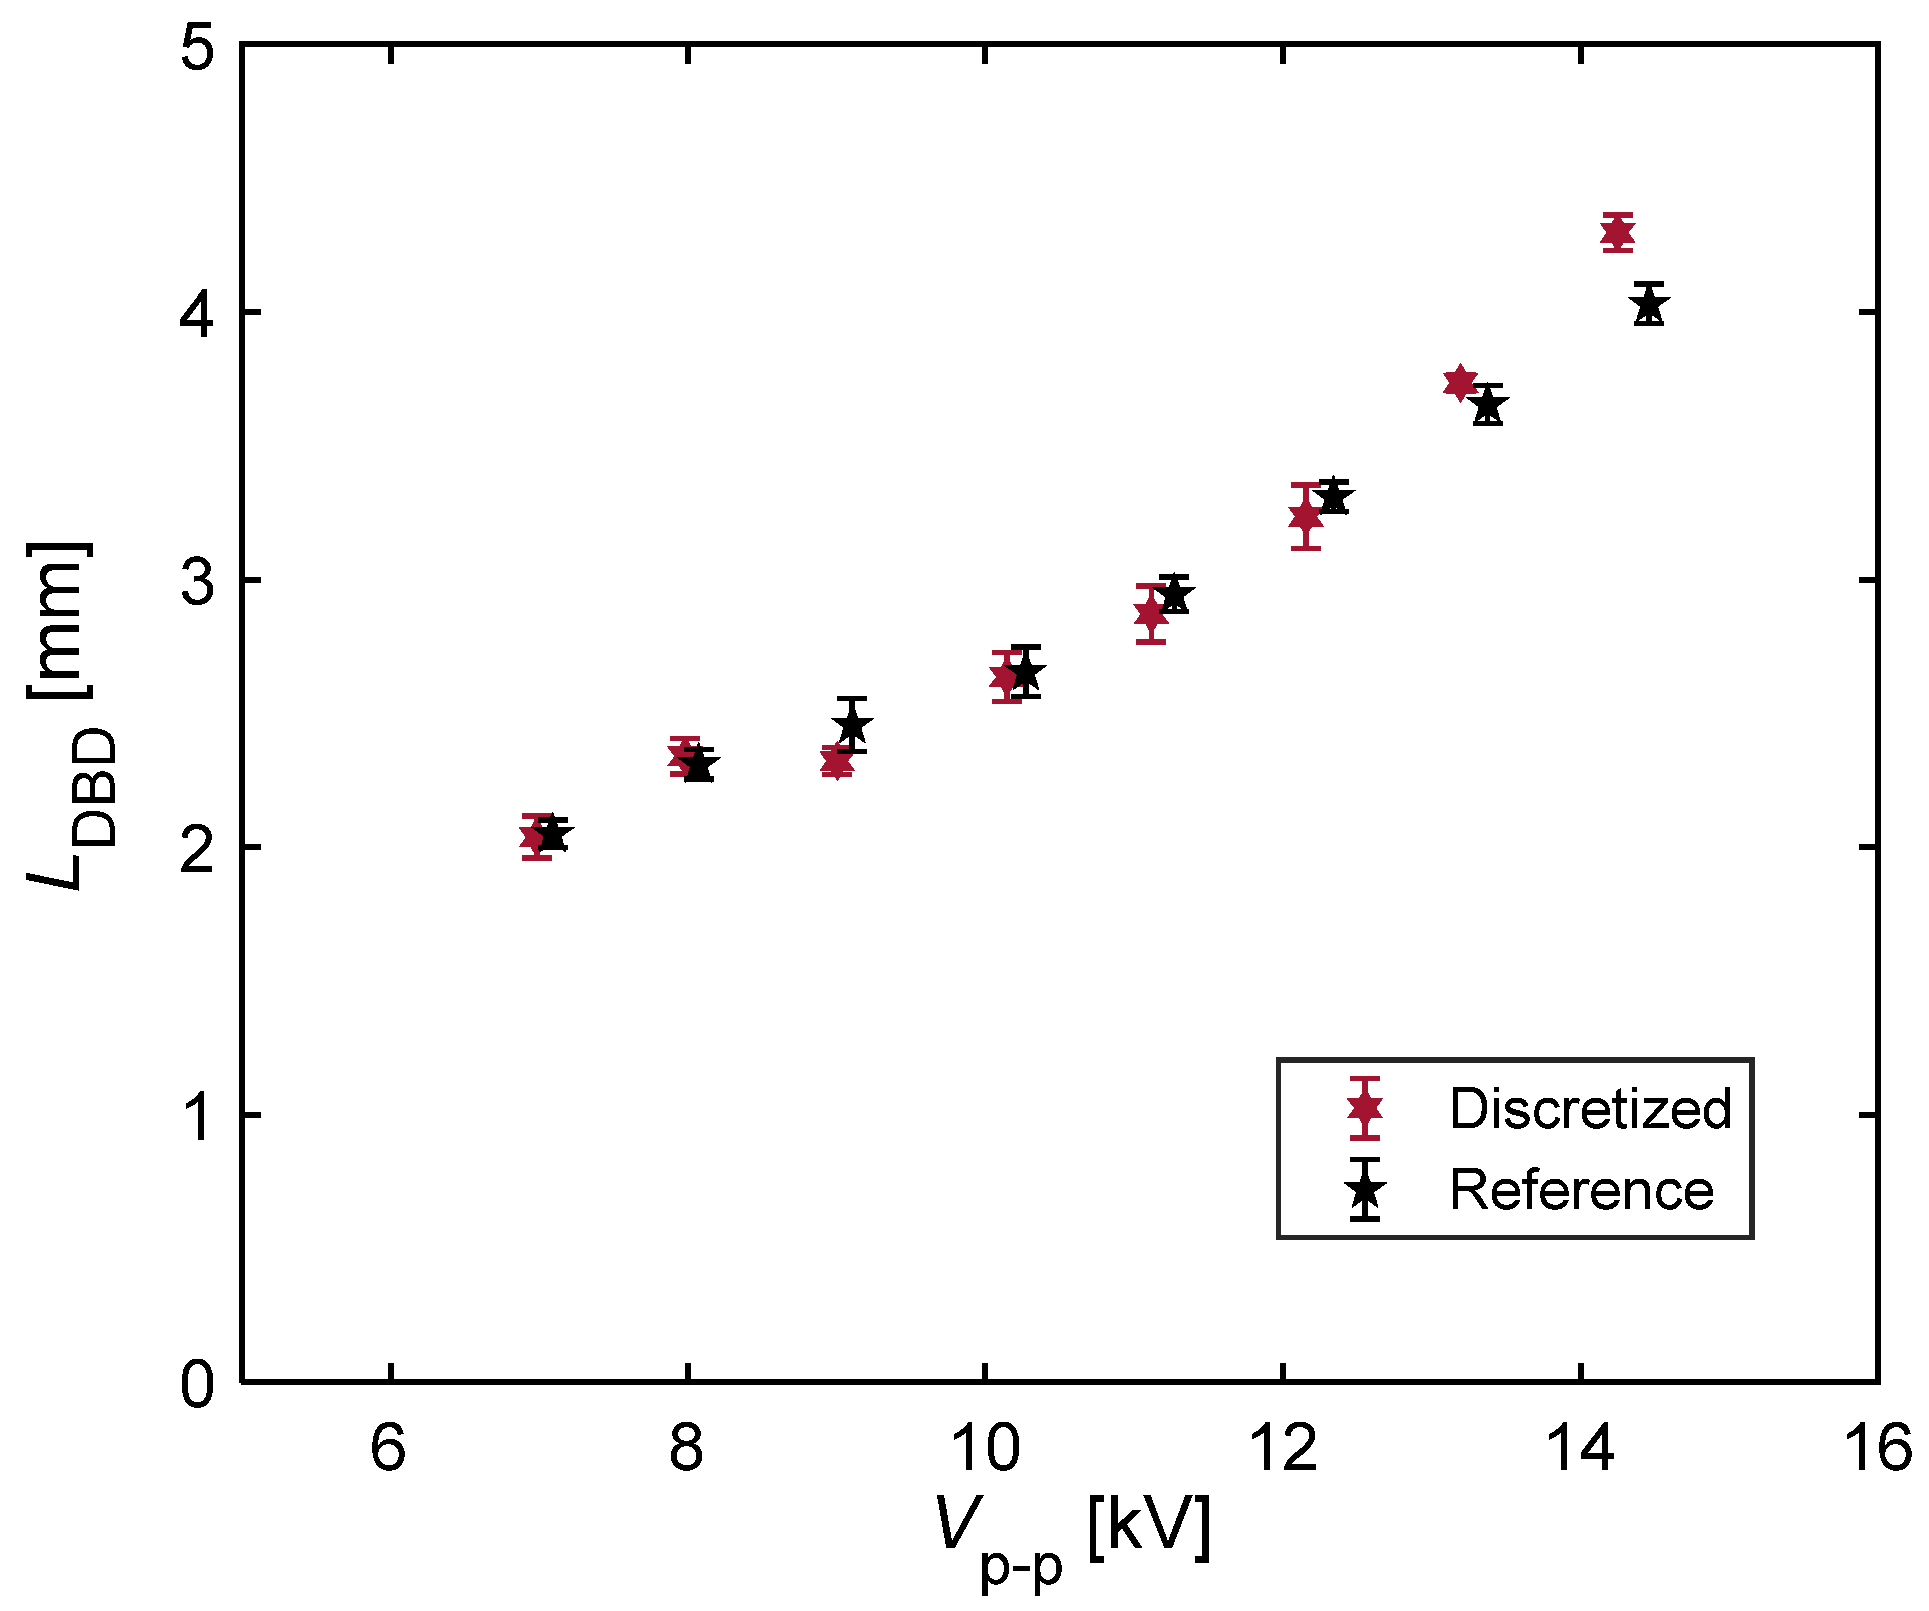
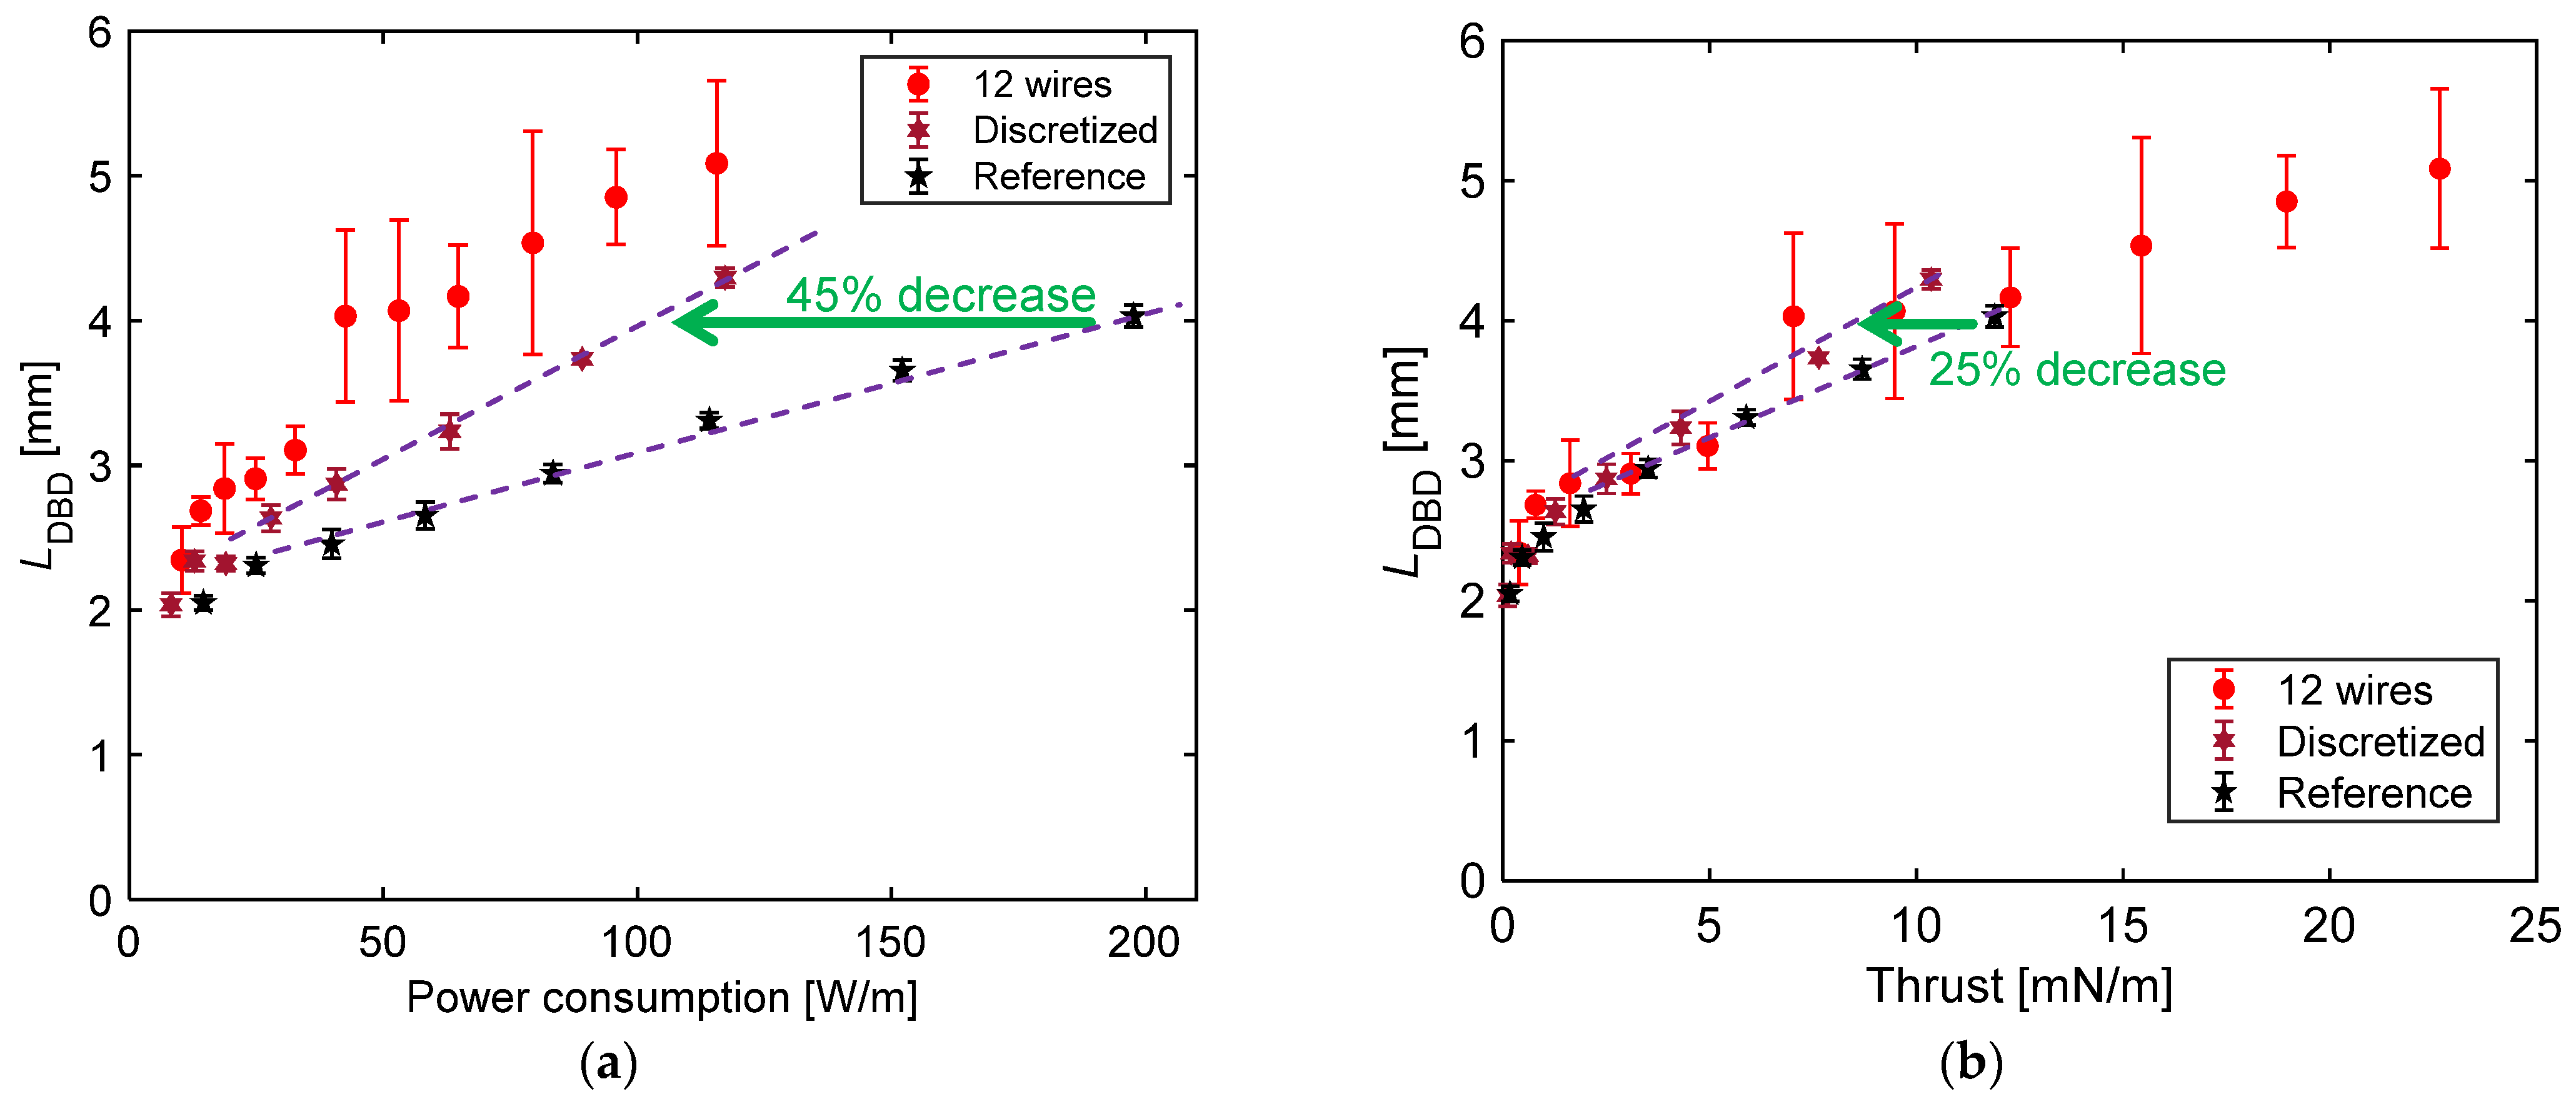
Figure 13 shows the plasma length as a function of Vp-p for the reference and discretized sheet-type PAs. Notably, there is no significant difference in the plasma length at the same applied voltage, even when the encapsulated electrode of the sheet-type PA is discretized. Figure 14a shows the power consumption dependence of LDBD, and the LDBDPPA ratio is improved in the two PAs with discretized encapsulated electrodes, compared with that for the reference sheet-type PA. When LDBD is the same, the power consumption of the discretized PA is reduced by more than 40%, compared to that of the reference PA. By contrast, as shown in Figure 14b, the increasing tendencies of LDBD in terms of the measured thrust in the three PAs appear to overlap roughly, causing the plasma extension length to dominate, regardless of the PA structure. However, when analyzed in detail, the thrust by the discretized PA is reduced by ~20% compared to the reference PA under the same LDBD conditions. Thus, if the applied Vp-p is the same, LDBD is equivalent for the two sheet PAs, and the thrust and power consumption of the discretized PA under the same LDBD = 4 mm conditions (see Figure 14) are reduced by 25% and 45%, respectively, compared to those of the reference PA. As a result, the thrust–power ratio was reduced by approximately 35%, which is close to the 30% shown in Figure 5a. However, the LDBD values and their errors of the string-array-type PA are larger than those of the sheet-type PA, as shown in Figure 14a. Such an error can be caused by the distance between electrodes, the shape of the encapsulated electrodes, and the difference in the methods used for manufacturing string-array-type and sheet-type PAs. Here, the effect of dielectric thickness on PA performance is considered. In the string-array-type PAs, the dielectric thickness of the string-array-type PA (~1.5 mm thick, as revealed by the analysis of the cut cross-section) is larger than that in the case of the discretized sheet-type PA (0.44 mm thick). This is consistent with the result that the capacitance C0 under no discharge from the string-array-type PA (12 wires) is significantly lower than under the no discharge from the discretized sheet-type PA, as shown in Figure 15b, and the performance of the string-array-type PA may have improved due to its lower power consumption. The difference in the magnitude of errors between these two types of PAs can be attributed to the relatively non-uniform spatial distribution of DBD plasma in the string-array-type PA compared with the discretized sheet-type PA, as shown in Figure 11. This can be due to the difference in the manufacturing methods of string-array-type and sheet-type PAs. In the string-array-type PAs, multiple conductive wires coated with silicone rubber are fixed by filling them with a room-temperature-curable silicone rubber using a jig that we developed; the forming accuracy, however, can be lower than that in the case of the sheet-type PAs, which were fabricated using the PCB process.
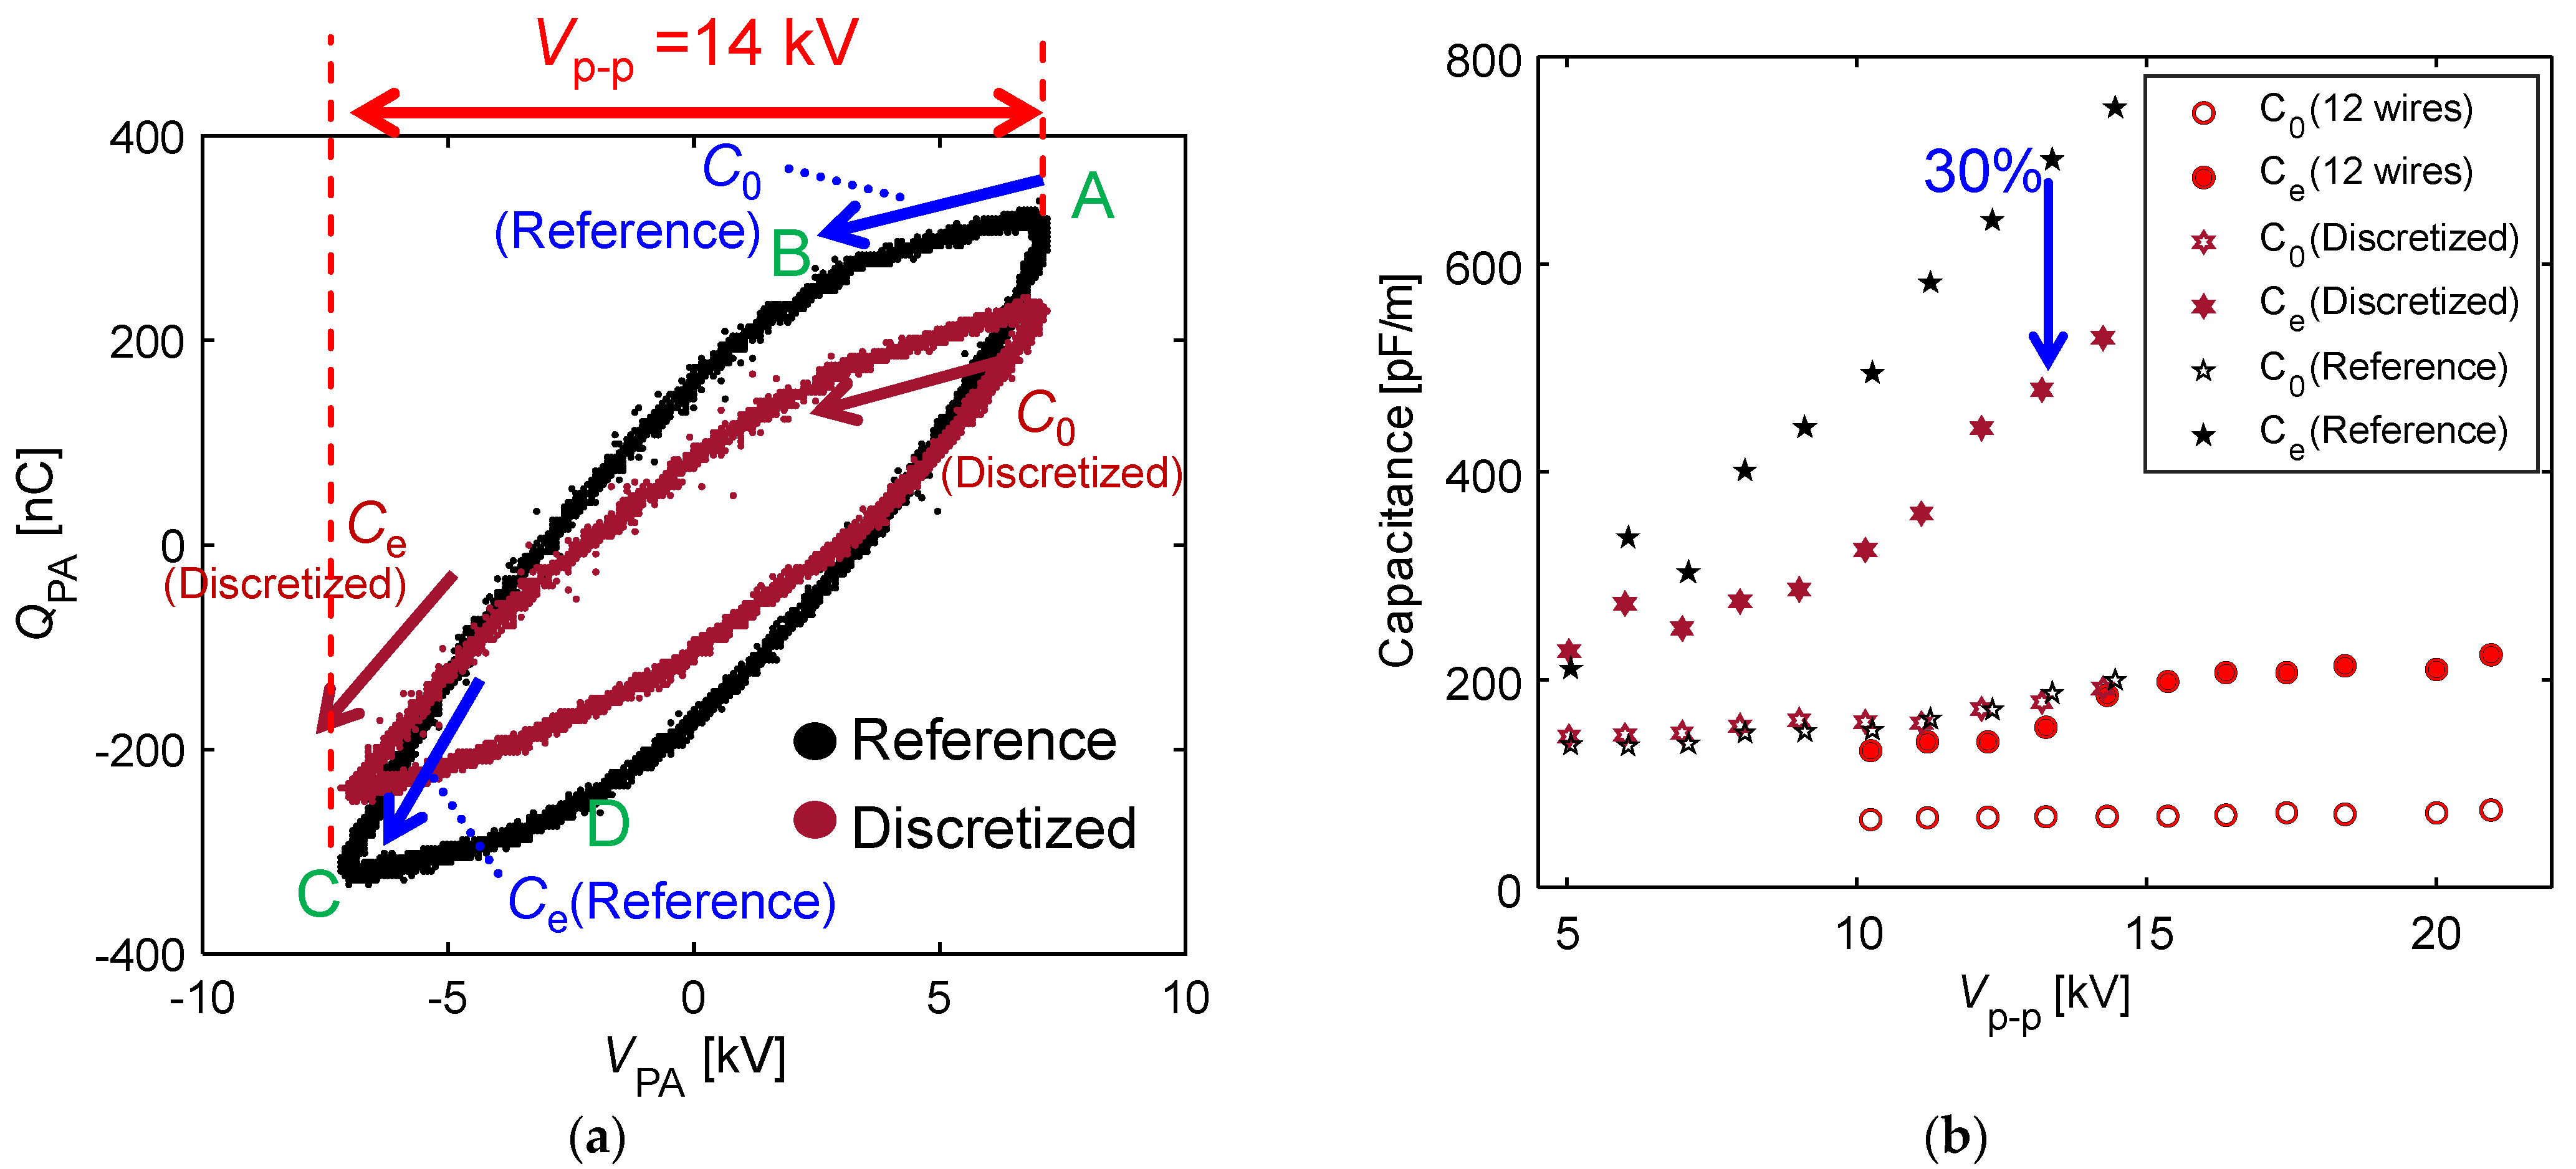
Elucidating the mechanism for the significant reduction in power consumption by the discretized structure of the encapsulated electrode involves analyzing the VQ Lissajous figure, which can be divided into four sections for one cycle, as shown in Figure 15a. There are discharge and non-discharge periods corresponding to the positive or negative values of dV/dt. The dQPA/dVPA value of the VQ Lissajous figure corresponds to the capacitance of the PA at a specific time, and the capacitance of the A–B section (C0) and B–C section (Ce) under dV/dt < 0 was obtained, as shown in Figure 15b [22]. Because dQPA/dVPA changes in the B–C section, Ce under discharge was calculated from the gradient close to C in Figure 15a. Although the capacitance increases during the discharge period in each PA, it was confirmed that the discretized sheet-type PA, which can be directly compared to the reference sheet-type PA, exhibits a reduced capacitance during discharge owing to the discretization effect. For example, Ce under discharge using the discretized PA was reduced by 30% compared to that of the reference sheet-type PA for Vp-p = 4 kV, whilst C0 had almost the same value. These results are also visually depicted in the Lissajous figure shown in Figure 15a. A Lissajous figure with a smaller Ce is geometrically smaller in area when C0 is the same under the same peak-to-peak voltage.
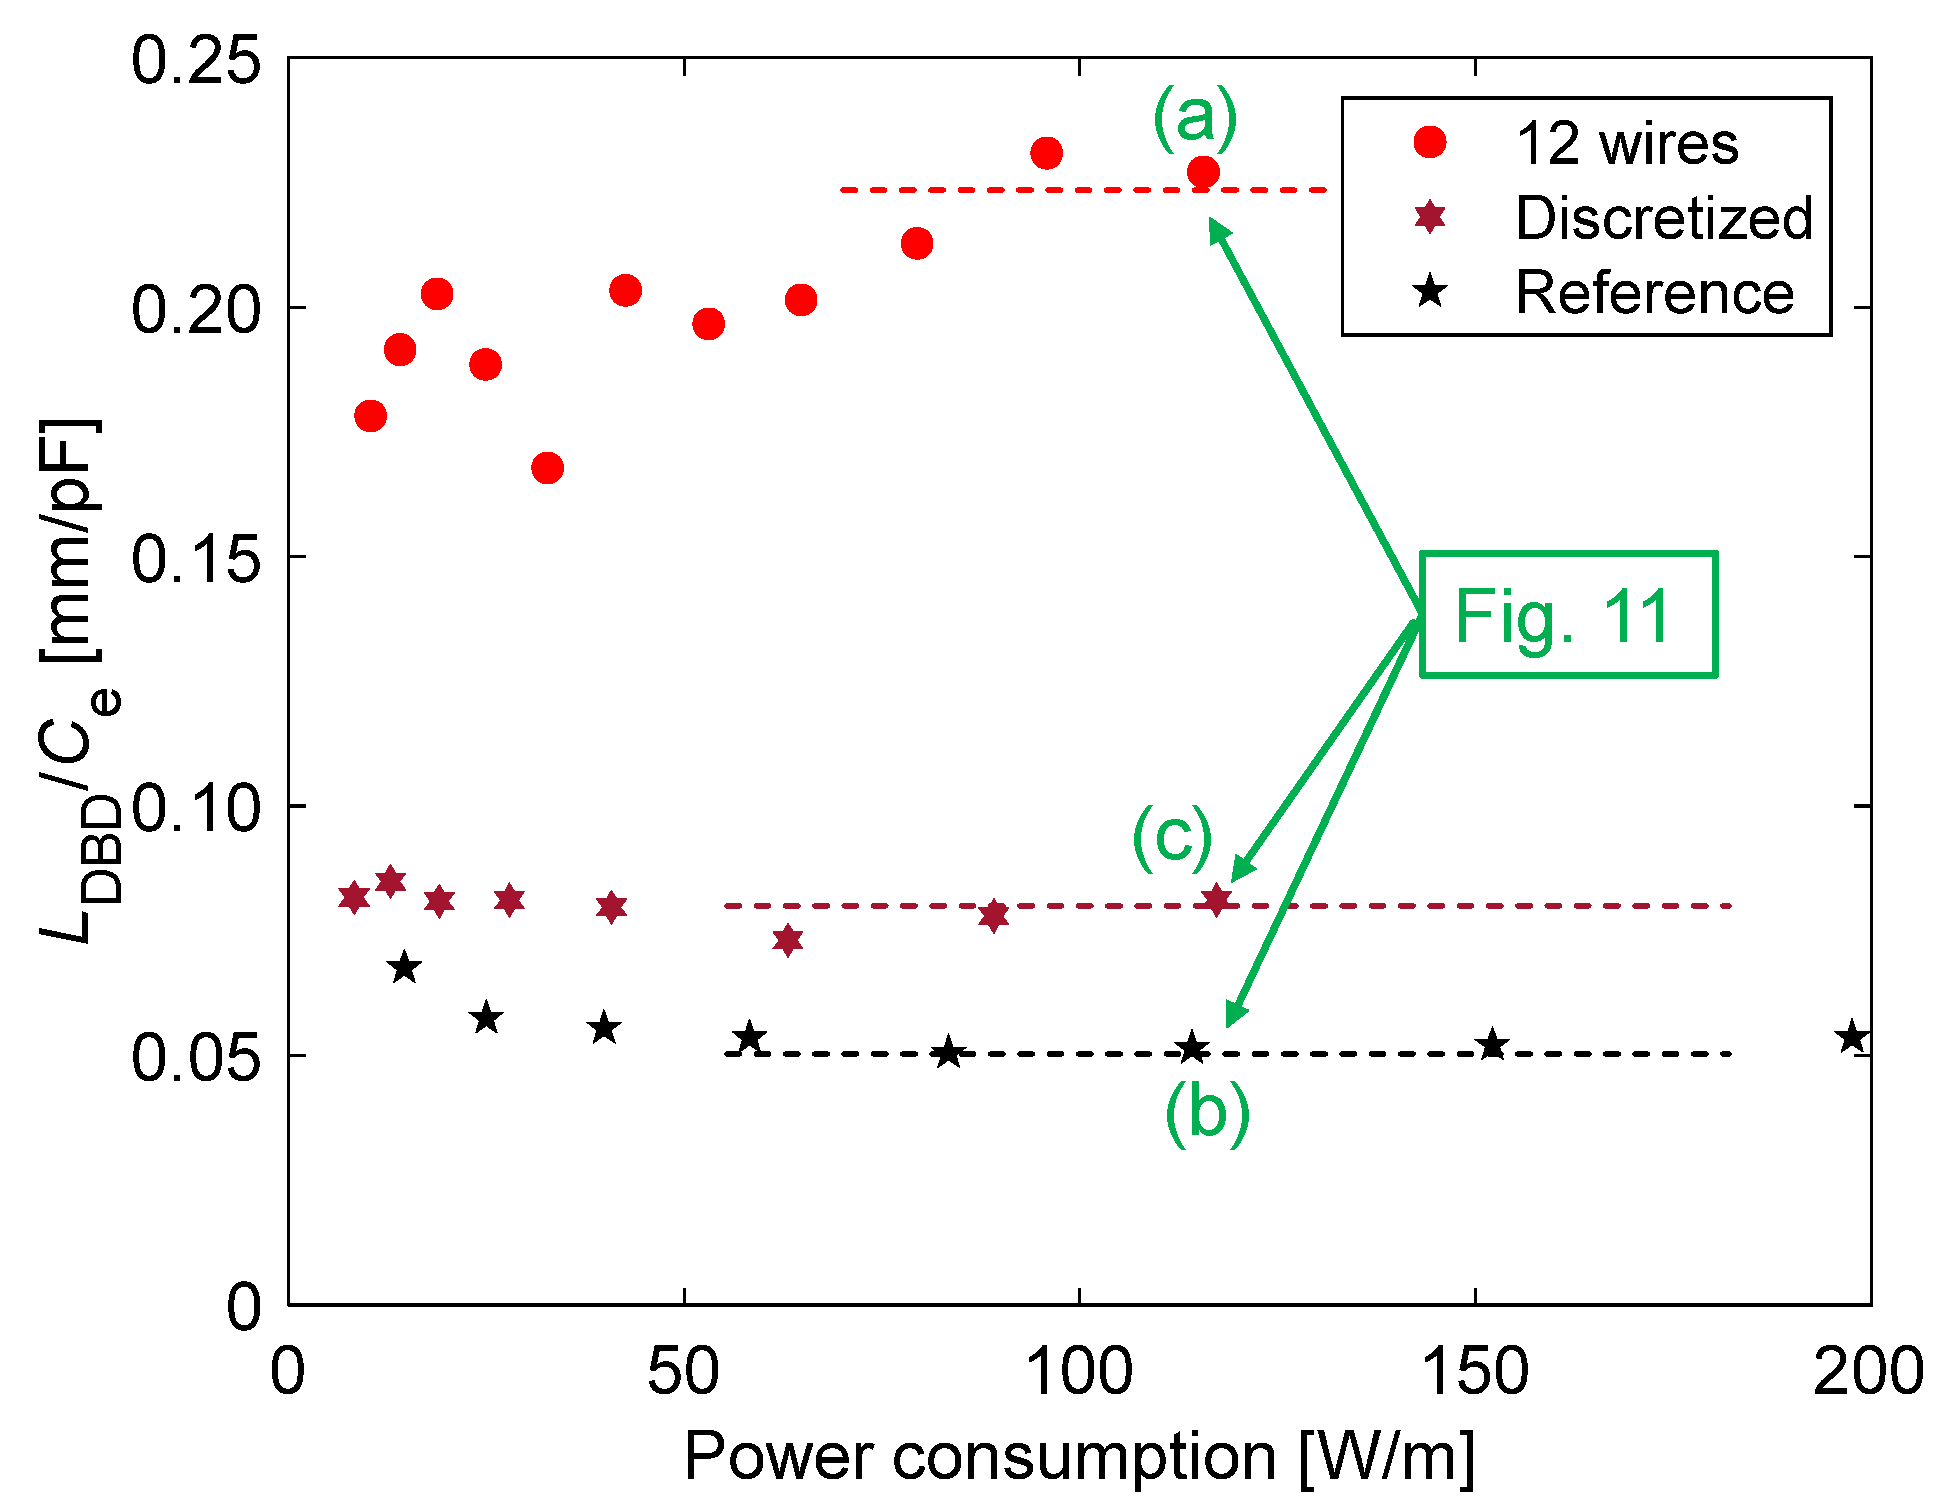
Because the discharge region is qualitatively conductive, the area of the exposed electrode increases substantially under discharge. This leads to an increase in the area of the overlap with the encapsulated electrode, thereby increasing the capacitance. However, compared to the conventional sheet-type PA, the reduction in the overlap area of the conductors due to the discretization of the encapsulated electrodes significantly reduces the capacitance. Figure 16 shows the power consumption dependence of the ratio of the plasma elongation length to the capacitance during discharge (LDBD/Ce). The capacitance under discharge increases in proportion to the plasma extension length as the value of LDBD/Ce becomes constant with an increase in power consumption. When the power consumption is larger than PPA = 50 W/m, the LDBD/Ce values approach 0.23 mm/pF (string-array-type PA, 12 wires), 0.05 mm/pF (reference sheet-type PA), and 0.08 mm/pF (discretized sheet-type PA). Three conditions (a), (b), and (c) indicated by the arrows in Figure 16 correspond to those under which discharge images for analyzing LDBD were acquired for PPA = 115 W/m in Figure 11. Notably, the higher the thrust–power ratio (as shown in Figure 4b), the higher the LDBD/Ce value. Under the same value of Ce, the plasma extension length increases for PA with a higher thrust–power ratio, and a larger thrust is also generated, as indicated in Figure 14b. In summary, the discretization of the encapsulated electrode not only reduces the capacitance during discharge but also generates a large thrust due to an increase in the plasma extension length under the same power consumption, leading to an improvement in the thrust–power ratio.

4. Discussions

In this study, we analyzed the increase in the thrust–power ratio caused by the discretization effect of the back electrodes for three types of PAs. To increase the discretization effect in sheet-type PAs, the width and spacing of the discretized encapsulated electrodes must be optimized. By contrast, string-array-type PAs do not use the same material and structure as the discretized sheet-type PAs. Therefore, it is necessary to compare the performance of string-array-type PAs with a test piece featuring the same specifications, except for the discretized circular conductors. In addition, even if the width of the encapsulated electrode becomes smaller, the thrust–power ratio can be improved via discretization when the overall width of the encapsulated electrode remains the same. However, the trend of variation in the thrust–power ratio with changes in the width and gap of the discretized electrode is currently unknown. Therefore, future studies identifying factors that maximize the efficiency are necessary because significant efficiency improvements could be realized along with the optimization of the applied voltage waveform [24,25,26], material and thickness of the insulation layer [16], and electrode structures such as the serrated exposed electrode edge [4,10]. New geometries are also being developed that can replace the exposure and encapsulated electrode structures of conventional PAs. For instance, the shape of the encapsulated electrode in string-type PAs may affect the efficiency. It has been reported in previous studies that a metallic wire with a circular cross-section used as an exposed electrode can increase the thrust–power ratio of a sheet-type PA [27,28,29]. Erfani et al. investigated the effect of varying the number and distribution of encapsulated electrodes in the dielectric layer and showed that PAs with a shallow initial encapsulated electrode could induce higher flow velocities than conventional PAs at the same voltage; however, the efficiency improvement effect was not investigated [30,31]. Although this structure represents a type of discretization of the encapsulated electrodes, to realize an increase in the thrust–power ratio, as shown in this study, it may be necessary to provide gaps in the x-direction between the multiple encapsulated electrodes.
These efforts can contribute toward various fundamental and industrial applications using DBD plasma, such as reducing the aerodynamic drag of automobiles [32,33], ignition and combustion technology for engine systems [34], atmospheric chemical vapor deposition [35,36], and ozone generators for virus inactivation [37], which have recently become socially relevant.

5. Conclusions

The induced flow velocity in existing string-type PAs does not increase even when the applied voltage is increased. Therefore, in this study, new string-array-type PAs were developed and characterized to remove the abovementioned limitation by substantially increasing the encapsulated electrode width. The following results were obtained:
(1)
The developed string-array-type PAs not only increased the thrust and induced flow velocity but also led to a nine-fold increase in the thrust–power ratio for eight or more wires, as compared with that when using a single wire, in the case of Vp-p ≥ 18 kV. This is likely due to both the substantial increase in the encapsulated electrode width by increasing the number of insulation-coated conductive wires and the discretization effect of the encapsulated electrode structure.
(2)
A direct performance comparison was achieved using reference and discretized sheet-type PAs with the same configuration, except for a discretized encapsulated electrode, and a 30% increase in the thrust–power ratio was confirmed due to the discretization effect. The velocity distributions of the induced flow, analyzed using PIV, revealed that the trend of the maximum velocity at x = 15 mm downstream of the exposed electrode edge as a function of the power consumption was consistent with the relationship between the thrust and power consumption characteristics.
(3)
A comparative analysis of the plasma extension lengths (LDBD) revealed that there was no significant difference in the LDBD of the reference and discretized PAs at the same Vp-p. Decreases of 25% in the thrust and 45% in the power consumption, respectively, under the same LDBD = 4 mm conditions using the discretized PA led to a 30% increase in the thrust–power ratio compared to the reference PA. The significant reduction in the power consumption, which contributed toward the increase in the thrust–power ratio, was caused by the decrease in capacitance during discharge at all peak-to-peak voltages as verified by voltage–charge (V–Q) Lissajous measurements.

Author Contributions

Conceptualization, T.S.; methodology, Y.S. and T.S.; software, Y.S. and R.I.; validation, T.S.; formal analysis, Y.S. and R.I.; investigation, H.I.; resources, T.S.; data curation, Y.S. and T.S.; writing—original draft preparation, T.S.; writing—review and editing, H.I.; visualization, H.I.; supervision, T.S. and H.I.; project administration, T.S.; funding acquisition, T.S. All authors have read and agreed to the published version of the manuscript.

Funding

This research received no external funding.

Data Availability Statement

The data that support the findings of this study are available from the corresponding author upon reasonable request.

Acknowledgments

Y.S. and R.I. conducted this research as research assistants (RA) with AIST’s internal and self-owned budgets.

Conflicts of Interest

The authors declare no conflict of interest.

References

  1. Roth, J.R.; Sherman, D.M.; Wilkinson, S.P. Boundary layer flow control with a one atmosphere uniform glow discharge surface plasma. In Proceedings of the 36th AIAA Aerospace Sciences Meeting and Exhibit, Reno, NV, USA, 12–15 January 1998; p. 328. [Google Scholar]
  2. Corke, T.C.; Jumper, E.J.; Post, M.L.; Orlov, D.; McLaughlin, T.E. Application of weakly-ionized plasmas as wing flow-control devices. In Proceedings of the 40th AIAA Aerospace Sciences Meeting & Exhibit, Reno, NV, USA, 14–17 January 2002; p. 350. [Google Scholar]
  3. Corke, T.C.; Enloe, C.L.; Wilkinson, S.P. Dielectric barrier discharge plasma actuators for flow control. Annu. Rev. Fluid. Mech. 2010, 42, 505–529. [Google Scholar] [CrossRef]
  4. Thomas, F.O.; Corke, T.C.; Iqbal, M.; Kozlov, A.; Schatzman, D. Optimization of dielectric barrier discharge plasma actuators for active aerodynamic flow control. AIAA J. 2009, 47, 2169–2178. [Google Scholar] [CrossRef] [Green Version]
  5. Giepman, R.H.M.; Kotsonis, M. On the mechanical efficiency of dielectric barrier discharge plasma actuators. Appl. Phys. Lett. 2011, 98, 221504. [Google Scholar] [CrossRef] [Green Version]
  6. Benard, N.; Moreau, E. Electrical and mechanical characteristics of surface ac dielectric barrier discharge plasma actuators applied to airflow control. Exp. Fluids 2014, 55, 1846. [Google Scholar] [CrossRef] [Green Version]
  7. Segawa, T.; Suzuki, D.; Fujino, T.; Jukes, T.; Matsunuma, T. Feedback control of flow separation using plasma actuator and FBG sensor. Int. J. Aerosp. Eng. 2016, 2016, 8648919. [Google Scholar] [CrossRef] [Green Version]
  8. Matsubara, T.; Shima, Y.; Aono, H.; Ishikawa, H.; Segawa, T. Effects of jet induced by string-type plasma actuator on flow around three-dimensional bluff body and drag force. Energies 2020, 13, 872. [Google Scholar] [CrossRef] [Green Version]
  9. Forte, M.; Jolibois, J.; Pons, J.; Moreau, E.; Touchard, G.; Cazalens, M. Optimization of a dielectric barrier discharge actuator by stationary and non-stationary measurements of the induced flow velocity: Application to airflow control. Exp. Fluids 2007, 43, 917–928. [Google Scholar] [CrossRef]
  10. Joussot, R.; Leroy, A.; Weber, R.; Rabat, H.; Loyer, S.; Hong, D. Plasma morphology and induced airflow characterization of a DBD actuator with serrated electrode. J. Phys. D Appl. Phys. 2013, 46, 125204. [Google Scholar] [CrossRef]
  11. Komuro, A.; Ogura, N.; Ito, M.; Nonomura, T.; Asai, K.; Ando, A. Visualization of density variations produced by alternating-current dielectric-barrier-discharge plasma actuators using the background-oriented schlieren method. Plasma Sources Sci. Technol. 2019, 28, 055002. [Google Scholar] [CrossRef]
  12. Matsunuma, T.; Segawa, T. Effects of input voltage and freestream velocity on active flow control of passage vortex in a linear turbine cascade using dielectric barrier discharge plasma actuator. Energies 2020, 13, 764. [Google Scholar] [CrossRef]
  13. Nonomura, T.; Ozawa, Y.; Ibuki, T.; Nankai, K.; Komuro, A.; Nishida, H.; Kotsonis, M.; Kubo, N.; Kawabata, H. Single-pixel particle image velocimetry for characterization of dielectric barrier discharge plasma actuators. AIAA J. 2020, 58, 4952–4957. [Google Scholar] [CrossRef]
  14. Kaneko, Y.; Nishida, H.; Tagawa, Y. Background-oriented schlieren measurement of near-surface density field in surface dielectric-barrier-discharge. Meas. Sci. Technol. 2021, 32, 125402. [Google Scholar] [CrossRef]
  15. Berendt, A.; Podlinski, J.; Mizeraczyk, J. Elongated DBD with floating interelectrodes for actuators. Eur. Phys. J. Appl. Phys. 2011, 55, 13804. [Google Scholar] [CrossRef] [Green Version]
  16. Wilkinson, S.P.; Siochi, E.J.; Sauti, G.; Xu, T.; Meador, M.A.; Guo, H. Evaluation of dielectric-barrier-discharge actuator substrate materials. In Proceedings of the 45th AIAA Plasmadynamics and Lasers Conference, Atlanta, GA, USA, 16–20 June 2014; p. 2810. [Google Scholar]
  17. Geuns, R.; Goekce, S.; Plyushchev, G.; Leyland, P.; Pimentel, R.; Champlain, A.; Jean, Y. Understanding SDBD actuators: An experimental study on plasma characteristics. In Proceedings of the 45th AIAA Plasmadynamics and Lasers Conference, Atlanta, GA, USA, 16–20 June 2014; p. 2811. [Google Scholar]
  18. Ashpis, D.E.; Laun, M.C. Characterization of dielectric barrier discharge plasma actuators: Logarithmic thrust–voltage quadratic relationship. AIAA J. 2017, 55, 3807–3816. [Google Scholar] [CrossRef]
  19. Kriegseis, J.; Möller, B.; Grundmann, S.; Tropea, C. Capacitance and power consumption quantification of dielectric barrier discharge (DBD) plasma actuators. J. Electrostat. 2011, 69, 302–312. [Google Scholar] [CrossRef]
  20. Wilde, N.D.; Xu, H.; Gomez-Vega, N.; Barrett, S.R.H. A model of surface dielectric barrier discharge power. Appl. Phys. Lett. 2021, 118, 154102. [Google Scholar] [CrossRef]
  21. Ashpis, D.E.; Laun, M.C.; Griebeler, E.L. Progress toward accurate measurement of dielectric barrier discharge plasma actuator power. AIAA J. 2017, 55, 2254–2268. [Google Scholar] [CrossRef]
  22. Hanson, R.E.; Houser, N.M.; Lavoie, P. Dielectric material degradation monitoring of dielectric barrier discharge plasma actuators. J. Appl. Phys. 2014, 115, 043301. [Google Scholar] [CrossRef]
  23. Kriegseis, J.; Grundmann, S.; Tropea, C. Power consumption, discharge capacitance and light emission as measures for thrust production of dielectric barrier discharge plasma actuators. J. Appl. Phys. 2011, 110, 013305. [Google Scholar] [CrossRef]
  24. Benard, N.; Moreau, E. Role of the electric waveform supplying a dielectric barrier discharge plasma actuator. Appl. Phys. Lett. 2012, 110, 193503. [Google Scholar] [CrossRef]
  25. Kotsonis, M.; Ghaemi, S. Performance improvement of plasma actuators using asymmetric high voltage waveforms. J. Phys. D Appl. Phys. 2012, 45, 045204. [Google Scholar] [CrossRef]
  26. Nakano, A.; Nishida, H. The effect of the voltage waveform on performance of dielectric barrier discharge plasma actuator. J. Appl. Phys. 2019, 116, 173303. [Google Scholar] [CrossRef]
  27. Mangina, R.S.; Enloe, C.L.; Font, G.I. Dielectric barrier discharge-based plasma actuator operation in artificial atmospheres for validation of modeling and simulation. Phys. Plasmas 2015, 22, 114502. [Google Scholar] [CrossRef]
  28. Moreau, E.; Cazour, J.; Benard, N. Influence of the air-exposed active electrode shape on the electrical, optical and mechanical characteristics of a surface dielectric barrier discharge plasma actuator. J. Electrostat. 2018, 93, 146–153. [Google Scholar] [CrossRef]
  29. Kaneko, Y.; Nishida, H.; Tagawa, Y. Visualization of the electrohydrodynamic and thermal effects of AC-DBD plasma actuators of plate and wire-exposed electrodes. Actuators 2021, 11, 38. [Google Scholar] [CrossRef]
  30. Erfani, R.; Zare-Behtash, H.; Hale, C.; Kontis, K. Development of DBD plasma actuators: The double encapsulated electrode. Acta Astronaut. 2015, 109, 132–143. [Google Scholar] [CrossRef] [Green Version]
  31. Erfani, R.; Erfani, T.; Utyuzhnikov, S.V.; Kontis, K. Optimisation of multiple encapsulated electrode plasma actuator. Aerosp. Sci. Technol. 2013, 26, 120–127. [Google Scholar] [CrossRef]
  32. Michelis, T.; Kotsonis, M. Flow control on a transport truck side mirror using plasma actuators. J. Fluid Eng-Trans. ASME 2015, 137, 111103. [Google Scholar] [CrossRef]
  33. Vernet, J.A.; Örlü, R.; Söderblom, D.; Elofsson, P.; Alfredsson, P.H. Plasma streamwise vortex generators for flow separation control on trucks. Flow Turbul. Combust. 2018, 100, 1101–1109. [Google Scholar] [CrossRef] [Green Version]
  34. Takahashi, E.; Nagano, Y.; Kitagawa, T.; Nishioka, M.; Nakamura, T.; Nakano, M. Demonstration of knock intensity mitigation through dielectric barrier discharge reformation in an RCEM. Combust. Flame 2020, 216, 185–193. [Google Scholar] [CrossRef]
  35. Starostin, S.A.; Premkumar, P.A.; Creatore, M.; van Veldhuizen, E.M.; de Vries, H.; Paffen, R.M.J.; de Sanden, M.C.M. On the formation mechanisms of the diffuse atmospheric pressure dielectric barrier discharge in CVD processes of thin silica-like films. Plasma Sources Sci. Technol. 2009, 18, 045021. [Google Scholar] [CrossRef] [Green Version]
  36. Lelièvre, J.-F.; Kafle, B.; Saint-Cast, P.; Brunet, P.; Magnan, R.; Hernandez, E.; Pouliquen, S.; Massines, F. Efficient silicon nitride SiNx:H antireflective and passivation layers deposited by atmospheric pressure PECVD for silicon solar cells. Prog. Photovolt. 2019, 27, 1007–1019. [Google Scholar] [CrossRef]
  37. Gershman, S.; Harreguy, M.B.; Yatom, S.; Raitses, Y.; Efthimion, P.; Haspel, G. A low power flexible dielectric barrier discharge disinfects surfaces and improves the action of hydrogen peroxide. Sci. Rep. 2021, 11, 4626. [Google Scholar] [CrossRef] [PubMed]
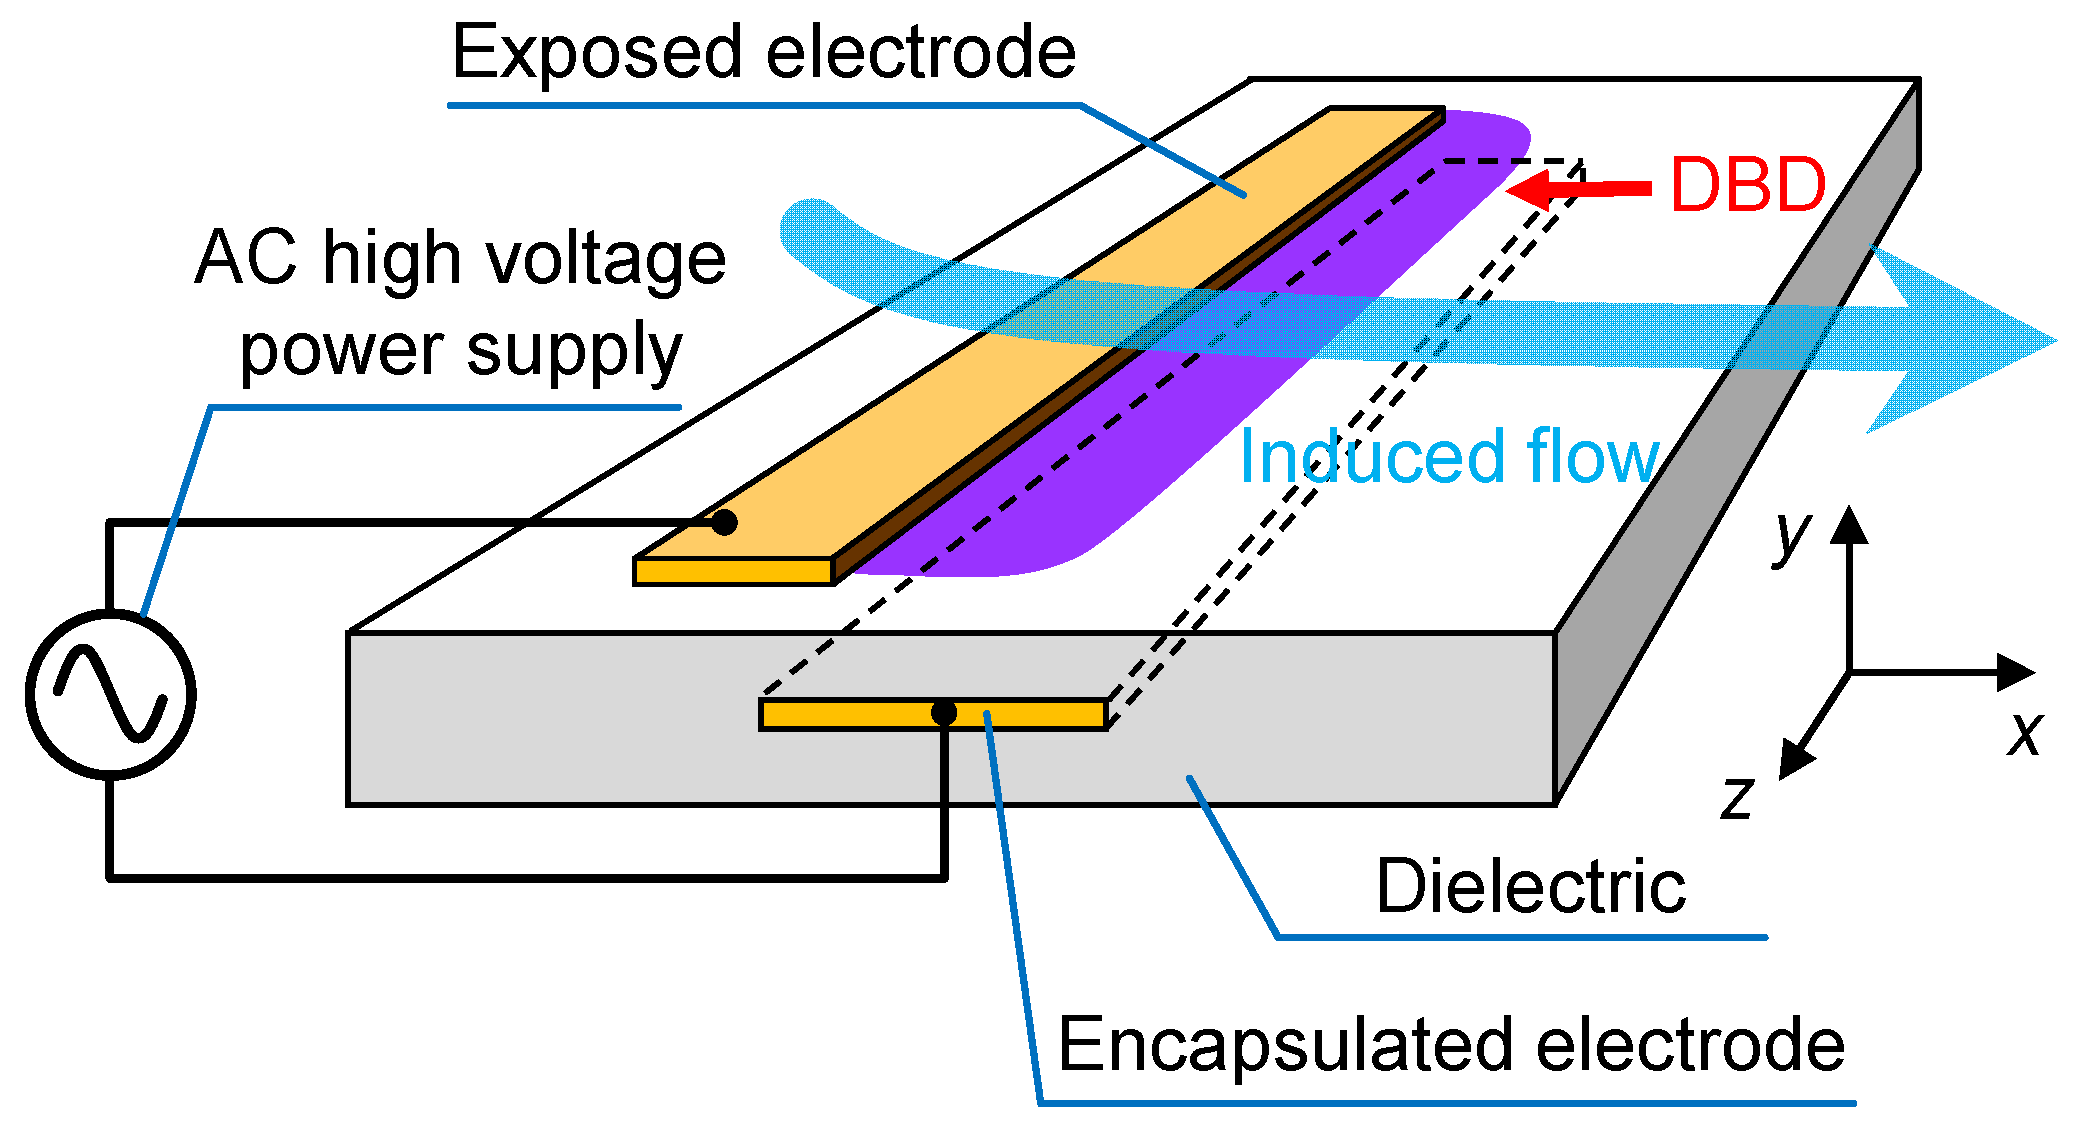
Figure 1. Schematic of conventional (sheet-type) PA originally proposed by Roth et al. [1].
Actuators 11 00296 g001
Figure 2. PA configurations used in this study: (a) string-type (single wire) and string-array-type (2–12 wires) PAs; (b) reference sheet-type PA; (c) discretized sheet-type PA.
Actuators 11 00296 g002
Figure 3. Experimental setup for thrust measurement. The green area represents the region of flow visualization for PIV analysis.
Actuators 11 00296 g003
Figure 4. Thrust as a function of (a) Vp-p compared with the data obtained by Ashpis et al. [21]; (b) PPA. At 30 W/m, the thrust of the string-array-type PA with eight or more wires increased by approximately five times, as compared with that of the string-type PA with a single wire.
Actuators 11 00296 g004
Figure 5. (a) Vp-p as a function of the thrust–power ratio. The thrust–power ratio increased by 9 times for eight or more wires, compared with that when using a single wire, in the case of Vp-p ≥ 18 kV; it also increased by 30% by the discretized PA as a direct comparison with the reference PA at Vp-p = 14 kV; (b) Power consumption as a function of Vp-p in comparison with the data obtained by Hanson et al. [22].
Actuators 11 00296 g005
Figure 6. Velocity distributions in the xy cross-section analyzed by PIV for 80 < PPA < 90 W/m. (a) String-array-type PA with 12 wires for PPA = 79.5 ± 5.1 W/m at Vp-p = 18 kV; (b) four wires for 81.5 ± 4.3 W/m at 20 kV; (c) discretized sheet-type PA for 88.0 ± 2.4 W/m at 13 kV; (d) reference sheet-type PA for 87.2 ± 2.0 W/m at 11 kV.
Actuators 11 00296 g006
Figure 7. umax as a function of power consumption at x = 15 mm downstream of the exposed electrode edge. The four conditions indicated by the arrows are shown in Figure 6 for comparisons of the velocity distributions of the induced flow.
Actuators 11 00296 g007
Figure 8. Measured voltage and current in one cycle (fp = 6.4 kHz) divided into 10 sections from (I) to (X) for visualization of DBD using ICCD camera.
Actuators 11 00296 g008
Figure 9. Analysis of plasma extension length, (a) discharge image acquired using ICCD camera; (b) definition of plasma length.
Actuators 11 00296 g009
Figure 10. DBD emission images of the surface of the string-array-type PA with 12 wires in 10 sections (I) to (X) of the applied sinusoidal voltage, for PPA = 115.6 W/m (Vp-p = 20 kV).
Actuators 11 00296 g010
Figure 11. DBD emission images of section (V), shown in Figure 12, for (a) string-array-type PA with 12 wires, (b) reference, and (c) discretized sheet-type PAs for PPA ≈ 115 W. LDBD defined as plasma length in section (V) and power consumption are evaluated as (a) 5.1 ± 0.6 mm, 115.6 W/m; (b) 3.3 ± 0.1 mm, 114.1 W/m; (c) 4.3 ± 0.1 mm, 117.3 W/m, respectively.
Actuators 11 00296 g011
Figure 12. Variations in plasma length over 10 sections for the string-array-type PA with 12 wires (Vp-p = 20 kV, PPA = 115.6 W/m), and reference (Vp-p = 14 kV, PPA = 114.1 W/m) and discretized (Vp-p = 12 kV, PPA = 117.3 W/m) sheet-type PAs for PPA ≈ 115 W.
Actuators 11 00296 g012
Figure 13. Plasma length (LDBD) estimated in section V as a function of Vp-p for reference and discretized sheet-type PAs.
Actuators 11 00296 g013
Figure 14. Plasma length (LDBD) estimated in section V as a function of (a) power consumption; (b) thrust.
Actuators 11 00296 g014
Figure 15. (a) Capacitance analysis of VQ Lissajous figures under discharge and non-discharge periods (DBD: Ce, non-DBD: C0) of reference and discretized sheet-type PAs when Vp-p = 14 kV; (b) variations in Ce and C0 as functions of Vp-p for three types of PA.
Actuators 11 00296 g015
Figure 16. LDBD/Ce as a function of PPA for the three PAs. Under PPA > 50 W/m, LDBD/Ce approaches constant values of 0.23 mm/pF (string-array-type, 12 wires), 0.05 mm/pF (reference), and 0.08 mm/pF (discretized). Three conditions (a), (b), and (c) indicated by the arrows correspond to those under which discharge images for analyzing LDBD were acquired in Figure 11.
Actuators 11 00296 g016
Publisher’s Note: MDPI stays neutral with regard to jurisdictional claims in published maps and institutional affiliations.