Article

Operation State Identification Method for Converter Transformers Based on Vibration Detection Technology and Deep Belief Network Optimization Algorithm

State Key Laboratory of Power Transmission Equipment & System Security and New Technology, Chongqing University, Chongqing 400044, China
*
Author to whom correspondence should be addressed.
Actuators 2021, 10(3), 56; https://doi.org/10.3390/act10030056
Submission received: 25 February 2021 / Revised: 6 March 2021 / Accepted: 8 March 2021 / Published: 11 March 2021

Abstract

:
The converter transformer is a special power transformer that connects the converter bridge to the AC system in the HVDC transmission system. Due to the special structure of the converter transformer, it is necessary to test its operation state during its manufacture and processing to ensure the safety of its future connection to the grid. Numerous studies have shown that vibration signals in transformers can reflect their operating state. Therefore, in order to achieve an effective identification of the operation state of the converter transformer, this paper proposes a method for identifying the operation state of the converter transformer based on vibration detection technology and a deep belief network optimization algorithm. This paper firstly describes the background, principle and application of vibration detection technology, using vibration measurement systems with piezoelectric acceleration sensors, piezoelectric actuators and data acquisition instruments to collect vibration signals at different measurement points on the converter transformer in states of no-load and on-load. By analyzing the time-frequency characteristics of the vibration signals, fast Fourier transform (FFT), wavelet packet decomposition (WPD) and time domain indexes (TDI) are combined into a fused feature extraction method to extract the eigenvalues of the vibration signals, so that the fused eigenvectors of the signals can be constructed. Considering the excellent performance of deep learning in classification, the deep belief network is used to classify the signals’ eigenvectors. To effectively improve the network classification efficiency, the sparrow search algorithm was introduced to build a mathematical model based on the behavioral characteristics of sparrow populations and combine the model with a deep belief network, so as to achieve adaptive parameter optimization of the network and accurate classification of the signals’ eigenvectors. The proposed method is applied to a 500 kV converter transformer for experimental verification. The experimental results show that the fused feature extraction method was able to fully extract the features of the vibration signal, and the deep belief network optimization algorithm had higher classification accuracy and better operational efficiency, and was able to effectively achieve accurate identification of the operation state of the converter transformer. In addition, the method achieved a precision response to the detection results of the vibration sensors, contributing to future improvements in converter transformer manufacturing technology.

1. Introduction

The rapid development of HVDC transmission technology has led to an increase in the proportion of DC transmission lines in the overall power system, which places higher demands on the safe and stable operation of power equipment. The converter transformer is the key core equipment in the HVDC transmission system, enabling the connection of the converter bridge to the AC bus and providing the converter bridge with a phase change voltage for three phases without grounding the neutral point. The performance of the converter transformer directly determines the reliability level of the entire power system [1,2], but the key technologies required for the manufacture and processing of converter transformers are too complex and require a full understanding of the operating characteristics of converter transformers for further improvement. Manufacturers require testing under both no-load and load operating conditions at the manufacturing and processing stages of the converter transformer, which can usually be achieved by varying the no-load voltage and load current. However, it is difficult to achieve a precision response to the operation state of the converter transformer with the existing technology. Therefore, it is essential to identify the operating state of the converter transformer immediately. A key issue is that the structure of converter transformers is more complex than that of power transformer. In addition, research has consistently shown that there is an AC-DC complex electromagnetic field inside the converter transformer during its operation state. Operation state identification of converter transformers can be adversely affected by these problems, making it technically challenging [3,4]. Therefore, there is an urgent need to study an effective method for operation state identification of converter transformers.
Studies over the past half a century have provided many different methods for identifying the operation state power transformer [5], such as dissolved gas analysis (DGA) [6,7,8], communication method (CM) [9], current deformation coefficient method [10], ultrasonic method [11], short circuit impedance and winding stray reactance method [12,13], online transfer function method [14]. However, the above research on operation state identification of power transformers has mostly been restricted to limitation of security, stability and economy [15]. The vibration method is an emerging method for identifying operating state of power transformer in recent years. By measuring the vibration signals of the transformer tank with sensors and analyzing the signals characteristics, this method can effectively identify the operation state of power transformers. One notable advantage of the vibration method is that it avoids the problem of electrical connection with a power transformer. In addition, the vibration method has several attractive features: strong anti-interference performance and sensitivity, high safety and reliability.
In recent years, there has been an increasing amount of literature on the application of the vibration method in the field of operation state identification of power transformers. Garcia et al. [16,17,18] established a vibration model of the oil tank of a power transformer, identified the generation mechanism, propagation mode and influencing factors of vibration signals of the winding and core in the power transformer, and proposed a winding deformation detection method based on vibration signals, which settled the research idea of the traditional vibration method. In the follow-up research, Zhang et al. [19] investigated the factors influencing the vibration acceleration of windings in the axial and radial directions by establishing the vibration generation model of transformer windings under load current; they then studied the modal characteristics of transformer windings based on operational modal analysis (OMA) [20]. Zhou et al. [21] proposed a winding vibration model coupled with electromagnetic force analysis, and studied the effect of the winding clamping force on vibration to assess the winding clamping state. Zhang et al. [22] used the magnetostrictive orthogonal calculation method to simulate the vibration of iron cores of the transformer and shunt reactor models.
Unlike the signals measured by PMUs commonly used in power systems, vibration signals are measured at extremely high frequencies [23]. Therefore, most scholars have used time-frequency analysis methods to extract the vibration signal characteristics of different operation states of power transformers, and identified the operation state by comparing the characteristics of signals. Ji et al. [24] proposed a load current method to obtain the fundamental frequency component of the core vibration signals under open-circuit conditions. Geng et al. [25] proposed an improved empirical modal decomposition algorithm to identify the modal parameters of transformer winding with high accuracy. Borucki [26] used the short-time Fourier transform (STFT) to convert the acoustic vibration signals of power transformer into time-frequency images and determined the transient operating state of the power transformer by observing the images. Zhao and Xu Gang [27] proposed a feature extraction method for the vibration signals of power transformers based on empirical wavelet transform and multi-scale entropy. Similarly, Hong et al. [28] proposed a feature extraction method based on variational mode decomposition (VMD) and wavelet transform (WT) to identify the degradation of internal mechanical properties of power transformers. Cao et al. [29] proposed a monitoring method based on vibration and reactance information by using it to monitor the loosened state and deformational fault of windings. Due to the complex operating environment of power transformers, the characteristics of the vibration signals generated in different operation states are not significant in some cases. Such approaches, however, have failed to resolve the contradiction that the time-frequency resolution is not simultaneously optimal, which still have limitations in terms of practical application by virtue of their poor effect on complex, acyclic and non-stationary signal processing.
With advances in computer technology, many machine learning algorithms and deep learning models have been applied in the field of transformer state identification owing to excellent classification performance, such as artificial neural network (ANN) [30], support vector machines (SVM) [31], extreme learning machine (ELM) [32], random forest (RF) [33,34], and deep belief network (DBN) [35,36]. Several techniques have been developed to be applied to the vibration method so far. Deng et al. [37] extracted the energy entropy of the vibration signals as an eigenvector, combined the K-means clustering algorithm and BP neural network to establish a fault diagnosis model for power transformers. Hong et al. [38] proposed a probabilistic-based classification method for real-time transformer state, where the classification model used support vector machine. Cao et al. [39] used unit-valued space vector transformation to fuse the vibration and reactance parameters of a transformer to establish a fault eigenvectors, and used relevance vector machine (RVM) to identify the type of deformation fault in the transformer windings. Zhang et al. [40] used wavelet transform to obtain the spectral entropy of power transformer vibration signals as input eigenvectors, and used a multi-class support vector machine to complete the state identification of power transformer. Zollannvari et al. [41] examined the possibility of using deep recurrent neural network (RNN) to predict transformer fault in the early stages. Hong et al. [42] used cross recurrence plot analysis to extract the nonlinear features and employed Hidden Markov models to classify the typical as-simulated winding conditions, including normal, degraded and anomalous classes. Although these methods are significant under specific experimental conditions, they mostly use destructive tests to create more extreme states for identification, and more electrical quantities must be introduced in order to detect smaller changes in state, making the problem more complicated. Although these methods are significant under specific experimental conditions, they mostly use destructive tests to create more extreme states for identification. To detect smaller changes of transformer state, these methods have to introduce more electrical quantities to improve the identification accuracy, which also makes the problem more complicated and makes it difficult to apply such methods to converter transformers with harsh experimental conditions.
Extensive research has shown that the vibration signals of power transformers mainly come from the coupling of winding vibration and core vibration [43]. However, recent evidence suggests that the nonlinear characteristics and DC bias phenomenon of the converter transformer affect the vibration characteristics of its own windings and cores, which results in a large difference between vibration signal characteristics of converter transformers and power transformers [44,45,46]. The vibration characteristics of converter transformers have not yet been investigated thoroughly, which leads to there having been few uses of the vibration method to identify the operation state of converter transformers. Previous studies have remained narrow in focus, dealing only with power transformers; therefore, this paper explores the ways in which the vibration method can be applied in the identification of the operation state of converter transformers, hoping to help further improve the manufacturing process of converter transformers in the future. This paper proposes a new methodology for the identification of the operation state of converter transformers. Firstly, the vibration characteristics of the converter transformer and the time-frequency characteristics of the vibration signals are analyzed, then the Fourier transform, wavelet packet decomposition algorithm and time domain indexes are used to jointly construct eigenvectors. Secondly, the deep belief network, optimized by the sparrow search algorithm, is used as a classification model for eigenvector classification. The proposed method is validated with no-load and on-load experiments on a converter transformer. The experimental results show that the method can accurately identify the vibration signals at different measurement points and operation states of the converter transformer. The importance and originality of this study are that it undertakes a longitudinal analysis of the vibration characteristics of converter transformers and explores the application of deep learning in the operation state identification of converter transformers, which offers some important insights into future research on the fault diagnosis and localization of converter transformers.
The remaining content of this paper is arranged as follows. Section 2 analyzes the vibration mechanism and signal measurement process of converter transformers. Section 3 analyzes the vibration characteristics of the converter transformer vibration signal, introduces the time-frequency characteristics of the vibration signal, the extraction process of the vibration signal characteristics, and the construction of the eigenvectors. Section 4 introduces the basic principle of the deep belief network and the eigenvector classification model optimized using the sparrow search algorithm. In Section 5, no-load and on-load experiments are performed on the converter transformer to verify the proposed method. Section 6 gives the conclusion and future prospects.

2. Vibration Mechanism and Signal Measurement of Converter Transformers

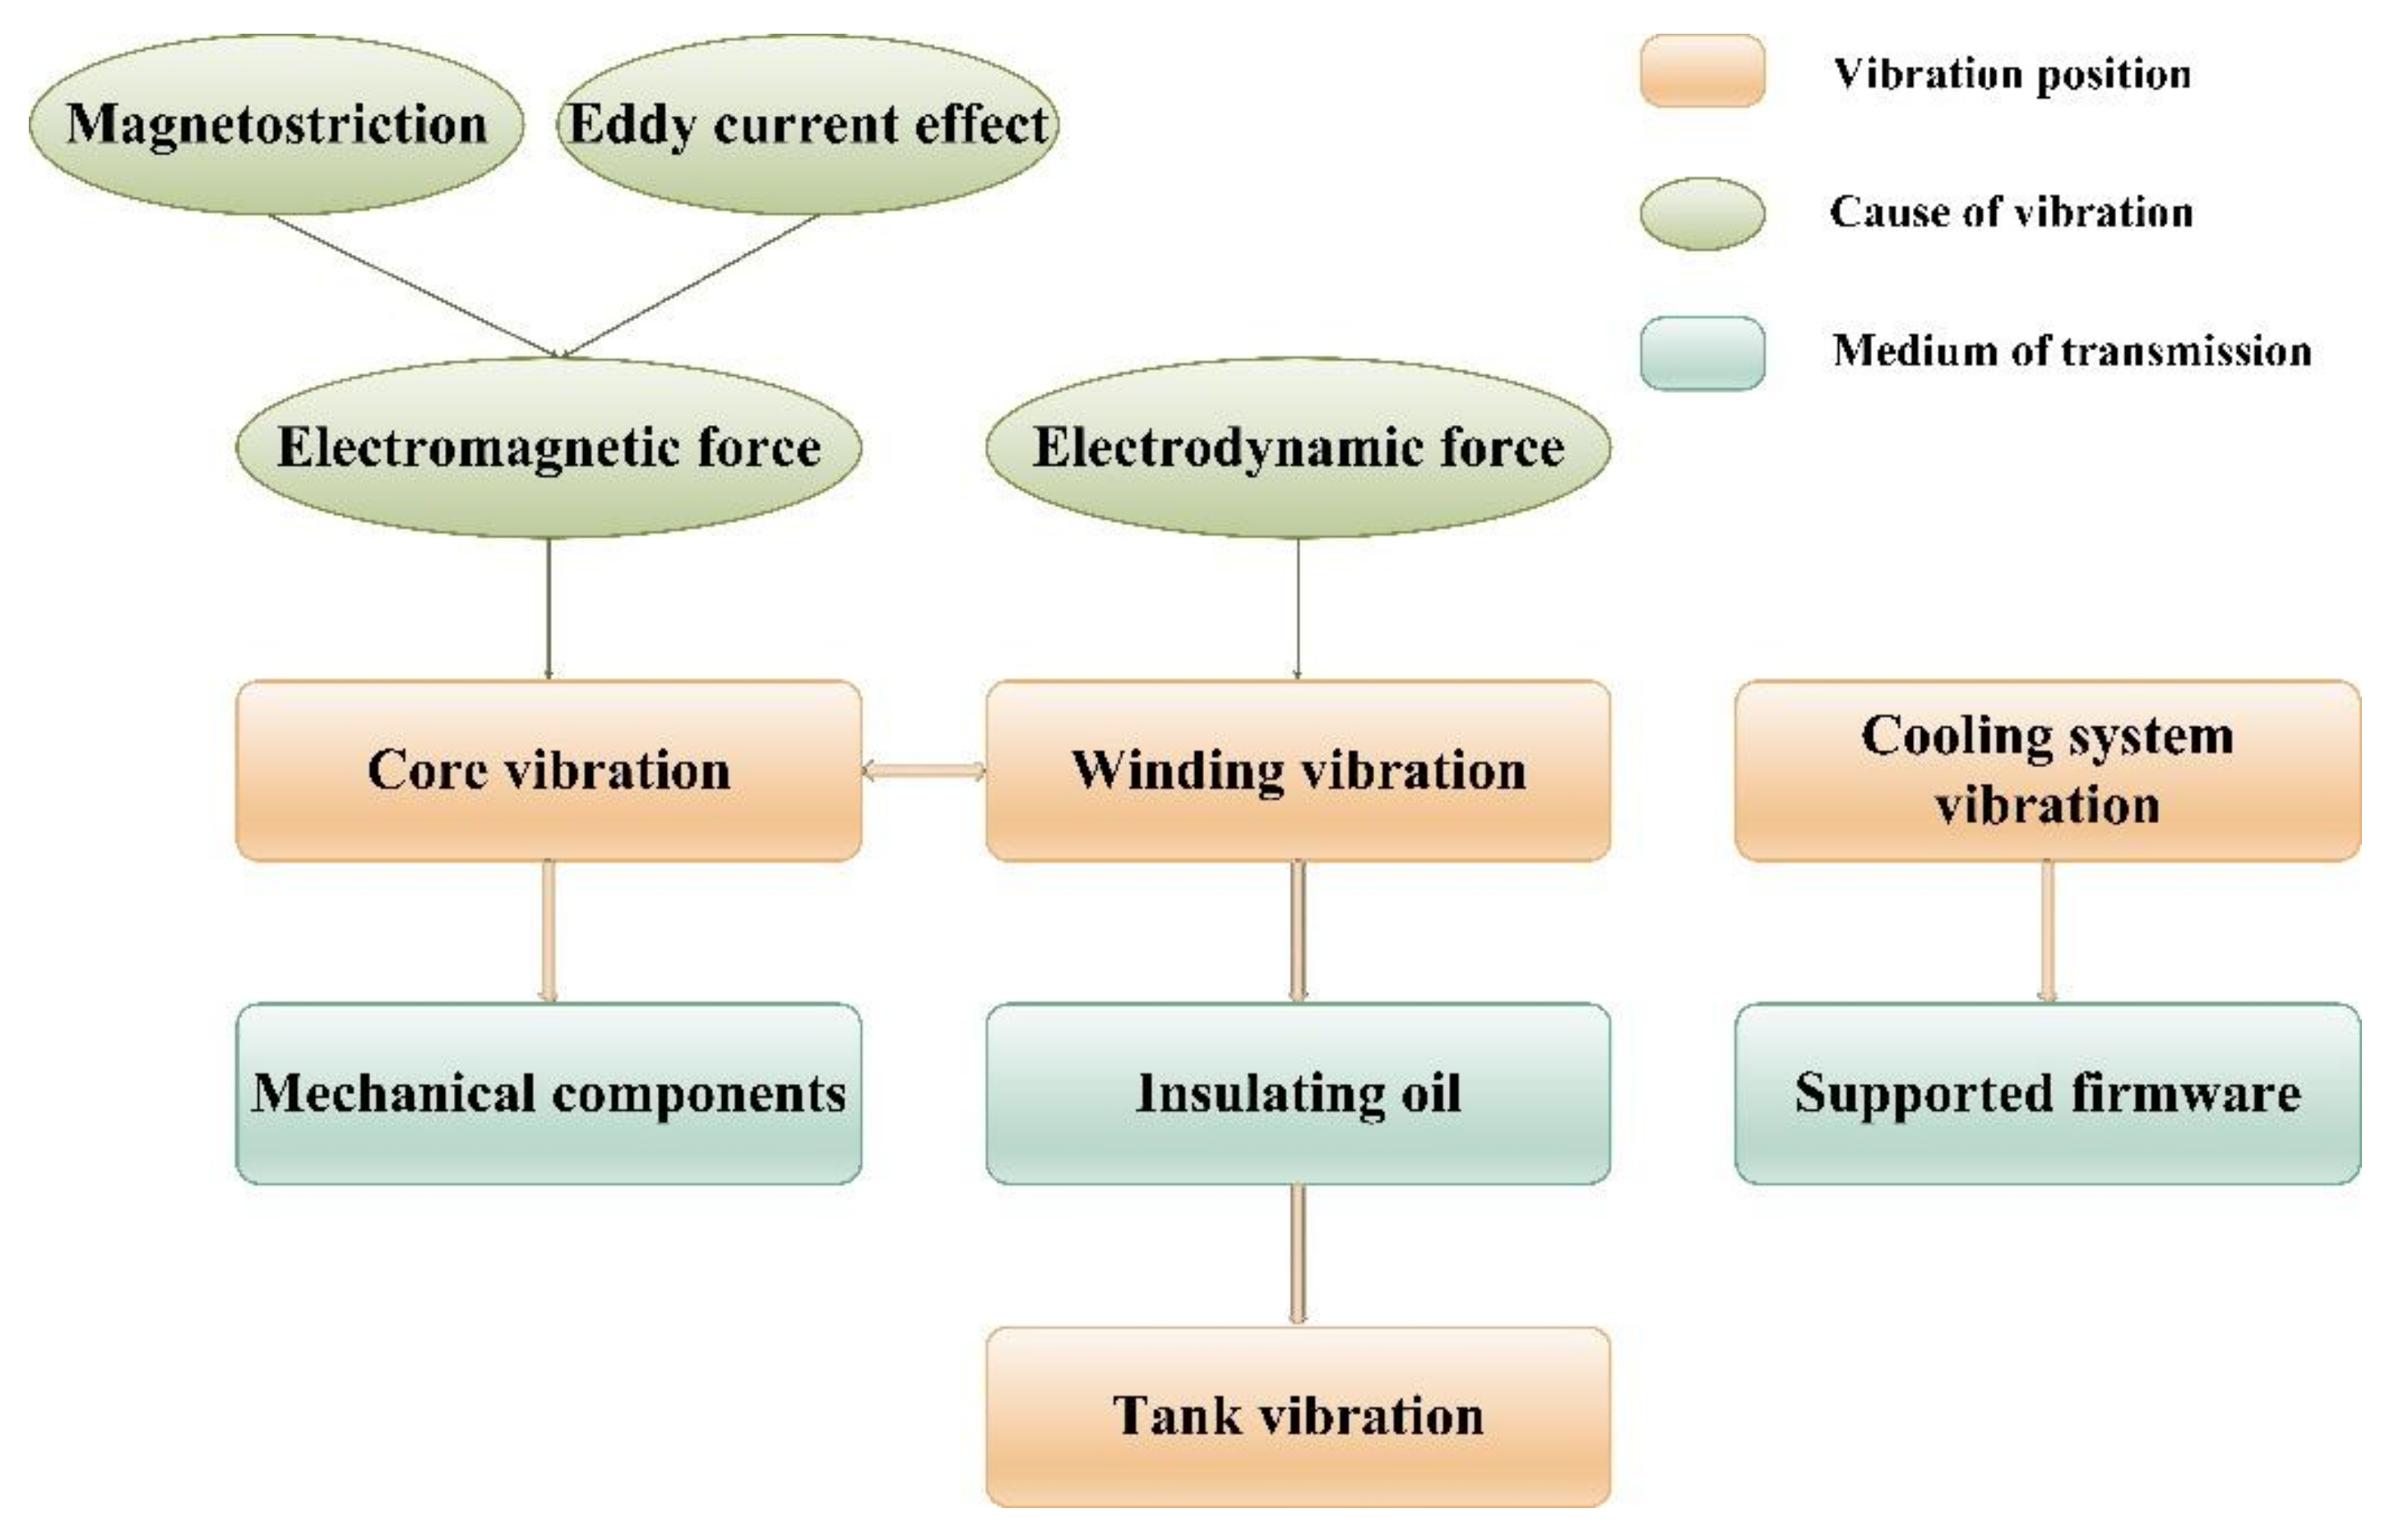
2.1. Vibration Mechanism of Converter Transformers

The vibration of power transformers is usually caused by the vibration of internal mechanical structures such as the winding, core and cooling system [17]. Winding vibration is mainly caused by the electric force generated by the interaction between the current flowing through the winding and the magnetic flux leakage of the winding. While the vibration of the iron core is mainly caused by the magnetostriction of the silicon steel sheet in the core and the electromagnetic force caused by the eddy current effect between the silicon steel sheets under the action of the magnetic line of force. However, since the operation of converter transformers is closely related to the nonlinearity caused by converter commutation, it has different characteristics from power transformers with respect to leakage reactance, insulation, harmonic and DC magnetic bias, leading to converter transformers and power transformers having different vibration characteristics. The winding and the vibration signal of the converter transformer are transmitted to the surface of the oil tank through the insulating oil, and the vibration signals of the iron core are transmitted to the surface of oil tank through the insulating oil and the internal mechanical components. In addition, the vibration signals generated by the cooling system are also transmitted through supporting fasteners. The vibration transmission path of converter transformers is shown in Figure 1.

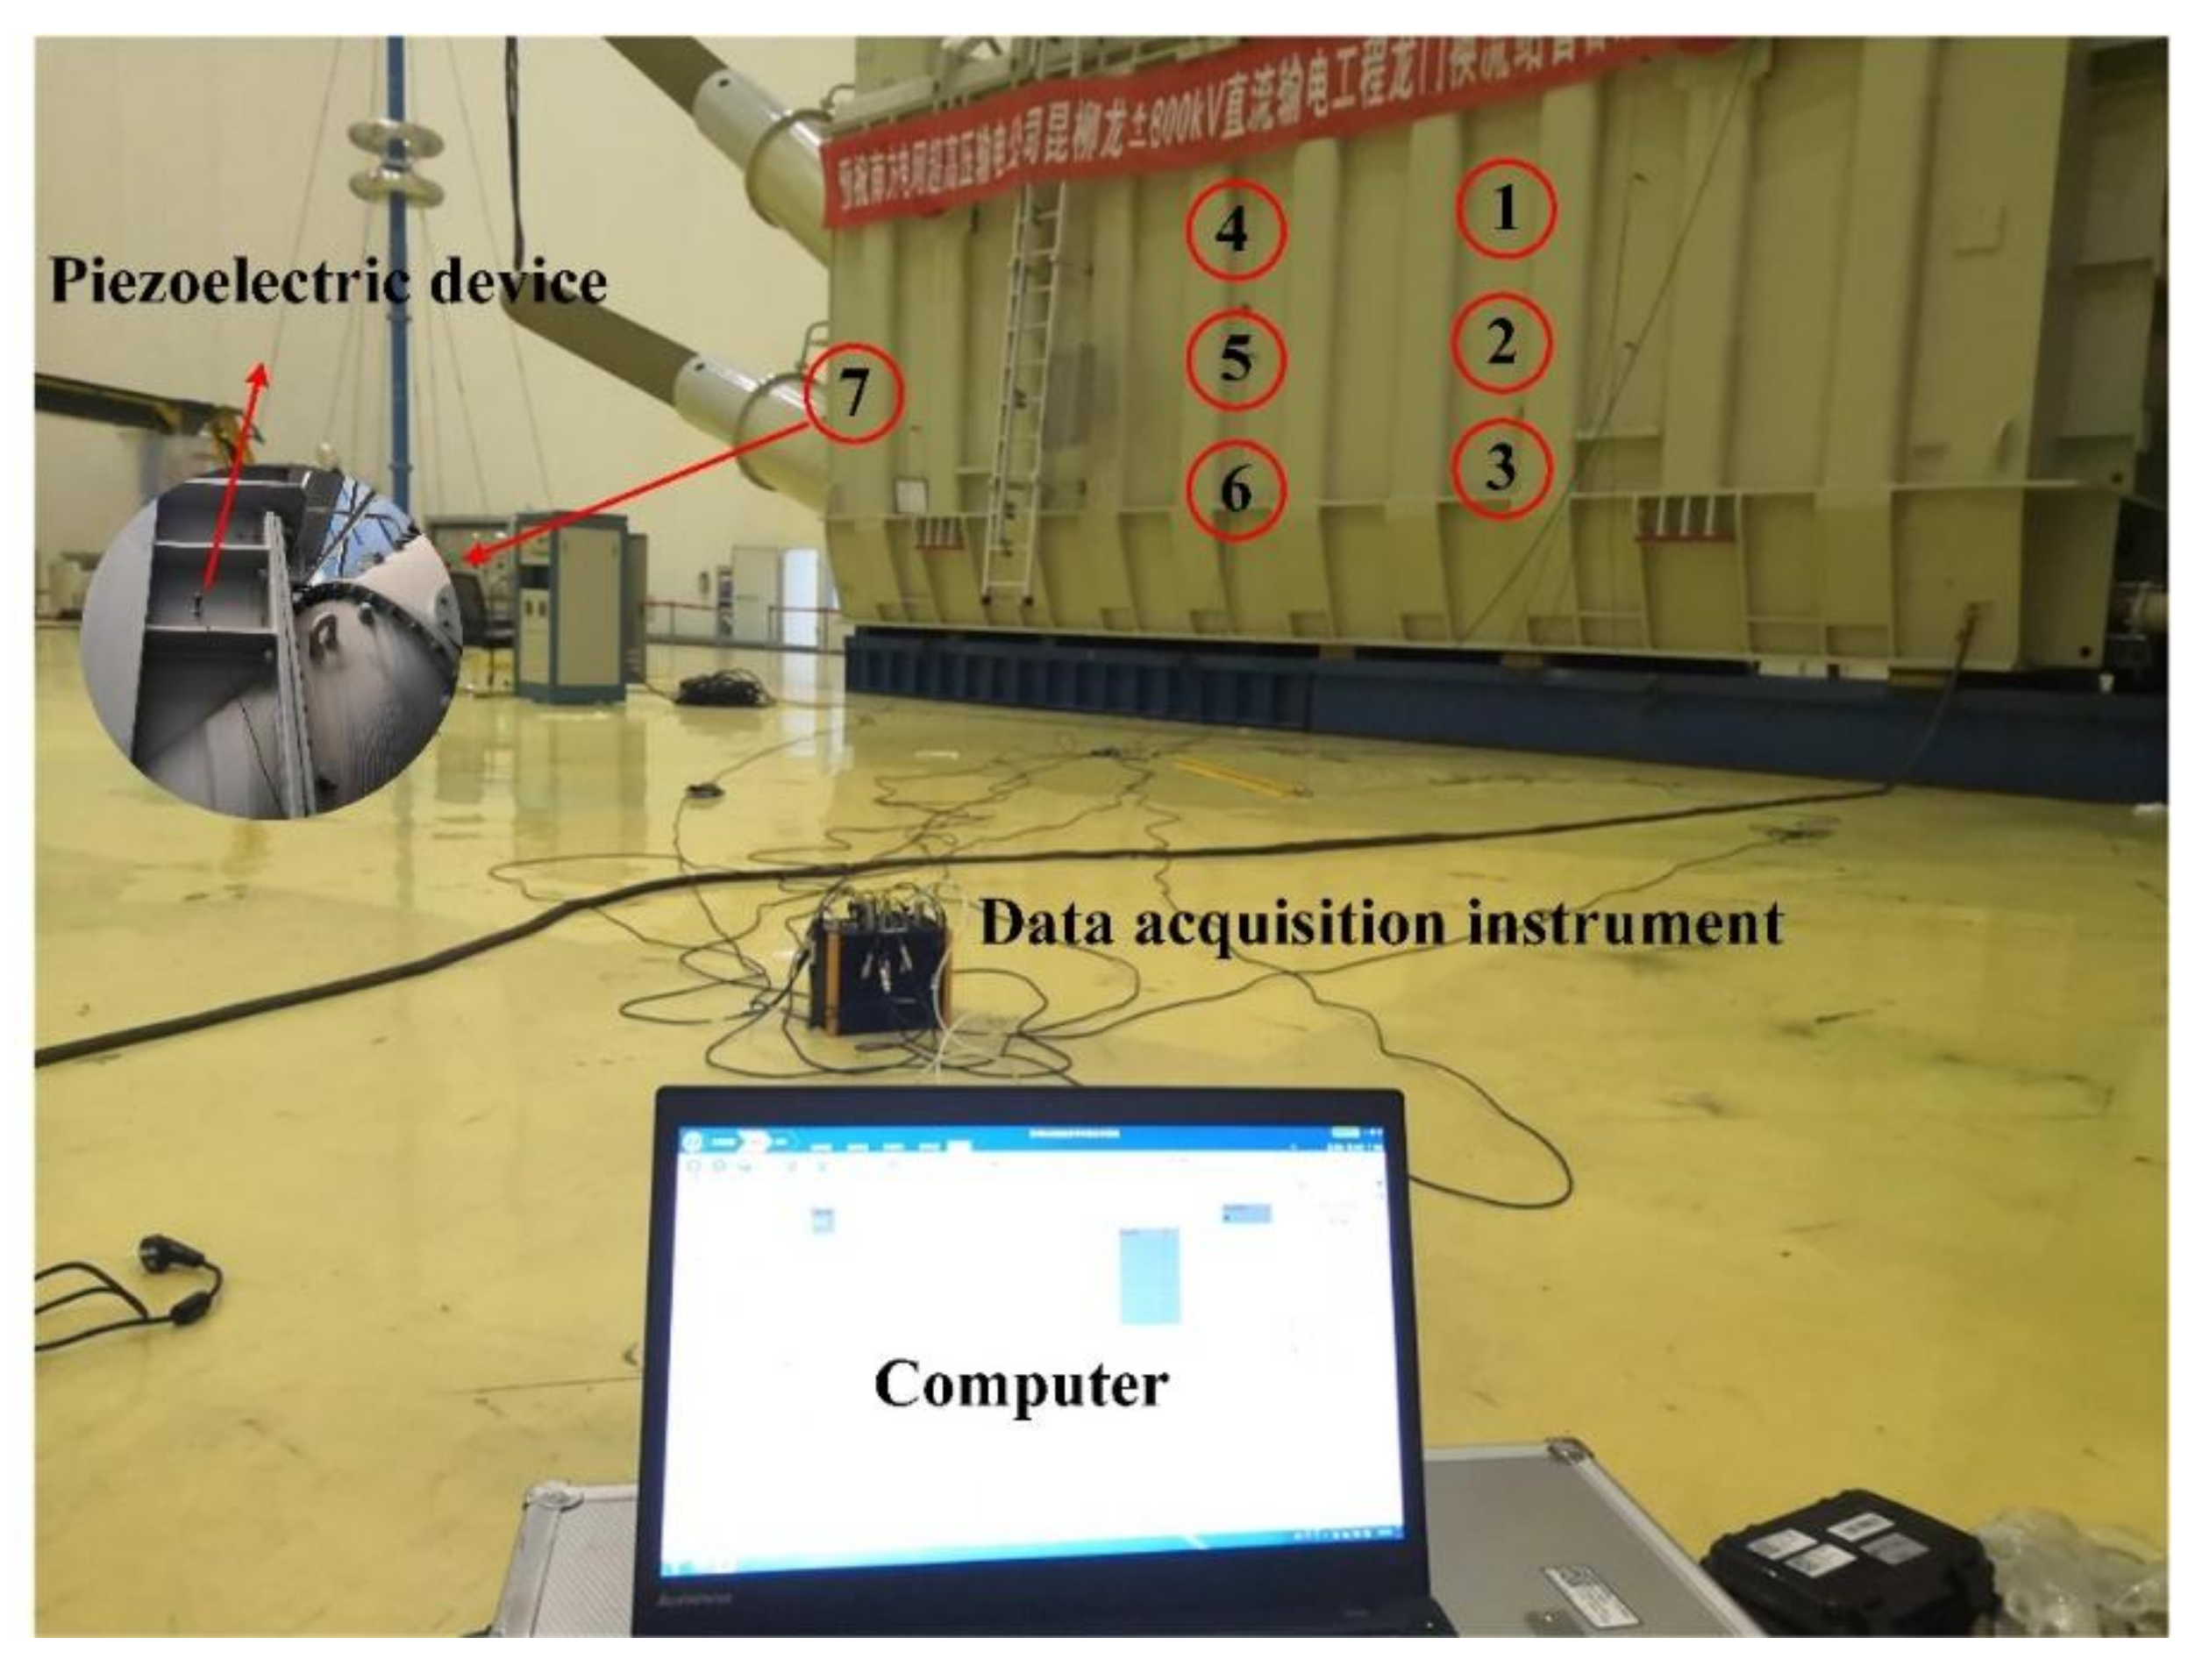
2.2. Signal Measurement of the Converter Transformer

The vibration signals generated by the internal structure of the converter transformer are ultimately transmitted to the tank surface. There are two main vibration detection techniques that have been derived from this. One is the contact detection technique [16], which generally measures the vibration acceleration of the transformer body by placing a piezoelectric acceleration sensor directly on the transformer tank. The other is a non-contact detection technique [47], where the acoustic vibration signal generated by the transformer tank is measured by installing an acoustic sensor close to the transformer. However, the converter transformer is located in a converter station with many sources of noise, resulting in the acoustic vibration signal being very easily mixed with a variety of other noise signals. The mixing of source and noise signals leads the final measurement results to often be unsatisfactory, and the separation of mixed signals is still a challenge [48]. Therefore, this paper uses contact detection technology to measure the vibration acceleration signal of the converter transformer.
The vibration measurement system used in this paper adopts a piezoelectric device with integrated piezoelectric acceleration sensor and piezoelectric actuator to measure the vibration signal on the surface of the transformer tank and then monitor the operation state of the converter transformer. The workflow of vibration measurement system is as follows:
(1)
Several piezoelectric devices are arranged on the measurement tank surface to obtain the vibration signals from the tank surface. The piezoelectric actuator is used to suppress the periodic noise generated by physical contact when the piezoelectric device is affixed to the tank wall, and the piezoelectric vibration sensor is used to output the collected vibration signal.
(2)
Vibration signals are amplified by the integrated circuits inside the sensors, and the output signals from the sensors are transmitted to a high-precision distributed data acquisition instrument through cables;
(3)
Analog signals are converted into digital signals through a digital–analog converter; digital signals are transmitted to a computer through a local area network.
The operating principle of the vibrational measurement system is shown in Figure 2.

2.3. Data Source

The data in this paper were obtained from vibration signals generated by a 500 kV converter transformer in a converter station when it was in the no-load state and the on-load state, respectively. The experimental parameters of the converter transformer are shown in Table 1.
When measuring the vibration signals, the chosen measuring instrument should take into account the surrounding environment of the converter transformer, the measured acceleration range, and the measurement accuracy. Therefore, piezoelectric devices and a DH5902 M data acquisition instrument are used to collect the vibration signals. The working parameters of the piezoelectric device and the data acquisition instrument are shown in Table 2.
According to the existing research, the largest vibration amplitude of the oil tank is located on the smooth surface of the box, while the vibrations of the reinforcement bars and the bottom surface are relatively small, so the measurement position of the vibration signal should be on the surface of the oil tank. A symmetrical measurement position for the box side should be selected at the same time for a comparative analysis [49]. The piezoelectric device layout strategy used in this paper is shown below: a total of six piezoelectric devices are arranged at the positions of 1/3 and 2/3 of the length and 1/4, 1/2 and 3/4 of the height of the box side. Considering the larger area occupied by the valve-side casing and the cooling device on the front and rear surfaces of the box, leading to a small smooth surface area, one piezoelectric device is placed near the valve-side casing according to the specific situation during the actual field test. The piezoelectric device layout of the field experiment is shown in Figure 3.

3. Characteristic Analysis of the Vibration Signal

3.1. Time-Frequency Characteristics of Vibration Signals

The fundamental frequency of the vibration signal generated by the power transformer is double (100 Hz) the power supply frequency (50 Hz). Some of the harmonic signals with integer multiples of 100 Hz are present in the vibration signal, but the fundamental frequency signal of 100 Hz is still dominant [50]. In contrast, the vibration signals of the winding and core of the converter transformer contains more harmonics due to the effect of AC-DC electric field and DC bias magnetism, which leads to the higher spectral complexity of its vibration signals [44,45,46]. For non-periodic and non-smooth vibration signal characteristics, this paper selects the time-frequency analysis method, specifically embodied in the wavelet transform method, to obtain the time-frequency energy spectrum of vibration signals. The signal characteristics are analyzed by describing the time-frequency-energy relationships of the signal and selecting the appropriate eigenvalues.
The wavelet transform is one of the most commonly used time-frequency analysis methods. Since the wavelet transform uses a finite-length decaying wavelet basis, its selected window function is variable, which can ensure good resolution in both the time and frequency domains. Thus, it is suitable for analyzing complex the vibration signal of the converter transformer [51]. Continuous wavelet transform (CWT) is a typical representative of wavelet transform, which introduces scaling factor and translation factor to achieve multi-scale analysis of signals. CWT has the characteristics of multi-resolution analysis, and the local characteristics of signals can be solved through reasonable selection of wavelet basis functions [52,53,54].
The temporal energy spectrum Et of the signal x(t) can be obtained using CWT, which is calculated by
E t = + W x ( a , b ) 2 a 2 da .
W x ( a , b ) denotes the CWT of the signal, a is the stretching factor and b is the translation factor. When the converter transformer vibrates, the vibration signals have an energy distribution in each frequency band. The signal energy distribution can be obtained by integrating the signal along the scale axis. To show the time-frequency characteristics of the vibration signal at the same time, the actual frequency fa of the vibration signal corresponding to the scale factor a is solved by
f a = f c f s / a .
fc is the wavelet center frequency and fs is the sampling frequency. According to Equation (2), Equation (1) can be rewritten as
E f = + W x ( f c f s f a 1 , b ) 2 f c f s d f a .
In this paper, morlet wavelet was selected as the wavelet basis function for wavelet analysis to obtain the time-frequency energy spectrum of vibration signals when the converter transformer is in the no-load state and the on-load state.
Figure 4 shows typical time-frequency energy spectra for the vibration signal of the converter transformer in the no-load state and on-load state. It can be seen that the frequency range of the vibration signals is widely distributed when the converter transformer is in the no-load state, while the majority of the energy is distributed in the frequency band from 0 to 1000 Hz, with heavier distribution in the frequency band from 200 Hz to 400 Hz. In addition, the energy is mainly concentrated at integer frequency multiplications of 100 Hz, such as 200 Hz, 300 Hz, 400 Hz, etc. The rest of the energy is basically evenly distributed in other frequency bands below 800 Hz. When the operating state of the converter transformer changes to the on-load state, the energy distribution of the vibration signals will also change significantly. Most of the energy is still distributed in the 0~1000 Hz frequency band, but the distribution of the energy tends to be concentrated mainly within 100~200 Hz and 300~400 Hz. The energy distribution throughout the rest of the frequency band is less, and the energy is not completely concentrated at 100 Hz integer frequency multiplications.
On the basis of the above analysis, the following conclusions can be drawn: (1) when the converter transformer is in different operating states, the energy of its vibration signals is mainly distributed in the range 0~1000 Hz, so mainly the signal characteristics in this frequency band should be analyzed. (2) The energy of the vibration signals is mostly concentrated on 100 Hz integer frequency multiplications, but this characteristic changes when the operation state of the converter transformer changes, so the amplitude of the signal at 100 Hz can be considered as the characteristic value for distinguishing the converter transformer’s operating state. (3) With 100 Hz as the frequency band bandwidth, it can be seen that there are differences in the energy distribution of the transformer vibration signal in each frequency band under different operating states, so the energy in different frequency bands can be used as the eigenvalues to distinguish different operating states of converter transformers. (3) Using 100 Hz as the bandwidth of the frequency band, it can be seen that there are differences in the energy distribution of the converter transformer vibration signal in each frequency band when the converter transformer is in different operation states, so the energies in different frequency bands can also be used as eigenvalues. (4) With the change of time, the energy of the vibration signals in each frequency band will not be uniformly constant. Thus, the time domain indexes should be considered as eigenvalues due to energy fluctuations. In accordance with the above conclusions with respect to the vibration signal characteristics of the converter transformer, this paper uses the fast Fourier transform to obtain the vibration amplitude of multiples of 100 Hz, wavelet packet decomposition to obtain the energy of the frequency band, and time domain indicators all together to create a vibration feature vector.
In accordance with the above conclusions, this paper uses the fast Fourier transform to obtain the vibration amplitude at 100 Hz integer frequency multiplications from 0 to 800 Hz, using the wavelet packet decomposition algorithm to obtain the energy for each frequency band from 0 to 800 Hz, combined with the time domain indexes to create vibration signal eigenvectors.

3.2. Construction of Eigenvectors

3.2.1. Fast Fourier Transform (FFT)

The frequency spectrum is able to characterize the important features of the signal in the frequency domain, effectively reflecting the frequency components and the distribution of signals. Usually, the spectrum analysis of the signal is mainly performed using the Fourier transform. However, the actual signals are mostly in discrete form, and the traditional continuous Fourier transform and the inverse transform cannot be used directly in the calculation, making it necessary to analyze the discrete signal with the discrete form of the Fourier transform, which is also known as the Discrete Fourier Transform (DFT). The calculation equation of DFT is
X ( n N Δ t ) = k = 0 N 1 x ( k Δ t ) e j 2 π k / N .
x ( k Δ t ) is the sampled value of the signal, N is the number of points in the signal sequence. Δ t is the sampling interval. n is the number of discrete values in the frequency domain, n = 0 , 1 , 2 , , N 1 . k is the number of discrete values in the time domain, k = 0 , 1 , 2 , , N 1 .
However, the time complexity of DFT is o ( N 2 ) ; when the sequence length N increases, the computation of DFT will grow by N2. Therefore, when dealing with long sequences of signals, the application of DFT is limited due to its high computational workload and long computation time. The basic idea of FFT is to split the signal sequence {x(k)} of positive integer powers of length 2 into several shorter sequences and then perform DFT computation, thus replacing the DFT computation of the original sequence, and finally combining several short DFT sequences to form the whole sequence. The computation flow is as follows. The Fast Fourier Transform (FFT) can reduce the time complexity of the DFT by special calculation. The basic idea of FFT is to split the signal sequence {x(k)} into several shorter sequences, the lengths of which are positive integer powers of 2, and then perform the DFT calculation. The above calculation process replaces the DFT calculation of the original sequence, and finally, several DFT short sequences are combined to form the whole sequence. The calculation process of FFT is
X ( n ) = k = 0 N / 2 1 x ( 2 k ) W N 2 nk + x ( 2 k + 1 ) W N ( 2 k + 1 ) n .
FFT was used to analyze the frequency spectrums of the vibration signals of converter transformers in no-load and on-load operation states.
As shown in Figure 5, when the converter transformer is in no-load operation state, the frequency distribution of vibration signals is mainly in the range of 0~400 Hz, and basically concentrated at frequencies around the 100 Hz integer frequency multiplication. Meanwhile, there is still an existing frequency component in the range of 400~800 Hz, but basically no frequency component above 800 Hz. When the converter transformer is in the on-load operation state, the amplitude at the 100 Hz integer frequency multiplication is significantly increased, and its frequency distribution is more concentrated in the range of 0~400 Hz compared with the no-load operation state, with basically no frequency component above 400 Hz. In addition, a harmonic component near the 50 Hz odd frequency multiplication also appears in the vibration signals. It has been suggested that the effect of the AC/DC electric field and DC bias magnetism result in the change of vibration characteristics of the internal structure in the converter transformer during operation. The results indicate that when the converter transformer is in different operating states, the amplitude around the 100 Hz integer frequency multiplication of the spectrum is obviously different. The frequency distribution in the range of 0~800 Hz also shows significant differences, so the amplitude around the 100 Hz integer frequency multiplication of the spectrum in the range of 0~800 Hz can be considered as the eigenvalue.
The amplitude A of the frequency spectrum of the vibration signal after FFT is
A = 2 X ( n ) N .
Then the eigenvector of the frequency spectrum of vibration signals can be obtained as
A p = [ A 100 p , A 200 p , , A 800 p ] .
A p is the eigenvector consisting of the amplitudes of 100 Hz integer frequency multiplication of the frequency spectrum, p is the serial number of the operation state. Since the harmonics are affected by various factors, the single frequency distribution of the frequency spectrum measured at different measurement points is not stable, so the amplitude of the harmonic components near the 50 Hz integer frequency multiplication is not considered to be the eigenvalue. However, in order to effectively distinguish the operating state of converter transformers, the harmonics can be considered from a single frequency point to the whole frequency band in order to offset the instability of its distribution. Hence, the wavelet packet decomposition algorithm is introduced to use the frequency band energy of the signal as the eigenvalue in the next section.

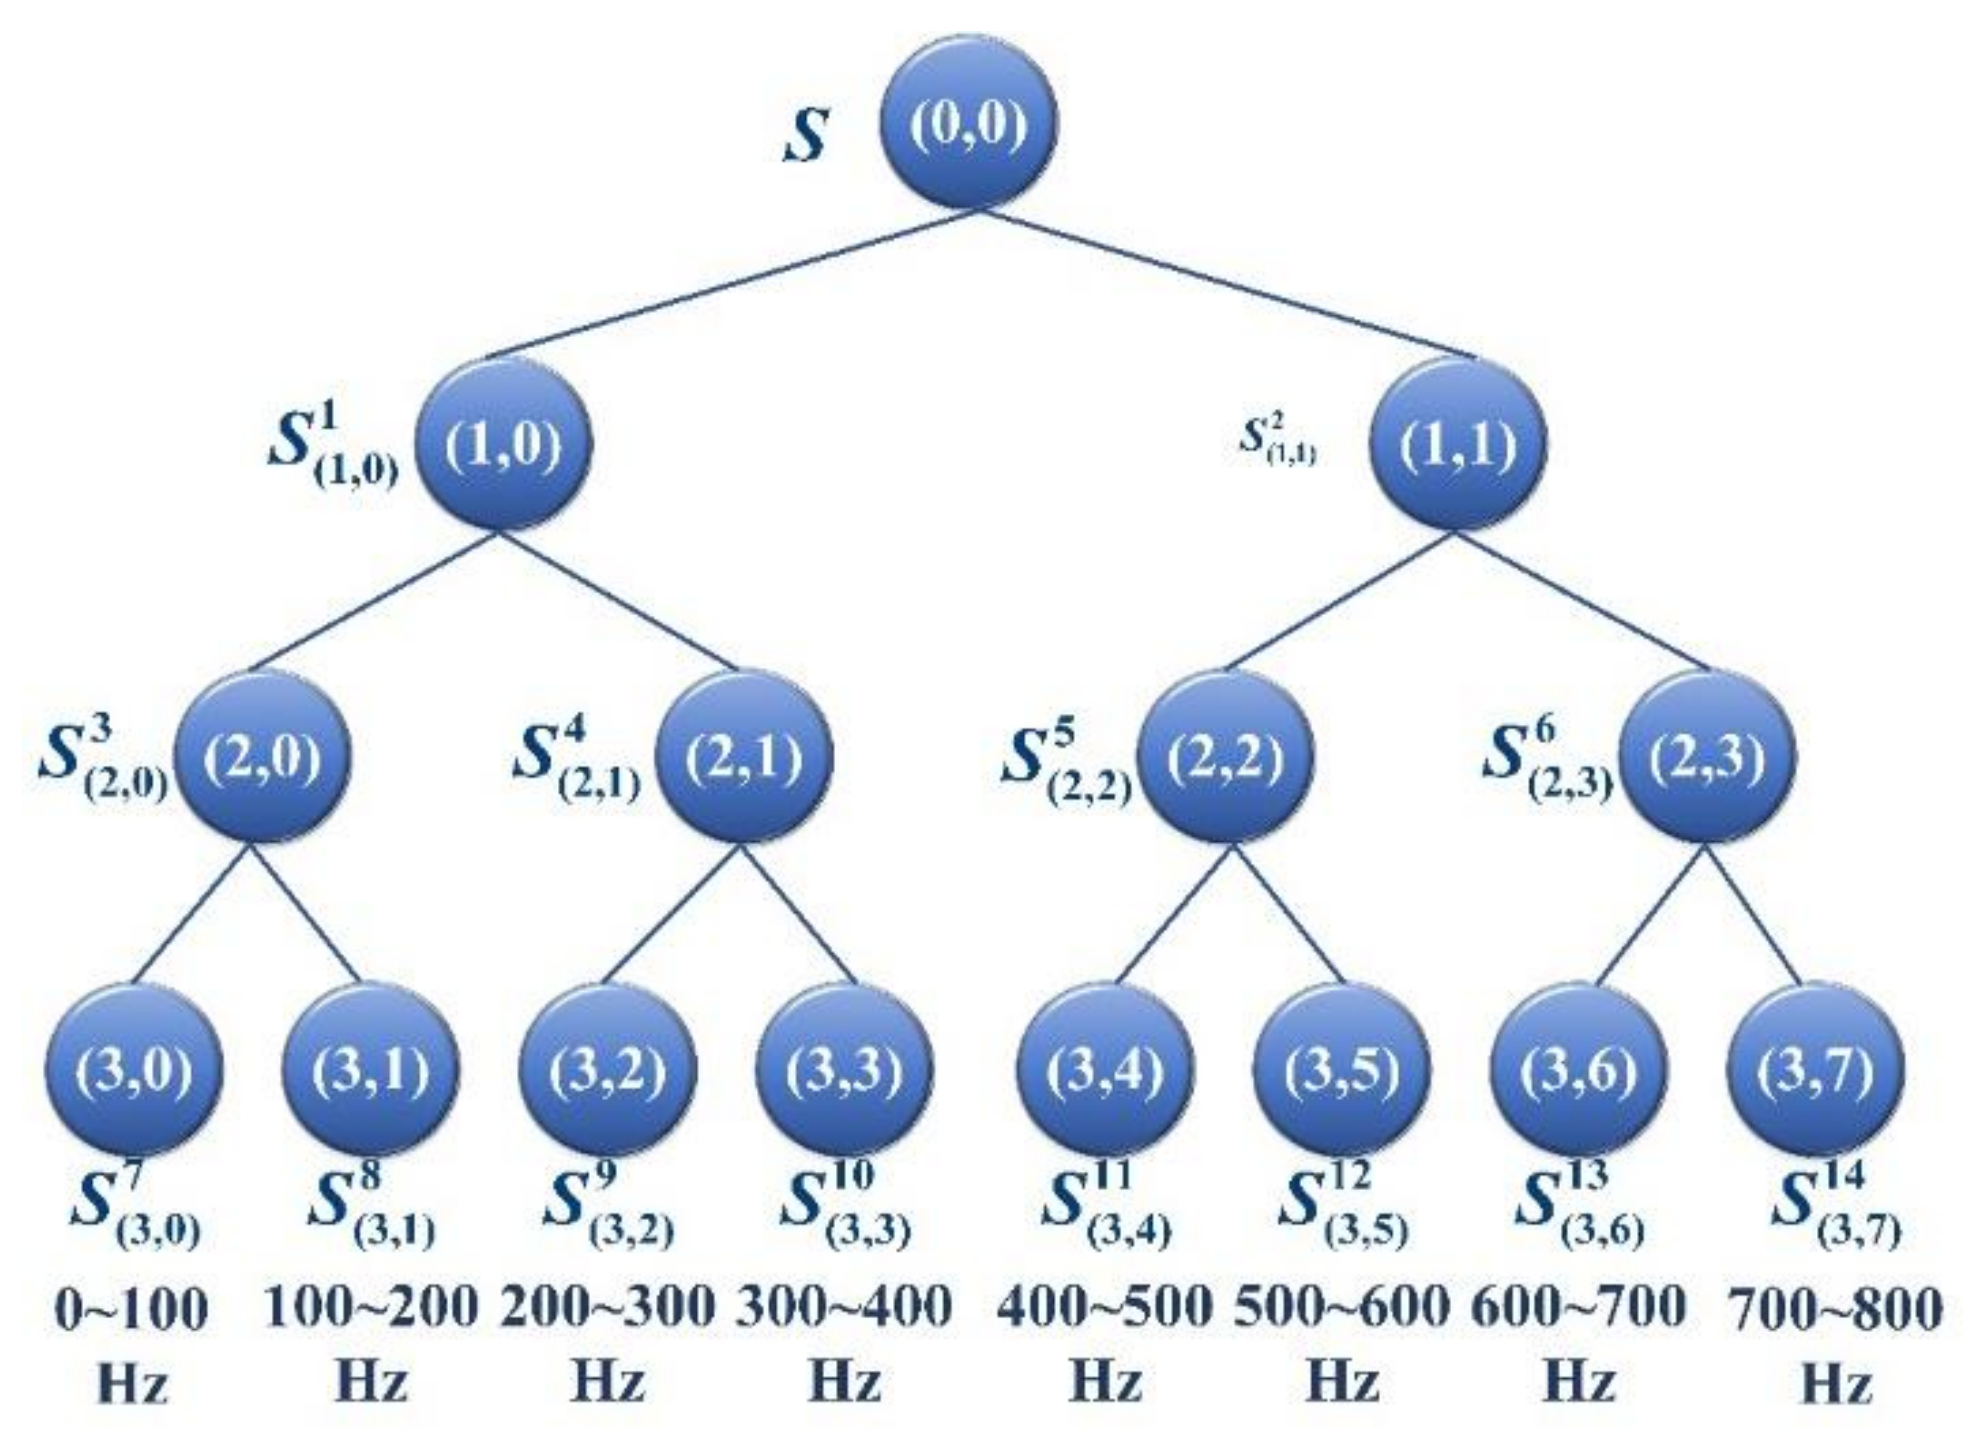
3.2.2. Wavelet Packet Decomposition (WPD)

Wavelet Packet Decomposition (WPD) evolved from wavelet transform. WPD can realize the decomposition of both low-frequency and high-frequency components of the signal, and extract the features of the more detailed frequency band of the detected signal, effectively improving the time-frequency resolution and making up for the shortage of wavelet analysis that cannot subdivide high-frequency components. According to the above analysis, the energy distribution of the frequency spectrum of the vibration signal shows significant differences in the range of 0~800 Hz, so the energy of each node obtained by WPD can be used as an eigenvector. To ensure the balance of time-frequency resolution, a reasonable number of decomposition layers should be determined. Since the number of wavelet packets is 2i by using i-layer wavelet decomposition, the frequency band of 0~800 Hz in the spectrum can be divided into eight frequency bands with a bandwidth of 100 Hz and eight wavelet packets in total, so the number of layers should be three. The schematic diagram of three-layer WPD is shown in Figure 6.
However, since the sampling frequency of the vibration signal in this paper is 20 kHz, according to Nyquist theorem, the frequency bandwidth of the original vibration signal is 20,000/2 × 23 = 1250 Hz if directly using three-layer WPD. Therefore, in order to obtain the energy of eight frequency bands with 100 Hz bandwidth in the range of 0~800 Hz, the original signal should be pre-processed by down sampling. Down sampling means that the sampling rate is reduced by λ (a natural number) times, while the reduced sampling rate will still satisfying the sampling theorem. The original vibration signal x ( t ) of the converter transformer is sampled at the sampling frequency f s = 20   k H z to obtain the time series x ( h ) . After down sampling the series S ( τ ) , the down sampling equation is
S ( τ ) = ω ( λ τ ) = h = + x ( h ) L ( λ τ h ) .
where, L ( λ τ ) = [ sin c ( λ τ h ) / λ ] . The principle of down sampling is to first pass the acquired signal input through a low-pass filter with a cut-off frequency of 1 / λ , and then acquire one point from each of the λ sample points. To reduce the sampling frequency from 20 kHz to 1600 Hz for the vibration signal, the cut-off frequency should be set to 0.08.
For the time series S ( τ ) obtained by down sampling, S i , j l ( τ ) is defined as the j-th node in the i-th layer of the decomposition tree, and l is the number of the decomposed node, where i = 0, 1, 2, 3, l = 1, 2, …, 15. The WPD is used for feature extraction of the vibration signal, and the frequency band energy is used as the eigenvalue. The specific implementation process is as follows:
The three-layer WPD is performed on the vibration signals of the converter transformer to extract the signal features of each frequency band in the third layer. Then, the energy eigenvectors are solved for each frequency band. E ij is defined as the energy of the coefficient sequence S i , j l ( τ ) of WPD at the j-th node of the i-th layer. Its calculation equation is
E i , j = S i , j l ( τ ) d t = r = 1 R d j , r 2 .
d j , r ( j = 0 , 1 , 2 , , 7 ; r = 1 , 2 , , R ) is the wavelet packet coefficient of the node S i , j l , then the obtained energy eigenvector is
E p = E 0 p , E 1 p , , E 7 p .
E p represents the eigenvector of the energy composition of the frequency band of each node in the third layer after WPD of the vibration signal.

3.2.3. Time Domain Indexes (TDI)

FFT and WPD can effectively extract the features of the vibration signal of the converter transformer. However, it is inevitable that extracted features will lose some information of the original signal when the time-frequency analysis method is applied to signal analysis. To ensure that the eigenvector retains as much information as possible about the original signal, multiple time domain indicators are introduced for the construction of the eigenvector.
① Peak factor C f . The peak factor is the ratio of the peak value X P to the root mean square (RMS) X RMS of the signal, which is a statistical index used to detect the presence of shocks in the signal. Its calculation equation is
C f = X p X R M S .
② Pulse factor I p . The pulse factor is the ratio of the peak value X p to the rectified average value (the average of the absolute values) X ¯ of the signal. The difference between the pulse factor and the peak factor is in the denominator. The pulse factor is greater than the peak factor because the rectified average value is less than the RMS value for the same set of data. The pulse factor is also used to detect the presence of shocks in the signal. Its calculation equation is
I p = X p X ¯ .
③ Margin factor C e . Margin factor is the ratio of the peak value X p to square root amplitude X R of the signal. The calculation equation is as follows:
C e = X p X R .
④ Kurtosis factor K 4 . Kurtosis factor is an expression of the degree of waveform smoothing and is used to describe the distribution of variables. It is defined as the ratio of the 3rd order central moment E [ ( X μ ) 4 ] to the 3rd power of the standard deviation σ , where μ is the mean value of the signal. Its calculation equation is
K 4 = E [ ( X μ ) 4 ] σ 4 .
⑤ Waveform factor S f . The waveform factor is the ratio of the RMS value to the rectified average value. Its calculation equation is
S f = X R M S X ¯ .
⑥ Skewness factor K 3 . The skewness factor is the ratio of the 3rd order central moment E [ ( X μ ) 3 ] to the 3rd power of the standard deviation σ . Its calculation equation is
K 3 = E [ ( X μ ) 3 ] σ 3 .
Then the eigenvector composed of time-domain indexes can be defined as
T p = [ C f , I p , C e , K 4 , S f , K 3 ] .  
where T P is the eigenvector consisting of the time domain indexes of vibration signals of the converter transformer in operation state p.
In this section, based on the previous analysis of the vibration characteristics of the converter transformer, FFT and WPD are used to obtain vibration amplitude eigenvector and frequency band energy eigenvector, respectively. Then, to solve the problem of information loss, the time-domain indexes are introduced to form the time-domain eigenvector. The above three eigenvectors are stitched together to obtain the input eigenvector of the classification model, which is used for the state identification of the converter transformer. The input eigenvector (fused eigenvector) can be expressed as
V P = [ A P E P T P ] .
V p represents the input eigenvector of the vibration signal of the converter transformer in operation state p for classification, which contains a total of 22 eigenvalues.

4. Deep Belief Network Optimization Algorithm

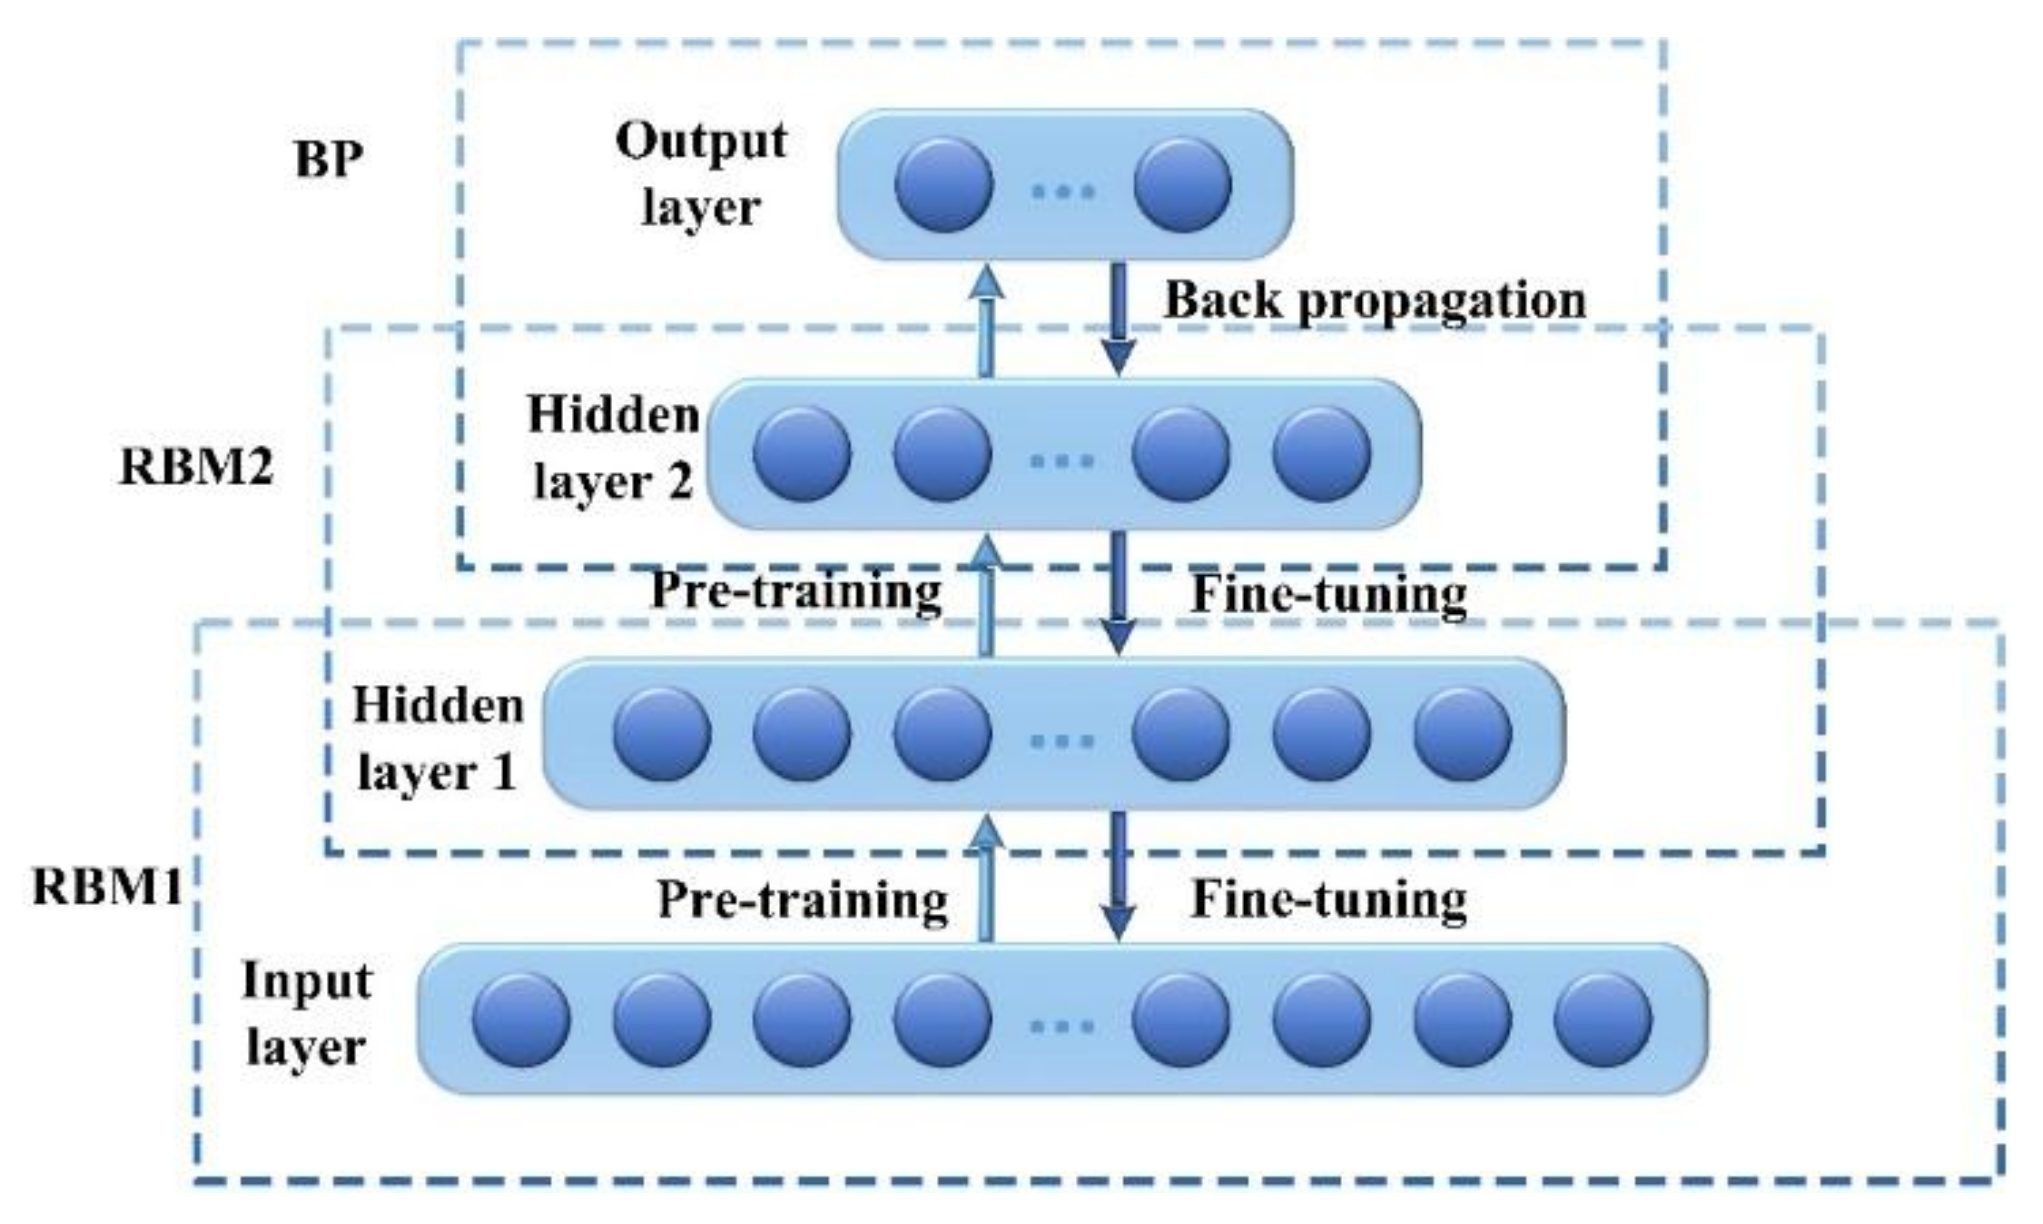
4.1. Deep Belief Network (DBN)

Deep belief network (DBN) is a more widely used deep learning algorithm, and is a probabilistic graphical model that can effectively learn complex dependencies between variables. DBN is composed of multiple layers of unsupervised Restricted Boltzmann Machine (RBM) and one layer of supervised BP neural network. By using stacked RBMs, a hierarchically processed DBN can be obtained to establish the mapping relationship between sample data and data labels, and then obtain the joint distribution function between them. The network undergoes several iterations to make the connection weights between the neurons in the network converge, thus reconstructing the original data with maximum probability, learning the internal features of the data, and finally completing the classification based on the internal features of the data [55]. Considering that the DBN has excellent training performance and classification effect, it is used as the base model for the operation state identification of converter transformers in this paper.

4.1.1. Restricted Boltzmann Machine (RBM)

The Restricted Boltzmann Machine (RBM) is an energy-based model in which the training process of the model actually optimizes the energy, where the neurons of each layer of the network are usually represented by 0 (not activated) and 1 (activated). the energy function E ( v , h ; Ω ) of the RBM is defined as
E ( v , h ; Ω ) = χ = 1 N ν a χ v χ γ = 1 N h b γ h γ χ = 1 N v γ = 1 N h h γ w χ γ v χ .
Ω = { w χ γ , a χ , b γ , 1 χ N v , 1 γ N h } denotes the network parameters, N v is the number of neurons in the visible layer, N h is the number of neurons in the hidden layer. w χ γ denotes the weight between the χ -th neuron in the visual layer and the γ -th neuron in the hidden layer. a χ denotes the bias of the χ -th neuron in the visual layer, b γ denotes the bias of the γ -th neuron in the visual layer.
To improve the training efficiency of RBM, the contrastive divergence (CD) algorithm [56] is used to train the RBM network. A training sample is selected as the initial value of the visual layer vector, and then Gibbs sampling is performed alternately on the visual and hidden layer vectors, which only requires ρ steps without waiting for convergence. Considering that a good training effect can be achieved when ρ = 1, this paper sets ρ = 1 when training RBM.

4.1.2. Network Structure

DBN is a deep probabilistic directed graph whose structure internally contains an input layer (visual layer), multiple hidden layers and an output layer. It can be considered as multiple RBMs stacked bottom-up, thus achieving layer-by-layer greedy learning. The hidden layer of the first z layers RBMs can be considered as the visible layer of the z + 1-th layers RBMs, and each RBM is trained supervised using a layer-by-layer pre-training method. Assuming that the RBMs of the first z − 1 layers have been trained, the bottom-up conditional probability of the hidden layer variables can be calculated as
P ( h z | h z 1 ) = sigmoid ( b z + w z h z 1 ) .
b z denotes the bias of the RBM at the z-th layer and w z denotes the connection weight between RBMs. Then a set of samples containing M variables h z 1 is generated in the order of v = h 0 h 1 h z 1 , which is denoted as h ^ z 1 = { h ^ z , 1 , h ^ z , 2 , , h ^ z , M } . RBM is formed by h z 1 and h z , and h ^ z 1 is used as the training set to fully train the RBM at the z-th layer. In the layer-by-layer pre-training process, the weights and thresholds in the RBM are continuously updated, so that DBN can realize the layer-by-layer feature extraction of the signal to obtain the essential features of the signal.
Since this paper needs to classify the signal, after pre-training layer by layer, the DBN needs to be fine-tuned as a discriminative model. The process of fine-tuning is [57]: the BP algorithm is used in the output layer of the top layer of DBN to reverse-tune the network weights, and the BP neural network is used as a classifier to achieve the final signal classification. Given that the network weights obtained by pre-training are closer to the optimal weights than random weights in the weight space, the BP algorithm effectively avoids the disadvantages of easily falling into local optimum and long training time due to random initialization of weight parameters, which effectively accelerates the model convergence speed and improves the model performance. In this paper, a DBN with two-layer RBM is used as the basic classification model, and its basic structure is shown in Figure 7.
DBN performance is very sensitive to the initial parameter settings. The initial parameter settings can seriously affect the network learning time, feature extraction capability and classification accuracy. However, when applied to the state identification of power equipment, the network parameters are basically obtained by empirical knowledge or through experiments, resulting in its limited use. Therefore, there is an urgent need for a method that can adaptively select DBN parameters to better achieve adaptive classification.

4.2. Sparrow Search Algorithm (SSA)

4.2.1. Principle of the Algorithm

The sparrow search algorithm (SSA) is a swarm intelligence optimization algorithm, which is derived from the living characteristics of the sparrow population. According to the characteristics of the sparrow population, the mathematical model of the sparrow search algorithm can be set, and the rules of the model are first set as follows [58].
① Sparrow populations usually consist of producers and scroungers. Producers are responsible for searching foraging areas and directions for the whole population, while scroungers follow the producer to obtain food. The status between producer and scrounger can be freely switched, but the sum of their proportions in the population remains constant.
② The foraging behavior of sparrow populations is related to energy reserves, which are usually higher in producers and lower in scroungers. The size of energy reserves is related to the fitness value of individuals in the population. The energy reserve of a producer is proportional to its foraging position. This means that when the energy reserve of an accession is below a certain value, the producer is more likely to forage elsewhere in order to obtain more energy.
③ Throughout the foraging process of the population, scroungers always search for the producer who finds the best food and then get food from it or forage around the producer. Meanwhile, some scroungers will monitor producers for a long time always be ready to compete for food in order to improve the success of their own predation.
④ When an individual in a sparrow population finds a predator, it will send an alarm signal by chirping. Sparrows at the periphery of the population will move quickly to a safe area to gain a better position, while sparrows in the center will wander randomly and tend to approach other individuals. When the alarm value exceeds the safety threshold, producers will lead the scroungers to other safe areas to feed.

4.2.2. Mathematical Model of the Algorithm

According to the above rules, the mathematical model of the algorithm can be designed to simulate the foraging behavior of the sparrow population, and a population with s sparrows can be expressed as
θ = θ 1 , 1 θ 1 , 2 θ 1 , δ θ 2 , 1 θ 2 , 2 θ 2 , δ θ s , 1 θ s , 2 θ s , δ .
δ denotes the dimensionality of the variables of the problem to be optimized. The vector of fitness values of sparrows in the population can be expressed as
F ( θ ) = f v ( [ θ 1 , 1 θ 1 , 2 L θ 1 , δ ] ) f v ( [ θ 2 , 1 θ 2 , 2 L θ 2 , δ ] ) f v ( [ θ s , 1 θ s , 2 L θ s , δ ] ) .
where f v denotes the fitness value. In the process of searching for food, the producer has a larger foraging search range compared to the scrounger, so that the producer with a better fitness value will find the food first. According to rules ① and ④, the position of the producer will be updated at each iteration as
θ ι , φ υ + 1 = θ ι , φ υ × exp ( ι ξ × C i t e r a t i o n _ m a x ) , Λ < C J θ ι , φ υ + Q I , Λ C J .
where υ denotes the number of iterations, C iteration _ max denotes the maximum number of iterations, which is a constant. θ ι , φ is the position of the ι -th sparrow of population in the φ -th dimension, ι = 1 , 2 , , s and φ = 1 , 2 , , δ . ξ is a random number distributed in the range (0,1]. Λ [0,1] is the alarm value and C J [ 0.5 , 1 ] is the safety value. Q is a random number that follows a normal distribution, and I is a 1 × δ unit vector with all elements of the vector being 1.
According to rules ② and ③, the updated position of the scrounger is
θ ι , φ υ + 1 = Q e x p ( θ w o r s t θ ι , φ υ ι 2 ) , ι > s 2 θ p υ + 1 + θ ι , φ υ θ p υ + 1 Γ + I , o t h e r w i s e .
where θ P denotes the optimal position of the producer and θ worst denotes the current global worst position. Γ is a 1 × δ vector with elements randomly assigned to values of 1 or −1, Γ + = Γ T ( Γ Γ T ) 1 . When ι > s/2, the first scrounger with lower fitness value does not get food and has lower energy reserve; thus, it will go to other places to forage for food.
When a predator appears, the sparrows that give alarm signals usually account for 10–20% of the entire population, and their initial position is generated randomly. According to rule ④, the behavior of individuals in the population at this time can be expressed as
θ ι , φ υ + 1 = θ best υ + β × θ ι , φ υ θ best υ , if f v ( θ ι , φ υ ) > f v _ best θ ι , φ υ + ζ × θ ι , φ υ θ worst υ ( f v _ best f v _ worst ) + ε , if f v ( θ ι , φ υ ) = f v _ best .
where θ best υ denotes the current global optimal position. β denotes the step control parameter, which is a random number that follows a normal distribution with mean 0 and variance 1. ζ [ 1 , 1 ] is a random number indicating the moving direction of individuals in the population. f v ( θ ι , φ υ ) is the fitness value of the current individual sparrow. f v _ best and f v _ worst are the current global optimal and the worst fitness value, respectively. When f v ( θ ι , φ υ ) > f v _ best , the current individual is located at the periphery of the population where it is vulnerable to attack. When f v ( θ ι , φ υ ) = f v _ best , it indicates that the individual at the center of the population is aware of the danger and starts to move closer to other individuals. ε is the smallest constant, which is set to prevent a zero value in the denominator.

4.2.3. Optimization Process of DBN

Because of its better robustness, SSA can be applied to optimize complex structures such as neural networks to effectively avoid the inefficiency of manual tuning. SSA can effectively achieve global optimization without the influence of initial parameters selection, so this paper uses the sparrow search algorithm to optimize the network parameters of DBN. The DBN used in this paper contains two hidden layers, and the loss function of the network is set as cross entropy, which is calculated as
Loss = y l o g y ^ + ( 1 y ) l o g ( 1 y ^ ) .
where y denotes the actual label of the sample and y ^ denotes the predicted label of the sample. The network optimization process specifically applied to the classify vibration signals of the converter transformer is shown in Figure 8.
The specific steps of the sparrow search algorithm to optimize DBN are as follows:
Step 1: The measured vibration signal samples are uniformly extracted and normalized by using the method in Section 2. The dimensionality of the eigenvector is 22.
Step 2: The eigenvector samples are divided into training set and test set.
Step 3: Initializing the DBN network parameters.
Step 4: Initializing the population parameters, setting the number of producers in the population and the percentage of individuals who find danger.
Step 5: Calculating the fitness value of the initial population and ranking it to select the current best and worst values.
Step 6: Updating the positions of producers, scroungers and alarm sparrows to find the current global optimal position.
Step 7: If the current optimal position is better than that of the previous iteration, performing the update operation, otherwise do not performing the update operation, and continue the iteration operation.
Step 8: If the loss of the training sample meets the discriminant condition or the number of iterations reaches the upper limit, the optimization ends, and the global optimal value and the best fitness value are obtained. The optimal parameters of the network are output. Otherwise, return to Step 5 and repeat Step 6 and Step 7 until the discriminant condition is met.
Step 9: The DBN parameters are updated and fine-tuned in reverse using the BP algorithm.
Step 10: The number of neurons in the output layer is determined according to the division of the operation state, and the data set is input the optimized DBN to output the classification results.

5. Experimental Verification

To verify the effectiveness of the algorithm proposed in this paper, the operating status of the converter transformer is identified using the algorithm in this paper and compared with other algorithms. Three experiments are designed in this paper, firstly, the no-load state and on-load state of the converter transformer are identified separately. Then the sampled measurement point signals of the two states are mixed and identified to verify the generalization of the algorithm. The experimental environment is configured with a computer with 64-bit Intel i5-7400, 3.0 GHz main frequency, and 16.0 GB of memory; the computational software is Matlab 2018b.

5.1. Experiment in the No-Load State

The samples collected when the converter transformer was at different voltages in the no-load state are shown in Table 3. There was a total of eight states, with 80 samples were collected for each state, for a total of 640 samples. The training set contained 560 samples, and the test set contained 80 samples. The sampling frequency was 2 kHz and the sampling time for each sample was 0.05 s.
To verify the superiority of the algorithm proposed in this paper, five other algorithms are selected for comparison with the algorithm proposed in this paper, namely extreme learning machine (ELM), support vector machine (SVM), BP neural network (BPNN), DBN, Genetic algorithm-optimized DBN (GA-DBN). GA-DBN and SSA-DBN parameters are obtained by algorithmic adaptive operations, and the rest of the algorithms obtain the optimal parameters by the circular enumeration method. The specific parameter settings are shown in Table A1 (Appendix A) and the influence of the parameter settings on the results of the no-load experiment is shown in Table A2 (Appendix A). Different feature extraction methods are combined with different classification algorithms. FFT extracts the amplitude of the 100 Hz integer frequency multiplication of the signal, WPD extracts the frequency band energy of 0~800 Hz, with 100 Hz as the bandwidth, TDI is the time domain index set in Section 3.2.3, FFT + WPD + TDI is the fusion vector of the features extracted by the first three methods and is also the feature extraction method proposed in this paper. The specific experimental results are shown in Table 4.
In terms of feature extraction, it can be concluded from Table 4 that the fused eigenvectors are more accurate for classification when the converter transformer is in the no-load state compared to the eigenvector extracted using a single feature extraction method. When WPD or TDI are used as the feature extraction method, the classification accuracy for both the training and test sets does not exceed 90%, indicating that a single WPD or TDI cannot fully extract the features of the vibration signal when the transformer is in the no-load state. When FFT is used as the feature extraction method, the accuracy of the extracted feature vectors for classification is higher than that of WPD and TDI. This indicates that the frequency domain characteristics of the vibration signal are more obvious when the transformer is in the no-load state, while the time frequency and time domain characteristics are not so significant. When the fused eigenvectors are used, the classification accuracy is basically higher than 85%, which is a significant improvement compared with the FFT. This means that the fused feature extraction method proposed in this paper can extract the actual features of the vibration signal more effectively than the single feature extraction method when the converter transformer is in the no-load state.
From the perspective of classification algorithms, the SSA-DBN proposed in this paper has a greater advantage over other algorithms when the converter transformer is in the no-load state. When the feature extraction method is FFT, the classification accuracy of SSA-DBN and SVM is significantly higher than other algorithms for training and testing sets, but the computing time, as well as the time required for one iteration of SVM, exceed that of SSA-DBN by about 15%. When the feature extraction methods are WPD and TDI, SSA-DBN still has certain advantages over other algorithms, although these two feature extraction methods cannot fully extract the features of the vibration signals collected in this paper. When the fused eigenvectors proposed in this paper are used, the classification accuracy of SSA-DBN is 100% for both training and test sets, and it can accurately identify the operation state of the transformer at different voltages when it is in the no-load state. When the converter transformer is in the no-load state, SSA-DBN has a significant advantage over ELM, SVM, BPNN and DBN with respect to the two indexes of classification accuracy and computing time. Meanwhile, although GA-DBN also improves the performance of DBN to some extent, the effect is not as significant as SSA-DBN, and the computing time, as well as the time required for one iteration are longer than for SSA-DBN. In addition, according to Table A3, it can be seen that the sparrow search algorithm achieves the maximum classification accuracy by optimizing the optimal parameters, which indicates that SSA-DBN parameters are indeed the global optimal parameters. By comparing the classification accuracy, it can be judged that the optimization performance of SSA-DBN is better than that of GA-DBN. This shows that SSA-DBN is more sensitive to the vibration signal features contained in the fused eigenvector when the converter transformer is in the no-load state, and can effectively identify the no-load state of the converter transformer at different voltages.

5.2. Experiment in the On-Load State

The samples collected when the converter transformer is loaded with different currents in the on-load state are shown in Table 5, with four states, and 80 samples collected for each state, making a total of 320 samples. The training set contains 280 samples, and the test set contains 40 samples. The sampling frequency is 2 kHz, and the sampling time of each sample is 0.05 s.
To verify the effectiveness of the algorithm proposed in this paper, the algorithm proposed in this paper is used to identify the on-load state of the converter transformer. The comparison algorithm is the same as in Section 5.1. Similarly, GA-DBN and SSA-DBN parameters are obtained by algorithmic adaptive operations, and the rest of the algorithms obtain the optimal parameters by the circular enumeration method. The specific settings of the parameters are shown in Table A1 (Appendix A), and the influence of the parameter settings on the results of the on-load experiment is shown in Table A3 (Appendix A). The specific experimental results are shown in Table 6.
In terms of feature extraction, similar conclusions to those presented in Section 5.1 can be drawn from Table 6. When the converter transformer is in the on-load state, the fused eigenvectors have higher classification accuracy compared to the single feature extraction method when applied for classification. When WPD and TDI are used as feature extraction methods, the accuracy of the extracted feature vectors is mostly over 85% or even 90% when used for classification. In contrast, when FFT is used as the feature extraction method, the classification accuracy is generally lower than the above two cases by 5% to 20%. This indicates that the time–frequency characteristics and time–domain characteristics are more significant than the frequency–domain characteristics when the converter transformer is in the on-load state. At the same time, the fused eigenvectors are used to classify the transformers with improved results compared to WPD and TDI, which usually increase the classification accuracy by 5–10%. This means that the fused feature extraction method proposed in this paper can extract the actual features of the vibration signal more effectively than the single feature extraction method when the converter transformer is in the on-load state.
With respect to classification algorithm, when the converter transformer is in the on-load state, it is obvious that SSA-DBN has significant advantages over other algorithms in terms of classification accuracy and computing time. Regardless of the feature extraction method, the classification results of SSA-DBN for the test set are higher than ELM, SVM and BPNN by more than 10%. Since the test set samples are relatively reduced at this time, the optimization performance of SSA-DBN is more significant. It can quickly determine the optimal parameters of DBN to improve the performance of DBN, effectively reducing the computing time, as well as the time required for one iteration, by 5–20% while ensuring high classification accuracy, overcoming the shortcomings of GA-DBN, which improves the classification accuracy but increases the computing time. In addition, it can be seen from Table A3 that the optimal parameters obtained by the sparrow search algorithm can maximize the classification accuracy of DBN compared with other parameter combinations, which proves that the optimal parameters obtained by SSA-DBN are indeed global optimal parameters, and the optimization performance is significantly better than that of GA-DBN.
In summary, according to the results of the previous analysis, it can be concluded that the frequency domain characteristics of the vibration signal generated when the converter transformer is in the no-load state are more significant. Correspondingly, the time frequency characteristics and time domain characteristics of the vibration signal generated when the converter transformer is in the on-load state are more significant. Therefore, it is difficult for a single feature extraction method to ensure that all the effective information is extracted when the state of the converter transformer changes, while the fusion feature extraction method proposed in this paper can effectively overcome this problem. It is possible to extract the effective features of the vibration signal regardless of the state of the transformer. At the same time, the SSA-DBN algorithm proposed in this paper can distinguish the characteristics of different vibration signals more sharply, and has obvious advantages in classification accuracy and computing time compared with other algorithms, which effectively identify the operation state of the converter transformer. In the no-load experiment and on-load experiment, it can be seen from Table A2 and Table A3 in Appendix A that the optimal parameters of DBN obtained by the sparrow search algorithm improve the classification accuracy of DBN to a greater extent than other parameter combinations, making the classification accuracy of SSA-DBN significantly higher than that of other algorithms. The maximum accuracy of the classification algorithm using other parameter combinations is usually lower than SSA-DBN, which also proves that the optimal parameters obtained by the sparrow search algorithm are indeed the global optimal solution. In addition, although genetic algorithm can also optimize the parameters of DBN, the optimal solution of the sparrow search algorithm is significantly better than that of the genetic algorithm, which indicates that the sparrow search algorithm has stronger global optimization performance and is more suitable for the parameter optimization of DBN.
However, there are several instances in Table 4 and Table 6 where the classification accuracy of the test set is higher than that of the training set, which may be caused by the small number of test samples. To further verify the effectiveness of the proposed method, a new data set will be used for validation in the next section, and the overfitting problem and computing efficiency of the algorithm will be further discussed.

5.3. Validation on Extended Data Sets

To further verify the classification performance of the algorithm, this section will classify the vibration signals measured at different measurement points of the converter transformer in different operation states. The measurement point numbers and samples corresponding to the no-load and on-load states of the converter transformer are shown in Table 7. Samples were collected at seven measurement points under the two operation states of the converter transformer, resulting in 14 cases, each containing 240 state samples with a sampling frequency of 2 kHz and a sampling time of 0.1 s for each sample, and a high-dimensional state sample matrix of 22 × 3360 was constructed by feature extraction. The comparison algorithm is the same as in Section 5.1 and Section 5.2. Similarly, the GA-DBN and SSA-DBN parameters weres obtained by algorithmic adaptive operations, and the rest of the algorithms obtain the optimal parameters by circular enumeration method. The specific settings of parameters are shown in Table A1 (Appendix A) and the influence of the parameter settings on the results of the extended dataset is shown in Table A4 (Appendix A).

5.3.1. Validation of Classification Accuracy

In Section 5.1 and Section 5.2, it was often the case that the classification accuracy of the test set was higher than that of the training set when identifying the operation state of the converter transformer. This may be caused by the small number of samples in the test set, so this section will test the classification accuracy of the algorithm for the extended data. It is worth noting that since the fused eigenvectors were analyzed and verified in the previous section to reflect the vibration signal characteristics of different states of the converter transformer better than the single feature extraction method, the feature extraction methods are not compared in this section.
The algorithm proposed in this paper and five other algorithms are applied to the training set to identify the vibration signal. The classification results obtained are shown in Figure 9.
As shown in Figure 9, the classification accuracy of traditional machine learning algorithms like ELM, SVM and BPNN on the training set does not exceed 90%. In addition, for deep learning, the accuracy of the unoptimized DBN is only 86.7007% when applied to the training set, meaning that the network performance still needs to be further improved, because it has undergone several adjustments in the process of setting parameters. After using the genetic algorithm to optimize the DBN, the classification accuracy reaches 90.7823%. Although the classification effect of GA-DBN has been improved compared with DBN, the classification accuracy of SSA-DBN reaches 98.1973%, which far exceeds the classification accuracy of other machine learning algorithms, DBN, and GA-DBN. The most striking result to emerge from the comparison is that the proposed algorithm can improve the training effect of DBN better than the genetic algorithm.
To further test the classification effect of the SSA-DBN algorithm, the test set was input into the well-trained SSA-DBN for calculation and compared with other algorithms. The comparison results obtained are shown in Figure 10. From Figure 10, it can be seen that the classification accuracy of ELM, BPNN and DBN on the test set decreases compared to that on the training set, and basically none of them exceed 86%. Meanwhile, the classification accuracy of SVM and GA-DBN on the test set improved to 89.7619% and 91.9048%, respectively. In contrast, the classification accuracy of SSA-DBN on the test set is 97.3810%, which is still about 10% higher than that of SVM and GA-DBN, and improves on the classification accuracy of DBN by 13.8096%. This indicates that the classification performance of SSA-DBN on the test set is also significantly better than other algorithms.
The expansion of the dataset leads to an increase in the computing time of the algorithm, so analyzing the computing time on the expanded dataset is also a measure of the performance of the algorithm. Since the classification results are obtained simultaneously when the algorithm is applied to the training and test sets, the computing time are the same for all algorithms in Figure 9 and Figure 10. The computing time of ELM is the shortest, followed by BPNN; SVM is the longest, and the classification accuracy of all three algorithms is unsatisfactory. Although the genetic algorithm improves the classification performance of DBN, the complexity of the genetic algorithm causes the computing time of GA-DBN to nearly double. In the face of the expanded dataset, the computation time used by SSA-DBN is only about 50% higher than that of DBN, which is much lower than that of GA-DBN, while ensuring a high classification accuracy. This indicates that SSA-DBN achieves a balance between classification performance and computational efficiency and can adequately cope with the challenges posed by data expansion.

5.3.2. Fitting Effect Validation

After being applied to the extended dataset, SVM and GA-DBN still showed a higher classification accuracy in the test set than in the training set, which could be due to the overfitting of the algorithm during the operation. Since the classification performance and computational efficiency of SVM are significantly lower than those of DBN, GA-DBN and SSA-DBN, they are not discussed in this section. This section mainly discusses the fitting effects of DBN, GA-DBN and SSA-DBN to further verify the performance of the optimization algorithm. Firstly, the changes of classification accuracy of DBN, GA-DBN and SSA-DBN in the training and test sets after different numbers of iterations are tested for analyzing whether the three algorithms overfit during the operation process. The comparison results of the operation efficiency of the different algorithms are shown in Figure 11, and the efficiency comparison of iterative operation of the different algorithms is shown in Table 8.
It can be seen from Table 8 that the time required for one iteration of GA-DBN and SSA-DBN in the optimization process is increased compared with that of DBN, while the time required for one iteration of SSA-DBN is lower than that of GA-DBN. From Figure 11, it can be seen that both DBN and GA-DBN need several iterations to reach a certain classification accuracy, while SSA-DBN can reach a higher classification accuracy with fewer iterations. It is apparent from this figure that the final classification accuracy of SSA-DBN on both training and test sets is higher than that of DBN and GA-DBN. Therefore, although the time required for one iteration of SSA-DBN is higher than that for one iteration of DBN, the classification accuracy is greatly improved, indicating that the comprehensive performance of SSA-DBN is better than that of GA-DBN. However, there is an unexpected phenomenon that the classification accuracy of both DBN and GA-DBN appears to be higher during the operation than that of the training set, which may be due to overfitting. Therefore, the next step is to calculate the loss changes for verification. A comparison of the results of loss changes for DBN, GA-DBN and SSA-DBN are shown in Figure 12.
As can be seen from Figure 12, DBN converges faster on the training set but relatively slowly on the test set, which is prone to fluctuations in convergence. The test set loss of DBN is higher than the training set at convergence, which indicates basically no overfitting phenomenon. The test set accuracy of the GA-DBN algorithm exceeds that of the training set, and the test set loss is smaller than that of the training set. This indicates that an overfitting phenomenon has occurred during the GA-DBN operation, causing the operation results to fall into a local optimum. In contrast, SSA-DBN has the smallest loss, the fastest loss convergence speed and the best fitting effect. The test set loss of SSA-DBN is higher than the training set at convergence without overfitting or under-fitting phenomenon. The above results show that the sparrow search algorithm has a better optimization effect for DBN than the genetic algorithm, which further proves the superiority of the SSA-DBN algorithm.
The above experimental results show that SSA-DBN ensures high classification accuracy with faster convergence speed and higher operation efficiency, which is significantly superior compared with other classification algorithms. Meanwhile, SSA-DBN has better anti-interference performance and a better fitting effect, which means that the sparrow search algorithm can improve the classification performance of DBN. In summary, SSA-DBN can efficiently achieve the classification of vibration signals and is suitable for solving the problem of identifying the operation state of converter transformers in complex operation environments.

6. Conclusions and Outlook

The present study was designed to solve the operation state identification problem of converter transformers in complex working environments by comprehensively analyzing the vibration characteristics of the converter transformer. This paper uses the no-load and on-load states as the division of the operation state of the converter transformer, and proposes a fused feature extraction method based on the FFT, WPD and TDI to extract features of vibration signals. To identify the operation state of the converter transformer, this paper uses the sparrow search algorithm to optimize the DBN parameters to form the SSA-DBN algorithm. The experimental results show that the eigenvectors extracted by the fused feature extraction method can effectively improve the classification accuracy of the classification algorithm by 5–20% compared with the single feature extraction method. With respect to the premise of ensuring operational efficiency, SSA-DBN improves the classification accuracy by 2.5~17% compared with the original DBN algorithm, exceeding 95% and even reaching 100% on different datasets, which offers a significant advantage compared to other algorithms. On the basis of the performance verification of SSA-DBN parameters, it can be found that the parameters obtained by SSA-DBN are global optimal solutions, and its optimization performance is significantly better than that of GA-DBN. In general, the method proposed in this paper can effectively identify the operation state of the converter transformer, which advances the research on the vibration characteristics of converter transformers and contributes to the progress of key manufacturing technologies for converter transformers.
Overall, the findings from this study make several contributions to the current literature. First, the most important contribution of this study lies in confirming the feasibility of applying the vibration method to the state identification of converter transformers. Second, the method proposed in this paper will prove useful in expanding our understanding of the vibration characteristics of converter transformers, laying the groundwork for future research into applying the vibration method to realize the condition monitoring and fault diagnosis of converter transformers. Third, the research results of this paper can also be applied to other power equipment in the power system, which is helpful for the research of power equipment operation state analysis.
However, this study is limited by insufficient data sample types. Being limited by the lack of fault data, the study did not include fault diagnosis of converter transformers. Considering that the method proposed in this paper exhibited a good classification effect, on the basis of obtaining more data through experiments, further research might explore application of this method in the fault diagnosis of converter transformers, which would be of great help in research on fault diagnosis of power equipment. Therefore, the next step is to purchase new experimental equipment to measure more vibration data, and further study the vibration characteristics and fault diagnosis methods of converter transformers when different faults occur, so as to improve the manufacturing technology and processing technology of converter transformers.

Author Contributions

Conceptualization, Z.Z.; methodology, Z.Z.; validation, Y.W.; formal analysis, Y.W.; investigation, Y.W.; writing—original draft preparation, Y.W.; data curation, R.X.; writing—review and editing, P.J. and Z.D.; project administration, Z.Z.; funding acquisition, J.D. All authors have read and agreed to the published version of the manuscript.

Funding

This research was funded by the National Natural Science Foundation of China (Grant No. 52077012) and the National Natural Science Foundation of China (Grant No. 52007011).

Acknowledgments

Thanks are due to Zhicheng Pan (Maintenance & Test Center of EHV Power Transmission Company, China Southern Power Grid) and Guohua Liu (Quzhou Power Supply Company, State Grid Zhejiang Electric Power Co., Ltd.) for assistance with the experiments.

Conflicts of Interest

The authors declare no conflict of interest. The authors declare no conflict of interest. The funders had no role in the design of the study, in the collection, analyses, or interpretation of data; in the writing of the manuscript, or in the decision to publish the results.

Appendix A

Table A1. Algorithm parameter settings of the experiment.
ExperimentClassification
Algorithms
Optimal ParametersOther Parameters (max)
No-load stateELMNumber of hidden layer nodes: 5
Activation function: sigmoid
Number of hidden layer nodes: 4
Activation function: sigmoid
SVMPenalty factor: 0.3
Radius of Gamma function: 0.05
Stop training error: 1 × 10⁻³
Penalty factor: 0.2
Radius of Gamma function: 0.02
Stop training error: 1 × 10⁻³
BPNNNetwork structure: 32
The learning rate: 0.1
Network structure: 25
The learning rate: 0.1
DBNNumber of hidden layer nodes: 13,5
Learning rate: 0.14
Momentum factor: 0.9
Maximum number of iterations: 100
Number of hidden layer nodes: 15,5
Learning rate: 0.16
Momentum factor: 0.87
Maximum number of iterations: 100
GA-DBNNumber of hidden layer nodes: 13,4
Learning rate: 0.18
Momentum factor: 0.84
Maximum number of iterations: 100
Number of hidden layer nodes: 12,4
Learning rate: 0.20
Momentum factor: 0.76
Maximum number of iterations: 100
SSA-DBNNumber of hidden layer nodes: 13,5
Learning rate: 0.21
Momentum factor: 0.89
Maximum number of iterations: 100
Number of hidden layer nodes: 11,8
Learning rate: 0.27
Momentum factor: 0.87
Maximum number of iterations: 100
On-load stateELMNumber of hidden layer nodes: 5
Activation function: sigmoid
Number of hidden layer nodes: 3,8
Activation function: sigmoid
SVMPenalty factor: 0.5
Radius of Gamma function: 0.2
Stop training error: 1 × 10⁻³
Penalty factor: 0.4
Radius of Gamma function: 0.1
Stop training error: 1 × 10⁻³
BPNNNumber of hidden layer nodes: 15
The learning rate: 0.1
Number of hidden layer nodes: 8
The learning rate: 0.1
DBNNumber of hidden layer nodes: 15,5
Learning rate: 0.16
Momentum factor: 0.76
Maximum number of iterations: 100
Number of hidden layer nodes: 9,3
Learning rate: 0.15
Momentum factor: 0.53
Maximum number of iterations: 100
GA-DBNNumber of hidden layer nodes: 13,2
Learning rate: 0.14
Momentum factor: 0.88
Maximum number of iterations: 100
Number of hidden layer nodes: 12,6
Learning rate: 0.13
Momentum factor: 0.85
Maximum number of iterations: 100
SSA-DBNNumber of hidden layer nodes: 10,3
Learning rate: 0.25
Momentum factor: 0.9
Maximum number of iterations: 100
Number of hidden layer nodes: 12,4
Learning rate: 0.27
Momentum factor: 0.88
Maximum number of iterations: 100
Extended datasetELMNumber of hidden layer nodes: 5
Activation function: sigmoid
Number of hidden layer nodes: 4
Activation function: sigmoid
SVMPenalty factor: 0.8
Radius of Gamma function: 0.02
Stop training error: 1 × 10⁻³
Penalty factor: 0.2
Radius of Gamma function: 0.02
Stop training error: 1 × 10⁻³
BPNNNumber of hidden layer nodes: 50
The learning rate: 0.1
Number of hidden layer nodes: 25
The learning rate: 0.1
DBNNumber of hidden layer nodes: 13,5
Learning rate: 0.1
Momentum factor: 0.5
Maximum number of iterations: 100
Number of hidden layer nodes: 15,5
Learning rate: 0.16
Momentum factor: 0.87
Maximum number of iterations: 100
GA-DBNNumber of hidden layer nodes: 8,4
Learning rate: 0.1
Momentum factor: 0.5
Maximum number of iterations: 100
Number of hidden layer nodes: 12,4
Learning rate: 0.20
Momentum factor: 0.76
Maximum number of iterations: 100
SSA-DBNNumber of hidden layer nodes: 13,5
Learning rate: 0.1
Momentum factor: 0.9
Maximum number of iterations: 100
Number of hidden layer nodes: [11,8]
Learning rate: 0.27
Momentum factor: 0.87
Maximum number of iterations: 100
Note: Other parameters (max) represent the combination of parameters that can make the algorithm obtain the second highest classification accuracy. The dimensions of the input vectors are 22, and the dimensions of the output vectors are 8 (no-load), 5 (on-load) and 14 (extended dataset), respectively.
Table A2. The influence of parameter settings on the results of the no-load experiment.
Feature Extraction MethodClassification
Algorithms
Accuracy of the Training set (%)
[Optimal Parameters/
Other Parameters (Max)]
Accuracy of the Test Set (%)
[Optimal Parameters/
Other Parameters (Max)]
FFTELM76.6071/75.535777.5000/76.2500
SVM91.9643/91.2500100.0000/91.2500
BPNN73.5714/71.785775.0000/67.5000
DBN87.5000/87.231487.5000/82.5000
GA-DBN90.8929/89.107193.7500/86.2500
SSA-DBN91.7857/90.3571100.0000/92.5000
WPDELM83.7500/82.500055.0000/50.0000
SVM89.8214/89.285762.5000/51.2500
BPNN75.0000/73.571450.0000/41.2500
DBN85.7143/84.107178.7500/71.2500
GA-DBN79.4643/79.285787.5000/83.7500
SSA-DBN82.5000/81.964386.2500/81.2500
TDIELM77.6786/77.500031.2500/25.0000
SVM80.3571/80.000050.0000/43.7500
BPNN83.9286/83.035737.0000/32.50000
DBN94.4643/93.035762.5000/50.0000
GA-DBN88.0357/86.607162.5000/51.2500
SSA-DBN90.3571/90.178670.0000/68.7500
FFT + WPD + TDIELM96.4286/94.642987.5000/81.2500
SVM95.3571/94.464387.5000/80.0000
BPNN96.6071/95.535785.0000/72.5000
DBN100.0000/99.642991.2500/90.0000
GA-DBN100.0000/99.107192.5000/90.0000
SSA-DBN100.0000/98.7500100.0000/97.5000
Table A3. The influence of parameter settings on the results of the on-load experiment.
Feature Extraction MethodClassification
Algorithms
Accuracy of the Training Set (%)
[Optimal Parameters/
Other Parameters (Max)]
Accuracy of the Test Set (%)
[Optimal Parameters/
Other Parameters (Max)]
FFTELM67.1429/65.714370.0000/65.0000
SVM69.6429/68.571467.5000/61.2500
BPNN81.4286/81.071480.0000/73.7500
DBN81.4286/80.178685.0000/73.7500
GA-DBN83.9286/82.678685.0000/77.5000
SSA-DBN82.5000/81.250087.5000/82.5000
WPDELM77.1429/76.607180.0000/76.2500
SVM89.2857/89.107187.5000/83.7500
BPNN87.8571/87.500085.0000/78.7500
DBN82.1429/81.428690.0000/88.7500
GA-DBN95.7143/95.357192.5000/80.0000
SSA-DBN92.5000/91.428695.0000/91.2500
TDIELM62.8571/62.142977.5000/75.0000
SVM75.3571/74.107182.5000/80.0000
BPNN86.0714/85.892985.0000/72.5000
DBN88.2143/87.857190.0000/85.0000
GA-DBN86.4286/84.642995.0000/87.5000
SSA-DBN90.3571/90.0000100.0000/90.0000
FFT + WPD + TDIELM74.2857/73.571482.5000/77.5000
SVM88.5714/87.321495.0000/88.7500
BPNN88.5714/87.500090.0000/80.0000
DBN98.9286/97.321497.5000/96.2500
GA-DBN97.8571/96.0714100.0000/95.0000
SSA-DBN99.2857/97.5000100.0000/95.0000
Table A4. The influence of parameter settings on the results of the extended dataset.
Feature Extraction MethodClassification
Algorithms
Accuracy of the Training Set (%)
[Optimal Parameters/
Other Parameters (Max)]
Accuracy of the Test Set (%)
[Optimal Parameters/
Other Parameters (Max)]
FFT + WPD + TDIELM88.5034/87.653185.4762/82.3810
SVM80.5442/78.061289.7619/85.9524
BPNN78.6054/75.476289.6077/86.1905
DBN86.7007/83.741583.5714/79.0476
GA-DBN90.7823/88.095291.9048/87.3810
SSA-DBN98.1973/97.244997.3810/96.1905

References

  1. Bhuvaneswari, G.; Mahanta, B. Analysis of converter transformer failure in HVDC systems and possible solutions. IEEE Trans. Power Deliv. 2009, 24, 814–821. [Google Scholar] [CrossRef]
  2. Lin, X.; Lu, J.; Tian, Q.; Weng, H.; Li, Z.; Tong, C.; Li, M.; Sun, J.; Yang, D. Abnormal operation behavior analysis and countermeasures on the differential protection of converter transformer. Int. J. Electr. Power Energy Syst. 2015, 64, 516–525. [Google Scholar] [CrossRef]
  3. Londhe, S.S.; Bachawad, M.R. Review of harmonic losses in HVDC converter transformer: Its causes and mitigation techniques. In Proceedings of the Innovations in Power and Advanced Computing Technologies (i-PACT), Vellore, India, 21–22 April 2017; pp. 1–5. [Google Scholar]
  4. Zhang, X.; Huang, R.; Zhou, D.; Wang, F. In Vibration Monitoring of Converter Transformer by Simplified permutation Entropy. In Proceedings of the 2018 Chinese Automation Congress (CAC), Xi’an, China, 30 November–2 December 2018; pp. 864–869. [Google Scholar]
  5. Bagheri, M.; Naderi, M.S.; Blackburn, T. Advanced transformer winding deformation diagnosis: Moving from off-line to on-line. IEEE Trans. Dielectr. Electr. Insul. 2012, 19, 1860–1870. [Google Scholar] [CrossRef]
  6. Akhavanhejazi, M.; Gharehpetian, G.B.; Faraji-Dana, R.; Moradi, G.; Mohammadi, M.; Alehoseini, H.A. A new on-line monitoring method of transformer winding axial displacement based on measurement of scattering parameters and decision tree. Expert Syst. Appl. 2011, 38, 8886–8893. [Google Scholar] [CrossRef]
  7. Fan, J.; Wang, F.; Sun, Q.; Bin, F.; Ye, H.; Liu, Y. An online monitoring system for oil immersed power transformer based on SOFC detector with a new quantification approach. IEEE Sens. J. 2017, 17, 6662–6671. [Google Scholar] [CrossRef]
  8. Fan, J.; Fu, C.; Yin, H.; Wang, Y.; Jiang, Q. Power transformer condition assessment based on online monitor with SOFC chromatographic detector. Electr. Power Energy Syst. 2020, 118, 105805–105812. [Google Scholar] [CrossRef]
  9. Hejazi, M.; Gharehpetian, G.; Moradi, G.; Alehosseini, H.; Mohammadi, M. Online monitoring of transformer winding axial displacement and its extent using scattering parameters and k-nearest neighbour method. IET Gener. Transm. Distrib. 2011, 5, 824–832. [Google Scholar] [CrossRef]
  10. Joshi, P.; Kulkarni, S. A novel approach for on-line deformation diagnostics of transformer windings. In Proceedings of the IEEE PES General Meeting, Providence, RI, USA, 25–29 July 2010; pp. 1–6. [Google Scholar]
  11. Tang, L.; Luo, R.; Deng, M.; Su, J. Study of partial discharge localization using ultrasonics in power transformer based on particle swarm optimization. IEEE Trans. Dielectr. Electr. Insul. 2008, 15, 492–495. [Google Scholar]
  12. Hu, G.; Zhang, L.; Wu, X.; Correia, D.; He, W. Detecting the capacity of distribution transformer based on an on-line method. In Proceedings of the 2011 Asia-Pacific Power and Energy Engineering Conference, Xi’an, China, 25–28 March 2011; pp. 1–4. [Google Scholar]
  13. Palani, A.; Santhi, S.; Gopalakrishna, S.; Jayashankar, V. Real-time techniques to measure winding displacement in transformers during short-circuit tests. IEEE Trans. Power Deliv. 2008, 23, 726–732. [Google Scholar] [CrossRef]
  14. De Rybel, T.; Singh, A.; Vandermaar, J.A.; Wang, M.; Marti, J.R.; Srivastava, K.D. Apparatus for online power transformer winding monitoring using bushing tap injection. IEEE Trans. Power Deliv. 2009, 24, 996–1003. [Google Scholar] [CrossRef]
  15. Hong, K.; Huang, H.; Zhou, J. Winding condition assessment of power transformers based on vibration correlation. IEEE Trans. Power Deliv. 2014, 30, 1735–1742. [Google Scholar] [CrossRef]
  16. García, B.; Burgos, J.C.; Alonso, Á. Winding deformations detection in power transformers by tank vibrations monitoring. Electr. Power Syst. Res. 2005, 74, 129–138. [Google Scholar] [CrossRef]
  17. García, B.; Burgos, J.C.; Alonso, Á. Transformer tank vibration modeling as a method of detecting winding deformations-part I: Theoretical foundation. IEEE Trans. Power Deliv. 2005, 21, 157–163. [Google Scholar] [CrossRef]
  18. García, B.; Burgos, J.C.; Alonso, Á. Transformer tank vibration modeling as a method of detecting winding deformations-part II: Experimental verification. IEEE Trans. Power Deliv. 2005, 21, 164–169. [Google Scholar] [CrossRef]
  19. Zhang, F.; Ji, S.; Shi, Y.; Ren, F.; Zhan, C.; Zhu, L. Comprehensive vibration generation model of transformer winding under load current. IET Gener. Transm. Distrib. 2019, 13, 1563–1571. [Google Scholar] [CrossRef]
  20. Zhang, F.; Ji, S.; Ma, H.; Saha, T.K. Operational Modal Analysis of Transformer Windings. IEEE Trans. Power Deliv. 2020, 35, 1285–1298. [Google Scholar] [CrossRef]
  21. Zhou, H.; Hong, K.; Huang, H.; Zhou, J. Transformer winding fault detection by vibration analysis methods. Appl. Acoust. 2016, 114, 136–146. [Google Scholar] [CrossRef]
  22. Zhang, P.; Li, L.; Cheng, Z.; Tian, C.; Han, Y. Study on Vibration of Iron Core of Transformer and Reactor Based on Maxwell Stress and Anisotropic Magnetostriction. IEEE Trans. Magn. 2019, 55. [Google Scholar] [CrossRef]
  23. Khan, I.; Xu, Y.; Kar, S.; Chow, M.; Bhattacharjee, W. Compressive Sensing and Morphology Singular Entropy-Based Real-Time Secondary Voltage Control of Multiarea Power Systems. IEEE Trans. Ind. Inform. 2019, 15, 3796–3807. [Google Scholar] [CrossRef] [Green Version]
  24. Ji, S.; Luo, Y.; Li, Y. Research on extraction technique of transformer core fundamental frequency vibration based on OLCM. IEEE Trans. Power Deliv. 2006, 21, 1981–1988. [Google Scholar]
  25. Geng, C.; Wang, F.; Zhang, J.; Jin, Z. Modal parameters identification of power transformer winding based on improved empirical mode decomposition method. Electr. Power Syst. Res. 2014, 108, 331–339. [Google Scholar] [CrossRef]
  26. Borucki, S. Diagnosis of technical condition of power transformers based on the analysis of vibroacoustic signals measured in transient operating conditions. IEEE Trans. Power Deliv. 2012, 27, 670–676. [Google Scholar] [CrossRef]
  27. Zhao, M.; Xu, G. Feature extraction of power transformer vibration signals based on empirical wavelet transform and multiscale entropy. IET Sci. Meas. Technol. 2017, 12, 63–71. [Google Scholar] [CrossRef]
  28. Hong, K.; Wang, L.; Xu, S. A variational mode decomposition approach for degradation assessment of power transformer windings. IEEE Trans. Instrum. Meas. 2018, 68, 1221–1229. [Google Scholar] [CrossRef]
  29. Cao, C.; Xu, B.; Li, X. Monitoring Method on Loosened State and Deformational Fault of Transformer Winding Based on Vibration and Reactance Information. IEEE Access 2020, 8, 215479–215492. [Google Scholar] [CrossRef]
  30. Ghanizadeh, A.J.; Gharehpetian, G.B. ANN and cross-correlation based features for discrimination between electrical and mechanical defects and their localization in transformer winding. IEEE Trans. Dielectr. Electr. Insul. 2014, 21, 2374–2382. [Google Scholar] [CrossRef]
  31. Shah, A.M.; Bhalja, B.R. Discrimination between internal faults and other disturbances in transformer using the support vector machine-based protection scheme. IEEE Trans. Power Deliv. 2013, 28, 1508–1515. [Google Scholar] [CrossRef]
  32. Raichura, M.B.; Chothani, N.G.; Patel, D.D. Identification of internal fault against external abnormalities in power transformer using hierarchical ensemble extreme learning machine technique. IET Sci. Meas. Technol. 2019, 14, 111–121. [Google Scholar] [CrossRef]
  33. Shah, A.M.; Bhalja, B.R. Transmission; Distribution, Fault discrimination scheme for power transformer using random forest technique. IET Gener. Transm. Distrib. 2016, 10, 1431–1439. [Google Scholar] [CrossRef]
  34. Kartojo, I.H.; Wang, Y.B.; Zhang, G.J. Partial Discharge Defect Recognition in Power Transformer using Random Forest. In Proceedings of the 2019 IEEE 20th International Conference on Dielectric Liquids (ICDL), Roma, Italy, 15 August 2019; pp. 1–4. [Google Scholar]
  35. Dai, J.; Song, H.; Sheng, G.; Jiang, X. Dissolved gas analysis of insulating oil for power transformer fault diagnosis with deep belief network. IEEE Trans. Dielectr. Electr. Insul. 2017, 24, 2828–2835. [Google Scholar] [CrossRef]
  36. Liang, Y.; Xu, Y.Y.; Wan, X.S.; Li, Y.; Liu, N.; Zhang, G.J. Dissolved gas analysis of transformer oil based on deep belief networks. In Proceedings of the 2018 12th International Conference on the Properties and Applications of Dielectric Materials (ICPADM), Xi’an, China, 20–24 May 2018; pp. 825–828. [Google Scholar]
  37. Deng, H.B.; Hu, J.; Wang, X.S.; Yu, M. In Transformer fault diagnosis based on massive vibration data. In Proceedings of the 2019 Chinese Control And Decision Conference (CCDC), Nanchang, China, 12 September 2019; pp. 4586–4591. [Google Scholar]
  38. Hong, K.; Huang, H.; Zhou, J.; Shen, Y. A method of real-time fault diagnosis for power transformers based on vibration analysis. Meas. Sci. Technol. 2015, 26, 115011–115021. [Google Scholar] [CrossRef]
  39. Cao, C.; Xu, J.; Lin, X.; Li, X. State diagnosis method of transformer winding deformation based on fusing vibration and reactance parameters. IET Electr. Power Appl. 2019, 14, 818–826. [Google Scholar]
  40. Zhang, B.; Zhao, D.; Wang, F.; Shi, K.; Zhao, Z. Research on mechanical fault diagnosis method of power transformer winding. J. Eng. 2019, 16, 2096–2101. [Google Scholar]
  41. Zollanvari, A.; Kunanbayev, K.; Bitaghsir, S.A.; Bagheri, M. Transformer Fault Prognosis Using Deep Recurrent Neural Network Over Vibration Signals. IEEE Trans. Instrum. Meas. 2020, 70. [Google Scholar] [CrossRef]
  42. Hong, K.; Lin, G. State classification of transformers using nonlinear dynamic analysis and Hidden Markov models. Measurement 2019, 147, 106851–106860. [Google Scholar] [CrossRef]
  43. Zhang, F.; Ji, S.; Shi, Y.; Zhan, C.; Zhu, L. Investigation on vibration source and transmission characteristics in power transformers. Appl. Acoust. 2019, 151, 99–112. [Google Scholar] [CrossRef]
  44. Shao, P.; Luo, L.; Li, Y.; Rehtanz, C. Electromagnetic vibration analysis of the winding of a new HVDC converter transformer. IEEE Trans. Power Deliv. 2011, 27, 123–130. [Google Scholar] [CrossRef]
  45. Xu, J.; Zhou, J.; Yang, Y. Research on vibration and noise characteristic of converter transformer under DC bias. In Proceedings of the 22nd International Conference on Electrical Machines and Systems (ICEMS), Harbin, China, 11–14 August 2019; pp. 1–5. [Google Scholar]
  46. Liu, C.; Jin, M.; Tian, H.; Zhou, X.; Zhao, Y.; Chen, W. Converter transformer vibration analysis for ±800KV Fengxian HVDC substation. In Proceedings of the 2016 IEEE International Conference on High Voltage Engineering and Application (ICHVE), Chengdu, China, 29 December 2016; pp. 1–3. [Google Scholar]
  47. Secic, A.; Krpan, M.; Kuzle, I. Vibro-Acoustic Methods in the Condition Assessment of Power Transformers, A. Survey. IEEE Access 2019, 7, 83915–83931. [Google Scholar] [CrossRef]
  48. Zou, L.; Guo, Y.; Liu, H.; Zhang, L.; Zhao, T. A Method of Abnormal States Detection Based on Adaptive Extraction of Transformer Vibro-Acoustic Signals. Energies 2017, 10, 12. [Google Scholar] [CrossRef] [Green Version]
  49. Hu, Y.; Zheng, J.; Huang, H. Experimental Research on Power Transformer Vibration Distribution under Different Winding Defect Conditions. Electronics 2019, 8, 842. [Google Scholar] [CrossRef] [Green Version]
  50. Bagheri, M.; Zollanvari, A.; Nezhivenko, S. Transformer fault condition prognosis using vibration signals over cloud environment. IEEE Access 2018, 6, 9862–9874. [Google Scholar] [CrossRef]
  51. Zhang, Z.; Wu, Y.; Zhang, R.; Jiang, P.; Dong, Z.J.; Liu, G.; Ahmed, S. Novel Transformer Fault Identification Optimization Method Based on Mathematical Statistics. Mathematics 2019, 7, 288. [Google Scholar] [CrossRef] [Green Version]
  52. Huerta-Rosales, J.R.; Granados-Lieberman, D.; Amezquita-Sanchez, J.P.; Camarena-Martinez, D.; Valtierra-Rodriguez, M. Vibration Signal Processing-Based Detection of Short-Circuited Turns in Transformers: A Nonlinear Mode Decomposition Approach. Mathematics 2020, 8, 575. [Google Scholar] [CrossRef]
  53. Cheng, Q.; Zhao, Z.; Tang, C.; Qian, G.; Islam, S. Diagnostic of transformer winding deformation fault types using continuous wavelet transform of pulse response. Measurement 2019, 140, 197–206. [Google Scholar] [CrossRef]
  54. Chan, J.C.; Ma, H.; Saha, T.K. Time-frequency sparsity map on automatic partial discharge sources separation for power transformer condition assessment. IEEE Trans. Dielectr. Electr. Insul. 2015, 22, 2271–2283. [Google Scholar] [CrossRef]
  55. Hinton, G.E.; Osindero, S.; Teh, Y.-W. A fast learning algorithm for deep belief nets. Neural Comput. 2006, 18, 1527–1554. [Google Scholar] [CrossRef] [PubMed]
  56. Hinton, G.E. Training products of experts by minimizing contrastive divergence. Neural Comput. 2002, 14, 1771–1800. [Google Scholar] [CrossRef] [PubMed]
  57. Larochelle, H.; Erhan, D.; Courville, A.; Bergstra, J.; Bengio, Y. An empirical evaluation of deep architectures on problems with many factors of variation. In Proceedings of the 24th international conference on Machine learning, New York, NY, USA, 20–24 June 2007; pp. 473–480. [Google Scholar]
  58. Xue, J.; Shen, B.J.S.S.; Engineering, C. A novel swarm intelligence optimization approach: Sparrow search algorithm. Syst. Sci. Control. Eng. 2020, 8, 22–34. [Google Scholar] [CrossRef]
Figure 1. The vibration transmission path of converter transformers.
Actuators 10 00056 g001
Figure 2. The operating principle of the vibrational measurement system.
Actuators 10 00056 g002
Figure 3. The field experiment on the vibration signal measurement of converter transformers.
Actuators 10 00056 g003
Figure 4. Typical wavelet time frequency energy spectrum of vibration signal of converter transformers.
Actuators 10 00056 g004
Figure 5. The typical frequency spectrum of the vibration signal of converter transformers.
Actuators 10 00056 g005
Figure 6. Schematic diagram of wavelet packet decomposition.
Actuators 10 00056 g006
Figure 7. The basic structure of the DBN with 2-layers RBM.
Actuators 10 00056 g007
Figure 8. Flow chart of DBN optimization algorithm (SSA-DBN).
Actuators 10 00056 g008
Figure 9. Experimental results of the training set.
Actuators 10 00056 g009
Figure 10. Experimental results of the test set.
Actuators 10 00056 g010
Figure 11. Comparison of the results of operation efficiency of the different algorithms.
Actuators 10 00056 g011
Figure 12. Comparison of the results of loss changes.
Actuators 10 00056 g012
Table 1. Test parameters of the converter transformer in the converter station.
ParametersValue
TypeZZDFPZ-480000/500-400
Rated capacity480,000 kVA
Voltage combination ( 525 / 3 4 + 4 × 1.25 % ) / 244 / 3 kV
Connection groupIi0
Rated current1583.6/3408 A
Rated frequency50 Hz
Cooling modeODAF
Insulation level
(terminal of grid side)
1.1 SI/LI/LIC/AC 1175/1550/1705/680 kV
1.2 LI/AC 185/95 kV
2.1 SI/LI/LIC/AC/DC/PR 1050/1300/1430/441/624/
520/+240/−520 kV
2.2
Table 2. The working parameters of the sensor and data acquisition instruments.
TypeIndexParameters
IEPE piezoelectric acceleration sensorFrequency response1 Hz~50 kHz
Range100 m/s2
Sensitivity<10 mV/mos−2
Working temperature−40 °C~120 °C
PSt150/4/7 VS9 piezoelectric actuatorNominal stroke9 μm ± 10%
Stiffness25 N/μm ± 20%
Electrostatic capacity0.17 μF ± 20%
Push/Pull20 N
DH5902N data acquisition instrumentSampling frequency20 kHz
Dynamic range>100 dB
Flatness of frequency response±1 dB
Error±1 dB
Table 3. Sample of no-load state.
Operation StateVoltagesSample Number of Training SetSample Number of Test Set
No-load112.7 kV7010
126.0 kV7010
140.9 kV7010
150.0 kV7010
152.0 kV7010
154.0 kV7010
154.9 kV7010
155.0 kV7010
Table 4. Identification results of the no-load state.
Feature Extraction MethodClassification
Algorithms
Accuracy of the
Training Set (%)
Accuracy of the Test Set (%)Computing Time (s)Time Required for One Interation (s)
FFTELM76.607177.500040.78400.4078
SVM91.9643100.000042.00140.4200
BPNN73.571475.000025.71550.2572
DBN87.500087.500031.88400.3188
GA-DBN90.892993.750037.69750.3770
SSA-DBN91.7857100.000034.22500.3423
WPDELM83.750055.000048.32140.4832
SVM89.821462.500043.00440.4300
BPNN75.000050.000028.61840.2862
DBN85.714378.750031.11200.3111
GA-DBN79.464387.500038.05870.3806
SSA-DBN82.500086.250033.53620.3354
TDIELM77.678631.250038.21540.3822
SVM80.357150.000050.38270.5038
BPNN83.928637.000029.13030.2913
DBN94.464362.500030.19760.3020
GA-DBN88.035762.500037.44450.3744
SSA-DBN90.357170.000035.07050.3507
FFT + WPD + TDIELM96.428687.500038.27730.3828
SVM95.357187.500044.81570.4482
BPNN96.607185.000030.26920.3027
DBN100.000091.250033.47480.3347
GA-DBN100.000092.500041.59720.4160
SSA-DBN100.0000100.000038.01850.3802
Table 5. Samples in the on-load state.
Operation StateCurrentsSample Number of Training SetSample Number of Test Set
On-load1130 A7010
1470 A7010
1910 A7010
1920 A7010
Table 6. Identification results for the on-load state.
Feature Extraction MethodClassification
Algorithms
Accuracy of the Training Set (%)Accuracy of the Test Set (%)Computing Time (s)Time required for One Iteration (s)
FFTELM67.142970.000040.64420.4064
SVM69.642967.500044.46610.4447
BPNN81.428680.000056.29290.5630
DBN81.428685.000032.09620.3210
GA-DBN83.928685.000040.90890.4091
SSA-DBN82.500087.500026.55240.2655
WPDELM77.142980.000050.28130.5028
SVM89.285787.500046.25220.4625
BPNN87.857185.000064.38860.6439
DBN82.142990.000032.35610.3236
GA-DBN95.714392.500040.46190.4046
SSA-DBN92.500095.000028.29660.2830
TDIELM62.857177.500038.42530.3843
SVM75.357182.500045.17970.4518
BPNN86.071485.000067.61950.6762
DBN88.214390.000032.31760.3232
GA-DBN86.428695.000037.04660.3705
SSA-DBN90.3571100.000027.19300.2719
FFT + WPD + TDIELM74.285782.500038.93720.3894
SVM88.571495.000045.00650.4501
BPNN88.571490.000068.16340.6816
DBN98.928697.500035.60220.3560
GA-DBN97.8571100.000040.12030.4012
SSA-DBN99.2857100.000031.46030.3146
Table 7. Sample description and distribution of vibration signal of converter transformers.
Operation StateMeasurement PointsSample Number of Training SetSample Number of Test Set
No-loadNL121030
NL221030
NL321030
NL421030
NL521030
NL621030
NL721030
On-loadOL121030
OL221030
OL321030
OL421030
OL521030
OL621030
OL721030
Table 8. Comparison of the efficiency of iterative operation of the different algorithms.
AlgorithmsTime Required for One Iteration (s)
DBN1.0158
GA-DBN1.9747
SSA-DBN1.5677
Publisher’s Note: MDPI stays neutral with regard to jurisdictional claims in published maps and institutional affiliations.

