2.2. Dynamic Model of SVA
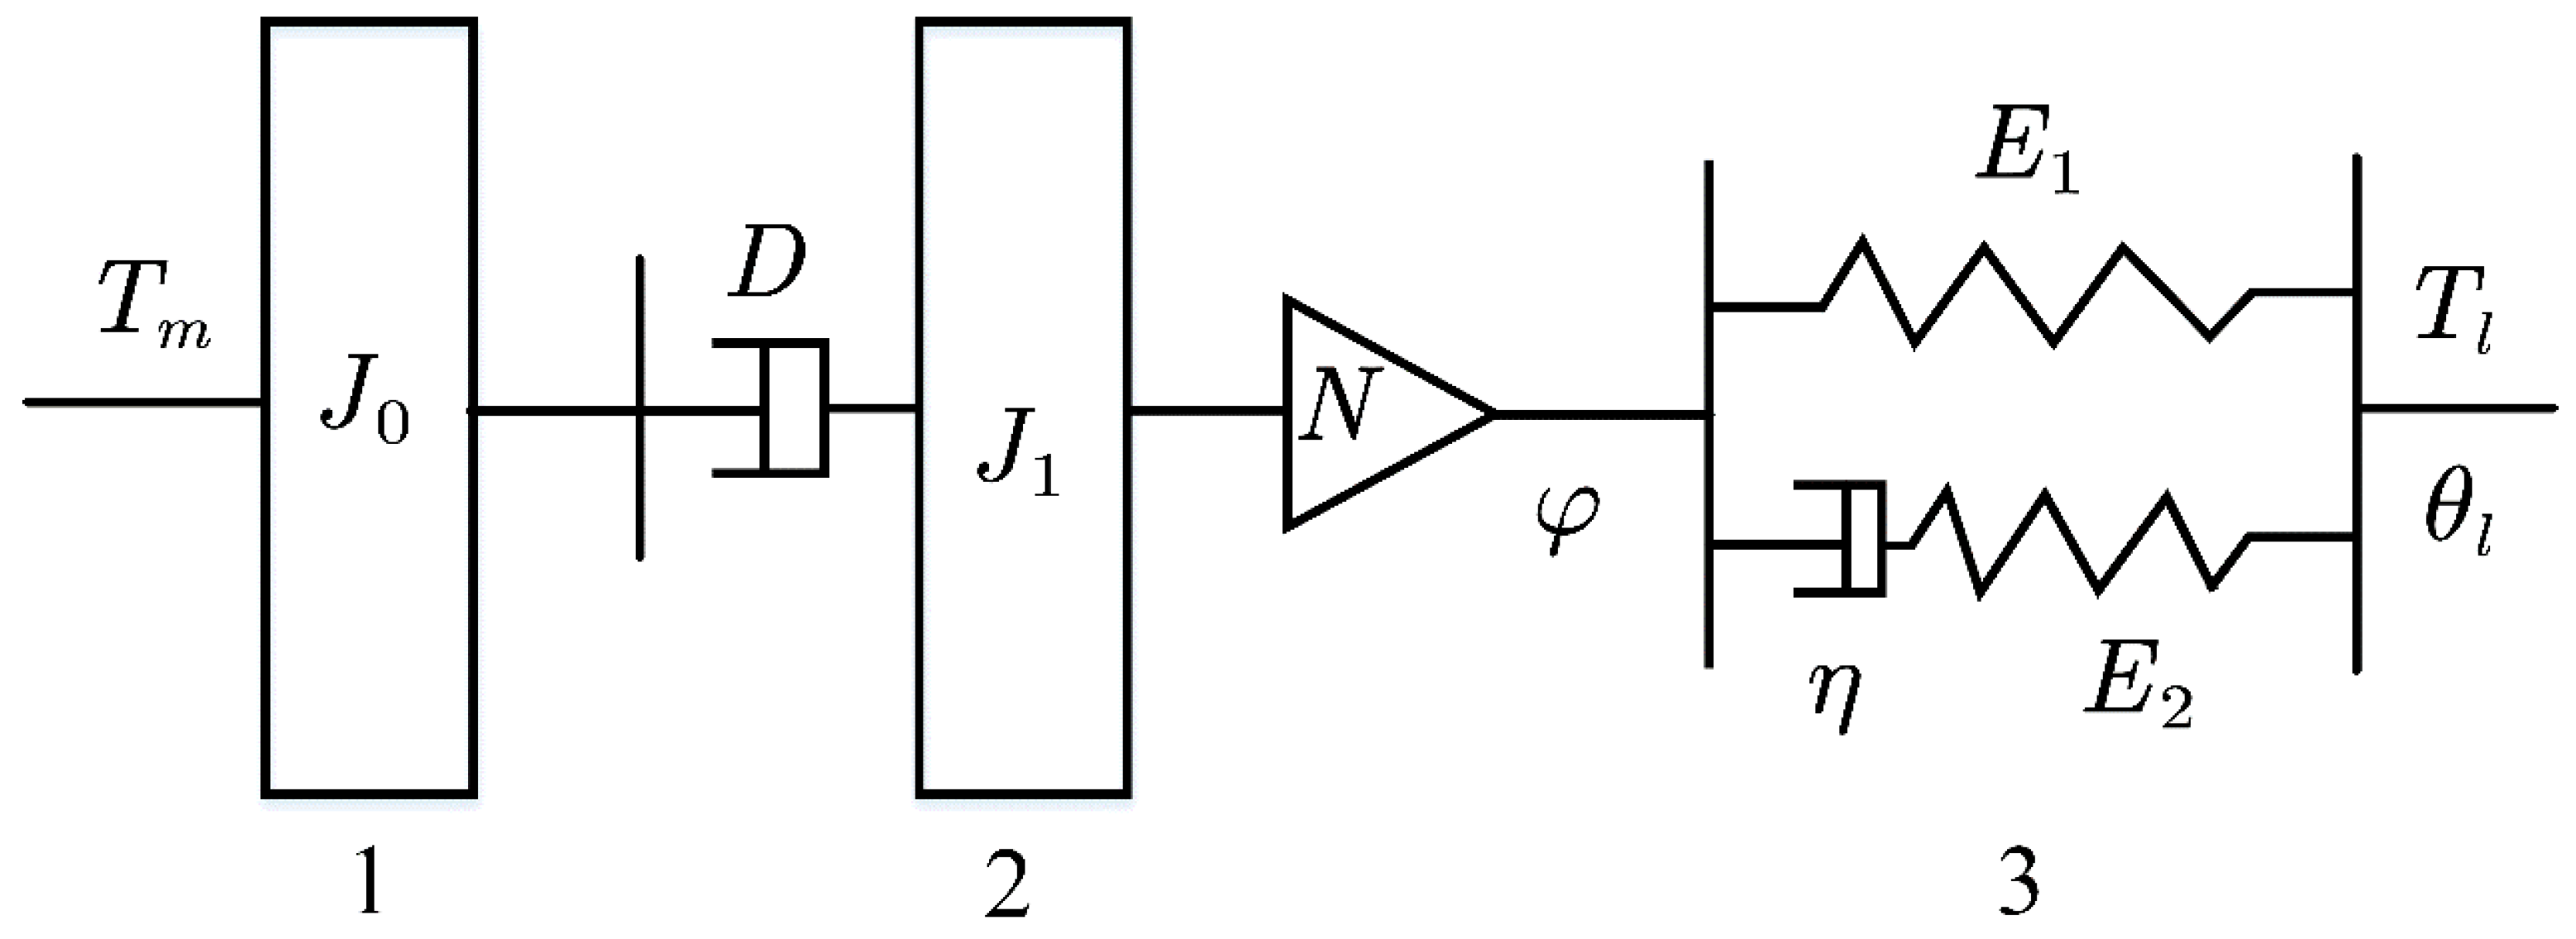
The simplified schematic diagram of the dynamic model of the SVA device is shown in
Figure 2. Due to its good manufacturing process and smaller electrical time constant than the mechanical time constant, the motor can be simplified as a torque source with certain inertia. Although the harmonic drive has a certain degree of flexibility, it is supposed as a rigid body which only contains damping and inertial characteristics because the rubber has higher order of magnitude compliant than harmonic drive. The rubber model adopts the Zenner model. The damping of rubber is caused by the internal friction of rubber molecules belonging to internal damping [
29] and it does not cause system torque loss. Therefore, the output torque of the harmonic drive is approximately equal to the load torque. Thus, the dynamic model of SVA can be formulated as follows:
where
Tm and
Tl are the motor torque and load torque respectively,
J0 is the inertia of the motor rotor, damping
D includes the damping of the harmonic drive and other rotating pairs of the system which is usually a nonlinear function of
.
J1 includes the inertia of harmonic drive.
N is the reduction ratio.
,
,
are angular acceleration, angular velocity and angular position, respectively.
The motor output torque
Tm is proportional to the q-axis torque current
Iq which is calculated through Clarke and Park transform by the three-phase current collected from the motor drive board. The proportional coefficient is the motor torque constant
C. The first item on the right side of Equation (1) is the torque loss caused by the inertias of the motor and the harmonic drive for acceleration. The second term on the right is the torque loss caused by damping, which originates from the harmonic drive and other motion pairs. The influence of the damping term is mainly manifested as the system friction torque
Tf. It can be indicated from Equation (1) that the torque estimation accuracy depends on the measurement error of the inertia
J0,
J1, angular velocity acceleration
, and damping coefficient. The inertias of motor and harmonic drive are difficult to measure accurately. The angular accelerations which are obtained by second-order differential of angular values are unable to be used because the measurement noises from encoder will be amplified by two orders. As a consequence, the estimation error of the inertia term (
NJ0 + J1)
is usually too large to be accepted. The reliable way to acquire output torque of SVA by motor current is to perform the calculation when angular acceleration equals to zero. In such a situation, the dynamic model of SVA can be simplified as Equation (2) in which the inertial term is out of consideration.
2.3. Model of the Rubber Element
An alternative way to directly acquire the output torque
Tl of SVA is to utilize the rubber element. The rubber-based torque estimation is based on the constitutive equations [
30]. Parameters of the constitutive equation are derived from different geometric structures with the help of tools such as calculus to show the macroscopic mechanical properties of the rubber.
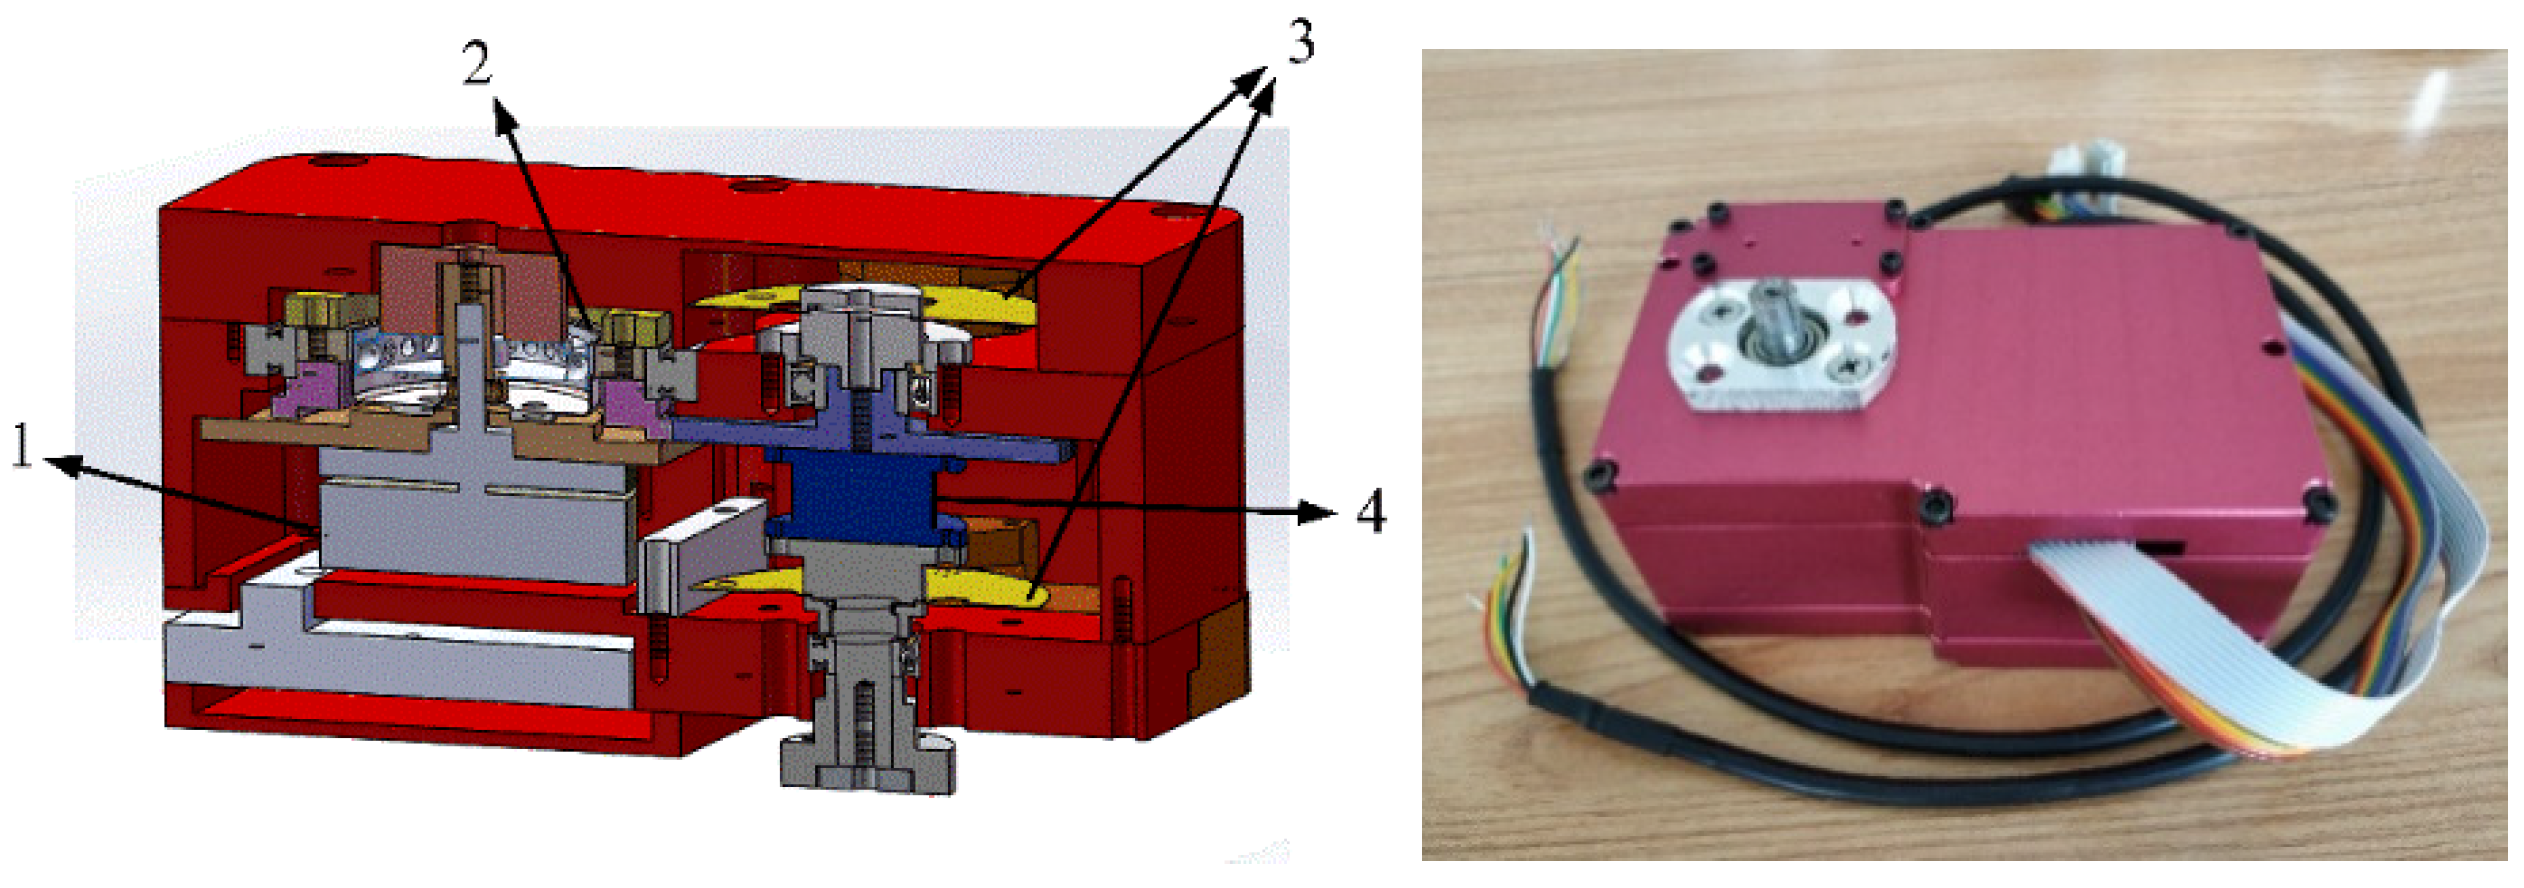
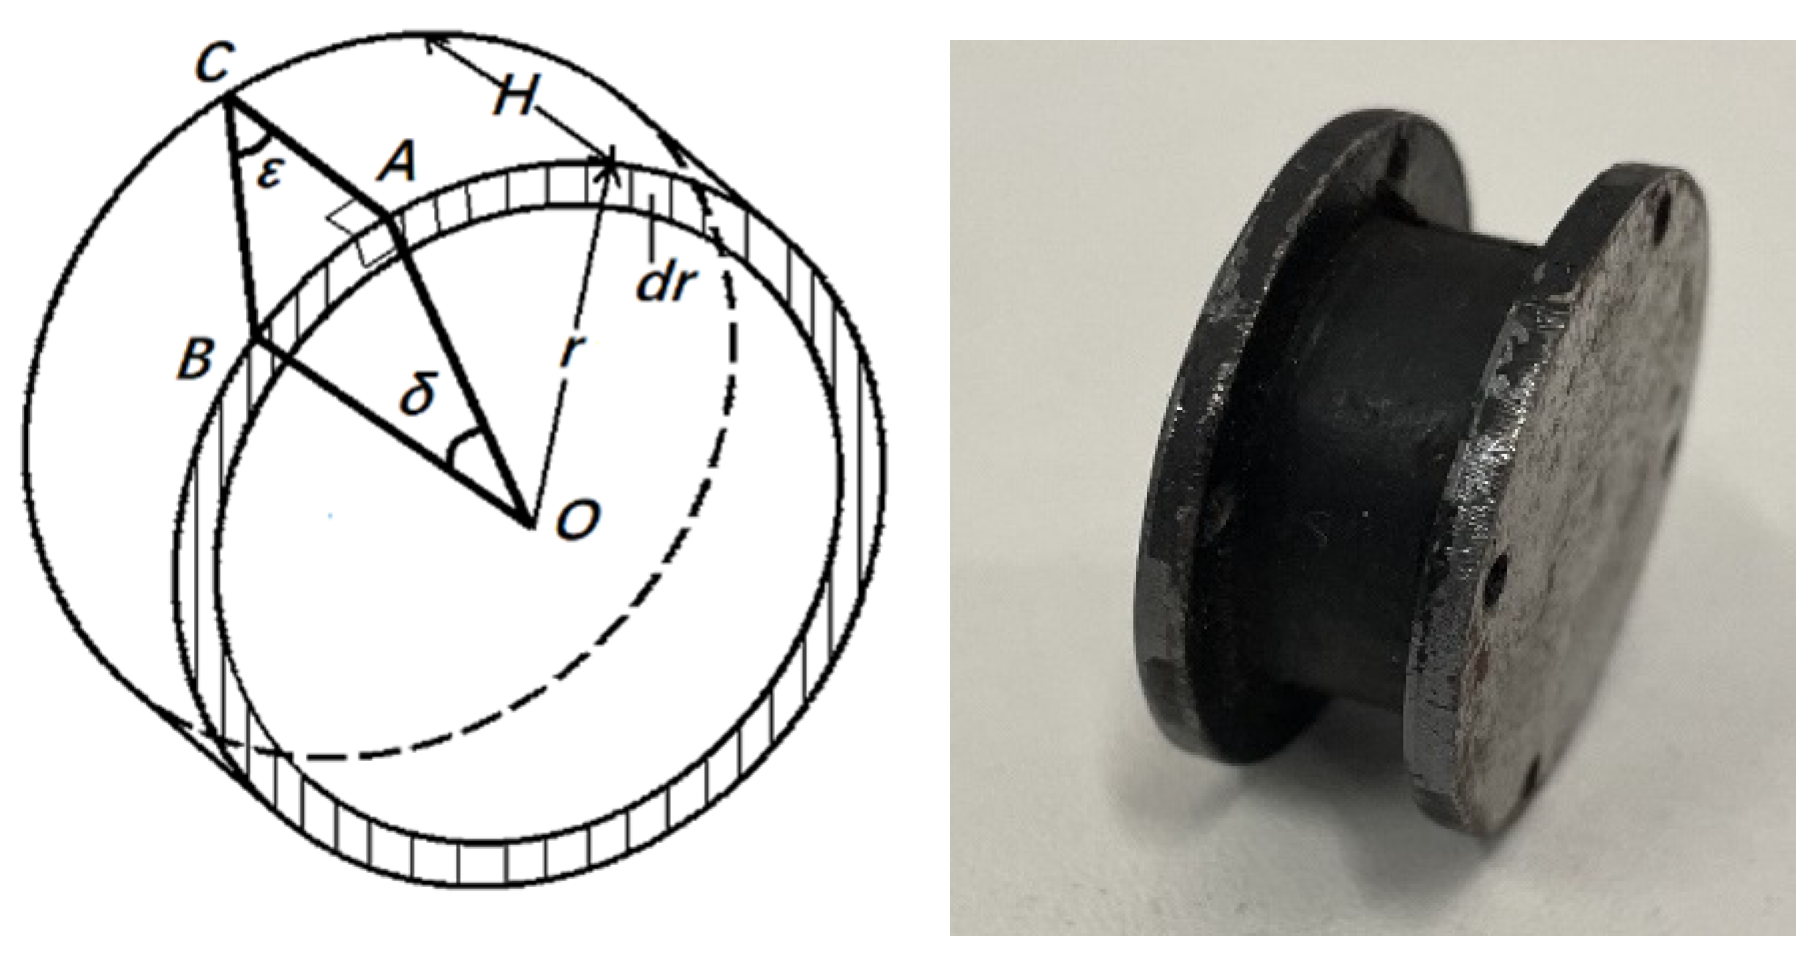
The left picture of
Figure 3 shows a model figure of the designed rubber viscoelastic element which has a simple geometric shape, a cylinder with a radius of
R and a height of
H. The rubber used in SVA is shown in the right of
Figure 3. Input torque
T produces torsional deformation
δ on the rubber cylinder part. A micro ring with a radius of
r and a width of
dr is taken on the torsion end surface. It can be assumed that the stress
σ and the shear strain
ε of each point on the micro ring are identical because of the occurrence of concentric torsion. During the deforming process, the shear strain
ε can be obtained at point
B according to the geometric relationship of the rubber cylinder. Since the micro ring width
dr is very small, the area
S can be approximated to be
2πrdr. Assuming that the shear stress at each point of the micro-ring is
σ and the arm length is the radius
r, micro torque and shear strain can be calculated as follows:
where
AC,
δ,
r,
σ are arc length, thickness of rubber, torsional deformation, radius, and stress, respectively. The rubber material satisfies the Zenner model, and its constitutive equation is shown as follows:
where
η,
σ,
ε are damping coefficient, stress, strain of Zenner model, respectively, and
E1 and
E2 are elastic coefficient of Zenner model. Substituting Equation (3) into Equation (4), constitutive equation of the Zenner model can be transformed as follows:
Output torque
T of rubber is obtained by integrating micro torque
τ on the radius
r. If we integrate both sides of Equation (5) at the same time, the relationship between the torsion end face torque
T and the torsion angle
δ can be obtained as follows:
where Zenner constitutive model parameters
E1,
E2 and
η are related to the material properties; it is relatively difficult to measure them directly. By the means of simplification, Equation (6) can be rewritten into Equation (7) to reduce the number of Zenner model parameters. These synthesis parameters are represented as relaxation coefficient
a, damping coefficient
b and stiffness coefficient
c in Equation (7), and can be identified through system identification method:
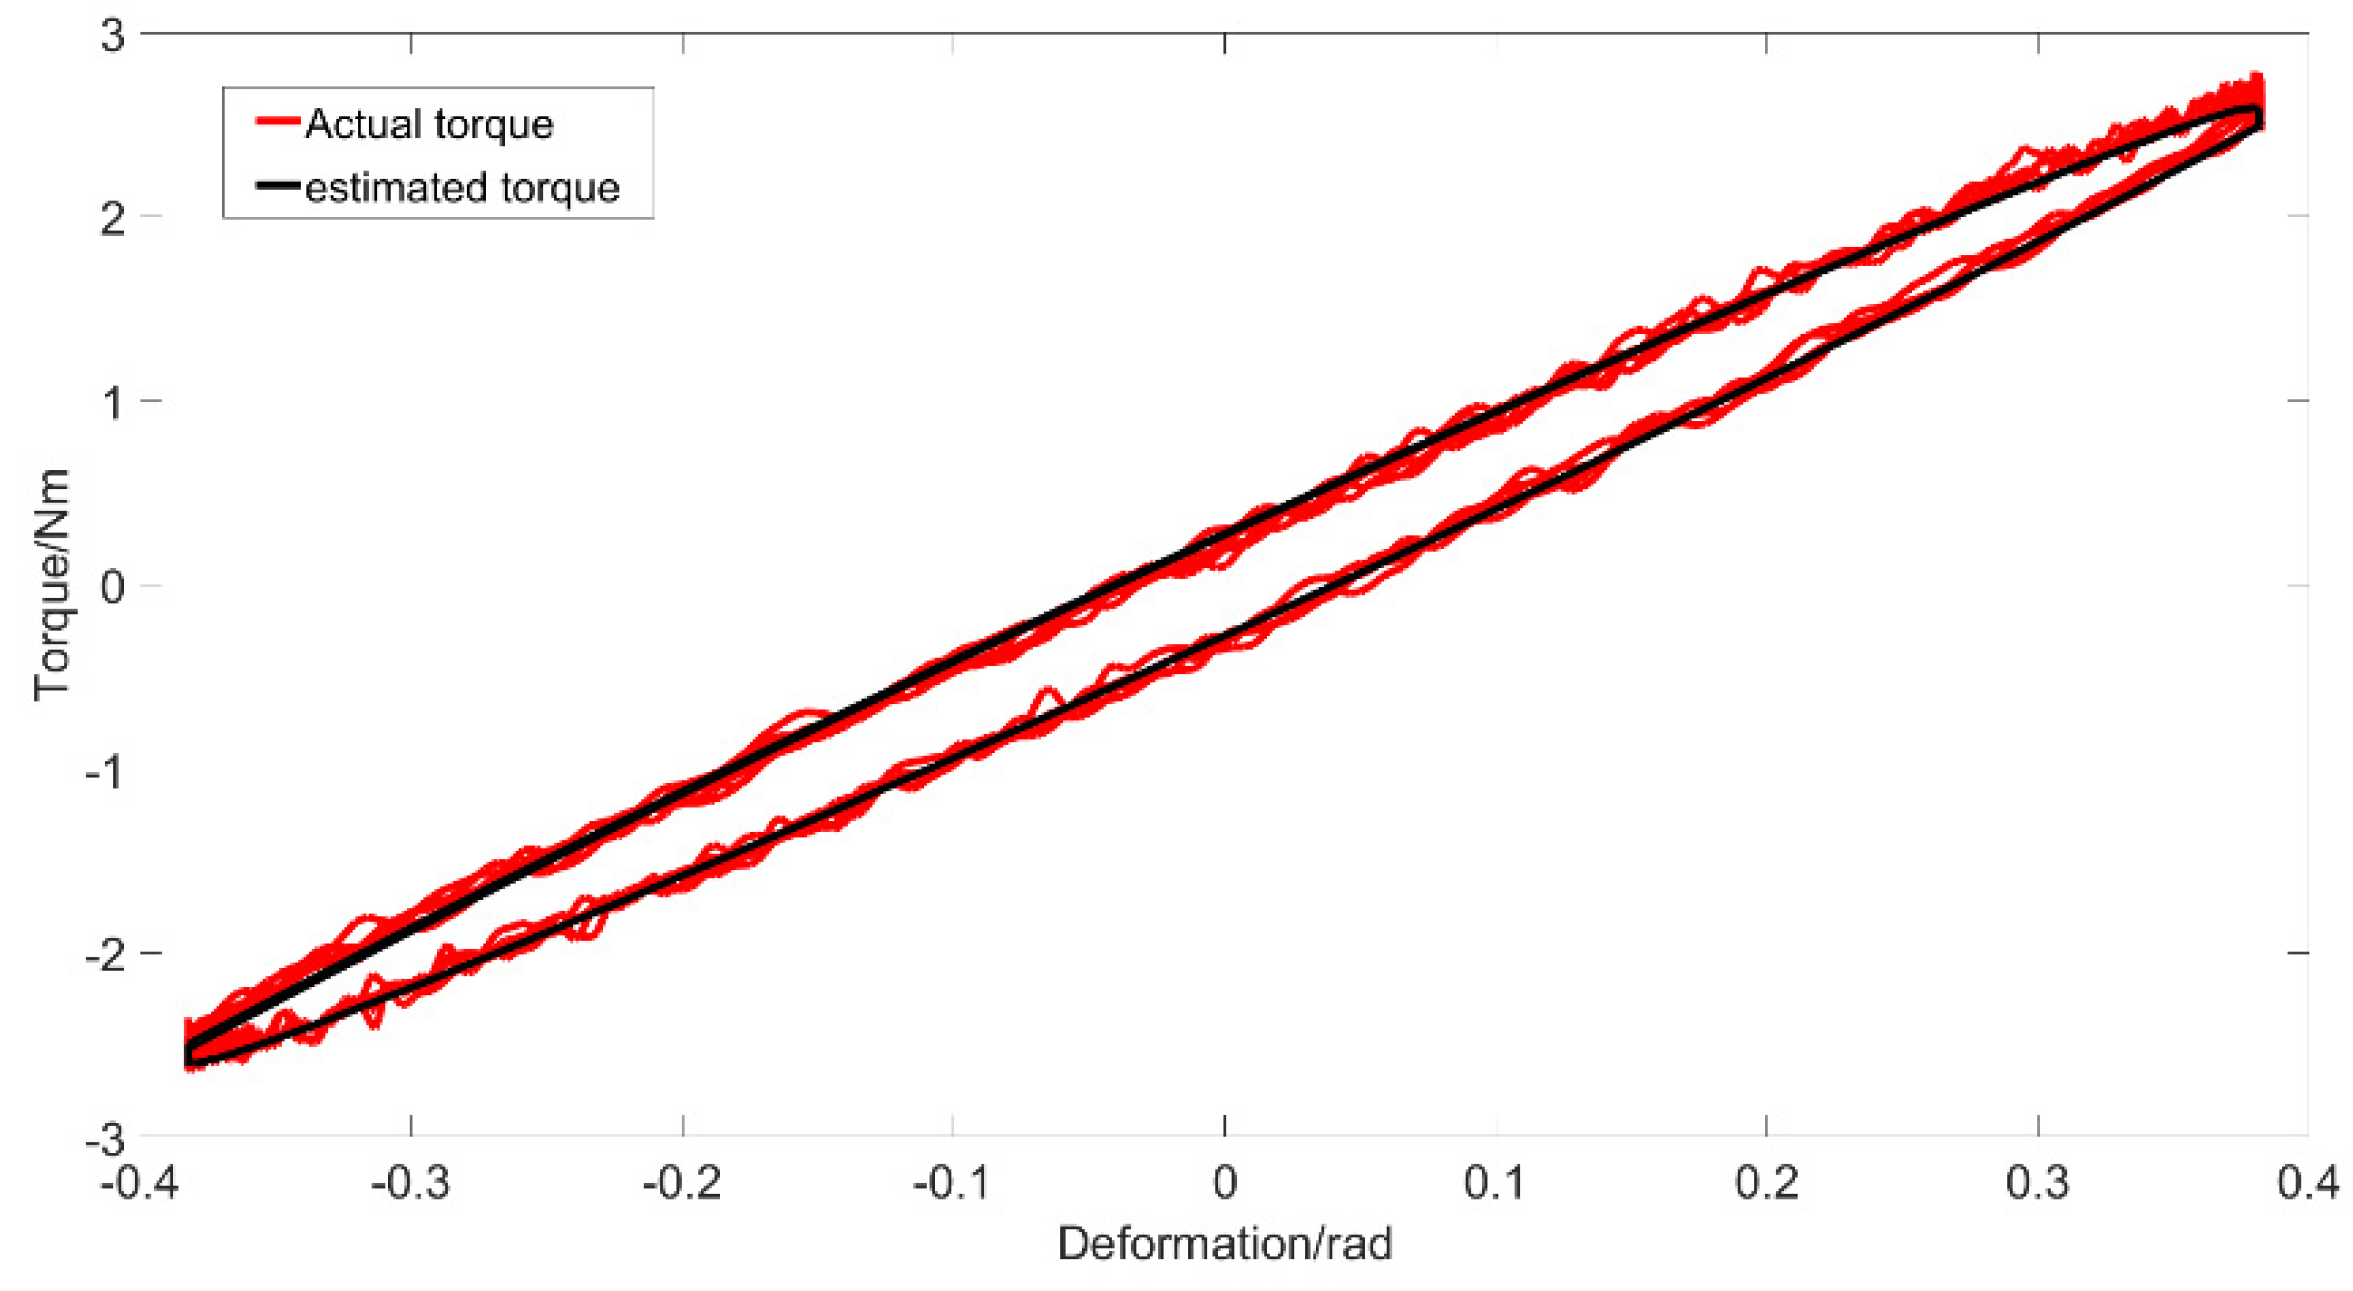
In order to facilitate parameter identification and ensure that the results are suitable to various conditions, the variation range of input signals should be large enough. The sinusoidal signal is often used as a test signal because of its continuous and regularly varying amplitude. A sine signal, as shown in Equation (8), is taken as the excitation signal for system identification. When a sinusoidal excitation signal with frequency of 1 Hz and amplitude of 0.4 Nm is input to the rubber cylinder part, the deformation range can reach to ±0.40 rad and the deformation rate can reach to ±2.41 rad/s. This basically covers most of the expected operating conditions of our SVA.
The sampling period
Ts of output torque is set to 0.01 s, and Equation (7) can then be discretized as follows:
where
T and
δ are output torque and rubber deformation. Supposing the parameter vector
θ = [
a1,
b1,
b2] and the output vector
Y = [
T1,
T2, …,
TN]
T, the least squares estimation of the parameter vector can be obtained as
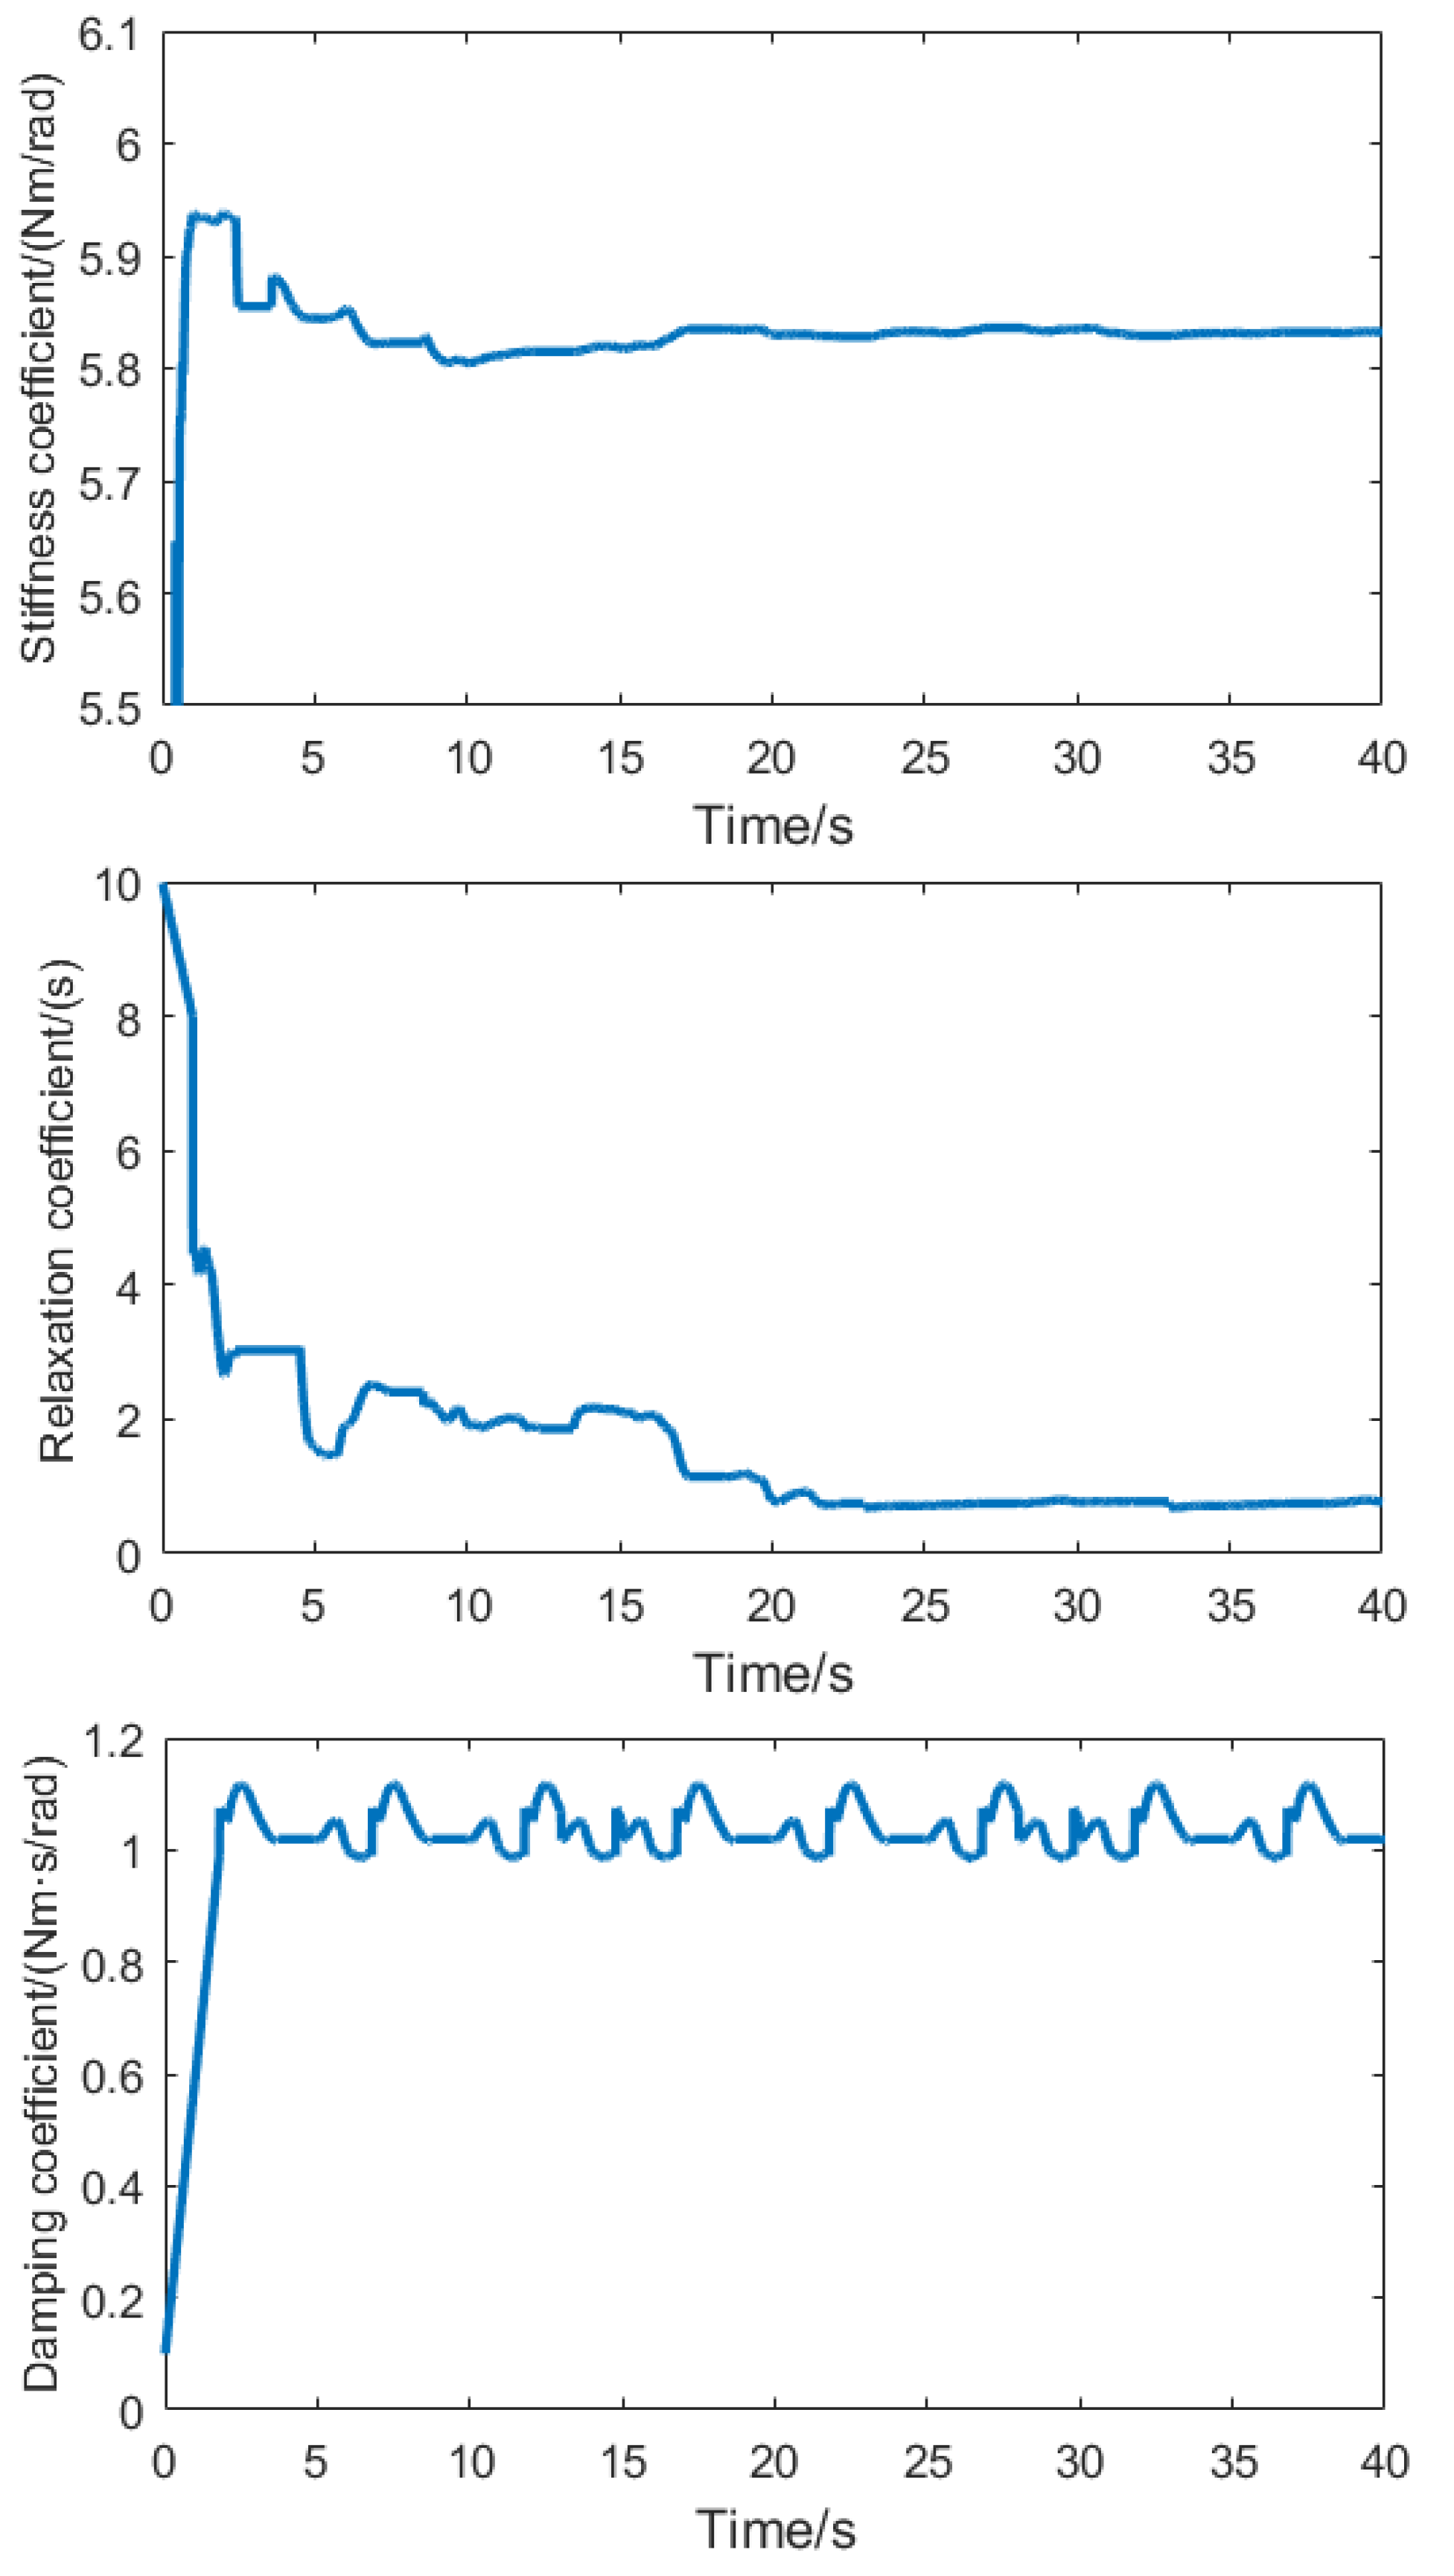
. We took the experimental data with sampling length
N = 1000 to perform the parameter identification and got [
a1,
b1,
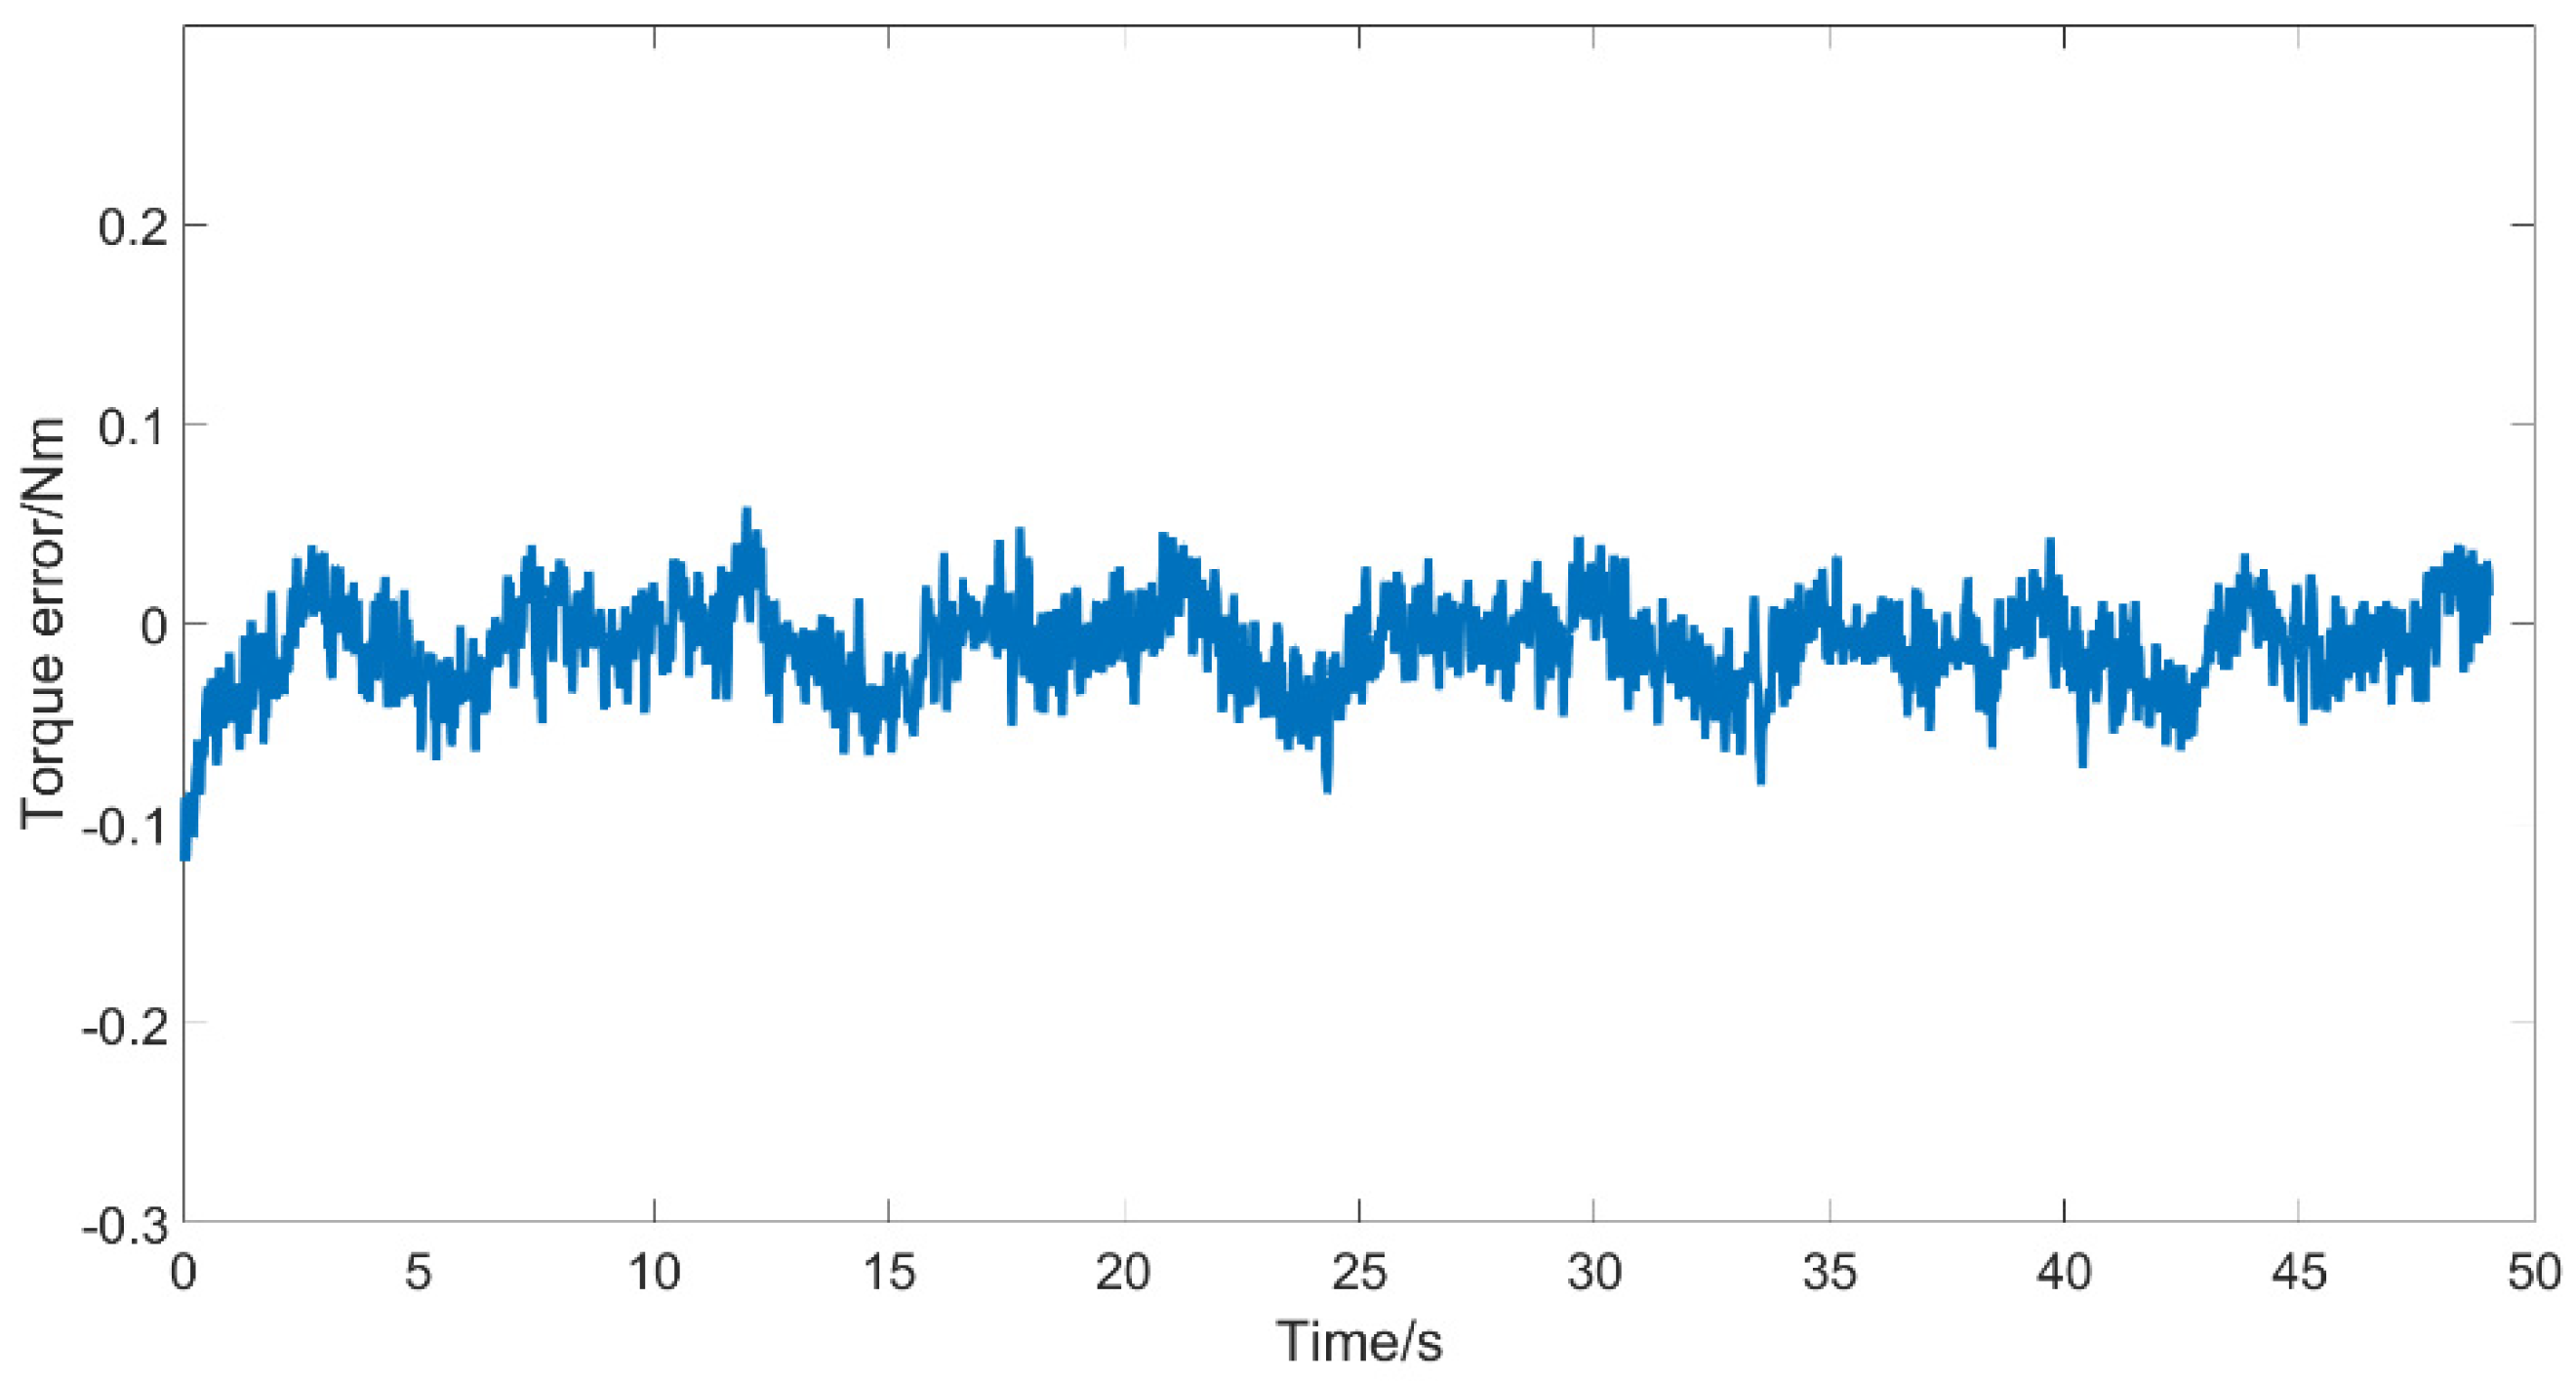
b2] = [0.9873, 1.415, −1.34], accompanying with 0.028 Nm standard deviation error and 0.033 Nm residual error of estimation (the detailed results can be found in
Section 3, Figure 10). Combining with Equation (9), the parameters [
a, b, c] of our rubber-based torque estimation model in Equation (7) can be obtained as [0.7764, 1.055, 5.832]. It is important to note that values of parameters depend on the rubber utilized.
2.4. Harmonic Drive Friction Compensation
Nonlinear friction of transmission part composed by harmonic drive is the main factor that affects the current-based torque estimation. As current-based torque estimation is the only observation in our SVA system, it is essential to compensate the friction caused by harmonic drive to improve the observation accuracy.
Harmonic drive friction is specifically generated between the wave generator and the flexible wheel, between the flexible wheel and the fixed rigid wheel, and between the shaft and the bearing. Establishing the friction model of the harmonic drive is the key to realize friction compensation. The most widely used one is the Stribeck exponential model, which describes the friction force as a function of speed, with a fitting accuracy of 90% for general friction force [
31]. However, the transmission mode of the harmonic drive is complex and its friction characteristics are difficult to be described only as a function of speed.
The friction torque of harmonic drive has to be recorded if we want to build a detailed friction model. It is inconvenient to install a torque sensor to measure the friction torque directly in harmonic drive. As a result, an indirect measurement method based on motor current is adopted in our case. It can be indicated from Equation (2) that the motor current
Iq only responds to overcome the friction torque when the motor runs at a constant speed and with no load. Thus, the friction of harmonic drive can be obtained as follows:
In this way, Iq was calculated through Clarke and Park transform by the three phase current collected on the motor drive board, and it can be used to indirectly estimate the friction torque under no-load steady working conditions.
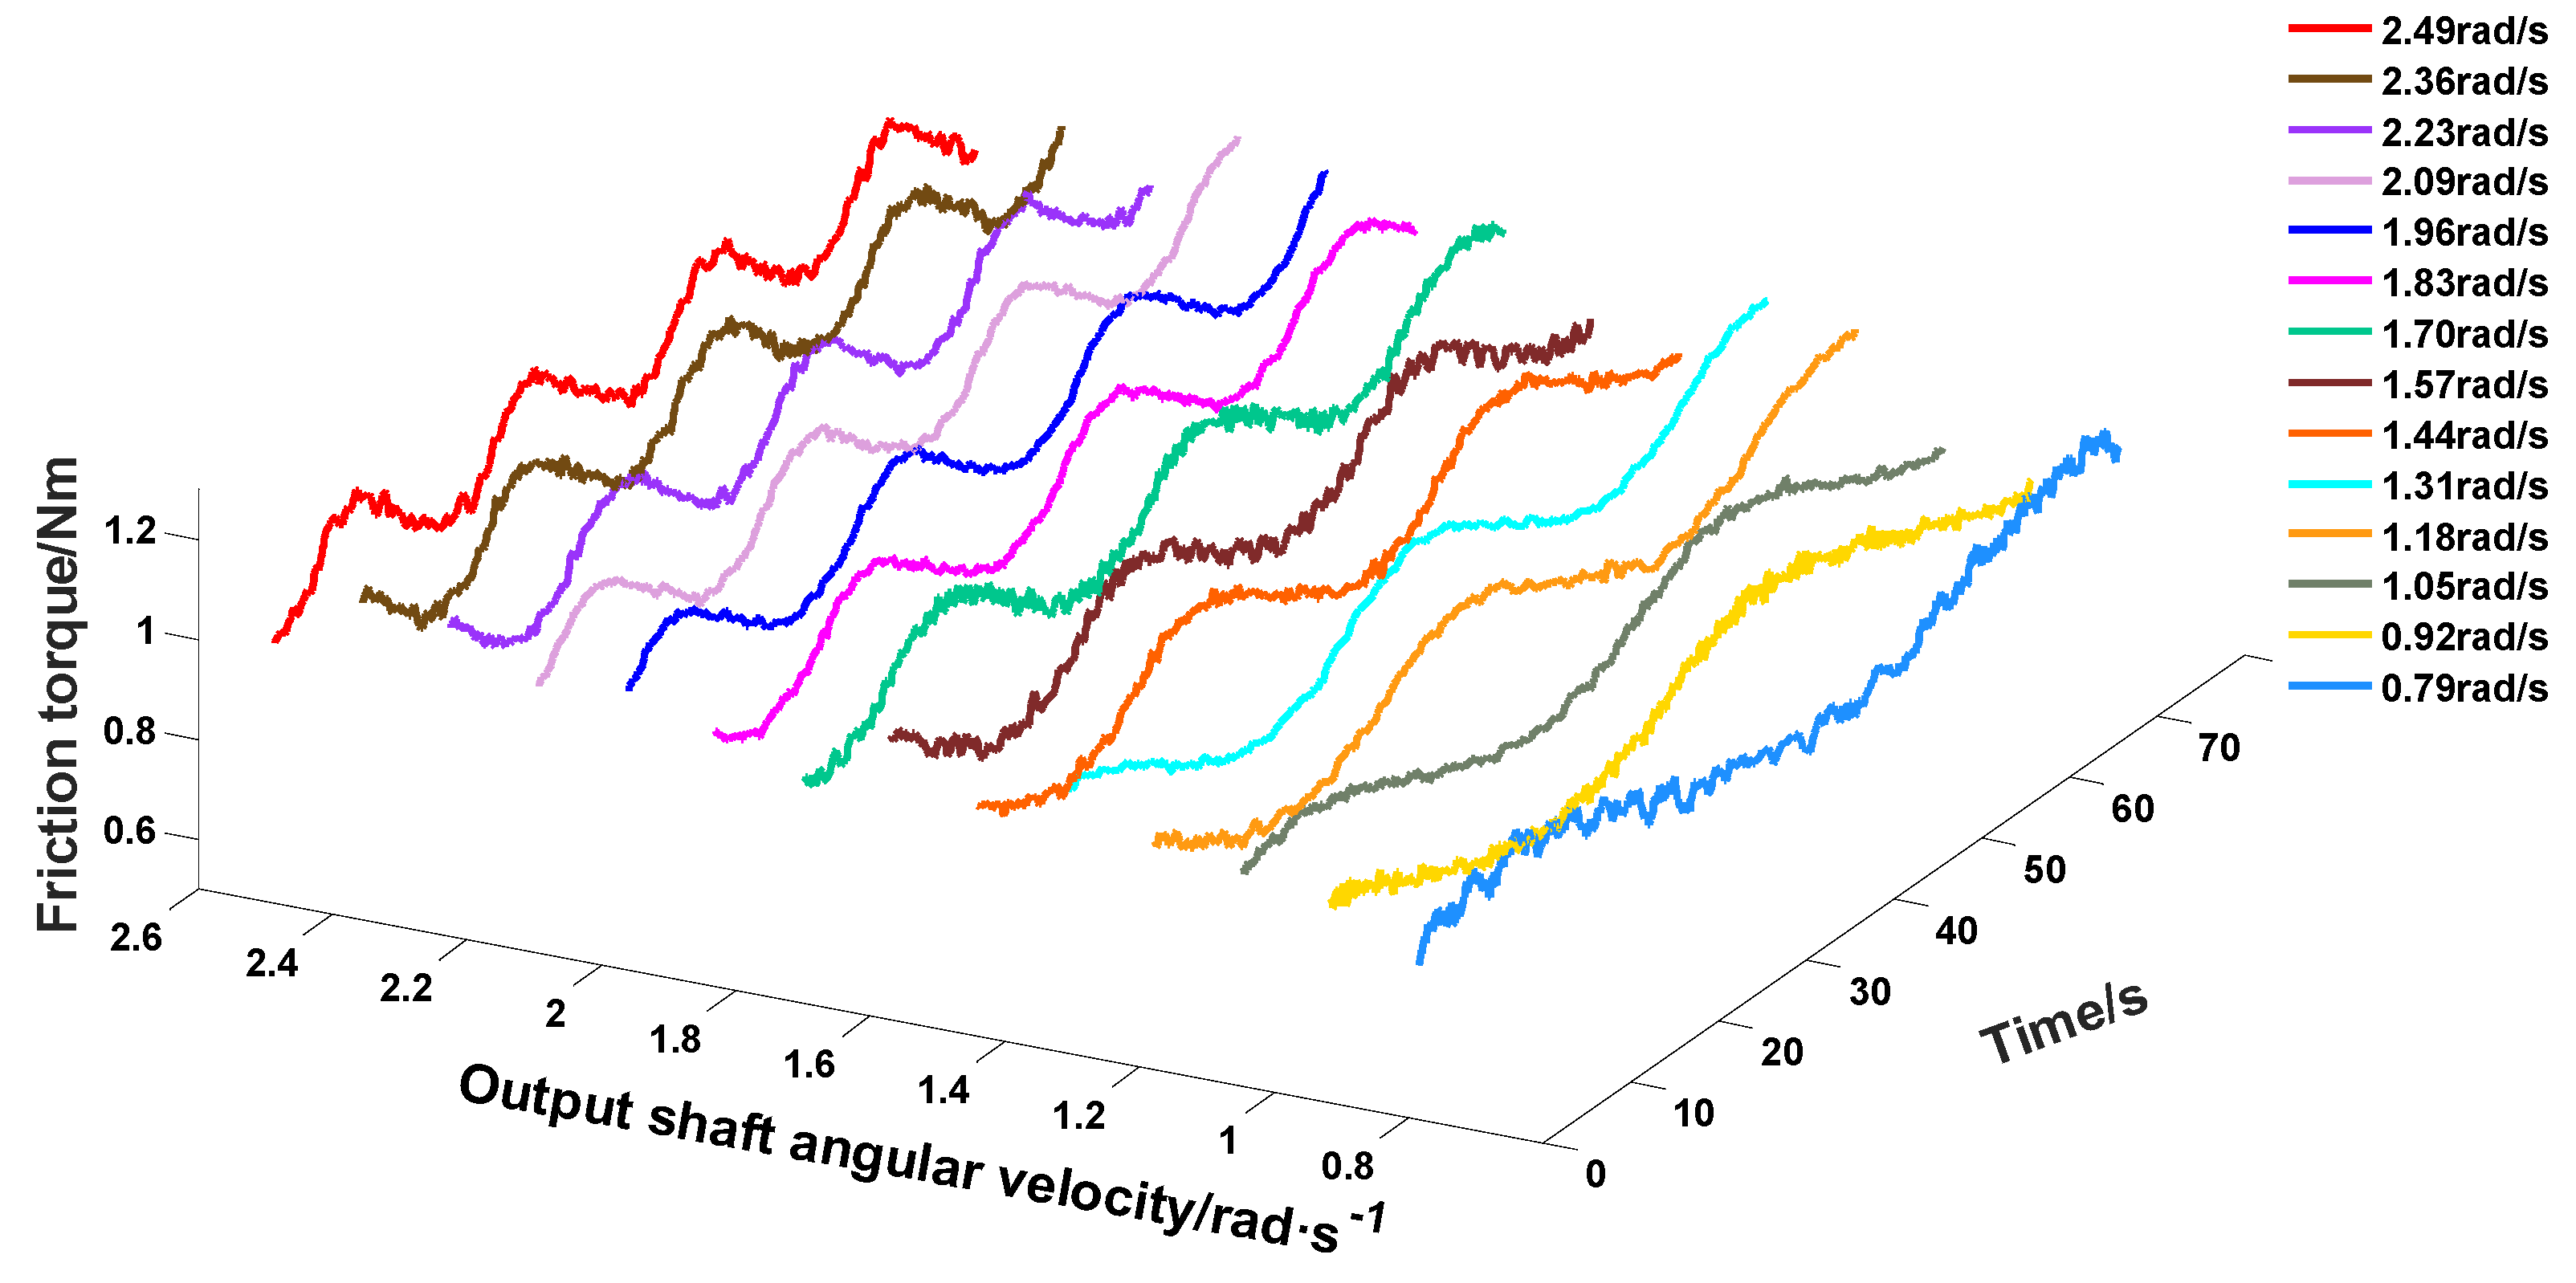
In order to obtain the relationships between harmonic drive motion and friction, SVA is controlled to work at various velocities without load. The three-dimensional curves of friction torque, motor speed, and running time are depicted in
Figure 4. Each curve represents the friction torque behavior at a specific speed. As the speed increases, the average amplitude of the friction torque shows an increasing trend, indicating that the friction includes a speed-related part. It can also be noted that the fluctuation trend of friction changes is approximately sinusoidal at the same speed. In order to verify that this experimental phenomenon is mainly caused from the harmonic drive, rather than the cogging torque, we also measured the output torque of the motor without harmonic drive at the same speed shown in
Figure 4. Experimental results shown in
Figure 5 explained that the magnitude of the cogging torque is far less than that via using the harmonic drive. Considering that the angular position also changes periodically with time at a constant angular velocity, we assume that the dynamic friction torque is also related to angular position. Thus, the dynamic friction Tf of the harmonic drive is modeled as follows:
where the left term on the right side of Equation (11) represents the velocity-related part and the right term denotes the position-related part.
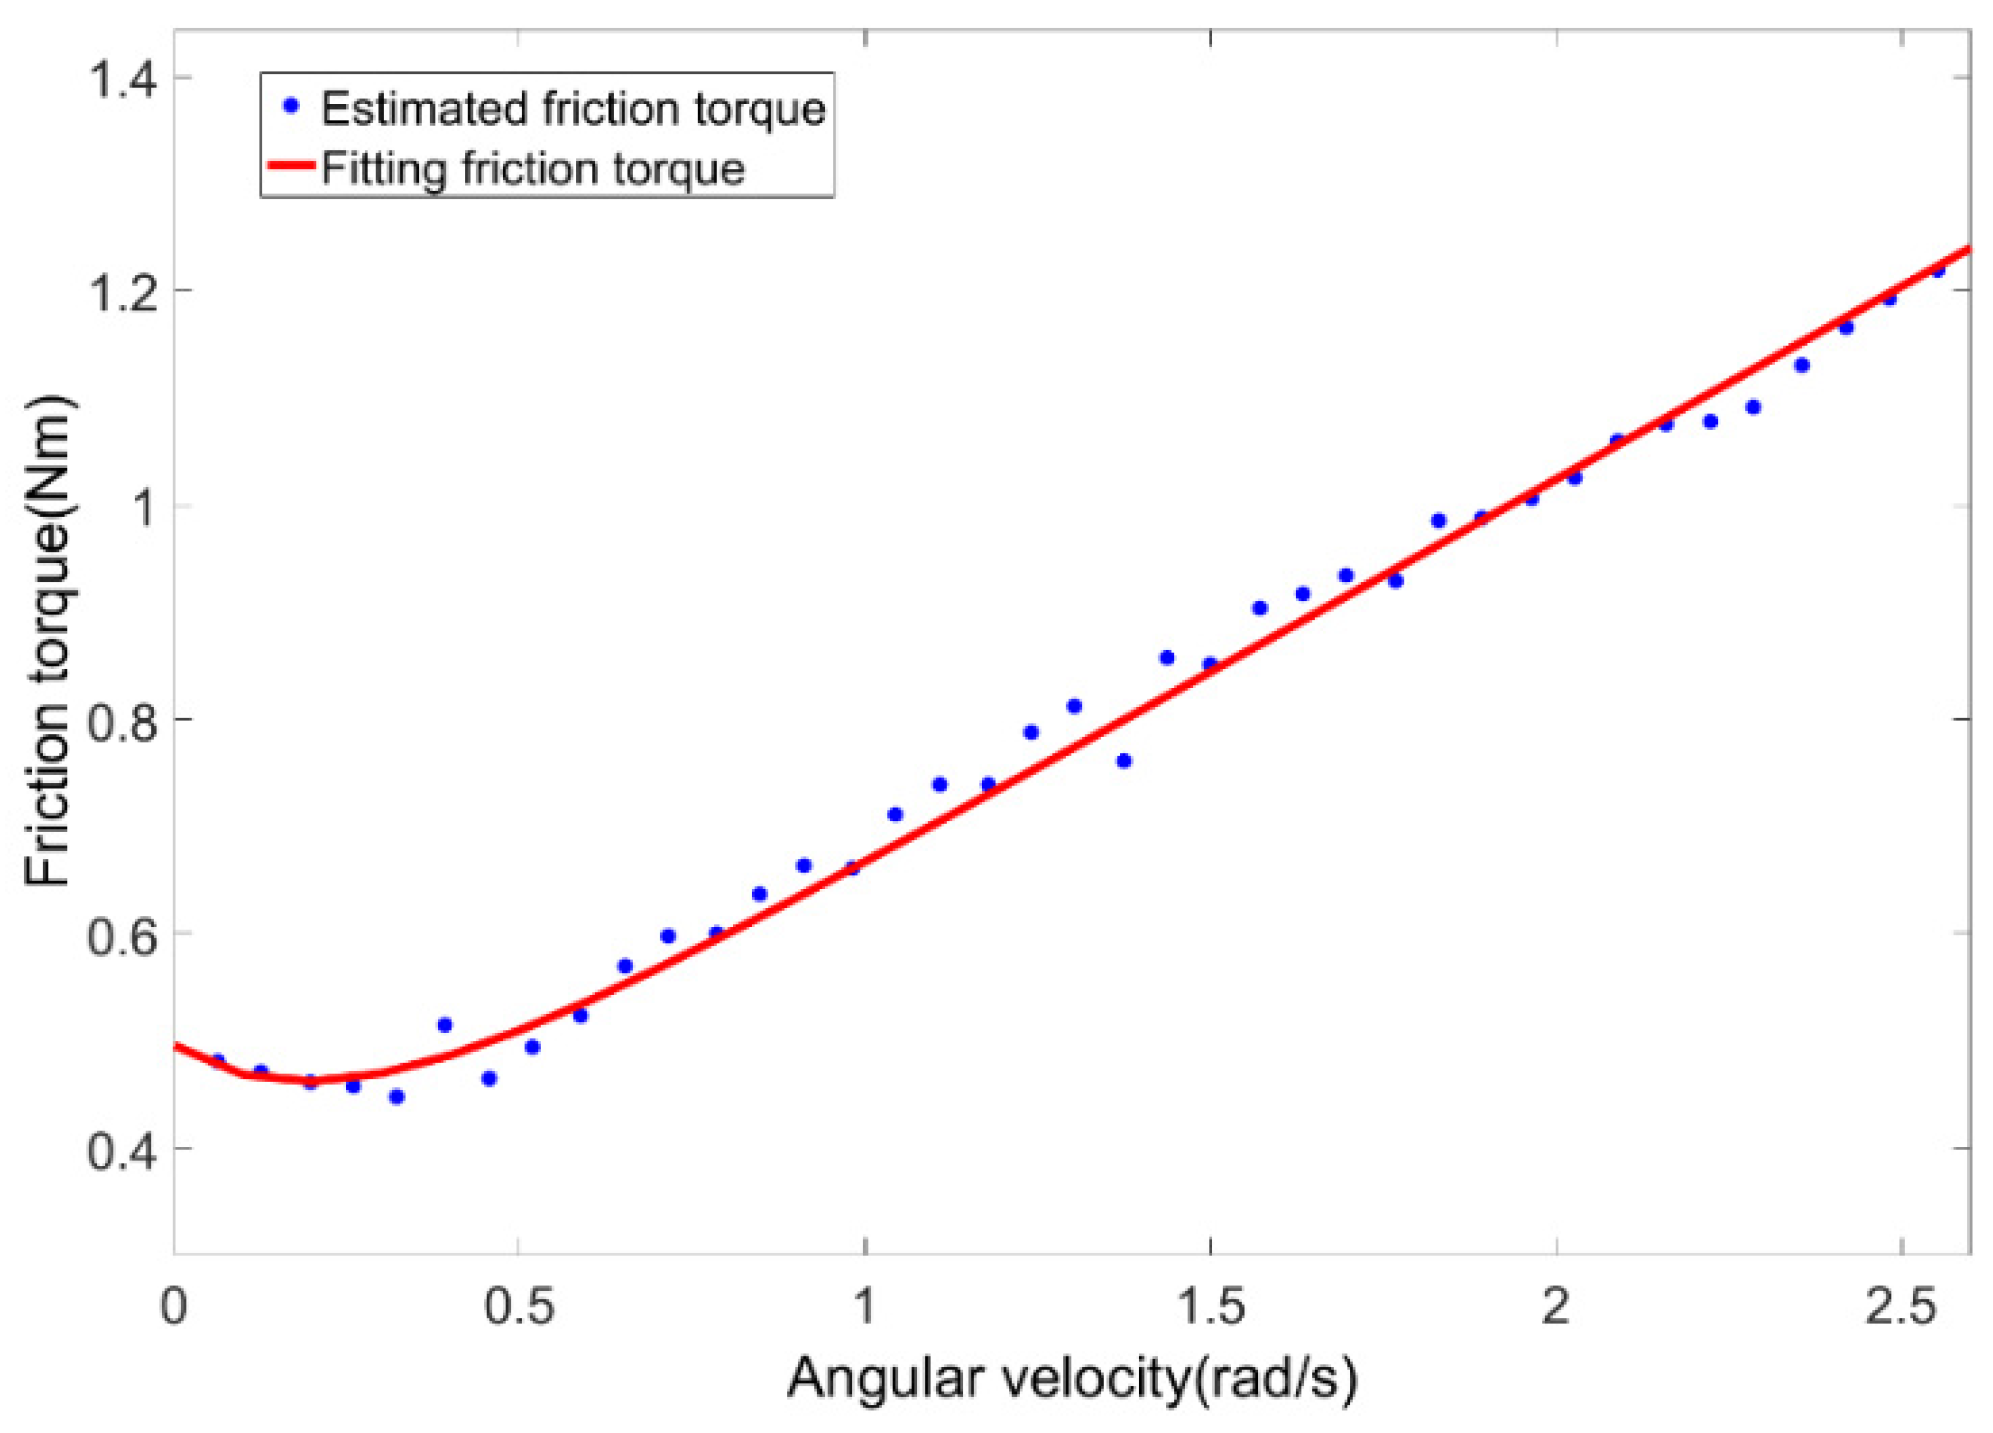
Currents and angular position data at speed of 1.31, 1.57, 1.83 and 2.09 rad/s are used to identify both terms in Equation (11). The velocity-related term is considered as an offset for Equation (11) and it can be calculated by averaging the friction value recorded in a sufficient long period. We input stepped angular velocity commands which ranged from 0.1~2.6 rad/s with step length of 0.1 rad/s and duration of 100 s. The curve of velocity related friction torque was estimated (shown in
Figure 6) to be compared with the Stribeck friction model (shown in
Figure 7). It can be indicated from
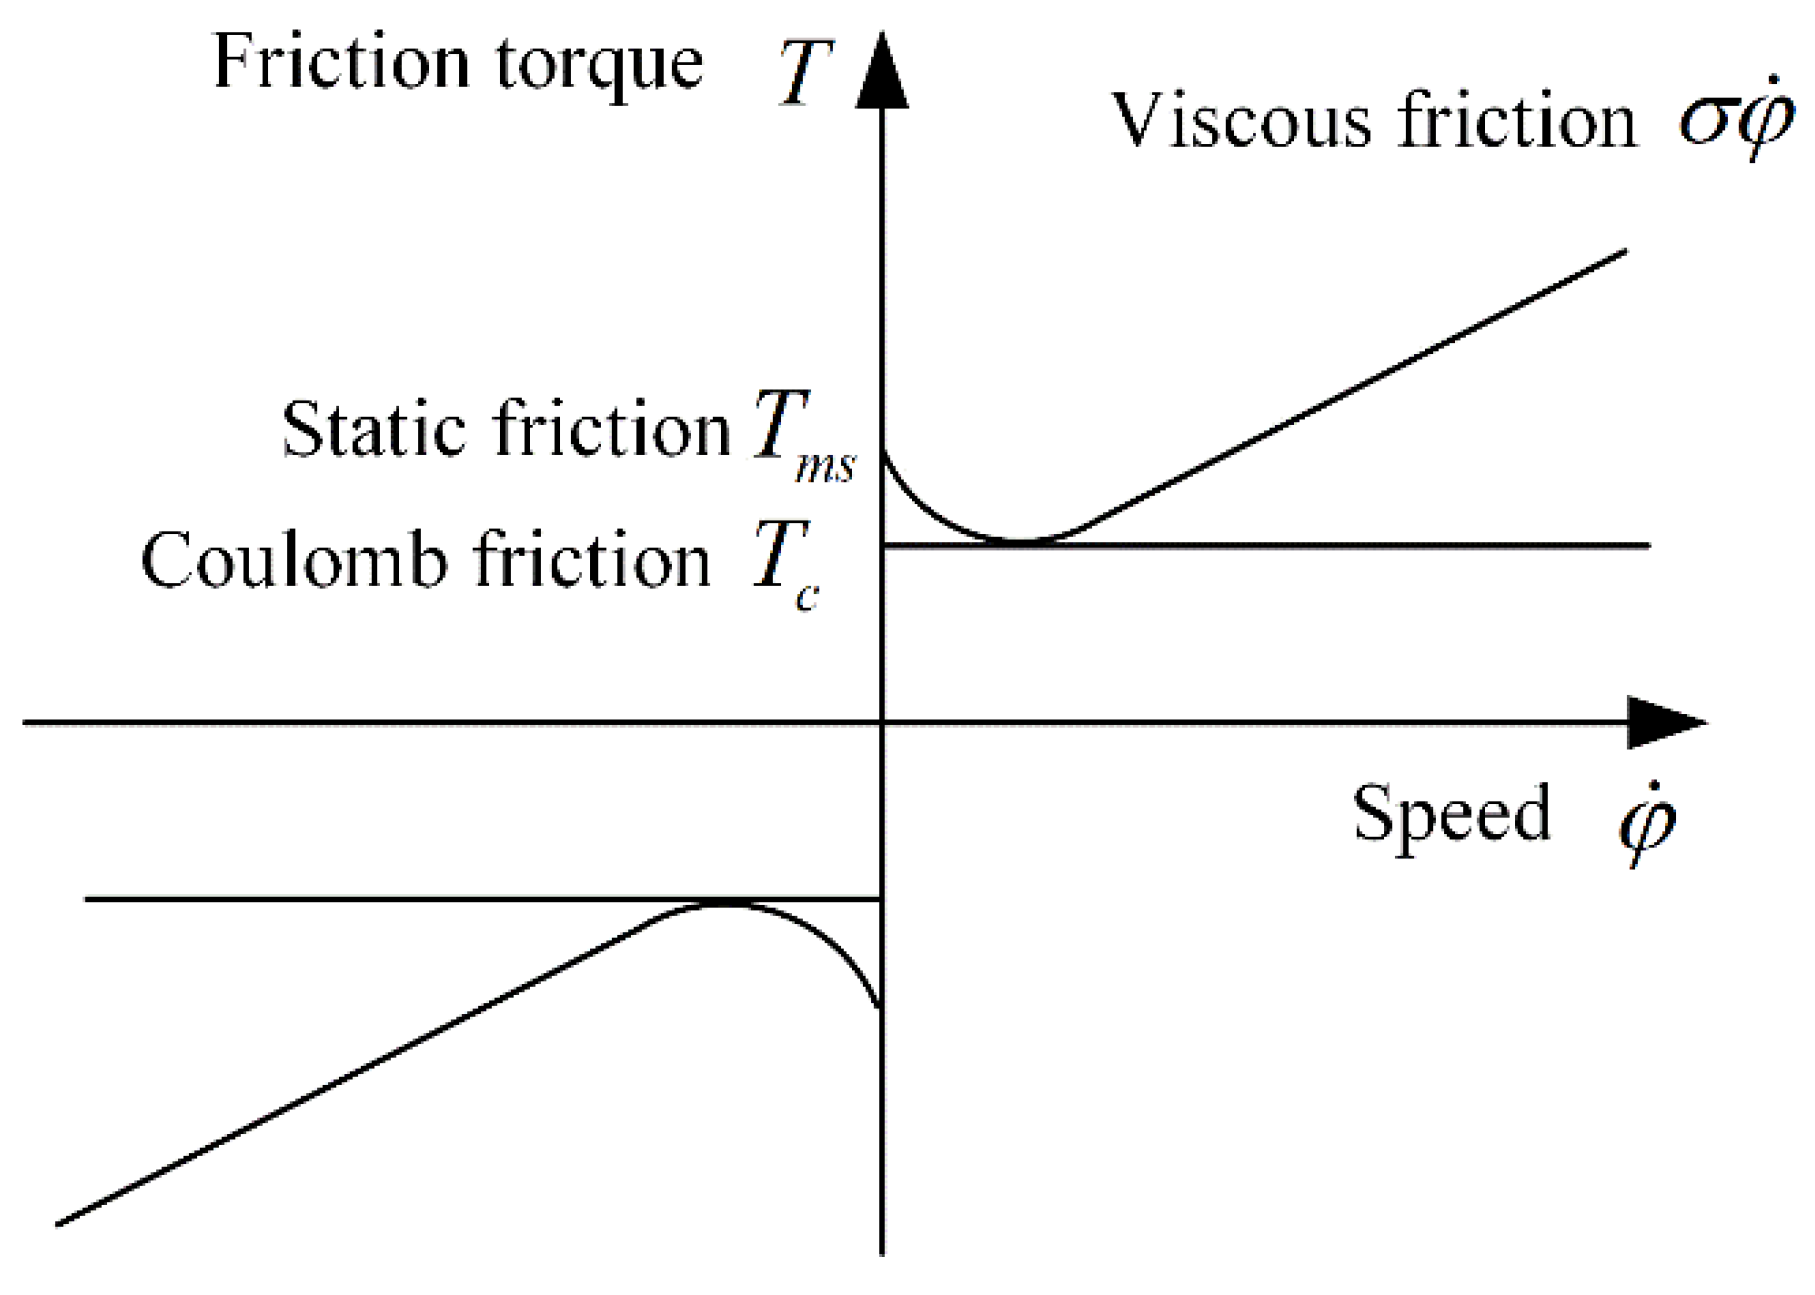
Figure 6 that the velocity-related friction fits Stribeck friction model well. Thus, Stribeck friction model, presented as follows, is adopted to model the velocity-related term.
The parameters of the Stribeck friction model have clear physical meanings. Tc is the Coulomb friction torque, Tms is the maximum static friction torque, σ is the viscous friction factor, when is large enough, σ is equivalent to the tangent slope, is the Stribeck velocity, is the abscissa of the intersection of the tangent line passing intercept Tms and the horizontal line passing through Tc, and δ is an empirical parameter.
In this paper, the value of
δ is set to 1 according to the Tustin empirical model [
32]. Although the model is a nonlinear function which is not convenient to system identification, most of the parameters can be determined directly through their physical meanings.
Tc can be obtained as 0.430 Nm from the intersection point of the horizontal line passing
and the vertical axis in
Figure 6.
Tms which is 0.496 Nm in our case, can be obtained from the intercept in the first quadrant of the image in
Figure 6. σ (0.36 Nm·s/rad) can be obtained from the slope of the image when
>
. The value of
(0.25 rad/s) can be obtained from least squares estimation. When the angular velocity is reversed,
Tc,
Tms,
take the opposite number, and σ remains unchanged.
The position-related friction torque value is obtained by subtracting the velocity-related term from Equation (11). The amplitude A of Equation (11) is obtained by fitting the results with sinusoidal function. In order to verify the relationship between amplitude A and angular velocity, each experiment is repeated three times under the conditions of four angular velocities mentioned above. The fitting results of the velocity-related term are shown in
Table 1. The result of a single factor analysis of variance between A and
is
p = 0.79 > 0.05, which indicates that there is no significant correlation between the two parameters.
Considering the direction of angular velocity and combining Equations (11) and (12), we can obtain the friction torque model of the SVA system as follows:
Substituting Equation (13) into Equation (2), the output torque
Tl of SVA based on the motor current can be shown as follows:
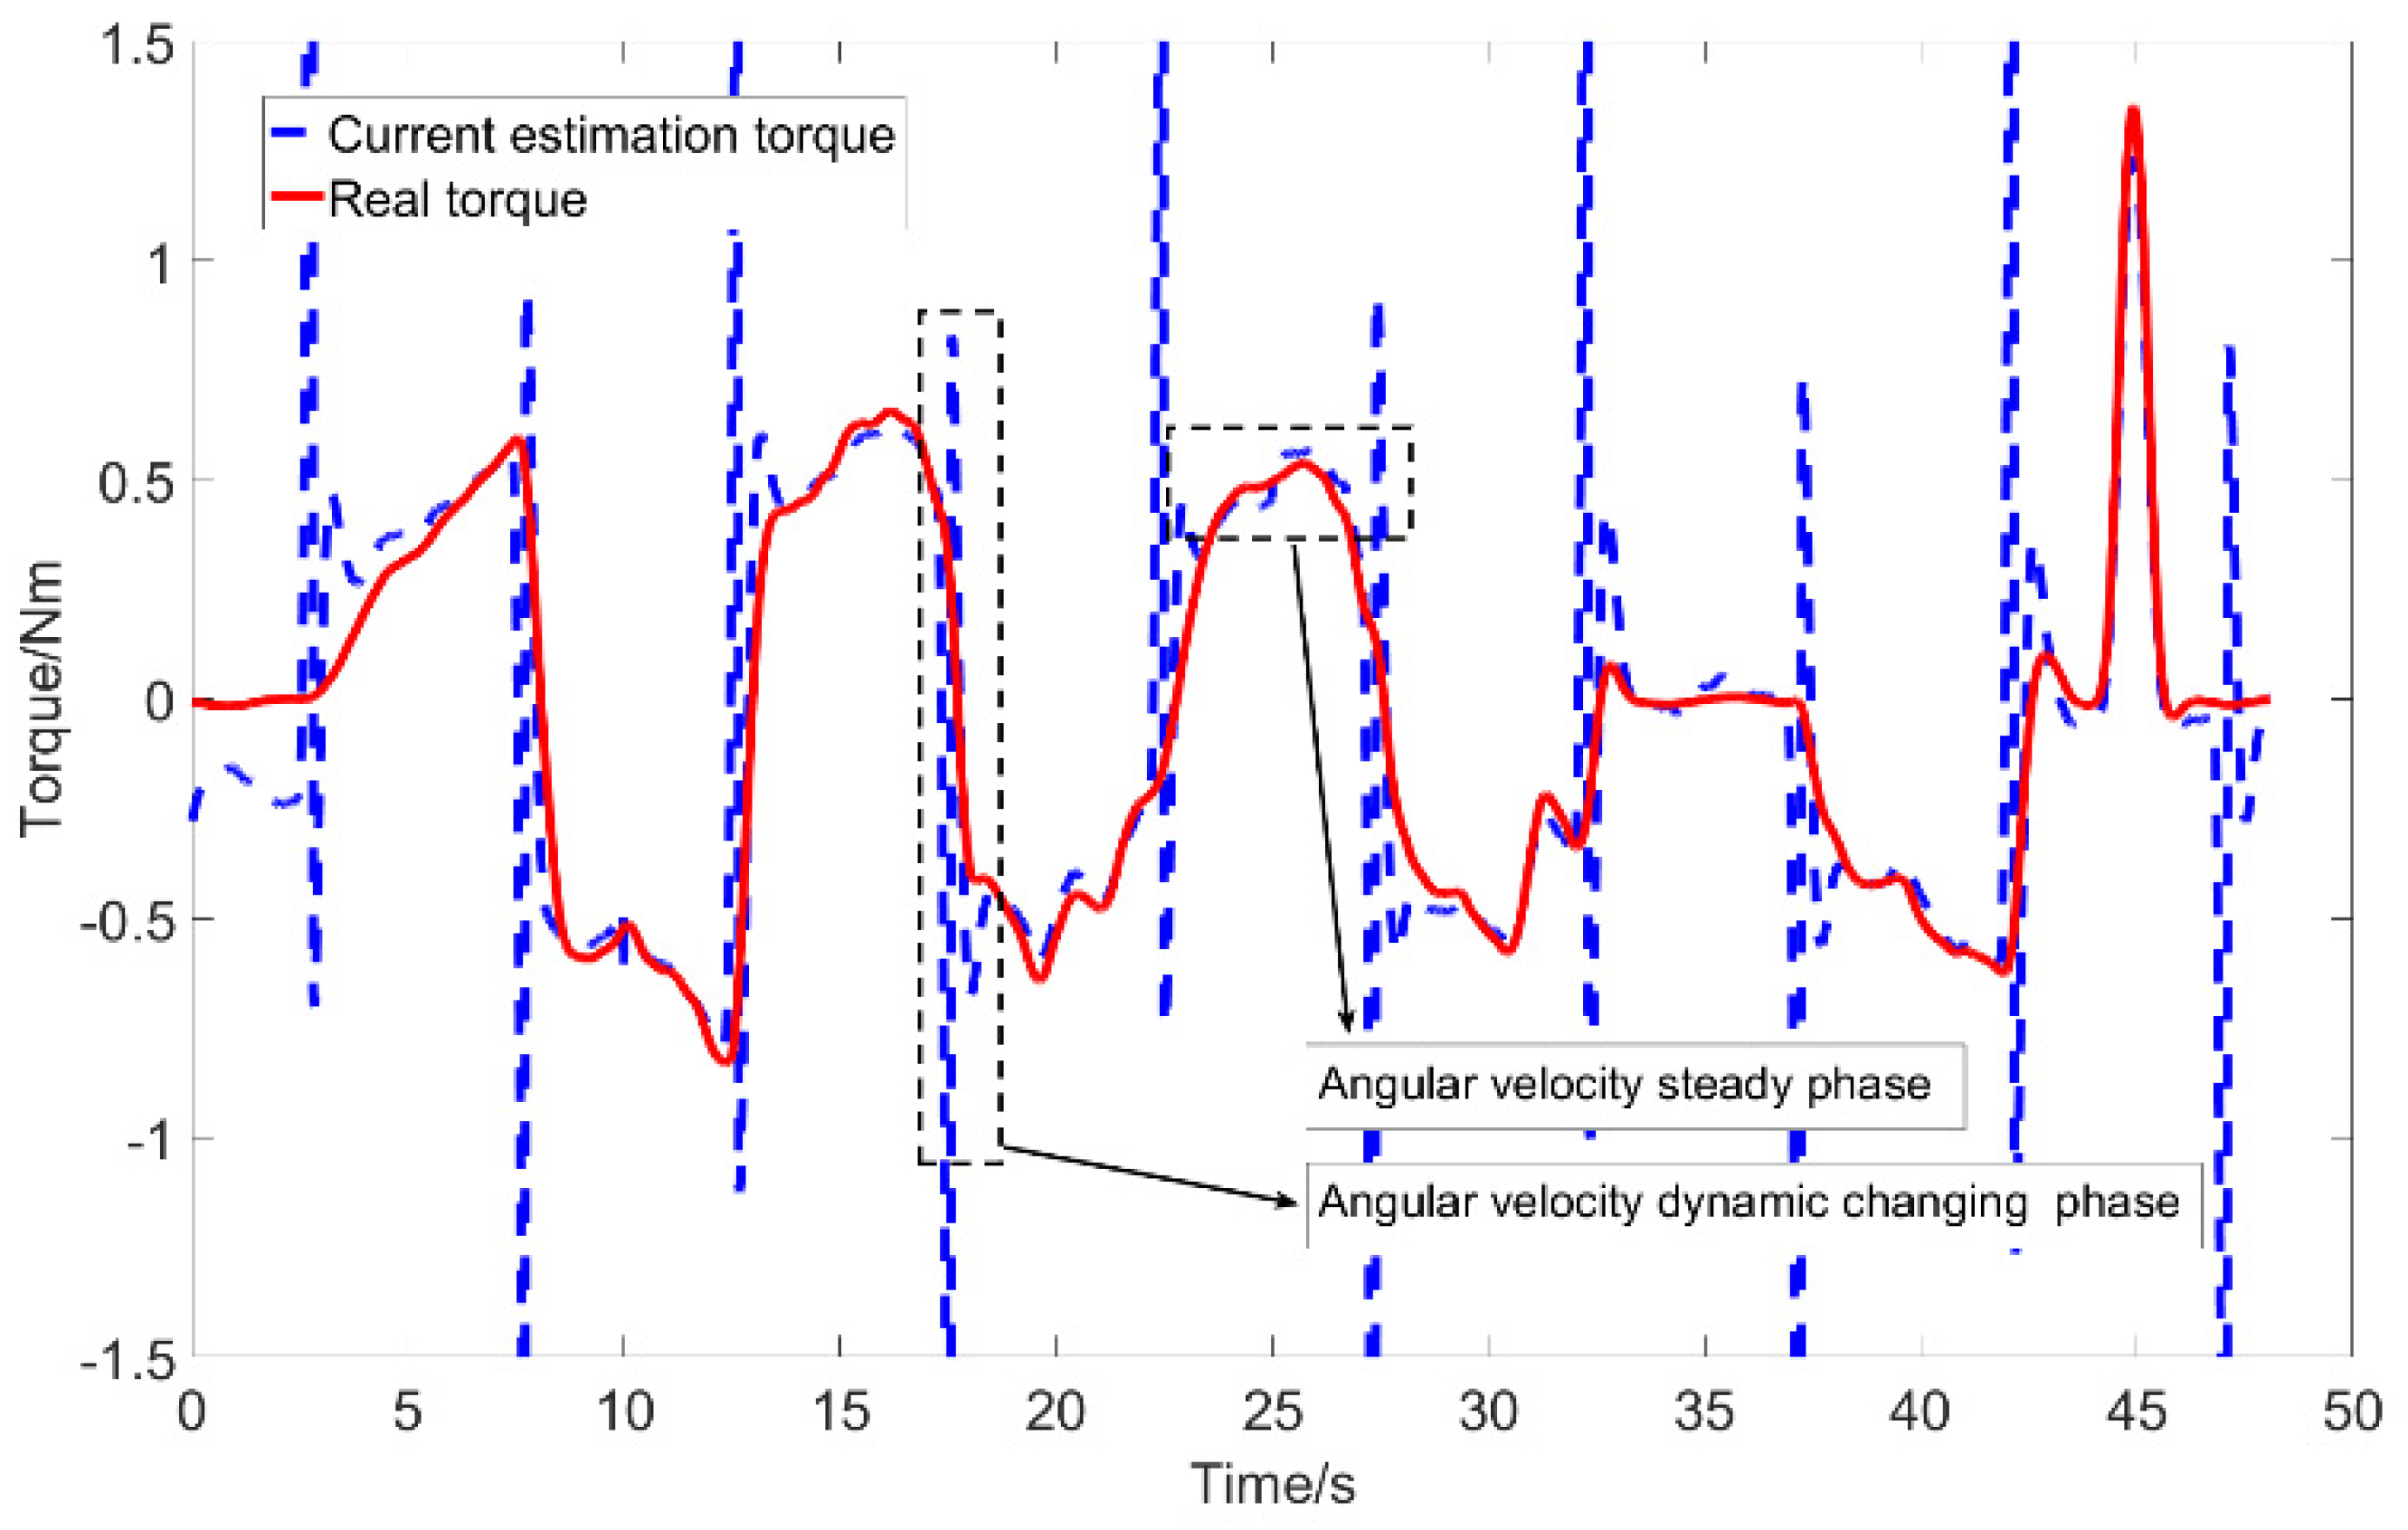
Since the current-based torque estimation is only reliable at steady motor working condition, a quantitative confidence function
ψ is defined in Equation (15) in order to judge the accuracy of the current estimation torque in a certain state. It represents the confidence in the accuracy of the current-based estimated torque state. The range of value of
ψ is [0, 1]. The closer to 0, the lower the accuracy and vice versa. It is calculated from the angular velocity
, angular acceleration
, current rate of change
, the constant Stribeck velocity
, and the scale factor
γ. When the angular velocity
is far away from the Stribeck velocity
, which characterizes the friction nonlinear region, its confidence is higher. When the angular acceleration
and the current change rate
are larger, angular velocity is more unstable and the product of the two is larger. As a result, the value of the calculation
ψ is lower.
γ is a scaling factor that facilitates unification of units and orders of magnitude. This state quantitative processing method is conducive to the design of subsequent data processing algorithms:
2.5. Torque Estimation Based on Dual Extended Kalman Filter
The rubber-based output torque estimation is influenced by two factors: nonlinearity and time variant of viscoelastic material properties. Nonlinearity affects torque estimation in a short time-scale while time-variant property affects the estimation results in a long time-scale. These two issues are attributed to the state estimation problem of the torque
T and the parameter estimation problem of
a, b and
c in rubber model presented in Equation (7). To realize updating system state and parameters simultaneously, the state equations and observation equations of the state estimator EKF1 and the parameter estimator EKF2 need to be established, respectively. The traditional discrete Kalman filter a priori estimation equations and the measurement parameter update equations are given as follows:
where
X,
U,
F,
B and
ω represent system state, system input, system matrix, input matrix and the external disturbance, respectively.
P,
Q and
R are the covariance matrix of states, interfering noises and observed noise, respectively.
K,
H and
Z respectively represent Kalman gain coefficient, observations matrix and observations equation.
For the state estimator EKF1, the state vector
is set to be torque
T directly in our case. The input vector
U is set as
. Thus, state prediction equation for EKF1 can be obtained using a rubber model represented by combining Equation (7) with the first function in Equation (16) as follows:
where the superscript
t of the variable represents the Kalman equation with torque as the state variable.
Ts is the sampling time.
a,
b and
c are the updated rubber parameters obtained from EKF2. ω and
k represent the external disturbance and the present step.
The observation equation of EFK1 needs to be specially designed and processed because the feedback results are obtained from current-based torque estimation which is only reliable when motor works at steady state. The predicted state vector cannot be updated at the time when motor works at dynamic state or current-based torque estimation model is invalid. There are two ways to stop updating the state vector in the non-ideal state inspired by the fourth function in Equation (16). One is to set the motor current observations variance
Rt to be
ꝏ and the Kalman filter gain
consequently becomes to 0, which means that there is no update in system state. Another way is to design the observation equation combining with a loss function [
28]
θt as follows:
where
,
v and
ψ respectively represent real observations value, observed noise and quantitative confidence function defined in Equation (15). The loss function is selected in our case because changing
Rt parameter greatly during the operation process is not conducive to the stability of the updating algorithm.
As the loss function θt plays an important role in the observation equation, the predicted state vector will make the loss function to change toward the direction of 0 and finally converges to the real value if the actual observations value is considered to be 0 at any time. When SVA is running in a non-steady state, ψ is close to 0. No matter what the estimated current Tcur is, always equals to 0 and there is no updating for . When the SVA is running in an ideal state, ψ is close to 1 and θt can represent the deviation between the estimated current Tcur and the predicted Xk. If there is a deviation between and Tcur, will update towards Tcur, and the θt will become to 0.
Thus, the observation matrix of the state estimator EKF1 can be obtained:
For the parameter estimator EKF2, the rubber mechanics model parameters
a, b, c are assumed to be constant in a short period of time. In EKF2, the state vector is
, and the state prediction equation is shown as follows:
where the superscript
p of the variable represents the Kalman equation with the rubber parameter as the state variable.
The observations equation of EKF2 is similar with the form of EKF1 because the observations results are also obtained by current-based torque estimation. It is designed as a loss function
θp of the current-based estimated torque
Tcur and the predicted torque predicted from the state vector
Xk:
where
ψ and T are, respectively, quantitative confidence function and torque obtained from EKF1. Equation (21) can be discretized as follows:
In such case, the observations equation
of EKF2 can be acquired as follows:
where
T,
k and
δ are the output torque of EFK1, the present step and the deformation variables, respectively. The design principle of the observations equation is the same as EKF1. It is considered that the actual value of the observations value is 0, and the state vector will be driven to the direction that makes the value of the loss function
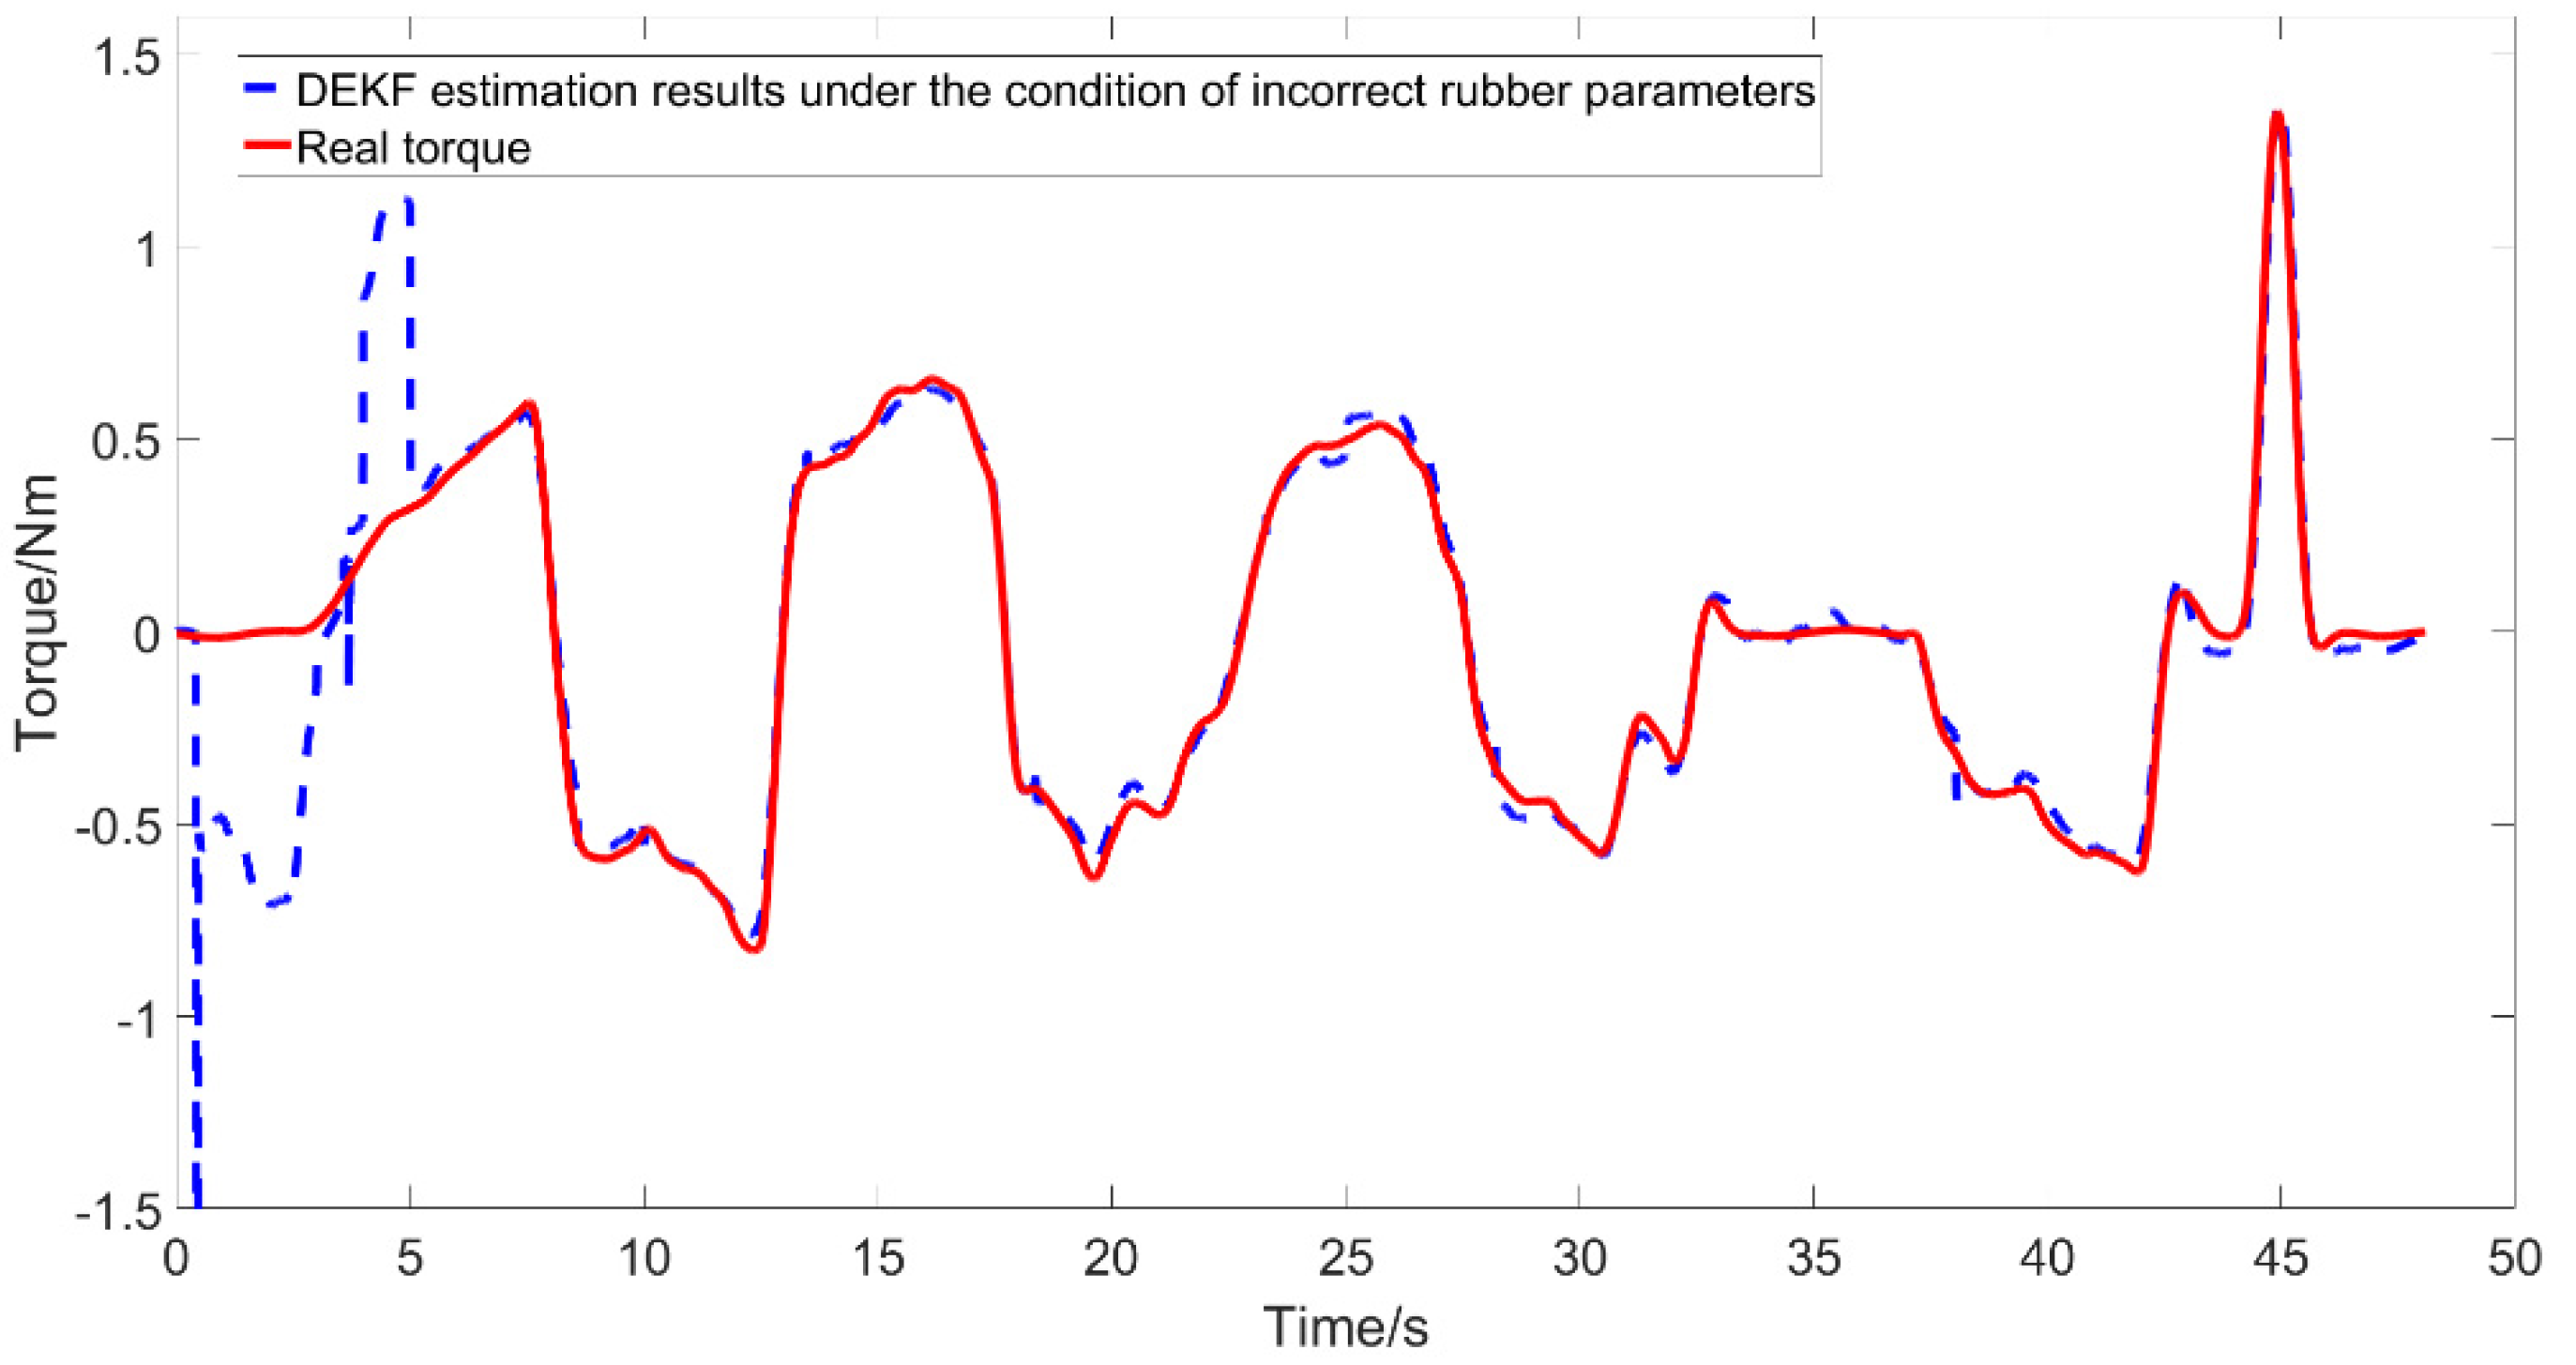
θp tend to 0. In such a way, the parameters a, b, and c will be iteratively updated until they converge to a true value. When these parameters change again due to temperature rising after long time use, the filter will continue to correct them to the changed true value. The square item in Equation (23) is represented by
ek as follows:
Then the observations matrix of EKF2 can be obtained by combining with Equations (23) and (24):
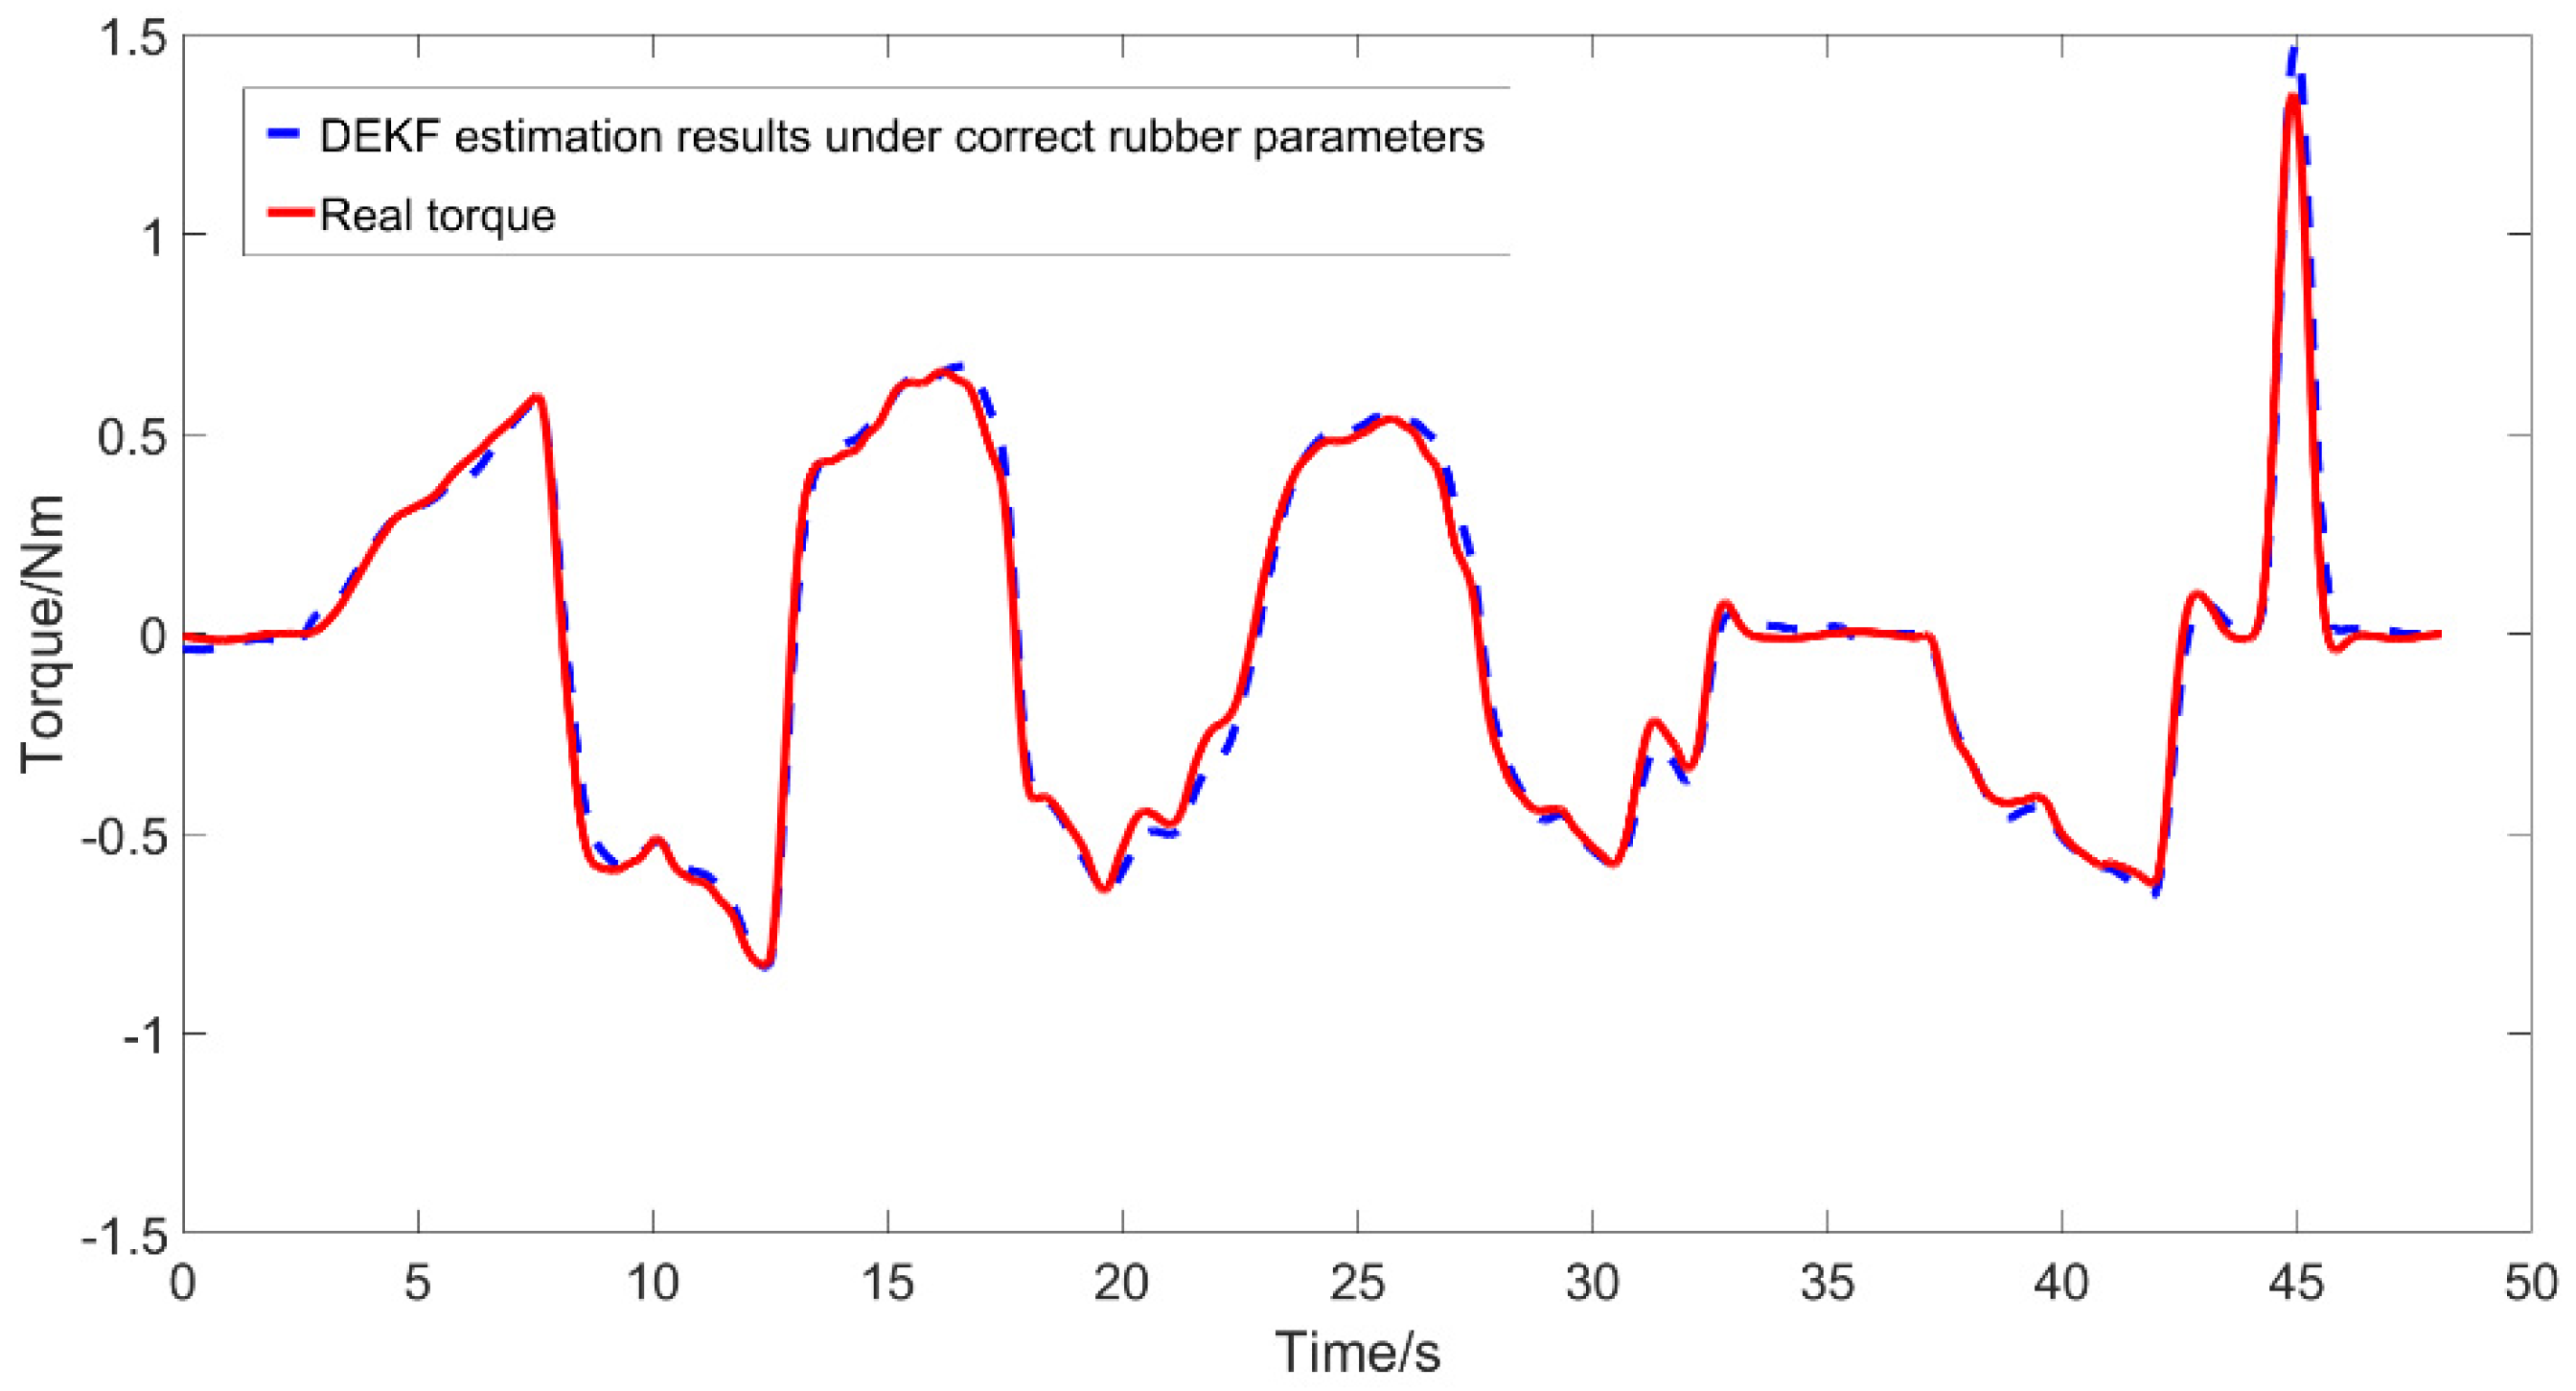
The basic process of DEKF is as follows (as shown in
Figure 8): Firstly, a priori parameter
of
is predicted by the parameter estimator EKF2 in one step. These predicted parameters are used in the one-step prediction of the state estimator EKF1 to obtain a priori state
. Then, the update stage of EKF1 works to obtain the posterior state
or the estimated torque
. In return,
is utilized in the update phase of EKF2, and the posterior parameter
of EKF2 can be obtained. In such a way, one iteration of the proposed DEKF calculation is executed and both the state
T and the parameter [
a,
b,
c] of SVA are estimated.


