Abstract
Mortality of renal transplant recipients with severe community-acquired pneumonia (CAP) remains high, despite advances in critical care management. There is still a lack of biomarkers for predicting prognosis of these patients. The present study aimed to investigate the association between neutrophil-to-lymphocyte ratio (NLR) and mortality in renal transplant recipients with severe CAP. A total of 111 renal transplant recipients with severe CAP admitted to the intensive care unit (ICU) were screened for eligibility between 1 January 2009 and 30 November 2018. Patient characteristics and laboratory test results at ICU admission were retrospectively collected. There were 18 non-survivors (22.2%) among 81 patients with severe CAP who were finally included. Non-survivors had a higher NLR level than survivors (26.8 vs. 12.3, p < 0.001). NLR had the greatest power to predict mortality as suggested by area under the curve (0.88 ± 0.04; p < 0.0001) compared to platelet-to-lymphocyte ratio (0.75 ± 0.06; p < 0.01), pneumonia severity index (0.65 ± 0.08; p = 0.05), CURB-65 (0.65 ± 0.08; p = 0.05), and neutrophil count (0.68 ± 0.07; p < 0.01). Multivariate logistic regression models revealed that NLR was associated with hospital and ICU mortality in renal transplant recipients with severe CAP. NLR levels were independently associated with mortality and may be a useful biomarker for predicting poor outcome in renal transplant recipients with severe CAP.
1. Introduction
Community-acquired pneumonia (CAP) has high morbidity and mortality, with frequent requirement for intensive care support. As a unique group of immunosuppressed patients, solid organ transplant recipients, including renal transplant recipients, are at high risk of acquiring CAP due to the routine use of immunosuppressive regimens [1,2,3]. The first-year mortality in renal transplant recipients with CAP can increase by 6- to 12-fold [4]. Notably, mortality of renal transplant recipients with severe CAP (diagnosed according to the Infectious Diseases Society of America/American Thoracic Society (IDSA/ATS) guidelines (2007) [5]) has remained high in recent years, despite advances in critical care management [6,7,8,9]. Early identification of high-risk patients would help to administer appropriate treatment and further improve clinical outcome. Many prognostic scoring systems or biomarkers aimed at stratifying risk and predicting prognosis in immunocompetent patients with CAP have been developed, such as the pneumonia severity index (PSI) [10], CURB-65 [11], and procalcitonin (PCT) [11,12,13]. However, biomarkers for predicting poor outcome in renal transplant recipients with severe CAP are still lacking.
Neutrophil-to-lymphocyte ratio (NLR), the ratio of neutrophil count to lymphocyte count, is a simple and inexpensive biomarker of systemic inflammation. NLR is reported to be associated with poor outcome and showed a better performance than PSI, CURB-65, and C-reactive protein (CRP) in predicting 30-day mortality in immunocompetent patients with CAP [14,15]. Moreover, NLR was found to be correlated with poor outcome in various diseases, such as oncology, cardio-cerebrovascular diseases, and bacteremia. Similarly, platelet-to-lymphocyte ratio (PLR) has been described as a novel potential inflammatory marker, which is associated with poor outcome in various diseases [16,17,18,19,20]. However, the role of NLR and PLR in renal transplant recipients with severe CAP remains unclear. In the present study, we investigated the association between NLR/PLR and mortality in renal transplant recipients with severe CAP.
2. Results
2.1. Patient Characteristics
A total of 111 renal transplant recipients with dyspnea admitted to the intensive care unit (ICU) between 1 January 2009 and 30 November 2018 were reviewed. Of these patients, 30 patients were excluded, including 11 with cardiogenic pulmonary edema at ICU admission, 12 with infection in multiple sites, three who were readmitted to the ICU, three with hospital-acquired pneumonia, and one with a do-not-intubate (DNI) order. Finally, 81 renal transplant recipients diagnosed to have severe CAP were included in the study (59 males (72.8%); median age, 52 [40~59] years) (Figure 1). The baseline demographics and clinical and laboratory characteristics of the 81 recipients are presented in Table 1. In the present study, 63 patients survived (77.8%) and 18 patients died during hospital stay (22.2%).
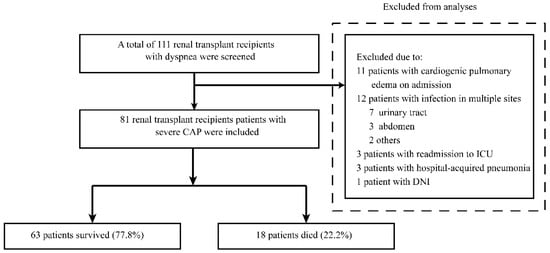
Figure 1.
Flow diagram of our retrospective study. CAP, community-acquired pneumonia; DNI, do not intubate; ICU, intensive care unit.

Table 1.
Clinical characteristics of patients according to hospital mortality.
Non-survivors had a significantly lower PaO2/FiO2 ratio (p < 0.01) and a higher Acute Physiology and Chronic Health Evaluation II (APACHE II) score (p < 0.01) than survivors. However, the CURB-65 score only slightly differed between survivors and non-survivors (2 [2, 2] vs. 3 [2, 3], respectively, p = 0.02). PSI was comparable between both groups (110 [98, 128] vs. 126 [104, 155], respectively, p = 0.06). A balanced distribution was observed between survivors and non-survivors with regard to other baseline clinical characteristics, including gender, age, comorbidities prior to admission, immunosuppressive regimens, and time course before admission, except for diabetes mellitus (7.9% vs. 27.8%, respectively, p = 0.04).
The white blood cell (WBC) count was comparable between survivors and non-survivors (p = 0.07). However, lymphocytopenia was more severe in non-survivors than in survivors (0.2 [0.1, 0.3] vs. 0.5 [0.3, 0.8], p < 0.01), while the neutrophil level, despite in the normal range (6.1 [3.9, 10.6]), was higher in non-survivors than in survivors (8.6 [5.1, 12.8] vs. 5.7 [3.7, 9.6], p = 0.02). Hence, NLR was significantly higher in non-survivors than in survivors (26.8 [20.7, 99.0] vs. 12.3 [8.0, 17.6]; p < 0.01). The PLR was also higher in non-survivors than in survivors (705.0 [492.5, 1146.3] vs. 407.0 [242.4, 647.5]; p < 0.01). There were no significant differences in the levels of procalcitonin (PCT), serum creatinine (Scr), troponin T (TnT), N-terminal pro-brain natriuretic peptide (NT-proBNP), D-dimer, and C-reactive protein (CRP) between survivors and non-survivors (all p > 0.05).
The numbers of patients receiving invasive mechanical ventilation (IMV) and those requiring a vasopressor within 24 h after ICU admission and renal replacement treatment were higher in non-survivors (all p < 0.001). In addition, non-survivors had a longer ICU and hospital stay length than survivors (16 [6, 28] vs. 7 [4, 11] days, p = 0.01; 30 [17, 41] vs. 20 [14, 29], p = 0.04).
2.2. Microbiological Findings
The microbiological findings are shown in Table 1. A total of 51 patients (63.0%) had positive microbiological findings during the treatment process according to noninvasive and/or invasive diagnostic tests. Bacterial infection (32.1%) was the primary cause of severe CAP in renal transplant recipients, followed by viral (25.9%) and fungal infections (25.9%). Non-survivors had a higher rate of bacterial infection than survivors (77.8% vs. 19.0%, respectively, p < 0.001). There were no differences in viral and fungal infections between the two groups. A total of 37% patients had unidentified pathogens. The survivors had a higher rate of undetermined etiology than non-survivors (44.4% vs. 11.1%, respectively, p = 0.01).
2.3. Value of Indicators to Predict Hospital Mortality
Receiver operating characteristic (ROC) curves were constructed to examine the predictive performance of several indicators for hospital mortality (Figure 2). The area under the curve (AUC), optimal cutoff value, sensitivity, and specificity of each indicator are presented in Table 2. NLR showed the largest AUC of 0.88 ± 0.04, and NLR ≥ 15.25 was proposed as the optimal cutoff value, which provided a sensitivity of 100% and a specificity of 67.21% for predicting hospital mortality. PLR had an AUC of 0.75 ± 0.06, and PLR ≥ 520 was proposed as the optimal cutoff value, which provided a sensitivity of 77.78% and a specificity of 68.33% for predicting hospital mortality. Pairwise comparison of ROC curves confirmed that the AUC of NLR was significantly higher than those of PLR (p < 0.01), CURB-65 (p = 0.01), PSI (p = 0.01), and neutrophil count (p < 0.01). The AUCs of APACHE II score (p = 0.74) and lymphocyte count (p = 0.14) were identical to that of NLR. The combination of APACHE II score and NLR had an excellent prediction of hospital mortality with an AUC value of 0.91 ± 0.05 (p < 0.0001), which is higher than that of APACHE II score (0.85 ± 0.05; p < 0.0001).
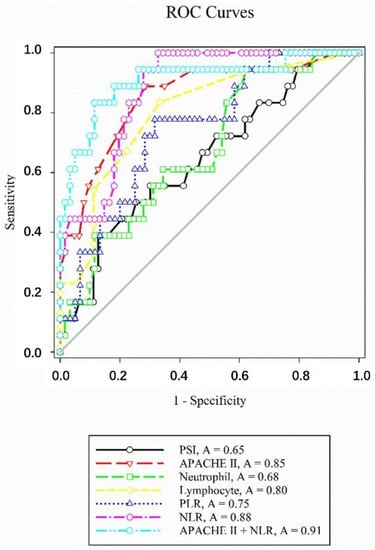
Figure 2.
Receiver operating characteristic (ROC) curves of neutrophil-to-lymphocyte count ratio (NLR) and other indicators for predicting hospital mortality in renal transplant recipients with severe community-acquired pneumonia. APACHE II, Acute Physiology and Chronic Health Evaluation II; PLR, platelet-to-lymphocyte ratio; PSI, Pneumonia Severity Index.
Table 2.
Performance of variables in predicting hospital mortality.
Furthermore, we performed univariate and multivariate logistic regression analyses to confirm the association of each variable with mortality (Table A1 in Appendix A and Table 3 and Table 4). The multivariate logistic models showed that NLR was associated with hospital and ICU mortality in renal transplant recipients with severe CAP (model 1, adjusted odd ratio (OR), 1.07 [1.02–1.14], p = 0.01; model 2, adjusted OR, 1.07 [1.02–1.14], p = 0.01; Table 3 and Table 4, respectively), while PLR was not associated with hospital mortality and ICU mortality (models 5 and 6, all p > 0.05; Table 3 and Table 4). NLR was further classified into three levels: high (≥24.0), medium (16.2–24.0), and low (≤16.2), based on data distribution. The multivariate logistic models confirmed that NLR was associated with hospital and ICU mortality (models 3 and 4, all p for trend < 0.01; Table 3 and Table 4).
Table 3.
Independent predictors of hospital mortality according to multivariate logistic regression analysis.
Table 4.
Independent predictors of ICU mortality according to multivariate logistic regression analysis.
3. Discussion
To the best of our knowledge, this is the first study to focus on the predictive value of NLR in renal transplant recipients with severe CAP. Our study demonstrated that elevated NLR level was associated with mortality in renal transplant recipients with severe CAP. Moreover, NLR had better performance than PLR, PSI, and CURB65 score in predicting mortality.
Inflammatory responses play an important role in the development and progression of CAP. As a simple and convenient marker of inflammatory status, NLR was found to be an independent predictor of mortality in immunocompetent patients with CAP, including children and elderly patients [14,15,21,22,23]. Moreover, NLR was recently considered as an independent biomarker in patients with coronavirus disease 2019 (COVID-19) [18,24]. Generally speaking, neutrophilia and/or lymphopenia are common immune responses during infection, which finally result in elevated NLR level. The possible mechanisms that drive neutrophilia and lymphopenia include demargination and delayed apoptosis of neutrophils as well as margination and accelerated apoptosis of lymphocytes [25,26,27,28].
NLR has also been reported to be correlated with a wide range of disorders. On the one hand, NLR was found to be associated with poor prognosis in various conditions, such as severe infections, systemic inflammation, acute coronary syndrome, and cancer [29,30,31,32,33,34]. On the other hand, it has been demonstrated that high NLR level was associated with renal recovery in patients with rapidly progressive glomerulonephritis [19]. These findings indicate the complex role of NLR in various diseases. To date, the role of NLR in renal transplant recipients with severe CAP remains unknown.
Renal transplant recipients, who are usually administered immunosuppressive agents and steroids, are a subgroup of immunocompromised populations. As innate and adaptive immune responses are usually inhibited by immunosuppressive agents and chronic steroid administration, neutropenia and lymphocytopenia are common in renal transplant recipients [35]. Therefore, an inflammatory response against pneumonia in renal transplant recipients differs greatly from those in immunocompetent patients. In the present study, lymphocytopenia was common in renal transplant recipients with severe CAP, while the median neutrophil level was in the normal range. Lymphocytopenia was more severe in non-survivors than in survivors, while the neutrophil level, despite in the normal range, was higher in non-survivors than in survivors. These factors led to higher NLR in non-survivors than in survivors.
PLR has also been highlighted as a potential new marker of systemic inflammation. Several studies have reported that PLR is linked with poor outcome in various diseases, including COVID-19, rheumatoid arthritis, glomerulonephritis, and cancer [16,17,18,19,20]. However, our results did not confirm the association between the PLR level and mortality in renal transplant recipients with severe CAP. PLR has lower AUC values in predicting hospital mortality than NLR. This may be partially explained by the comparable platelet levels between survivors and non-survivors.
Many prognostic scoring systems aimed at stratifying risk in patients with CAP have been developed, such as PSI and CURB-65. Their performances in predicting mortality have been validated in large, independent populations that included immunocompetent patients with CAP [36,37]. However, their performances in renal transplant recipients with severe CAP were unsatisfactory when compared with that of NLR. Thus, common scoring systems, such as PSI and CURB-65, may not be suitable for renal transplant patients with severe CAP.
In the present study, bacterial infection was the primary cause of severe CAP in renal transplant recipients. Non-survivors had a higher rate of bacterial infection than survivors. Multivariate logistic regression models also confirmed that bacterial infection in these patients was associated with mortality. This implied that renal transplant recipients with CAP caused by bacteria tended to be susceptible to develop highly severe disease, resulting in poor outcome. However, it should be noted that 37% of our patients had undetermined microbiological findings, and non-survivors had a lower rate of undetermined pathogens than survivors. The possible reasons for this finding are that non-survivors had high severity of disease and tended to receive invasive diagnostic procedures to determine the etiology, such as fiberoptic bronchoscopy with bronchoalveolar lavage.
The rate of invasive mechanical ventilation was lower in survivors than in non-survivors (4.8% vs. 88.9%, respectively, p < 0.001). The possible reasons for this finding are that interdisciplinary approaches have been implemented in our center since 2009 to delay or avoid intubation, which include appropriate oxygen therapy, adjustment of immunosuppressive regimen and steroids, individual antibiotic therapy, and so on [8,38,39,40,41]. The overall mortality was, therefore, markedly decreased from nearly 50% prior to 2009 to 22.2% [40].
This retrospective study has several limitations. First, the study was limited by the small sample size, which might have affected the statistical power and restricted stratified analysis. Further confirmation should be obtained using a larger cohort in future studies. Second, other inflammatory indicators, such as interferon-gamma (IFN-γ) and tumor necrosis factor-alpha (TNF-α), were not measured in our study. Third, the conclusion based on kidney transplant recipients may not be generalized for all immunosuppressed patients.
4. Materials and Methods
4.1. Study Design
The study protocol complied with the standards of the Declaration of Helsinki and current ethical guidelines and was approved by the Ethics Committee of Zhongshan Hospital, Fudan University. Renal transplant recipients with dyspnea admitted to the ICU of Zhongshan Hospital, Fudan University, between 1 January 2009 and 30 November 2018 were retrospectively reviewed.
CAP was diagnosed as pneumonia acquired outside of a hospital setting [42]. Hospital-acquired pneumonia (HAP) was defined according to previous reports [43]. Severe CAP was diagnosed according to the Infectious Diseases Society of America/American Thoracic Society (IDSA/ATS) guidelines (2007) [5]. Patients who met either one major criterion or at least three minor criteria were diagnosed to have severe CAP. The major criteria included the following: (1) septic shock in need of vasopressors and (2) respiratory failure requiring mechanical ventilation. The minor criteria included the following: (1) PaO2/FiO2 ratio < 250 mmHg; (2) respiratory rate (RR) > 30 breaths/min; (3) infiltration in multilobes; (4) confusion/disorientation; (5) uremia (blood urea nitrogen (BUN) > 20 mg/dl); (6) leukopenia (white blood cell (WBC) count = 4000/mL); (7) thrombocytopenia (platelet count < 100,000/mL); (8) hypothermia (core temperature < 36 °C); (9) hypotension requiring aggressive fluid resuscitation. Patients were excluded if they met the following criteria: (1) HAP; (2) cardiogenic pulmonary edema on admission; (3) readmission to ICU; (4) concurrent infection in other sites (urinary tract, abdomen, and so on); (5) do-not-intubate (DNI) order.
4.2. ICU Management and Microbiological Diagnostic Approach
A summary of standardized approaches for renal transplant recipients with severe pneumonia has been described in our previous studies [8,44]. High-resolution computed tomography (HRCT) examination was performed for diagnosis and evaluation before hospital admission and during ICU stay.
Diagnostic tests for identifying the pathogens of severe CAP included noninvasive procedures (urine and sputum cultures) and invasive diagnostic procedures (fiberoptic bronchoscopy with bronchoalveolar lavage, blood culture, and detection of serum antibodies against cytomegalovirus (CMV), Epstein–Barr virus (EBV), Legionella, and Mycoplasma). Additionally, the 1,3-β-d glucan test (G test), galactomannan antigen detection (GM test), T cell spot test for tuberculosis (T-SPOT), and tuberculin test were performed.
4.3. Data Collection
Patient demographics (baseline clinical characteristics including the Acute Physiology and Chronic Health Evaluation II (APACHE II) score, Pneumonia Severity Index (PSI), CURB-65 score, and PaO2/FiO2 ratio), laboratory data at ICU admission (including hemoglobin level, platelet count, white blood cell count, alanine aminotransferase (ALT) level, aspartate aminotransferase (AST) level, alkaline phosphatase (ALP) level, C-reactive protein (CRP) level, D-dimer level, γ-glutamyl transpeptidase (γ-GT) level, bilirubin level, troponin T (TnT) level, N-terminal pro-brain natriuretic peptide (NT-proBNP) level, serum creatinine (Scr) level, glomerular filtration rate (GFR), and procalcitonin (PCT) level) and microbiological findings were collected. In our center, complete blood count was measured using the Beckman Coulter LH-750 Hematology Analyzer (Beckman Coulter, Inc., Fullerton, CA, USA). Blood biochemical parameters were measured by an automatic biochemistry analyzer (Roche Cobas 8000 modular analyzer, Roche Diagnostics, Mannheim, Germany). NT-proBNP was measured by the Elecsys Electro-chemo luminescent assay (Cobas e 411 analyzer, Roche Diagnostics). Treatments during ICU stay, including vasopressor use within 24 h after ICU admission, renal replacement therapy, and invasive mechanical ventilation (IMV), and clinical outcomes, including length of ICU stay and hospital stay and ICU and hospital mortality, were also recorded. NLR was calculated using the following formula: NLR (%) = Neutrophil count/Lymphocyte count × 100%.
4.4. Statistical Analysis
Categorical variables were compared using the chi-square test or Fisher’s exact test, while continuous variables were compared using the Mann–Whitney U test. To determine the sensitivity and specificity of variables to predict mortality, receiver operating characteristic (ROC) curves were plotted, and the area under the curve (AUC) and Youden’s index were then calculated from ROC curves. The optimal cutoff value was based on Youden’s index. The ROC curve for the combination of APACHE II and NLR for predicting hospital mortality was also plotted according to the Mackinnon and Mulligan’s weighted sum rule [45]. Pairwise comparison of ROC curves was conducted using the method of DeLong et al., 1988 [46]. Univariate logistic regression analysis was used to identify the possible risk factors for hospital mortality and ICU mortality. Variables with probability (p) value less than 0.1 in univariate models were introduced into the multivariate logistic models. A p value of less than 0.05 was considered to be statistically significant. SPSS software package, version 13.0 (SPSS Inc., Chicago, IL, USA) was used for statistical analysis of the data.
5. Conclusions
NLR was independently associated with mortality in renal transplant recipients with severe CAP. NLR may be a useful prognostic marker for renal transplant recipients with severe CAP.
Author Contributions
Study design, Y.S., G.-W.T. and Z.L.; data collection, M.-J.J., H.-Y.H. and Z.-Y.G.; manuscript writing and revision, Y.Q., Y.S., G.-W.T., Z.L. and C.Y.; specific data analyses, Y.Q., Y.S. and G.T. All authors have read and agreed to the published version of the manuscript.
Funding
This research was funded by grants from the Research Funds of Zhongshan Hospital (2019ZSQN13, 2019ZSYXQN34, and XYYX201922); the Research Fund of Shanghai Municipal Health Commission (2019ZB0105); the National Natural Science Foundation of China (81770746); Shanghai Rising-Star Program (19QA1406300); Medical and Health Talents Training Plan for the Excellent Youth of Shanghai Municipal (2018YQ50); 2019 Shanghai Youth Talent Development Program (to Cheng Yang), Project ELITE: A Special Supportive Program for Organ Transplantation by COTDF (2019JYJH05); Program of Shanghai Academic/Technology Research Leader (20XD1421000); the Natural Science Foundation of Shanghai (20ZR1411100).
Conflicts of Interest
The authors declare no conflict of interest.
Appendix A
Table A1.
Predictors of hospital mortality and ICU mortality according to univariate logistic regression analysis.
Table A1.
Predictors of hospital mortality and ICU mortality according to univariate logistic regression analysis.
| Hospital Mortality | ICU Mortality | |||
|---|---|---|---|---|
| Variables | Odds Ratio (95% CI) | p Value | Odds Ratio (95% CI) | p Value |
| Age | 1.03 (0.98–1.08) | 0.18 | 1.03 (0.98–1.07) | 0.258 |
| Gender | 0.71 (0.21–2.6) | 0.59 | 0.56 (0.14–2.19) | 0.40 |
| Diabetes mellitus | 4.46 (1.13–17.70) | 0.03 | 1.91 (0.44–8.40) | 0.39 |
| Hypertension | 1.19 (0.34–4.15) | 0.78 | 0.98 (0.28–3.47) | 0.98 |
| Acute rejection history | 1.71 (0.46–6.39) | 0.42 | 2.07 (0.55–7.86) | 0.28 |
| APACHE II score (per point) | 1.30 (1.13–1.49) | 0.000 | 1.27 (1.11–1.44) | 0.000 |
| PaO2/FiO2 ratio (per 10 mmHg) | 0.88 (0.81–0.96) | 0.002 | 0.90 (0.83–0.97) | 0.006 |
| PSI score (per 10 point) | 1.23 (1.01–1.49) | 0.04 | 1.24 (1.01–1.51) | 0.04 |
| CURB-65 (per point) | 2.83 (1.20–6.65) | 0.02 | 3.31 (1.34–8.21) | 0.01 |
| White blood cell count (per 109/L) | 1.10 (1.00–1.21) | 0.05 | 1.10 (1.00–1.22) | 0.05 |
| Neutrophil (per 109/L) | 1.13 (1.01–1.25) | 0.03 | 1.13 (1.01–1.25) | 0.03 |
| Lymphocyte (per 109/L) | 0.02 (0.001–0.29) | 0.006 | 0.008 (0.00–0.26) | 0.006 |
| NLR | 1.07 (1.03–1.12) | 0.002 | 1.08 (1.03–1.13) | 0.002 |
| PLT (per 109/L) | 0.99 (0.99–1.00) | 0.07 | 0.99 (0.98–1.00) | 0.03 |
| PLR | 1.002 (1.00–1.003) | 0.006 | 1.002 (1.001–1.003) | 0.005 |
| Total bilirubin | 1.05 (0.98–1.12) | 0.18 | 1.05 (0.98–1.13) | 0.14 |
| ALT | 1.01 (1.00–1.03) | 0.13 | 1.01 (1.00–1.03) | 0.12 |
| AST | 1.03 (1.00–1.06) | 0.10 | 1.02 (1.00–1.05) | 0.11 |
| ALP | 1.003 (0.99–1.02) | 0.72 | 0.997 (0.98–1.01) | 0.75 |
| γ-GT | 1.001 (1.00–1.01) | 0.67 | 0.999 (0.994–1.005) | 0.85 |
| GFR | 1.002 (0.99–1.02) | 0.70 | 0.99 (0.97–1.01) | 0.27 |
| Troponin T | 0.95 (0.01–91.02) | 0.98 | 1.57 (0.02–135.54) | 0.84 |
| Ln NT–proBNP | 1.32 (0.80–2.17) | 0.28 | 1.45 (0.85–2.46) | 0.17 |
| Procalcitonin | 4.32 (1.21–15.47) | 0.02 | 3.95 (1.17–13.29) | 0.03 |
| CRP | 1.01 (0.99–1.03) | 0.22 | 1.01 (1.00–1.03) | 0.11 |
| D–Dimer | 1.08 (0.94–1.23) | 0.30 | 1.08 (0.94–1.25) | 0.27 |
| Bacterial infection | 14.88 (4.15–53.33) | <0.01 | 10.93 (3.05–39.18) | <0.01 |
| Fungal infection | 2.29 (0.59–8.91) | 0.23 | 2.76 (0.70–10.94) | 0.15 |
| Viral infection | 2.23 (0.73–6.82) | 0.16 | 1.39 (0.42–4.61) | 0.59 |
| Mycoplasma | 0.56 (0.06–4.97) | 0.60 | 0.66 (0.07–5.87) | 0.71 |
APACHE II, Acute Physiology and Chronic Health Evaluation II; ALT, alanine aminotransferase; AST, aspartate aminotransferase; ALP, Alkaline phosphatase; CRP, C-reactive protein; GFR, glomerular filtration rate; γ-GT, γ-glutamyl transpeptidase; NLR, neutrophil-to-lymphocyte ratio; PLR, platelet-to-lymphocyte ratio; PSI, Pneumonia Severity Index.
References
- Hoyo, I.; Linares, L.; Cervera, C.; Almela, M.; Marcos, M.A.; Sanclemente, G.; Cofan, F.; Ricart, M.J.; Moreno, A. Epidemiology of pneumonia in kidney transplantation. Transplant. Proc. 2010, 42, 2938–2940. [Google Scholar] [CrossRef] [PubMed]
- Black, C.K.; Termanini, K.M.; Aguirre, O.; Hawksworth, J.S.; Sosin, M. Solid organ transplantation in the 21(st) century. Ann. Transl. Med. 2018, 6, 409. [Google Scholar] [CrossRef]
- Pons, S.; Sonneville, R.; Bouadma, L.; Styfalova, L.; Ruckly, S.; Neuville, M.; Radjou, A.; Lebut, J.; Dilly, M.P.; Mourvillier, B.; et al. Infectious complications following heart transplantation in the era of high-priority allocation and extracorporeal membrane oxygenation. Ann. Intensive Care 2019, 9, 17. [Google Scholar] [CrossRef] [PubMed]
- Naik, A.S.; Dharnidharka, V.R.; Schnitzler, M.A.; Brennan, D.C.; Segev, D.L.; Axelrod, D.; Xiao, H.; Kucirka, L.; Chen, J.; Lentine, K.L. Clinical and economic consequences of first-year urinary tract infections, sepsis, and pneumonia in contemporary kidney transplantation practice. Transpl. Int. 2016, 29, 241–252. [Google Scholar] [CrossRef] [PubMed]
- Mandell, L.A.; Wunderink, R.G.; Anzueto, A.; Bartlett, J.G.; Campbell, G.D.; Dean, N.C.; Dowell, S.F.; File, T.M.; Musher, D.M.; Niederman, M.S.; et al. Infectious Diseases Society of America/American Thoracic Society Consensus Guidelines on the Management of Community-Acquired Pneumonia in Adults. Clin. Infect. Dis. 2007, 44, S27–S72. [Google Scholar] [CrossRef]
- Valles, J.; Diaz, E.; Martin-Loeches, I.; Bacelar, N.; Saludes, P.; Lema, J.; Gallego, M.; Fontanals, D.; Artigas, A. Evolution over a 15-year period of the clinical characteristics and outcomes of critically ill patients with severe community-acquired pneumonia. Med. Intensiva 2016, 40, 238–245. [Google Scholar] [CrossRef] [PubMed]
- Cavallazzi, R.; Wiemken, T.; Arnold, F.W.; Luna, C.M.; Bordon, J.; Kelley, R.; Feldman, C.; Chalmers, J.D.; Torres, A.; Ramirez, J. Outcomes in patients with community-acquired pneumonia admitted to the intensive care unit. Respir. Med. 2015, 109, 743–750. [Google Scholar] [CrossRef] [PubMed]
- Tu, G.; Ju, M.; Zheng, Y.; Xu, M.; Rong, R.; Zhu, D.; Zhu, T.; Luo, Z. Early- and late-onset severe pneumonia after renal transplantation. Int. J. Clin. Exp. Med. 2015, 8, 1324–1332. [Google Scholar]
- Luo, Y.; Tang, Z.; Hu, X.; Lu, S.; Miao, B.; Hong, S.; Bai, H.; Sun, C.; Qiu, J.; Liang, H.; et al. Machine learning for the prediction of severe pneumonia during posttransplant hospitalization in recipients of a deceased-donor kidney transplant. Ann. Transl. Med. 2020, 8, 82. [Google Scholar] [CrossRef]
- Fine, M.J.; Auble, T.E.; Yealy, D.M.; Hanusa, B.H.; Weissfeld, L.A.; Singer, D.E.; Coley, C.M.; Marrie, T.J.; Kapoor, W.N. A prediction rule to identify low-risk patients with community-acquired pneumonia. N. Engl. J. Med. 1997, 336, 243–250. [Google Scholar] [CrossRef] [PubMed]
- Macfarlane, J.T.; Boldy, D. 2004 update of BTS pneumonia guidelines: What’s new? Thorax 2004, 59, 364–366. [Google Scholar] [CrossRef]
- Masia, M.; Gutierrez, F.; Shum, C.; Padilla, S.; Navarro, J.C.; Flores, E.; Hernandez, I. Usefulness of procalcitonin levels in community-acquired pneumonia according to the patients outcome research team pneumonia severity index. Chest 2005, 128, 2223–2229. [Google Scholar] [CrossRef] [PubMed]
- Liu, W.; Jiao, Y.; Xing, H.; Hai, Y.; Li, H.; Zhang, K.; Zhao, Y.; Yang, Y.; Xu, B.; Bai, H.; et al. Active surveillance of ventilator-associated pneumonia in the intensive care unit and establishment of the risk grading system and effect evaluation. Ann. Transl. Med. 2019, 7, 617. [Google Scholar] [CrossRef]
- Cataudella, E.; Giraffa, C.M.; Di Marca, S.; Pulvirenti, A.; Alaimo, S.; Pisano, M.; Terranova, V.; Corriere, T.; Ronsisvalle, M.L.; Di Quattro, R.; et al. Neutrophil-To-Lymphocyte Ratio: An Emerging Marker Predicting Prognosis in Elderly Adults with Community-Acquired Pneumonia. J. Am. Geriatr. Soc. 2017, 65, 1796–1801. [Google Scholar] [CrossRef] [PubMed]
- de Jager, C.P.; Wever, P.C.; Gemen, E.F.; Kusters, R.; van Gageldonk-Lafeber, A.B.; van der Poll, T.; Laheij, R.J. The neutrophil-lymphocyte count ratio in patients with community-acquired pneumonia. PLoS ONE 2012, 7, e46561. [Google Scholar] [CrossRef] [PubMed]
- Erre, G.L.; Paliogiannis, P.; Castagna, F.; Mangoni, A.A.; Carru, C.; Passiu, G.; Zinellu, A. Meta-analysis of neutrophil-to-lymphocyte and platelet-to-lymphocyte ratio in rheumatoid arthritis. Eur. J. Clin. Investig. 2019, 49, e13037. [Google Scholar] [CrossRef]
- Toraman, A.; Nese, N.; Ozyurt, B.C.; Kursat, S. Association between neutrophil-lymphocyte & platelet lymphocyte ratios with prognosis & mortality in rapidly progressive glomerulonephritis. Indian J. Med. Res. 2019, 150, 399–406. [Google Scholar] [CrossRef] [PubMed]
- Yang, A.P.; Liu, J.P.; Tao, W.Q.; Li, H.M. The diagnostic and predictive role of NLR, d-NLR and PLR in COVID-19 patients. Int. Immunopharmacol. 2020, 84, 106504. [Google Scholar] [CrossRef]
- Mae, Y.; Takata, T.; Ida, A.; Ogawa, M.; Taniguchi, S.; Yamamoto, M.; Iyama, T.; Fukuda, S.; Isomoto, H. Prognostic Value of Neutrophil-To-Lymphocyte Ratio and Platelet-To-Lymphocyte Ratio for Renal Outcomes in Patients with Rapidly Progressive Glomerulonephritis. J. Clin. Med. 2020, 9, 1128. [Google Scholar] [CrossRef] [PubMed]
- Wu, Y.; Chen, Y.; Yang, X.; Chen, L.; Yang, Y. Neutrophil-to-lymphocyte ratio (NLR) and platelet-to-lymphocyte ratio (PLR) were associated with disease activity in patients with systemic lupus erythematosus. Int. Immunopharmacol. 2016, 36, 94–99. [Google Scholar] [CrossRef]
- Che-Morales, J.L.; Cortes-Telles, A. Neutrophil-to-lymphocyte ratio as a serum biomarker associated with community acquired pneumonia. Rev. Med. Inst. Mex Seguro Soc. 2019, 56, 537–543. [Google Scholar] [PubMed]
- Pantzaris, N.D.; Platanaki, C.; Pierrako, C.; Karamouzos, V.; Velissaris, D. Neutrophil-to-lymphocyte Ratio Relation to Sepsis Severity Scores and Inflammatory Biomarkers in Patients with Community-acquired Pneumonia: A Case Series. J. Transl. Intern. Med. 2018, 6, 43–46. [Google Scholar] [CrossRef]
- Bekdas, M.; Goksugur, S.B.; Sarac, E.G.; Erkocoglu, M.; Demircioglu, F. Neutrophil/lymphocyte and C-reactive protein/mean platelet volume ratios in differentiating between viral and bacterial pneumonias and diagnosing early complications in children. Saudi Med. J. 2014, 35, 442–447. [Google Scholar] [PubMed]
- Liu, Y.; Du, X.; Chen, J.; Jin, Y.; Peng, L.; Wang, H.H.X.; Luo, M.; Chen, L.; Zhao, Y. Neutrophil-to-lymphocyte ratio as an independent risk factor for mortality in hospitalized patients with COVID-19. J. Infect. 2020, 81, e6–e12. [Google Scholar] [CrossRef]
- Fantin, B.; Joly, V.; Elbim, C.; Golmard, J.L.; Gougerot-Pocidalo, M.A.; Yeni, P.; Carbon, C. Lymphocyte subset counts during the course of community-acquired pneumonia: Evolution according to age, human immunodeficiency virus status, and etiologic microorganisms. Clin. Infect. Dis. 1996, 22, 1096–1098. [Google Scholar] [CrossRef] [PubMed]
- Le Tulzo, Y.; Pangault, C.; Gacouin, A.; Guilloux, V.; Tribut, O.; Amiot, L.; Tattevin, P.; Thomas, R.; Fauchet, R.; Drenou, B. Early circulating lymphocyte apoptosis in human septic shock is associated with poor outcome. Shock 2002, 18, 487–494. [Google Scholar] [CrossRef]
- Wyllie, D.H.; Bowler, I.C.; Peto, T.E. Relation between lymphopenia and bacteraemia in UK adults with medical emergencies. J. Clin. Pathol. 2004, 57, 950–955. [Google Scholar] [CrossRef] [PubMed]
- Unsinger, J.; Kazama, H.; McDonough, J.S.; Hotchkiss, R.S.; Ferguson, T.A. Differential lymphopenia-induced homeostatic proliferation for CD4+ and CD8+ T cells following septic injury. J. Leukoc. Biol. 2009, 85, 382–390. [Google Scholar] [CrossRef]
- Zahorec, R. Ratio of neutrophil to lymphocyte counts--rapid and simple parameter of systemic inflammation and stress in critically ill. Bratisl. Lek. Listy 2001, 102, 5–14. [Google Scholar]
- Sarraf, K.M.; Belcher, E.; Raevsky, E.; Nicholson, A.G.; Goldstraw, P.; Lim, E. Neutrophil/lymphocyte ratio and its association with survival after complete resection in non-small cell lung cancer. J. Thorac. Cardiovasc. Surg. 2009, 137, 425–428. [Google Scholar] [CrossRef] [PubMed]
- Suliman, M.A.M.; Juma, A.A.B.; Ali Almadhani, A.A.; Pathare, A.V.; Alkindi, S.S.; Uwe Werner, F. Predictive value of neutrophil to lymphocyte ratio in outcomes of patients with acute coronary syndrome. Arch. Med. Res. 2010, 41, 618–622. [Google Scholar] [CrossRef]
- Azab, B.; Jaglall, N.; Atallah, J.P.; Lamet, A.; Raja-Surya, V.; Farah, B.; Lesser, M.; Widmann, W.D. Neutrophil-lymphocyte ratio as a predictor of adverse outcomes of acute pancreatitis. Pancreatology 2011, 11, 445–452. [Google Scholar] [CrossRef]
- Torun, S.; Tunc, B.D.; Suvak, B.; Yildiz, H.; Tas, A.; Sayilir, A.; Ozderin, Y.O.; Beyazit, Y.; Kayacetin, E. Assessment of neutrophil-lymphocyte ratio in ulcerative colitis: A promising marker in predicting disease severity. Clin. Res. Hepatol. Gastroenterol. 2012, 36, 491–497. [Google Scholar] [CrossRef] [PubMed]
- Park, C.H.; Han, D.S.; Jeong, J.Y.; Eun, C.S.; Yoo, K.S.; Jeon, Y.C.; Sohn, J.H. The Optimal Cut-Off Value of Neutrophil-to-Lymphocyte Ratio for Predicting Prognosis in Adult Patients with Henoch-Schonlein Purpura. PLoS ONE 2016, 11, e0153238. [Google Scholar] [CrossRef] [PubMed]
- Hartmann, E.L.; Gatesman, M.; Roskopf-Somerville, J.; Stratta, R.; Farney, A.; Sundberg, A. Management of leukopenia in kidney and pancreas transplant recipients. Clin. Transplant. 2008, 22, 822–828. [Google Scholar] [CrossRef] [PubMed]
- Morris, A.; ACP Journal Club. Review: CURB65, CRB65, and Pneumonia Severity Index similarly predict mortality in community-acquired pneumonia. Ann. Intern. Med. 2011, 154, JC4-13. [Google Scholar] [CrossRef] [PubMed]
- Chalmers, J.D.; Singanayagam, A.; Akram, A.R.; Mandal, P.; Short, P.M.; Choudhury, G.; Wood, V.; Hill, A.T. Severity assessment tools for predicting mortality in hospitalised patients with community-acquired pneumonia. Systematic review and meta-analysis. Thorax 2010, 65, 878–883. [Google Scholar] [CrossRef]
- Tu, G.W.; Ju, M.J.; Xu, M.; Rong, R.M.; He, Y.Z.; Xue, Z.G.; Zhu, T.Y.; Luo, Z. Combination of caspofungin and low-dose trimethoprim/sulfamethoxazole for the treatment of severe Pneumocystis jirovecii pneumonia in renal transplant recipients. Nephrol. Carlton 2013, 18, 736–742. [Google Scholar] [CrossRef]
- Tu, G.W.; Ju, M.J.; Han, Y.; He, H.Y.; Rong, R.M.; Xu, M.; Xue, Z.G.; Zhu, T.Y.; Luo, Z. Moderate-dose glucocorticoids as salvage therapy for severe pneumonia in renal transplant recipients: A single-center feasibility study. Ren. Fail. 2014, 36, 202–209. [Google Scholar] [CrossRef][Green Version]
- Tu, G.W.; Ju, M.J.; Zheng, Y.J.; Zhu, D.M.; Xu, M.; Rong, R.M.; Zhu, T.Y.; Luo, Z. An interdisciplinary approach for renal transplant recipients with severe pneumonia: A single ICU experience. Intensive Care Med. 2014, 40, 914–915. [Google Scholar] [CrossRef] [PubMed]
- Tu, G.; He, H.; Yin, K.; Ju, M.; Zheng, Y.; Zhu, D.; Luo, Z. High-flow Nasal Cannula Versus Noninvasive Ventilation for Treatment of Acute Hypoxemic Respiratory Failure in Renal Transplant Recipients. Transpl. Proc. 2017, 49, 1325–1330. [Google Scholar] [CrossRef]
- Metlay, J.P.; Waterer, G.W.; Long, A.C.; Anzueto, A.; Brozek, J.; Crothers, K.; Cooley, L.A.; Dean, N.C.; Fine, M.J.; Flanders, S.A.; et al. Diagnosis and Treatment of Adults with Community-acquired Pneumonia. An Official Clinical Practice Guideline of the American Thoracic Society and Infectious Diseases Society of America. Am. J. Respir. Crit. Care Med. 2019, 200, e45–e67. [Google Scholar] [CrossRef] [PubMed]
- Kalil, A.C.; Metersky, M.L.; Klompas, M.; Muscedere, J.; Sweeney, D.A.; Palmer, L.B.; Napolitano, L.M.; O’Grady, N.P.; Bartlett, J.G.; Carratala, J.; et al. Management of Adults With Hospital-acquired and Ventilator-associated Pneumonia: 2016 Clinical Practice Guidelines by the Infectious Diseases Society of America and the American Thoracic Society. Clin. Infect. Dis. 2016, 63, e61–e111. [Google Scholar] [CrossRef]
- Su, Y.; Ju, M.J.; Ma, J.F.; Tu, G.W.; He, H.Y.; Gu, Z.Y.; Song, Y.L.; Zhang, J.; Luo, Z. Lactate dehydrogenase as a prognostic marker of renal transplant recipients with severe community-acquired pneumonia: A 10-year retrospective study. Ann. Transl. Med. 2019, 7, 660. [Google Scholar] [CrossRef] [PubMed]
- Mackinnon, A.; Mulligan, R. Combining cognitive testing and informant report to increase accuracy in screening for dementia. Am. J. Psychiatry 1998, 155, 1529–1535. [Google Scholar] [CrossRef]
- DeLong, E.R.; DeLong, D.M.; Clarke-Pearson, D.L. Comparing the areas under two or more correlated receiver operating characteristic curves: A nonparametric approach. Biometrics 1988, 44, 837–845. [Google Scholar] [CrossRef]
Publisher’s Note: MDPI stays neutral with regard to jurisdictional claims in published maps and institutional affiliations. |
© 2020 by the authors. Licensee MDPI, Basel, Switzerland. This article is an open access article distributed under the terms and conditions of the Creative Commons Attribution (CC BY) license (http://creativecommons.org/licenses/by/4.0/).