Article

Association of Altered Baseline Hematological Parameters with Adverse Tuberculosis Treatment Outcomes

by
Arul Nancy Pandiarajan
1,2,†,
Nathella Pavan Kumar
2,3,*,†,
Kadar Moideen
1,
Kannan Thiruvengadam
2,
Syed Hissar
2,
Shanmugam Sivakumar
2,3,
Ramalingam Bethunaickan
2,3,
Vijay Viswanathan
4,
Hardy Kornfeld
5 and
Subash Babu
1,6
1
National Institutes of Health-NIRT—International Center for Excellence in Research, Chennai 600 031, India
2
ICMR-National Institute for Research in Tuberculosis, Chennai 600 031, India
3
Academy of Scientific and Innovative Research, Ghaziabad 201 002, India
4
Prof. M. Viswanathan Diabetes Research Center, Chennai 600 013, India
5
University of Massachusetts Chan Medical School, Worcester, MA 01655, USA
6
Laboratory of Parasitic Diseases (LPD), National Institute of Allergy and Infectious Diseases (NIAID), National Institutes of Health (NIH), Bethesda, MD 20892, USA
*
Author to whom correspondence should be addressed.
These authors contributed equally to this work.
Pathogens 2025, 14(2), 146; https://doi.org/10.3390/pathogens14020146
Submission received: 6 December 2024 / Revised: 17 January 2025 / Accepted: 27 January 2025 / Published: 4 February 2025
(This article belongs to the Section Immunological Responses and Immune Defense Mechanisms)

Abstract

:
Tuberculosis (TB) treatment monitoring is an essential tool for effective TB treatment management. Identifying parameters that predict adverse TB treatment outcomes could significantly improve clinical management. The association of hematological parameters with poor TB treatment outcomes is not well defined. To study the relationship of hematological parameters with TB treatment outcomes, we examined data from pulmonary tuberculosis (PTB) patients with successful (controls) and unsuccessful (cases) treatment outcomes. We enrolled 68 cases and 133 controls through a nested 1:2 case–control study, matching for age, sex, body mass index, diabetes status, alcohol and smoking. Hematological profiling showed significant difference in the absolute counts of white blood cells, lymphocytes, neutrophils and monocytes between cases and controls. In addition, increased neutrophil to lymphocyte ratio (NL) ratio and monocyte to lymphocyte (ML) ratio were present in cases in comparison to controls. Similarly, decreased hematocrit and red blood cell counts were detected in cases when compared with controls. Univariate and multivariate analysis demonstrated a significant association of absolute counts of WBC, neutrophils, monocytes, NL and ML ratios with poor treatment outcomes. The altered baseline hematological parameters are clearly associated with the poor TB treatment outcomes, showing potential for clinical prediction to enhance management of at-risk cases.

1. Introduction

Tuberculosis (TB) is a devastating infectious disease with the highest mortality rate, claiming 1.6 million lives worldwide with a 4.5% increase globally [1]. Despite the global execution of the DOTS (directly observed therapy short-course) program, TB has remained a high-burden disease for the past three decades [2]. India is one of the eight countries with the highest burden of new TB cases [1], and the current incidence rate in India had a 19% increase in 2021 [3]. The high prevalence of TB is due to various risk factors like age, gender, HIV, diabetes, household crowding, indoor air pollution, immune status and lifestyle habits like smoking, alcoholism and work-related risks [4]. Published studies have reported that 57% of TB patients were underweight, 88% were anemic, and 48% of the anemia cases were due to iron deficiency [5]. However, our research revealed no significant differences in hematological parameters among latent TB individuals, irrespective of their nutritional status [6,7]. Unfavorable or adverse treatment outcomes in TB include recurrence, failure and loss of follow-up. Recurrent TB includes both relapse and re-infection, which are second episodes of TB disease where identical isolates lead to relapse and non-identical isolates lead to re-infection. Smear-positive relapse cases are around 24% among all the smear-positive cases that hamper TB treatment management [8]. A successful TB treatment is the cure of TB disease, which acts as an indicator for the effective management of the End TB strategy [1].
Currently available bacteriological examinations like sputum smear and culture grade are still the confirmatory tests to determine the presence of active pulmonary tuberculosis (PTB) and to monitor the degree of disease progression [9]. They are time-consuming with poor sensitivity. Radiological investigations like chest X-ray (CXR) highlight the severity of the disease through cavitation or other pathology in the lungs [10]. Other molecular tests like GeneXpert and LAMP assay are more sensitive than sputum smear culture but quite expensive and exhibit the cumbersome process of primer design [11,12]. The existing baseline diagnostic tools have limitations, as they are not efficient to determine the early prediction of treatment outcomes.
Hematological perturbation is common in PTB and has been evaluated as a diagnostic and prognostic marker [13]. Very few studies have been conducted on the impact of the hematological profile that determine adverse TB treatment outcomes. Hence, we wanted to elucidate whether hematological parameters could serve as predictive biomarkers for poor or adverse PTB treatment outcomes in this population.

2. Materials and Methods

2.1. Study Population

The subjects in this study were recruited upon approval obtained from the Ethics Committees of the Prof. M. Viswanathan Diabetes Research Center and National Institute for Research in Tuberculosis (NIRT) with proper informed consent. The subjects were from Chennai, South India, and enrolled in the prospective Effect of Diabetes on Tuberculosis Severity (EDOT) study. Adults in the age group of 20 to 75 with new sputum smear and culture positives, as well as positive by NAAT, were included in the study. Positive sputum culture on solid medium (Lowenstein–Jensen media) with an appropriate chest X-ray confirmed the diagnosis of PTB. In addition, X-ray scores were also recorded for all the participants. Individuals with any previous episodes of TB disease, TB treatment in the past, drug-resistant TB, positive HIV status, under immune suppression medications and pregnant and lactating women were excluded from the study. All the recruited pulmonary TB patients were given anti-TB treatment in accordance with End TB strategy, as recommended by the WHO, which was successfully managed by the NTEP (National Tuberculosis Elimination Program) [14]. The subjects were followed up throughout and after treatment, starting from month 6 and continuing until 1 year after the completion of the treatment. The current hematological study is retrospective. Treatment outcome was classified into adverse (poor) and good treatment outcomes, in which good refers to microbiological cure and “adverse” refers to treatment failure, recurrence and death. The microbiological cure was diagnosed by negative sputum culture at months 5 and 6 of TB treatment, whereas treatment failure was diagnosed as positive sputum culture at month 5 or month 6. Individuals with good treatment outcomes were named as controls, and those with adverse treatment outcomes as cases. Here, we have 68 cases and 133 controls, which were obtained through a nested case–control matching of cases to controls in a 1:2 ratio for age, sex, body mass index (BMI) and diabetes status. The demographic and epidemiological data have been previously reported [15].

2.2. Hematological Parameters

Around 2 mL of blood was collected intravenously in EDTA (ethylene diamine tetra acetic acid)-coated tubes and was analyzed in Beckman Coulter DxH520, an automated hematology analyzer. The complete blood count (CBC) includes the relative and absolute count of RBC (red blood cell), WBC (white blood cells), lymphocytes, eosinophil, neutrophils, monocytes, basophils, platelets, hematocrit and Hb estimation. Apart from this, NLR and MLR were calculated with the obtained cell counts.

2.3. Statistical Data Analysis

Statistical analysis was performed using GraphPad PRISM V.9.0. Statistical significance was considered if the p-value was < 0.05. To compare the groups, the Mann–Whitney test was applied. The median and interquartile range were used as the measure of central tendency and dispersion. A univariate model was developed to study the association of hematological parameters with poor TB treatment outcomes. Multivariate logistic regression analysis was carried out by adjusting multiple variables, including age, gender, body mass index, diabetic status, alcoholism, smoking and smear grade status. Both models were performed using IBM SPSS Statistics 25 (2017, IBM Corporation, Armonk, NY, USA) Spearman’s correlation was performed using the R studio (2021.09.2+382) platform. The combination of predictive biomarkers was determined by using an online application service (CombiROC v1.2).

3. Results

3.1. Characteristics of the Study Population

The demographics of the study population are shown in Table 1. There were no significant differences in terms of age, gender, diabetes status, smear and culture grade, BMI and lifestyle risk factors like smoking and alcoholism between these two groups of TB treatment outcomes (Table 1).

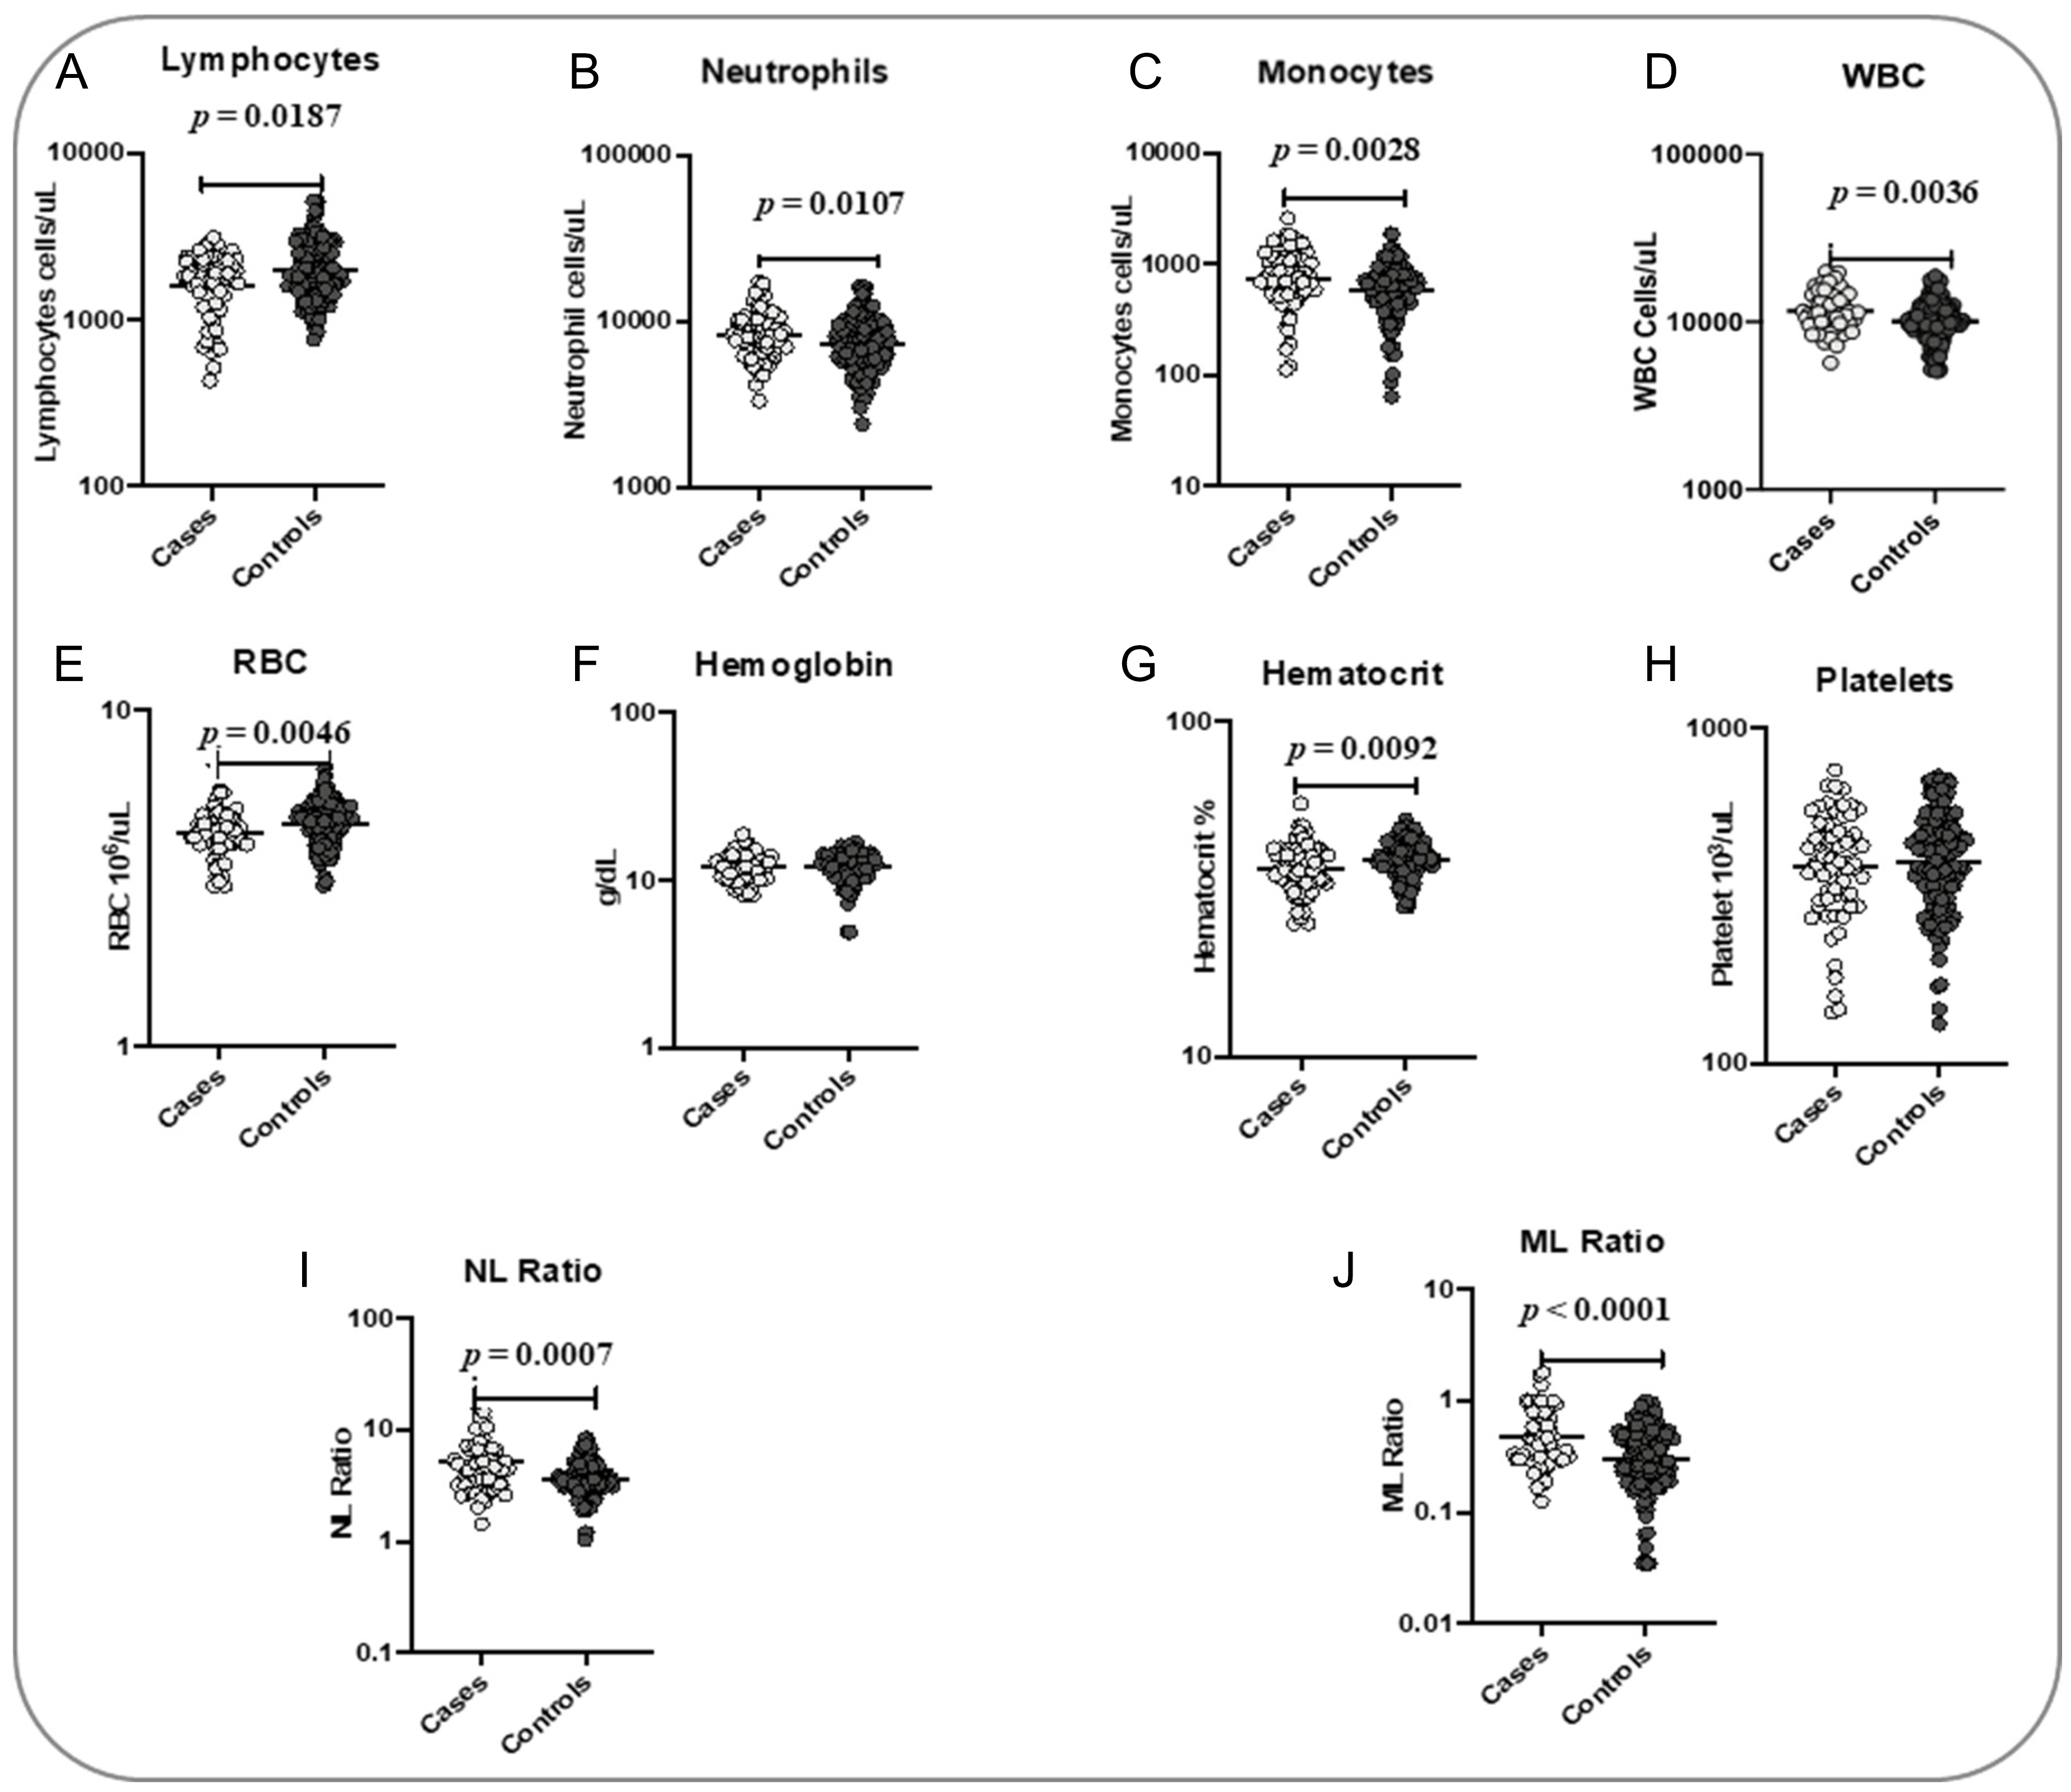
3.2. Association of Hematological Parameters with Poor Treatment Outcomes

To determine the association of hematological parameters with the TB treatment outcome, we measured the baseline hematological parameters, including Hb, RBC, hematocrit, platelets, absolute WBC, neutrophil, lymphocyte and monocyte counts (Figure 1). The RBC count (p = 0.0046), hematocrit (p = 0.0092) and absolute lymphocyte count (p = 0.0187) were significantly lower in cases when compared with the controls. Furthermore, the absolute WBC (p = 0.0036), neutrophil (p = 0.0107) and monocyte counts (p = 0.0028) were significantly higher in cases than in controls. The NLR (p = 0.0007) and MLR (p = 0.0001) were also significantly higher in cases compared to controls. Hb and platelet levels did not show any significant difference between the groups (Figure 1).

3.3. Logistic Regression Analysis of the Association of Hematological Parameters with Treatment Outcomes

Univariate and multivariate analysis revealed that some of the hematological parameters are strongly associated with poor treatment outcomes without the influence of the other confounding factors. Interestingly, in the univariate analysis, we could see the significance in the absolute counts of WBC (OR, 3.51; 95% CI, 1.62–7.59; p = 0.001), neutrophils (OR, 2.19; 95% CI, 1.20–3.98; p = 0.011), monocytes (OR, 1.68; 95% CI, 1.14–2.47; p = 0.008), NLR (OR, 2.68; 95% CI, 1.68–4.26; p < 0.001) and MLR (OR, 2.32; 95% CI, 1.59–3.39; p< 0.001), and they were all strongly associated with a higher risk of adverse treatment outcomes. In contrast, RBC (OR, 0.14; 95% CI, 0.03–0.55; p = 0.005), hematocrit (OR, 0.13; 95% CI, 0.03–0.55; p = 0.006) and absolute lymphocyte count (OR, 0.44; 95% CI, 0.27–0.74; p = 0.002) were associated with a lower risk of adverse treatment outcomes. Multivariate analysis further confirmed the above significance with the adjusted odd ratio of the absolute counts of WBC (aOR, 3.14; 95% CI, 1.39–7.08; p= 0.006), neutrophils (aOR, 1.91; 95% CI, 1.01–3.62; p= 0.046), monocytes (aOR, 1.63; 95% CI, 1.08–2.46; p= 0.019), NLR (aOR, 2.52; 95% CI, 1.55–4.09; p < 0.001) and MLR (aOR, 2.30; 95% CI, 1.54–3.45; p < 0.001), all associated with a high risk of adverse treatment outcomes. In multivariate analysis, RBC (aOR, 0.15; 95% CI, 0.04–0.65; p = 0.011), hematocrit (aOR, 0.14; 95% CI, 0.03–0.65; p = 0.012) and absolute lymphocyte count (aOR, 0.45; 95% CI, 0.26–0.77; p= 0.003) were associated with a lower risk of adverse treatment outcomes (Table 2).

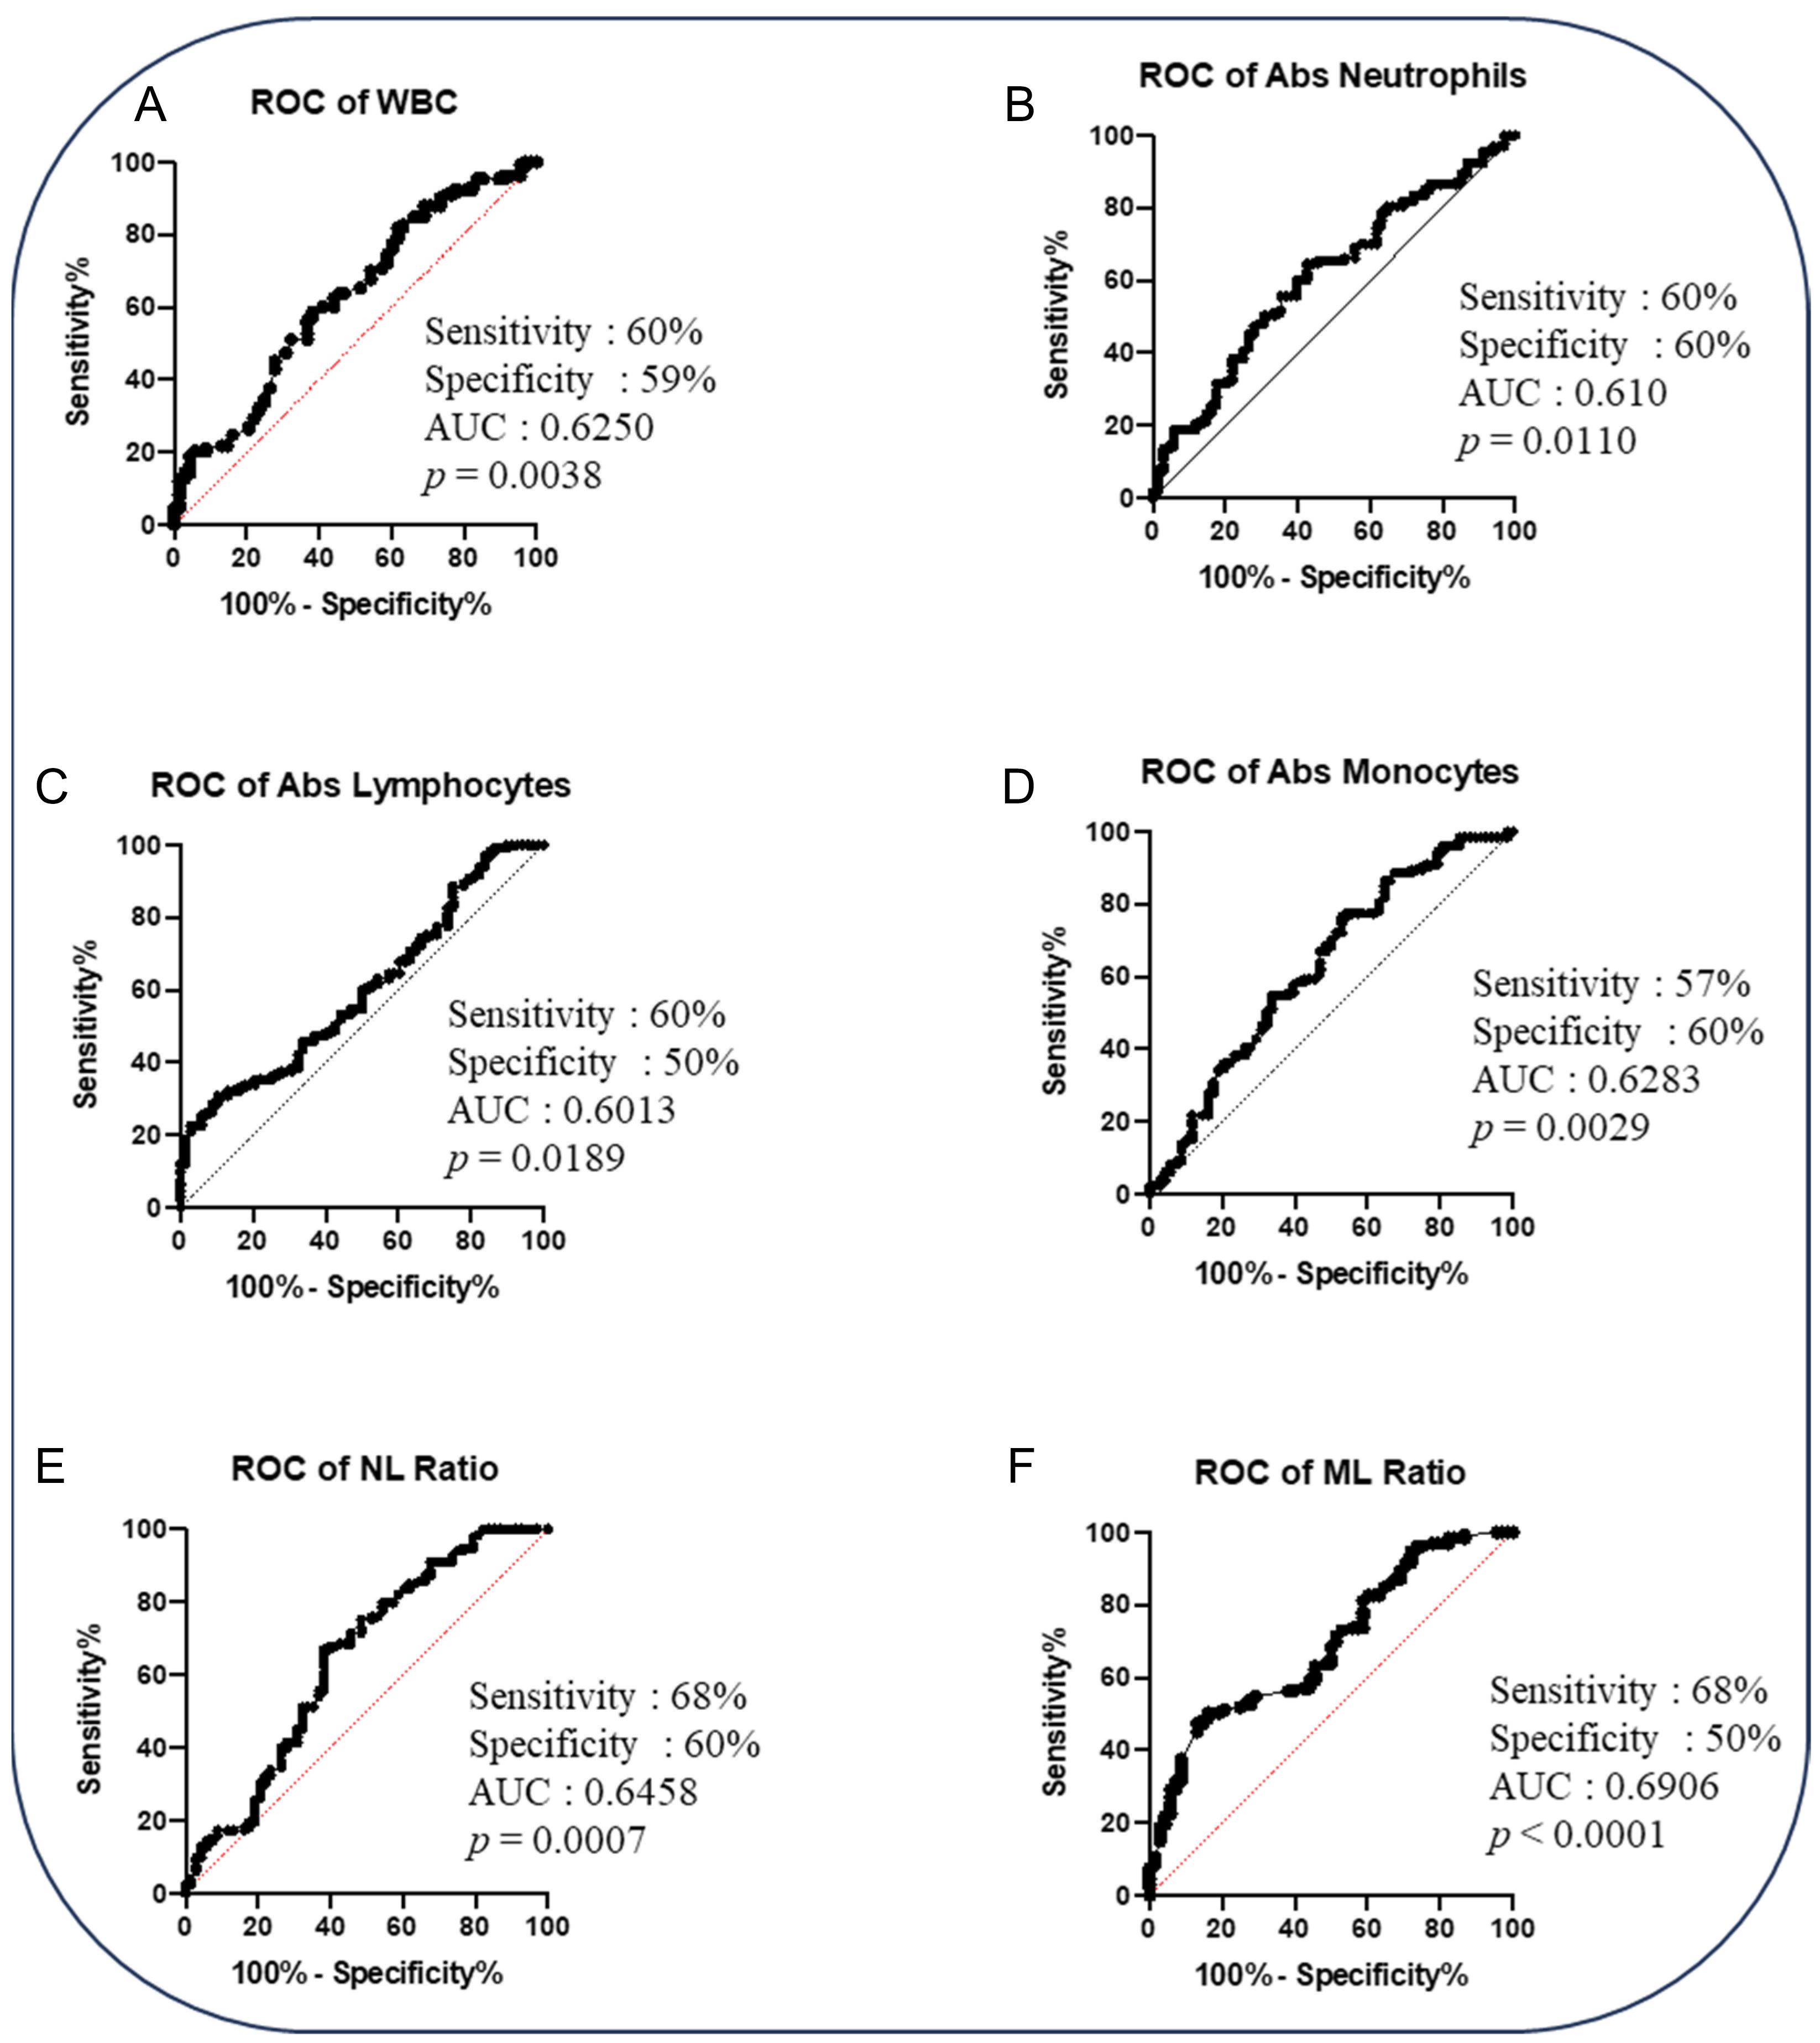
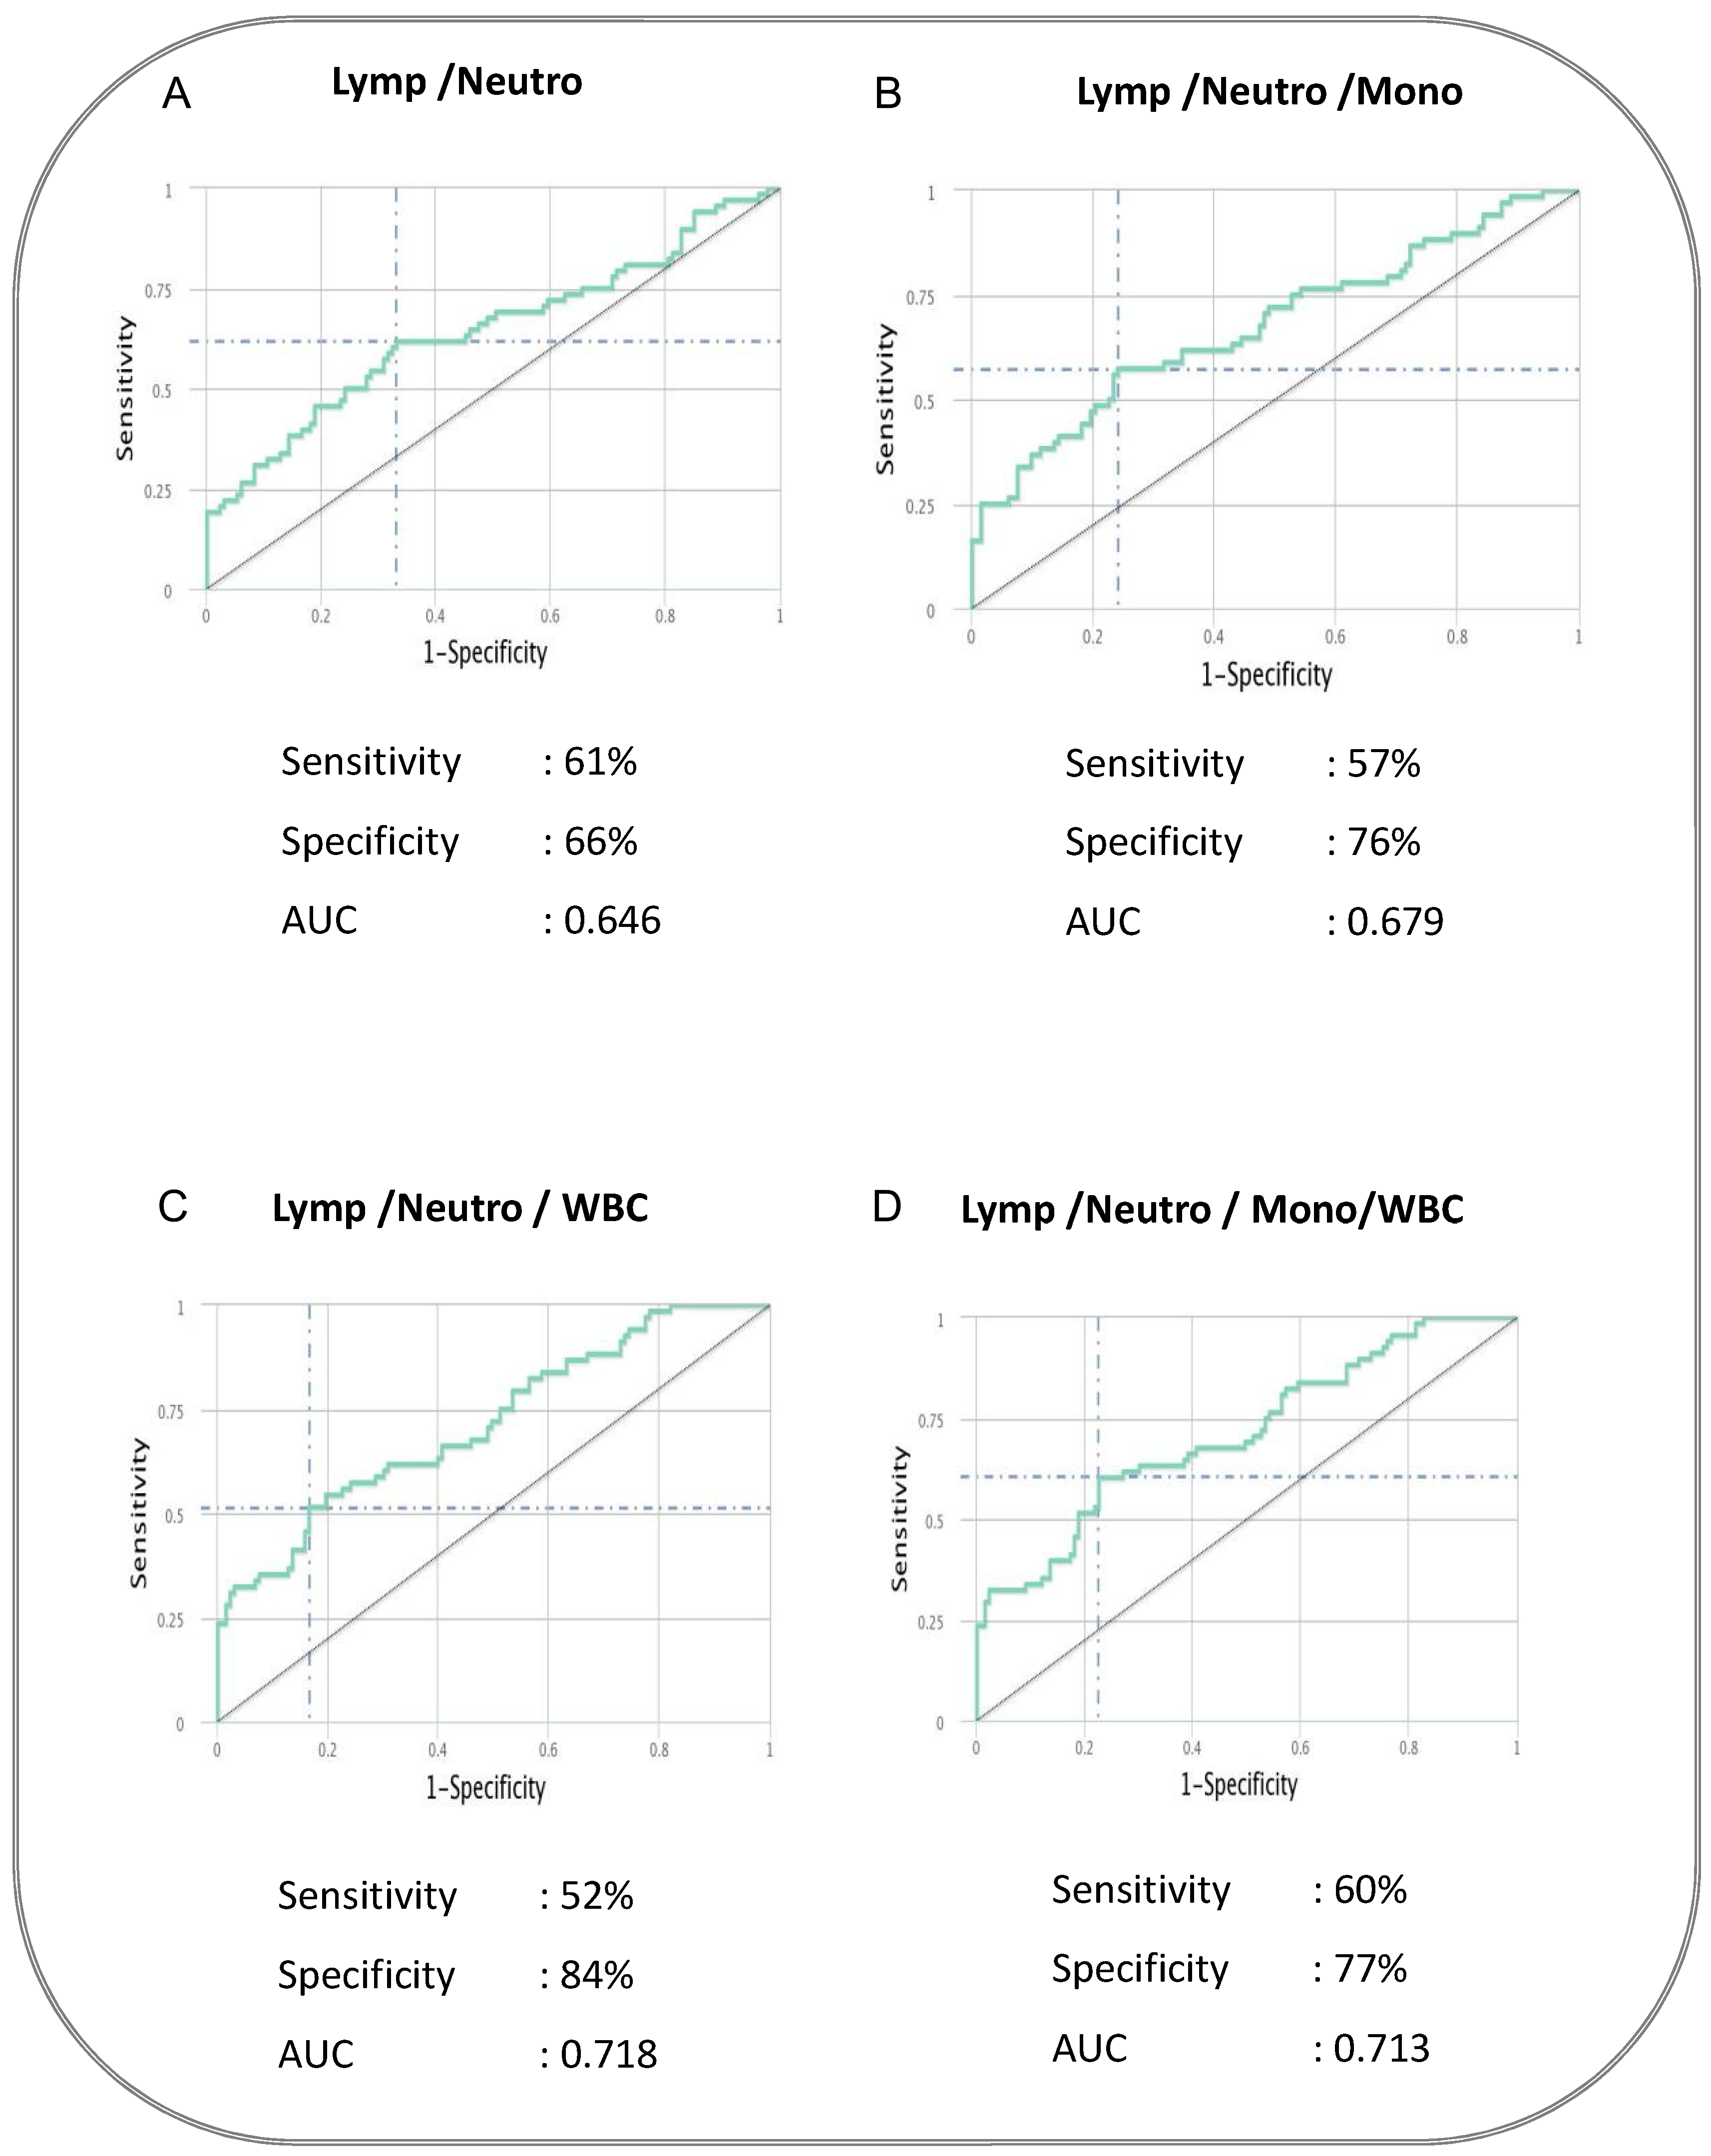
3.4. Baseline Signature of Two or Three Hematological Parameters Could Be a Predictive Biomarker Discriminating Adverse TB Treatment Outcome from PTB Cured Controls

To determine whether we could deduce a hematological signature that could be used as a predictive biomarker for cases versus controls, we performed an ROC analysis and a combined ROC analysis. The ROC curve of logistic regression model exhibited AUC of 0.646, sensitivity of 68% and specificity of 60% in NL Ratio, whereas in ML Ratio, it presented AUC of 0.691, sensitivity of 68% and specificity of 50% to distinguish cases from controls (shown in Figure 2). ROC analysis of various combinations of hematological parameters between the absolute count of WBC, lymphocytes, neutrophils and monocytes displayed a good AUC (0.646–0.718) with sensitivity (52–61%) and specificity (66–84%) to distinguish cases from cured controls (shown in Figure 3). Thus, alteration in the hematological parameters can be further evaluated as a biomarker to predict adverse treatment outcomes.

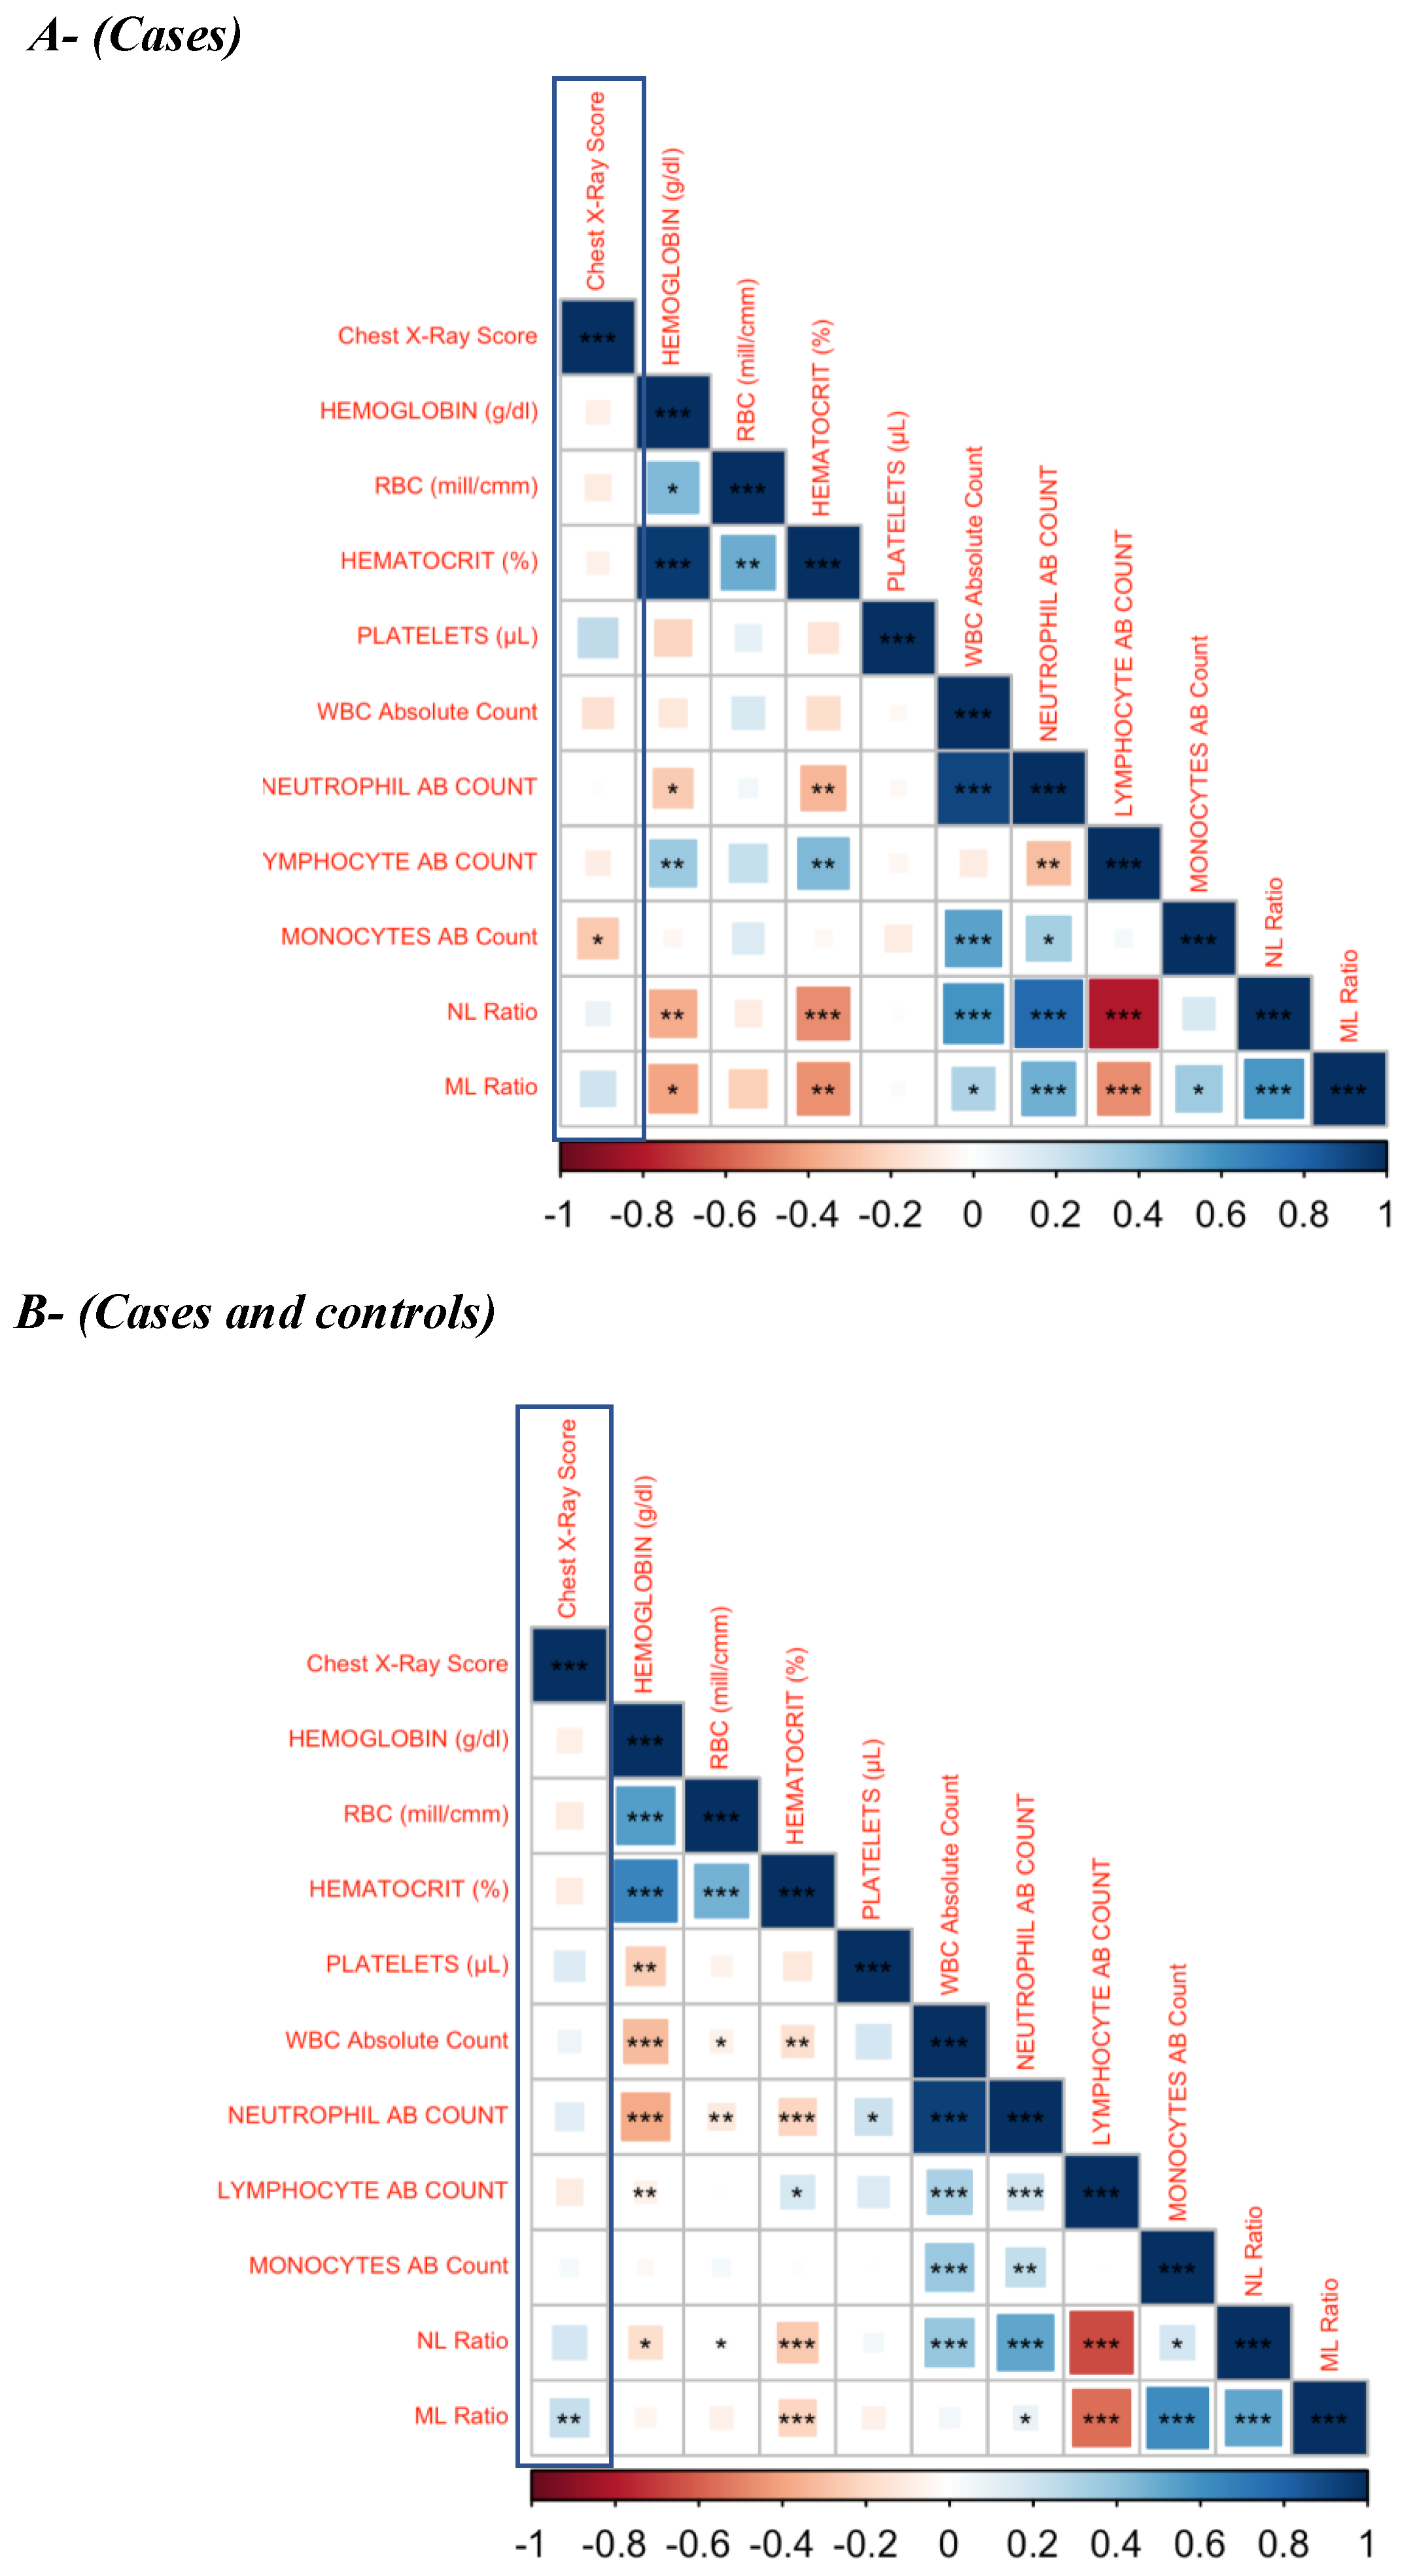
3.5. Baseline Hematological Parameters Are Weakly Correlated with the Chest X-Ray Score in Active PTB Patients

Since lung pathology plays a crucial role in all of the adverse treatment outcomes, we examined the association of hematological parameters with the chest X-ray score shown in Figure 4 (A—cases and B—combined cases and controls). The monocyte absolute count was statistically significant and weakly correlated in cases, with a p-value of 0.038 (Figure 4A).
The ML (p = 0.0016) ratio was also weakly associated with chest X-ray score in the combined status of cases and cured control. A negative and weak association of CXR score with other parameters, such hemoglobin, hematocrit, RBC, absolute count of WBC, neutrophil, lymphocyte and monocytes, was observed in cases, with no statistical significance (Table 3 and Table 4).

4. Discussion

The ability to identify those individuals at risk for adverse outcomes at the time of diagnosis could be used to target novel strategies to enhance results and improve TB treatment outcomes. There are many underlying risk factors for adverse treatment outcomes, including the presence of drug-resistant bacteria, lifestyle habits like smoking and alcoholism, co-morbidities like diabetes and HIV and low BMI [16]. Treatment failure is known to be higher in PTB than in extrapulmonary TB [17]. Hence, it is essential to elucidate the host immune response and virulence of the microorganism that leads to adverse treatment outcomes. Hematological profiling is widely available and performed in diverse clinical studies. Several studies reported that decreased RBC, WBC and platelet counts, as well as serum Hb, increased erythrocyte sedimentation rate (ESR) and C-reactive protein are commonly observed in TB patients [18]. Hematological parameters were identified as a biomarker in the diagnosis and follow-up of PTB patients co-infected with HIV [19]. Low Hb levels also act as an indicator of TB disease severity before TB treatment [20]. Evidence has accumulated in recent years that blood cell counts, in combination with clinical manifestations, can predict TB disease progression and treatment outcomes [13,21]. Most of the previous studies focused on neutrophil-to-lymphocyte (NLR) ratio, monocyte-to-lymphocyte (MLR) ratio, erythrocyte sedimentation rate (ESR) and Hb level. All these hematological parameters help determine disease severity [22], associated with recurrence, co-morbid conditions and mortality rate [23]. Our study on the association of hematological parameters with TB treatment outcomes reveals similar results, with diminished RBC count and elevated WBC count in cases compared to cured controls.
Most of the previous studies reported that PTB patients exhibit diminished levels of Hb, WBC count [24], packed cell volume (PCV), mean corpuscular Hb and mean corpuscular volume [25], as well as CD4 count [26], elevated ESR, mean cell Hb concentration, relative plasma viscosity and euglobulin lysis time [27]. Moreover, certain hematological alterations like CD4 lymphopenia, neutropenia, thrombocytopenia, anemia and thrombocytosis were predominant only in PTB patients and not in PTB with HIV [19,28]. This shows the unique signature of hematological parameters in PTB patients that are not influenced by HIV. In the present study, we found no significant difference in Hb and platelets between cases and controls.
Pre-treatment NLR and MLR were recommended as clinical diagnostic tools related to TB disease severity [29]. Upon TB treatment, MLR and NLR were significantly diminished and correlated with culture-negative status [30]. Our present study complements these data, as MLR and NLR were higher at baseline in cases than in controls. In a randomized clinical study of the South Indian population, it was reported that hematological parameters like percentages of Hb, neutrophils and lymphocytes greatly change in newly diagnosed PTB patients after anti-TB treatment, which reveals the impact of ATT in improving the immune response [31]. Newly diagnosed PTB patients displayed altered hematological parameters, such as elevated ESR and platelet count, diminished packed cell volume and Hb [32]. Our current study does not show any statistical significance in platelet and Hb between the cases and the cured controls.
Re-treatment of drug sensitive PTB was predicted by the initial radiological presentation [33]. In this study, there was a significant but weak association between the baseline hematological parameters and chest X-ray in cases (absolute count of monocyte) and the combined status of both cases and cured controls (ML ratio). Other hematological parameters with no statistical significance and a weak association with the CXR score showed that the baseline hematological profile predicts unfavorable TB treatment outcomes even without the influence of the CXR score. However, incorporating the CXR score is likely to enhance the predictive value of the model that includes hematological parameters.
Most of our results are concordant with previous studies, highlighting the utility of analyzing the association of hematological parameters between good and poor TB treatment outcomes in clearly defined and clinically relevant study groups in the Indian population. The results of our study and others cited here provide a basis for designing diagnostic and, ultimately, interventional trials seeking to leverage baseline predictors of unfavorable TB treatment outcomes to stratify at-risk individuals for enhanced management strategies. Despite the value of the results, our study suffers from certain limitations, as it only includes baseline hematological data. Although the sample size seems to be moderate, these results were not validated with an external cohort from a different ethnic population. The ultimate goal is to safeguard PTB patients at risk of failing TB treatment or experiencing recurrence by utilizing a routine blood cell count. When integrated with clinical algorithms, this approach could serve as a simple yet effective tool for treatment monitoring. By combining complete blood count data with existing microbiological and radiological markers, along with emerging cytokine profiles, healthcare providers could better stratify PTB patients at risk of treatment failure or recurrence. This proactive strategy would enable the identification of vulnerable populations and facilitate the provision of additional clinical care well in advance.

5. Conclusions

In summary, baseline hematological parameters show alterations that are associated with TB treatment outcomes, warranting further validation.

Author Contributions

Designed the study (S.B., N.P.K.); conducted experiments (A.N.P., K.M., S.S.); acquired data (A.N.P., N.P.K., S.S.); analyzed data (A.N.P., N.P.K., K.T.); contributed reagents and also revised subsequent drafts of the manuscript (H.K., S.B., N.P.K.); responsible for the enrolment of participants and also contributed to acquisition and interpretation of clinical data (V.V., S.H., R.B.); wrote the manuscript (A.N.P., N.P.K., S.B.). All authors have read and agreed to the published version of the manuscript.

Funding

This project has been funded in whole or in part with federal funds from the Government of India’s (GOI) Department of Biotechnology (DBT), the Indian Council of Medical Research (ICMR), the United States National Institutes of Health (NIH), the National Institute of Allergy and Infectious Diseases (NIAID) and the Office of AIDS Research (OAR), and distributed in part by CRDF Global [grant USB1-31149-XX-13]. This work has also been funded by CRDF Global RePORT India Consortium Supplemental Funding [grant OISE-17-62911-1]. The contents of this publication are solely the responsibility of the authors and do not represent the official views of the DBT, the ICMR, the NIH, or CRDF Global. This work has also been funded in part by the Division of Intramural Research, NIAID, NIH.

Institutional Review Board Statement

All methods were carried out in accordance with the relevant guidelines and regulations. The study participants were recruited upon approval obtained from the Ethics Committees of the Prof. M. Viswanathan Diabetes Research Center (ECR/51/INST/TN/2013/MVDRC/01) and National Institute for Research in Tuberculosis (NIRT) (NIRT-INo:2014004).

Informed Consent Statement

Informed written consent was obtained from all participants involved in the study.

Data Availability Statement

All data generated or analyzed during this study are included in this published article.

Acknowledgments

We thank the staff of the Department of Clinical Research and the Department of Bacteriology, NIRT, for their valuable assistance in bacterial cultures and radiology, as well as the staff of MVDRC, RNTCP and Chennai Corporation for their valuable assistance in recruiting the patients for this study. The data in this manuscript were collected as part of the Regional Prospective Observational Research for Tuberculosis (RePORT) India Consortium.

Conflicts of Interest

The authors declare no conflicts of interest.

Abbreviations

TBtuberculosis
PTBpulmonary tuberculosis
WBCwhite blood cells
MLmonocyte to lymphocyte
NLneutrophil to lymphocyte
DOTSDirectly observed therapy short-course
CXRChest X-ray
NIRTNational Institute for Research in Tuberculosis
EDOTEffect of Diabetes on Tuberculosis Severity
NTEP National Tuberculosis Elimination Program
BMIbody mass index
CBCComplete blood count
aORadjusted odds ratio
HbHemoglobin
ESRerythrocyte sedimentation rate
PCVpacked cell volume

References

  1. WHO. Global Tuberculosis Report 2022; WHO Report; WHO: Gevena, Switzerland, 2022. [Google Scholar]
  2. Chakaya, J.; Petersen, E.; Nantanda, R.; Mungai, B.N.; Migliori, G.B.; Amanullah, F.; Lungu, P.; Ntoumi, F.; Kumarasamy, N.; Maeurer, M. The WHO Global Tuberculosis 2021 Report—Not so good news and turning the tide back to End TB. Int. J. Infect. Dis. 2022, 124 (Suppl. S1), S26–S29. [Google Scholar] [CrossRef] [PubMed]
  3. Report IT. India TB Report 2022; Report IT: New Delhi, India, 2022. [Google Scholar]
  4. Narasimhan, P.; Wood, J.; Macintyre, C.R.; Mathai, D. Risk factors for tuberculosis. Pulm. Med. 2013, 2013, 828939. [Google Scholar] [CrossRef]
  5. Feleke, B.E.; Feleke, T.E.; Biadglegne, F. Nutritional status of tuberculosis patients, a comparative cross-sectional study. BMC Pulm. Med. 2019, 19, 182. [Google Scholar] [CrossRef]
  6. Anuradha, R.; Munisankar, S.; Bhootra, Y.; Kumar, N.P.; Dolla, C.; Babu, S. Malnutrition is associated with diminished baseline and mycobacterial antigen—Stimulated chemokine responses in latent tuberculosis infection. J Infect. 2018, 77, 410–416. [Google Scholar] [CrossRef]
  7. Anuradha, R.; Munisankar, S.; Bhootra, Y.; Kumar, N.P.; Dolla, C.; Kumaran, P.; Babu, S. Coexistent Malnutrition Is Associated with Perturbations in Systemic and Antigen-Specific Cytokine Responses in Latent Tuberculosis Infection. Clin. Vaccine Immunol. 2016, 23, 339–345. [Google Scholar] [CrossRef] [PubMed]
  8. Azhar, G.S. DOTS for TB relapse in India: A systematic review. Lung India 2012, 29, 147–153. [Google Scholar] [CrossRef] [PubMed]
  9. do Socorro Nantua Evangelista, M.; Maia, R.; Toledo, J.P.; Abreu, R.G.d.; Braga, J.U.; Barreira, D.; Trajman, A. Second month sputum smear as a predictor of tuberculosis treatment outcomes in Brazil. BMC Res. Notes 2018, 11, 414. [Google Scholar] [CrossRef]
  10. Nagu, T.J.; Mboka, M.A.; Nkrumbih, Z.F.; Shayo, G.; Mizinduko, M.M.; Komba, E.V.; Maeurer, M.; Zumla, A.; Mugusi, F. Clinical and Imaging Features of Adults with Recurrent Pulmonary Tuberculosis—A Prospective Case-Controlled Study. Int. J. Infect. Dis. 2021, 113 (Suppl. S1), S33–S39. [Google Scholar] [CrossRef] [PubMed]
  11. Parida, M.; Sannarangaiah, S.; Dash, P.K.; Rao, P.V.; Morita, K. Loop mediated isothermal amplification (LAMP): A new generation of innovative gene amplification technique; perspectives in clinical diagnosis of infectious diseases. Rev. Med. Virol. 2008, 18, 407–421. [Google Scholar] [CrossRef] [PubMed]
  12. Abdullahi, U.F.; Naim, R.; Wan Taib, W.R.; Saleh, A.; Muazu, A.; Aliyu, S.; Baig, A.A. Loop-mediated isothermal amplification (LAMP), an innovation in gene amplification: Bridging the gap in molecular diagnostics; a review. Indian J. Sci. Technol. 2015, 8, 17. [Google Scholar] [CrossRef]
  13. Batool, Y.; Pervaiz, G.; Arooj, A.; Fatima, S. Hematological manifestations in patients newly diagnosed with pulmonary tuberculosis. Pak. J. Med. Sci. 2022, 38, 1968–1972. [Google Scholar] [CrossRef] [PubMed]
  14. Kornfeld, H.; West, K.; Kane, K.; Kumpatla, S.; Zacharias, R.R.; Martinez-Balzano, C.; Li, W.; Viswanathan, V. High Prevalence and Heterogeneity of Diabetes in Patients with TB in South India: A Report from the Effects of Diabetes on Tuberculosis Severity (EDOTS) Study. Chest 2016, 149, 1501–1508. [Google Scholar] [CrossRef] [PubMed]
  15. Kumar, N.P.; Moideen, K.; Nancy, A.; Viswanathan, V.; Thiruvengadam, K.; Nair, D.; Banurekha, V.V.; Sivakumar, S.; Hissar, S.; Kornfeld, H.; et al. Plasma Chemokines Are Baseline Predictors of Unfavorable Treatment Outcomes in Pulmonary Tuberculosis. Clin. Infect. Dis. 2021, 73, e3419–e3427. [Google Scholar] [CrossRef]
  16. Koo, H.K.; Min, J.; Kim, H.W.; Lee, J.; Kim, J.S.; Park, J.S.; Lee, S.S. Prediction of treatment failure and compliance in patients with tuberculosis. BMC Infect. Dis. 2020, 20, 622. [Google Scholar] [CrossRef] [PubMed]
  17. Rahimi, B.A.; Rahimy, N.; Mukaka, M.; Ahmadi, Q.; Hayat, M.S.; Wasiq, A.W. Determinants of treatment failure among tuberculosis patients in Kandahar City, Afghanistan: A 5-year retrospective cohort study. Int. J. Mycobacteriol. 2019, 8, 359–365. [Google Scholar] [CrossRef]
  18. Rohini, K.; Surekha Bhat, M.; Srikumar, P.S.; Mahesh Kumar, A. Assessment of Hematological Parameters in Pulmonary Tuberculosis Patients. Indian J. Clin. Biochem. 2016, 31, 332–335. [Google Scholar] [CrossRef]
  19. Abay, F.; Yalew, A.; Shibabaw, A.; Enawgaw, B. Hematological Abnormalities of Pulmonary Tuberculosis Patients with and without HIV at the University of Gondar Hospital, Northwest Ethiopia: A Comparative Cross-Sectional Study. Tuberc. Res. Treat. 2018, 2018, 5740951. [Google Scholar] [CrossRef] [PubMed]
  20. Mendonca, E.B.; Stanis, C.A.S.; Schmaltz, S.; Sant’Anna, F.M.; Vizzoni, A.G.; Mendes-de-Almeida, D.P.; Carvalhaes de Oliveira, R.d.V.; Rolla, V.C. Anemia in tuberculosis cases: A biomarker of severity? PLoS ONE 2021, 16, e0245458. [Google Scholar] [CrossRef]
  21. Petruccioli, E.; Scriba, T.J.; Petrone, L.; Hatherill, M.; Cirillo, D.M.; Joosten, S.A.; Ottenhoff, T.H.; Denkinger, C.M.; Goletti, D. Correlates of tuberculosis risk: Predictive biomarkers for progression to active tuberculosis. Eur. Respir. J. 2016, 48, 1751–1763. [Google Scholar] [CrossRef] [PubMed]
  22. Sahin, F.; Yazar, E.; Yildiz, P. Prominent features of platelet count, plateletcrit, mean platelet volume and platelet distribution width in pulmonary tuberculosis. Multidiscip. Respir. Med. 2012, 7, 38. [Google Scholar] [CrossRef]
  23. Xu, F.; Qu, S.; Wang, L.; Qin, Y. Mean platelet volume (MPV): New diagnostic indices for co-morbidity of tuberculosis and diabetes mellitus. BMC Infect. Dis. 2021, 21, 461. [Google Scholar] [CrossRef] [PubMed]
  24. Kurup, R.; Flemming, K.; Daniram, S.; Marks-James, S.; Roberts Martin, R. Hematological and Biochemistry Profile and Risk Factors Associated with Pulmonary Tuberculosis Patients in Guyana. Tuberc. Res. Treat. 2016, 2016, 6983747. [Google Scholar] [CrossRef]
  25. Mabrouk, M.E.; Exany Samuel, A.A.; Badri Mohamed, A.M. Hematological Parameters Among Tuberculosis Patient Under Treatment; LAP LAMBERT Academic Publishing: Saarbrücken, Germany, 2017. [Google Scholar]
  26. Atomsa, D.; Abebe, G.; Sewunet, T. Immunological markers and hematological parameters among newly diagnosed tuberculosis patients at Jimma University Specialized Hospital. Ethiop. J. Health Sci. 2014, 24, 311–318. [Google Scholar] [CrossRef]
  27. Akpan, P.; AkpotuzorJosephine, O.; Akwiwu, E.C. Some Haematological Parameters of Tuberculosis (TB). J. Nat. Sci. Res. 2012, 2, 51. [Google Scholar]
  28. Kahase, D.; Solomon, A.; Alemayehu, M. Evaluation of Peripheral Blood Parameters of Pulmonary Tuberculosis Patients at St. Paul’s Hospital Millennium Medical College, Addis Ababa, Ethiopia: Comparative Study. J. Blood Med. 2020, 11, 115–121. [Google Scholar] [CrossRef]
  29. Wang, W.; Wang, L.F.; Liu, Y.Y.; Yang, F.; Zhu, L.; Zhang, X.H. Value of the Ratio of Monocytes to Lymphocytes for Monitoring Tuberculosis Therapy. Can. J. Infect. Dis. Med. Microbiol. 2019, 2019, 3270393. [Google Scholar] [CrossRef]
  30. Stefanescu, S.; Cocoş, R.; Turcu-Stiolica, A.; Mahler, B.; Meca, A.-D.; Giura, A.M.C.; Bogdan, M.; Shelby, E.-S.; Zamfirescu, G.; Pisoschi, C.-G. Evaluation of prognostic significance of hematological profiles after the intensive phase treatment in pulmonary tuberculosis patients from Romania. PLoS ONE 2021, 16, e0249301. [Google Scholar] [CrossRef]
  31. Manjunath, M.R.S. Abdul Rub Patwegar: Comparative study of hematological parameters in newly diagnosed tuberculosis patient’s pre-att & after intensive phase of ATT. IP Arch. Cytol. Histopathol. Res. 2018, 3, 185–191. [Google Scholar] [CrossRef]
  32. Dada, M.O.; Umeh, O.E.; Ifeanyichukwu, O.M.; Okudo, U.; Ezema, N. Assessment of Some Haematological Parameters among Pre-Treatment, 2 Months, 4 Months and 6 Months Treatment in Pulmonary Tuberculosis Infected Individuals in Anambra State University Teaching Hospital, Awka. Anambra State, Nigeria. Texila Int. J. Clin. Res. 2017, 3, 20. [Google Scholar] [CrossRef]
  33. Gopalan, N.; Srinivasalu, V.A.; Chinnayan, P.; Velayutham, B.; Bhaskar, A.; Santhanakrishnan, R.; Senguttuvan, T.; Rathinam, S.; Ayyamperumal, M.; Satagopan, K.; et al. Predictors of unfavorable responses to therapy in rifampicin-sensitive pulmonary tuberculosis using an integrated approach of radiological presentation and sputum mycobacterial burden. PLoS ONE 2021, 16, e0257647. [Google Scholar] [CrossRef] [PubMed]
Figure 1. Association of hematological parameters with poor treatment outcomes. The baseline hematological parameters were measured in cases (n = 68) and controls (n = 133). The data are represented as scatter plots, with each circle representing a single individual. p values were calculated using the Mann–Whitney test with Holm’s correction for multiple comparisons. The hematological parameters measured are as follows: (A) Lymphocytes; (B) Neutrophils; (C) Monocytes; (D) WBC; (E) RBC; (F) Hemoglobin; (G) Hematocrit; (H) Platelets; (I) NL Ratio; (J) ML Ratio.
Pathogens 14 00146 g001
Figure 2. The baseline hematological parameters could predict adverse TB treatment outcomes in PTB patients. Altered hematological parameters with cases (n = 68) from cured controls (n = 133). Receiver operator characteristic (ROC) analysis is to evaluate the sensitivity, specificity and area under the curve (AUC) to estimate the capability of the hematological parameters to distinguish favorable versus unfavorable treatment outcomes. The receiver operator characteristics of hematological parameters are as follows: (A) ROC of WBC; (B) ROC of absolute neutrophils; (C) ROC of absolute lymphocytes; (D) ROC of absolute monocytes; (E) ROC of NL ratio; (F) ROC of ML ratio.
Pathogens 14 00146 g002
Figure 3. The baseline combination of hematological parameters could be a predictive biomarker for adverse TB treatment outcomes in PTB patients. Combination of hematological parameters showing its association with adverse treatment outcomes in active pulmonary tuberculosis patients. The combination of receiver operator characteristic (Combi-ROC) analysis moderately discriminates cases from controls. The dual combination is shown in (A) Lymphocytes/Neutrophils; the triple combination is shown in (B) Lymphocytes/Neutrophils/Monocytes and (C) Lymphocytes/Neutrophils/WBC; the quadruple combination was shown in (D) Lymphocytes/Neutrophils/Monocytes/WBC.
Pathogens 14 00146 g003
Figure 4. Correlation Matrix. (A)—cases; (B)–cases and cured controls. The baseline hematological parameters are weakly associated with the chest X-ray score in active PTB patients. Weak association of baseline hematological parameters (Hb, hematocrit, platelet, RBC, absolute count of WBC, neutrophil, lymphocyte, monocyte and NL ratio) with the chest X-ray score was found in active PTB patients. There was a significant but weak association between absolute monocyte count in cases and ML ratio in both cases and cured controls with the chest X-ray score. p value—* <0.05; ** <0.01; *** <0.001.
Pathogens 14 00146 g004
Table 1. Demographic and clinical characteristics of the study population.
ParametersCases (n = 133)Controls (n = 68)p-Value
Age in years45 (36–50)45 (38–52)0.268
Gender
Female23 (17.3)8 (11.8)0.305
Male110 (82.7)60 (88.2)
BMI18 (1620)17 (15–19)0.149
Diabetes Status
Non-Diabetes59 (44.4)26 (38.2)0.406
Diabetes74 (55.6)42 (61.8)
Cough
Absence2 (1.5)1 (1.5)0.985
Presence131 (98.5)67 (98.5)
Dyslipidaemia
Absence133 (100)68 (100)NA
Presence0 (0)0 (0)
Smoking
Never74 (55.6)26 (38.2)0.034
Past26 (19.5)14 (20.6)
Current33 (24.8)28 (41.2)
Alcohol
Never42 (31.6)16 (23.5)0.466
Past25 (18.8)13 (19.1)
Current66 (49.6)39 (57.4)
Cavity
Absence78 (58.6)40 (58.8)>0.990
Presence36 (27.1)18 (26.5)
Not Known19 (14.3)10 (14.7)
Smear a
1+90 (67.7)36 (52.9)0.057
2+40 (30.1)27 (39.7)
3+3 (2.3)5 (7.4)
Culture b
1+61 (45.9)25 (36.8)0.158
2+26 (19.5)10 (14.7)
3+46 (34.6)33 (48.5)
Chest X-ray Score median (IQR)38 (5–130)37 (2–125)0.1943
The values were represented as n (%) and median (first–third quartile); Fisher Exact and Mann–Whitney test were used to check the significance. Abbreviations: BMI—body mass index (calculated as weight in kilograms divided by height in meters squared); DM—diabetes mellitus. a—Under 200× magnification, 1+ indicates 3 to 24 acid-fast bacilli (AFB) in 1 field, 2+ indicates 25 to 250 AFB in 1 field, 3+ indicates more than 250 AFB in 1 field. b—Under 200× magnification, 1+ indicates 10 to 100 colonies, 2+ indicates more than 100 to 200 colonies and 3+ indicates more than 200 colonies.
Table 2. Univariate and multivariate analysis for hematological profile.
MarkerUnivariable Model Multivariable Model
OR (95% CL)p-ValueaOR * (95% CL)p-Value
Hemoglobin (g/dl)0.91 (0.34–2.41)0.850.91 (0.31–2.63)0.859
RBC (mill/cm)0.14 (0.03–0.55)0.0050.15 (0.04–0.65)0.011
Haematocrit0.13 (0.03–0.55)0.0060.14 (0.03–0.65)0.012
Platelets (ul)0.84 (0.47–1.49)0.5410.85 (0.46–1.56)0.593
WBC absolute count3.51 (1.62–7.59)0.0013.14 (1.39–7.08)0.006
Neutrophil absolute count2.19 (1.20–3.98)0.0111.91 (1.01–3.62)0.046
Lymphocyte absolute count0.44 (0.27–0.74)0.0020.45 (0.26–0.77)0.003
Monocyte absolute count1.68 (1.14–2.47)0.0081.63 (1.08–2.46)0.019
NL Ratio2.68 (1.68–4.26)<0.0012.52 (1.55–4.09)<0.001
ML Ratio2.32 (1.59–3.39)<0.0012.30 (1.54–3.45)<0.001
CI—confidence interval; OR—odds Ratio; aOR—adjusted odds ratio; * Multivariate logistic regression models study the association of biomarker with treatment outcomes (unfavorable), and are adjusted for age in years, gender, body mass index, diabetes status, smoking status, alcohol status and smear grading. Bold numbers mean statistically significant values.
Table 3. Relationship of hematological parameter with chest X-ray score in cases.
Chest X-Ray Scorep-ValueR ValueCorrelation
HEMOGLOBIN (g/dl)0.654−0.083Very Weak
HEMATOCRIT (%)0.741−0.073Very Weak
PLATELETS (µL)0.0640.259Weak
RBC0.239−0.103Weak
WBC Absolute Count0.29−0.151Weak
NEUTROPHIL Absolute Count0.616−0.01Very Weak
LYMPHOCYTE Absolute Count0.285−0.091Weak
MONOCYTES Absolute Count0.039 *−0.269Weak
NL Ratio0.3360.089Very Weak
ML Ratio0.0610.2Weak
p-value—* <0.05.
Table 4. Relationship of hematological parameter with chest X-ray score in cases and cured controls.
Chest X-Ray Scorep-ValueR ValueCorrelation
HEMOGLOBIN (g/dl)0.144−0.09Very Weak
HEMATOCRIT (%)0.088−0.101Very Weak
PLATELETS (µL)0.0670.146Very Weak
RBC0.058−0.106Very Weak
WBC Absolute Count0.4210.074Very Weak
NEUTROPHIL Absolute Count0.0720.123Very Weak
LYMPHOCYTE Absolute Count0.389−0.104Very Weak
MONOCYTES Absolute Count 0.9780.045Very Weak
NL Ratio0.0550.183Very Weak
ML Ratio0.002 **0.236 Weak
p-value—** <0.001.
Disclaimer/Publisher’s Note: The statements, opinions and data contained in all publications are solely those of the individual author(s) and contributor(s) and not of MDPI and/or the editor(s). MDPI and/or the editor(s) disclaim responsibility for any injury to people or property resulting from any ideas, methods, instructions or products referred to in the content.

