Article

Individual Epitope-Specific CD8+ T Cell Immune Responses Are Shaped Differently during Chronic Viral Infection

1
Department of Gastroenterology, Hepatology and Endocrinology, Hannover Medical School, 30625 Hannover, Germany
2
Twincore Centre for Experimental and Clinical Infection Medicine, 30625 Hannover, Germany
3
Center for Nuclear Receptors and Cell Signaling, Department of Biology and Biochemistry, University of Houston, Houston, TX 77204, USA
4
Institute of Systems Immunology, University Medical Center Eppendorf, 20251 Hamburg, Germany
5
Institute of Immunology, Hannover Medical School, 30625 Hannover, Germany
6
German Centre for Infection Research (DZIF), 30625 Hannover, Germany
7
Centre for Individualised Infection Medicine (CIIM), c/o CRC Hannover, 30625 Hannover, Germany
*
Author to whom correspondence should be addressed.
Pathogens 2023, 12(5), 716; https://doi.org/10.3390/pathogens12050716
Submission received: 28 April 2023 / Revised: 10 May 2023 / Accepted: 11 May 2023 / Published: 14 May 2023
(This article belongs to the Special Issue Animal Models for Human Viruses)

Abstract

:
A hallmark in chronic viral infections are exhausted antigen-specific CD8+ T cell responses and the inability of the immune system to eliminate the virus. Currently, there is limited information on the variability of epitope-specific T cell exhaustion within one immune response and the relevance to the T cell receptor (TCR) repertoire. The aim of this study was a comprehensive analysis and comparison of three lymphocytic choriomeningitis virus (LCMV) epitope-specific CD8+ T cell responses (NP396, GP33 and NP205) in a chronic setting with immune intervention, e.g., immune checkpoint inhibitor (ICI) therapy, in regard to the TCR repertoire. These responses, though measured within the same mice, were individual and independent from each other. The massively exhausted NP396-specific CD8+ T cells revealed a significantly reduced TCR repertoire diversity, whereas less-exhausted GP33-specific CD8+ T cell responses were rather unaffected by chronicity in regard to their TCR repertoire diversity. NP205-specific CD8+ T cell responses showed a very special TCR repertoire with a prominent public motif of TCR clonotypes that was present in all NP205-specific responses, which separated this from NP396- and GP33-specific responses. Additionally, we showed that TCR repertoire shifts induced by ICI therapy are heterogeneous on the epitope level, by revealing profound effects in NP396-, less severe and opposed effects in NP205-, and minor effects in GP33-specific responses. Overall, our data revealed individual epitope-specific responses within one viral response that are differently affected by exhaustion and ICI therapy. These individual shapings of epitope-specific T cell responses and their TCR repertoires in an LCMV mouse model indicates important implications for focusing on epitope-specific responses in future evaluations for therapeutic approaches, e.g., for chronic hepatitis virus infections in humans.

1. Introduction

Chronic viral infections such as hepatitis B virus (HBV), hepatitis C virus (HCV) or human immunodeficiency virus (HIV) are a global health problem with high morbidity and mortality [1]. CD8+ T cells are one of the most important determinants for infection progression and can range from highly effective to transient and non-functional. A main reason for the latter is that in chronic viral infection, virus-specific T cell responses are exhausted [2,3], which is associated with suppressive signaling pathways in CD8+ T cells, so-called checkpoint pathways [4,5,6].
While the exhaustion of a T cell response was long seen as a linear process that is highly dependent on viral load and time [7,8,9,10], focused research has revealed more diverse effects, such as epitope-specific differences within a single immune response [11,12]. The great advantage of animal models such as the lymphocytic choriomeningitis virus (LCMV) mouse model is the analysis of different parameters under standardized circumstances, which has revealed that the epitope-specific immune responses can be seen as individually distinct parts of the overall “immune response” [12]. During the acute phase, some epitopes induce strong immune responses from the host, while others are less immunogenic. This has been shown in mice [12] and humans [13]. Additionally, some knowledge has been gained about the phenotypical composition and functionality of T cell responses, also in chronic viral infections [14,15,16]. These have shown the massive variance that can occur within one immune response, originating from the different individual epitope-specific responses.
In recent years, markers were defined to characterize different T cell phenotypes in chronic viral infections (e.g., stem-cell-like, terminally exhausted T cells) [15,17,18,19,20]. In this regard, it became clear that some of these T cell phenotypes are potentially restorable and therefore drug targets [21,22]. These drugs, called immune checkpoint inhibitors, block suppressive checkpoint pathways. Predominantly, the blockage of the PD-1/PD-L1 and CTLA-4 pathways received much attention for being able to restore CD8+ T cell responses from sensitive T cell phenotypes [13,23,24,25].
Although immune checkpoint inhibitor (ICI) therapy (e.g., αPD-L1 or αCTLA-4 therapy) is already clinically used in cancer treatment [26], the long-term impact of this therapy on the T cell response is only marginally understood.
While the phenotype of T cells, which are sensitive for restoration, has been intensively investigated [21,22,27,28,29,30], the T cell receptor (TCR) repertoire and the effects of ICI therapy have hardly been studied [31]. The TCR is an essential feature of each CD8+ T cell and controls the predominant activation of these cells (TCR-dependent activation) by binding to a specific, presented epitope [32]. These TCR–peptide–MHC interactions are crucial for the development of the antigen-specific T cell [33], determining its phenotype [34,35,36], the strength of its proliferation [37] and its functionality [38], which, in turn, influence the outcome of the infection [39]. Current data on epitope-specific TCR responses are sparse and mainly based on single-epitope-specific TCR experiments, such as the transgenic P14 T cells responsive to GP33 [40]. Additionally, the comparison of different organs or the phenotypical subgroup analysis of certain responses has been conducted [41].
Usually, many TCRs bind to a given presented epitope (respective T cells are called “precursor cells” for this epitope) [42], building the responsive epitope-specific TCR repertoire. The diversity of a TCR repertoire in response to a virus has been proven critical for viral persistence or control [43,44,45]. We have recently shown in a chronic LCMV mouse model that exhaustion-dependent loss of the NP396-specific CD8+ T cell response is accompanied by a significant reduction in the CD8+ T cell clonotype number and diversity index [46]. Only a part of those exhausted T cells seemed sensitive to αPD-L1-treatment-dependent restoration and induced a significant skewing towards oligoclonality with the appearance of dominant, hyperexpanded (more than 25% of relative abundance) NP396-specific clonotypes in ICI-treated mice [46]. In our current work, we focused on the response against the three LCMV epitopes, NP396, GP33 and NP205 [42], and performed a direct comparison within single mice, which, to our knowledge, has not been studied previously [47]. Thereby, we took advantage of the LCMV model, which enables us to analyze epitope-specific immune responses under acute-resolving (LCMV Armstrong, LCMVarm, further termed “immune”) as well as chronic (LCMV Armstrong clone 13, LCMVcl13, further termed “chronic”) conditions [48,49].
Considering that NP396-, GP33- and NP205-specific T cell responses show different phenotypes during chronic infection [12], we asked whether this also results in differentially affected TCR repertoires compared with LCMV-immune mice and how these epitope-specific repertoires are modulated by ICI therapy.

2. Materials and Methods

2.1. Ethics Statement

For all animal experiments, the highest possible ethical standards were ensured, and all efforts were made to reduce the suffering of mice. All mouse experiments were performed in accordance with the guidelines of the Medical School Hannover (MHH), Germany, the national animal protection law and the animal experiment regulations. The study was approved by the State of Lower Saxony (LAVES—Niedersächsisches Landesamt für Verbraucherschutz und Lebensmittel-sicherheit—project number 33.12–42502-04-16/2127).

2.2. Mice and Treatment

Male C57BL/6 mice, 6 to 8 weeks old, were bred and kept under pathogen-free conditions, with a 12/12 h day/night cycle, in the general animal facility of MHH. Mice were infected with 5 × 104 PFU LCMV Armstrong, and were considered immune 4 weeks post infection or were infected intravenously with 2 × 106 PFU of LCMVcl13 to generate chronically LCMV-infected mice. In contrast to some published studies, we did not use a deep-exhaustion LCMV mouse model, in which CD4+ T cells are depleted prior to LCMVcl13 infection, which results in a deeper and more stable, but also in a more non-physiological, chronic LCMV infection [12,29,48]. Checkpoint inhibitor treatment using αPD-L1 started at day 23 post LCMVcl13 infection. Mice were treated five times (every third day) intraperitoneally with 200 μg of αPD-L1 (10F.9G2 [BioXcell and Biolegend]), while as control, chronic LCMVcl13-infected mice were treated with phosphate-buffered saline. On day 36 post infection, mice were sacrificed and immune responses and viral titer were analyzed. NP396 data, related to dextramer staining, IFN-γ- and TNF-α-response and TCR sequencing, was in part (~40%) published already in Klein et al. (2020) [46], but was extended (more than doubled) and reanalyzed for this comparative study.

2.3. Synthetic Peptides and Dextramers

Synthetic peptides NP396-404 (FQPQNGQFI), GP33-41 (KAVYNFATC) and NP205-212 (YTVKYPNL) were purchased from ProImmune (Oxford, UK). The dextramers H-2Db/FQPQNGQFI (NP396), H-2Db/KAVYNFATC (GP33) and H-2Kb/YTVKYPNL (NP205) were purchased from Immudex (Koppenhagen, Denmark).

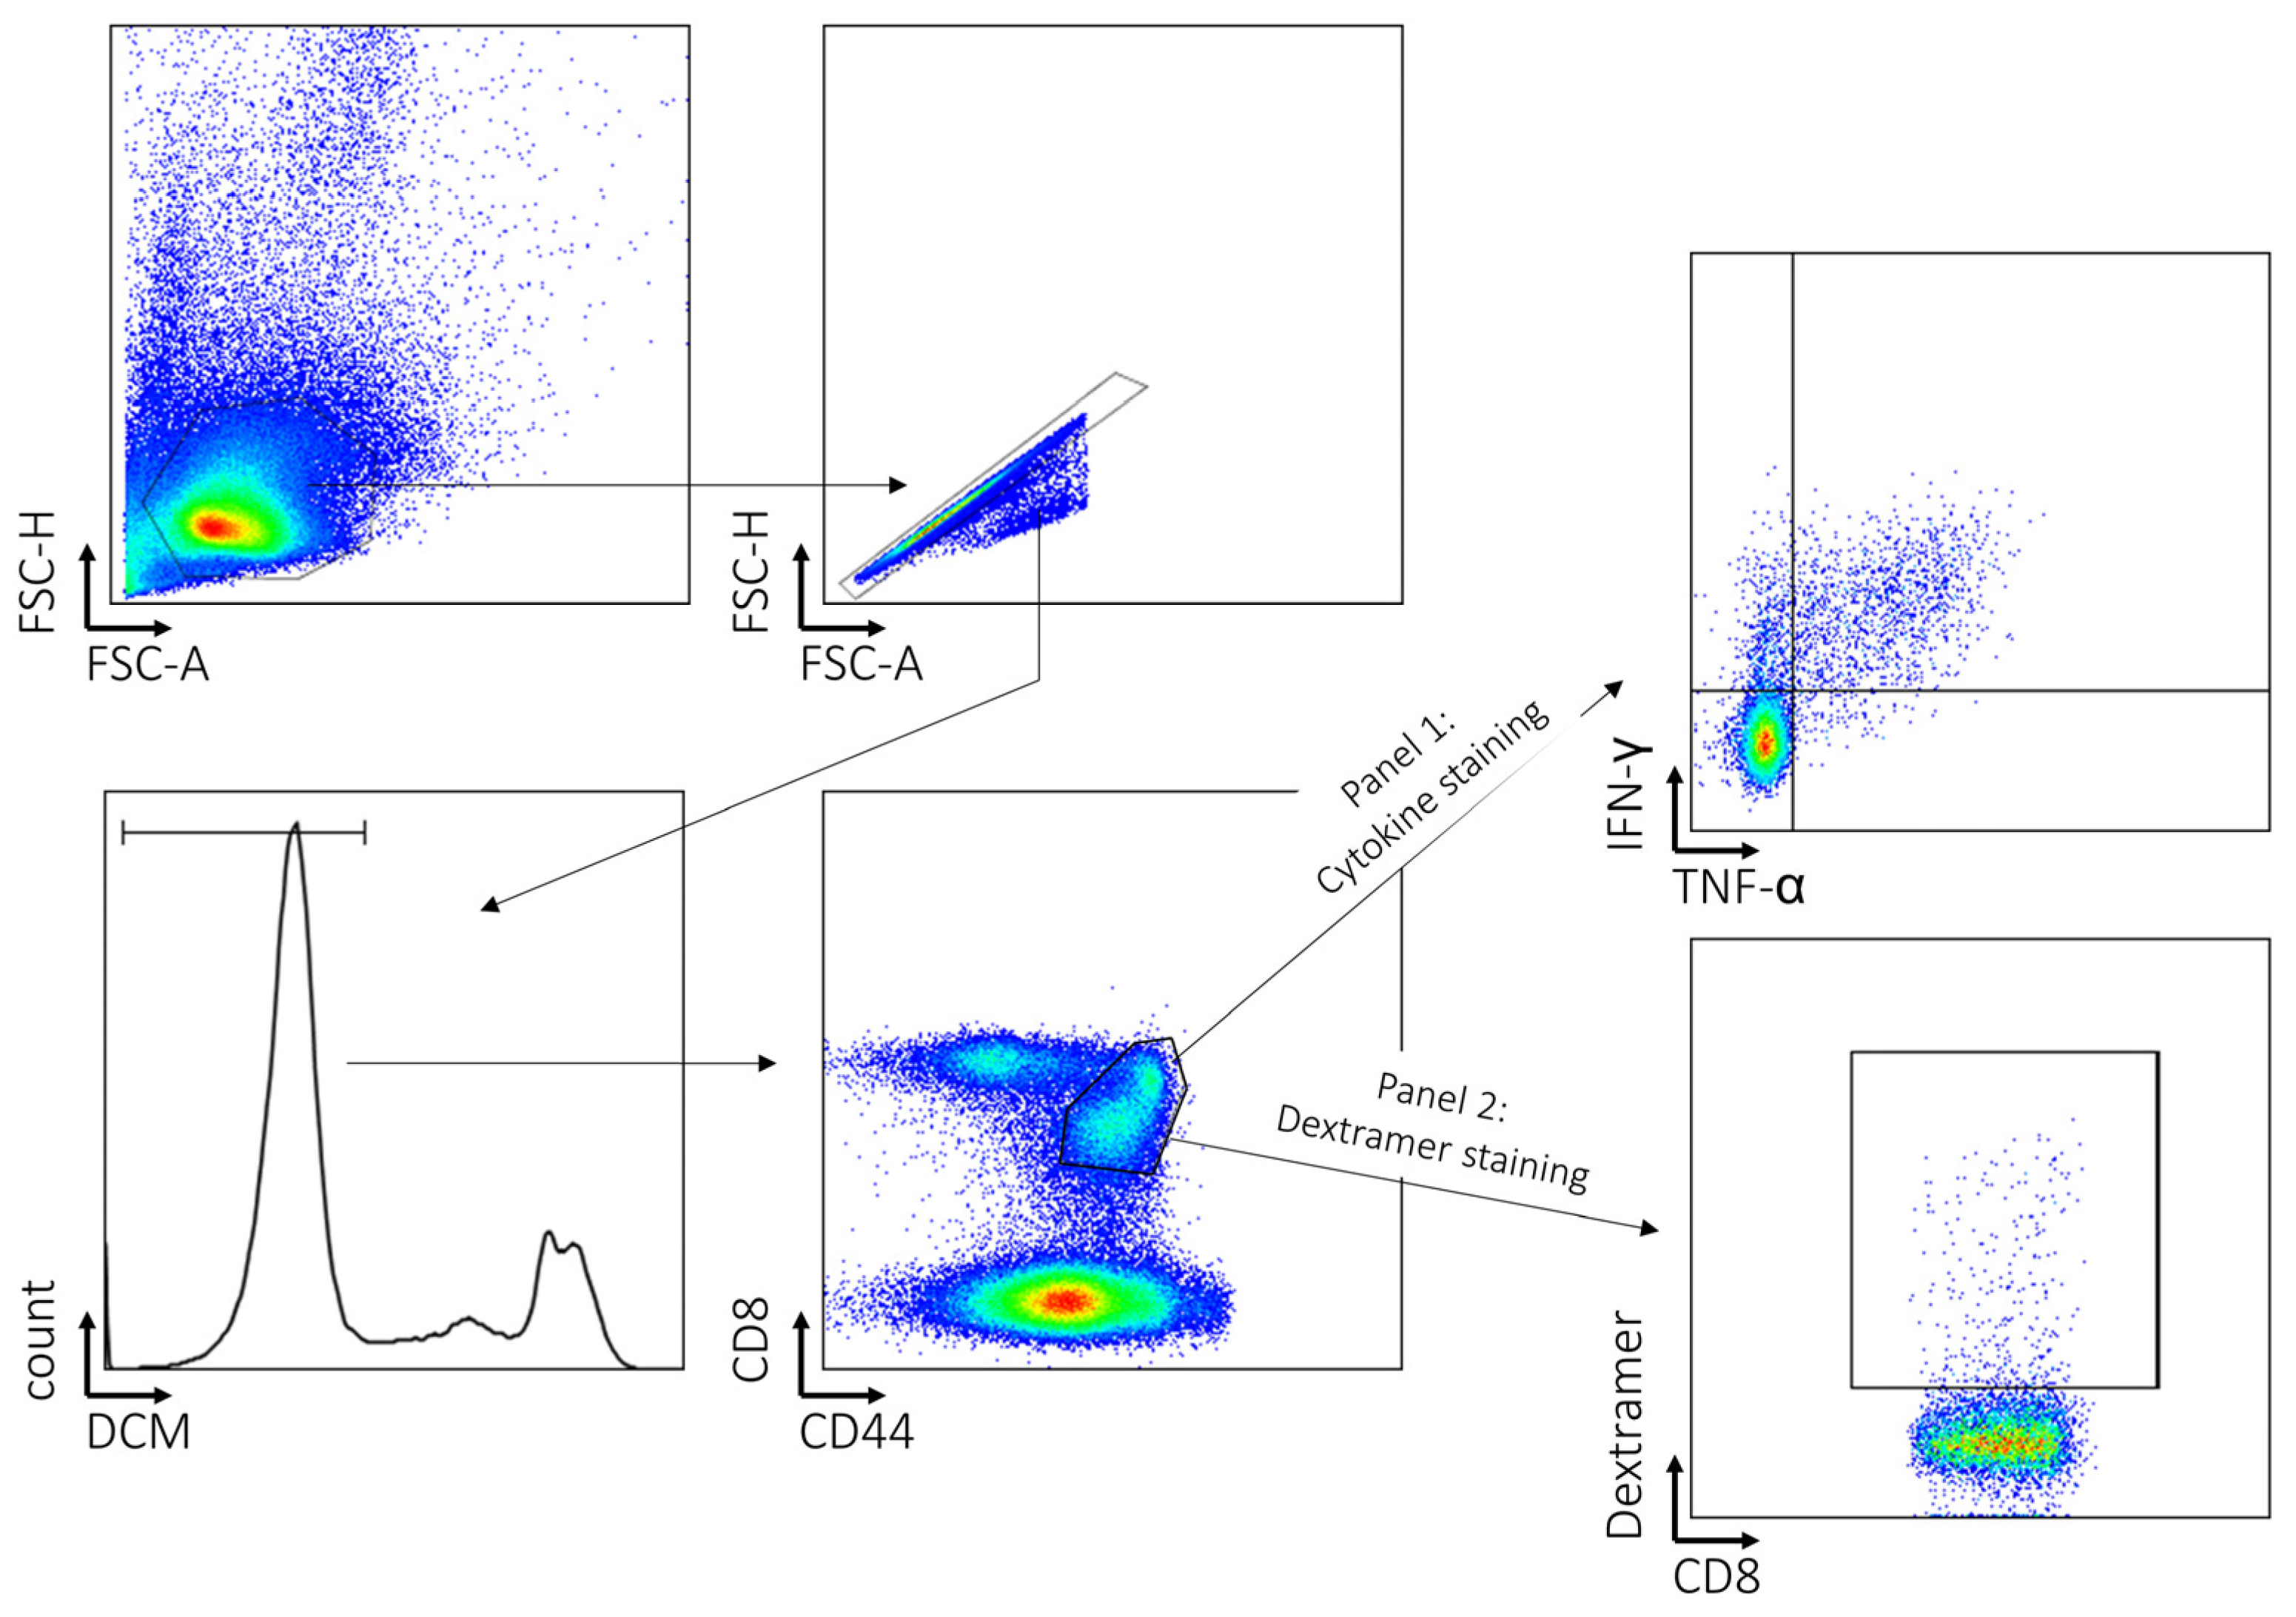
2.4. Cell Surface and Dextramer Staining for Flow Cytometry and Intracellular Cytokine Measurements

All methods were described previously [46,50]. Briefly, red blood cells were removed from single-cell spleenocyte suspensions. Afterwards, ≥1 × 10⁶ cells were either directly stained or stimulated with one of the three peptides within RPMI medium (Gibco) for 4.5  h at 37 °C and 5% CO2. After incubation, surface and intracellular stainings were performed (as described previously [46] with GolgiPlug (BD)). Flow cytometry was performed with a BD LSRFortessa flow cytometer (BD; 3 lasers and 14 colors) and data were analyzed with software FlowJo 9 and 10 (BD). Experimental gating strategy is shown in Figure A1.

2.5. Next-Generation Sequencing of the Epitope-Specific T Cell Receptor Repertoire

TCR repertoire analyses were performed on epitope-specific CD8+ T cells, which were defined by fluorescence-activated cell sorting (FACS), using the CD4 CD8α+ CD44+ dextramer-binding (Dextramer+) populations (dextramers for NP396, GP33 or NP205). Additionally, the “overall” Vβ/Jβ usage was analyzed by sequencing the dextramer-negative, CD8+ T cell population. A detailed description of the procedure was published previously [46,50]. Brief description of the workflow: RNA was extracted using the RNeasy plus microRNA extraction kit (Qiagen). The cDNA synthesis and amplification PCR were performed using the SMARTer RACE cDNA amplification kit (Clontech) and the Advantage 2PCR kit (Clontech). Amplicon size was determined by running an agarose gel and the respective products were indexed with another PCR (Advantage 2PCR kit (Clontech)) and Nextera primer combinations (Illumina). Finally, all sample concentrations were determined and sequencing was performed with a Miseq (Illumina) using V2 chemistry and 150 bp paired-end sequencing.

2.6. Sequencing Analysis

Quality control of forward and reverse reads for each individual sample was performed using fastp [51]. Assembling and alignment of reads to TCRβ clonotypes were performed using MiXCR [52] with an “ETE” and otherwise default settings. In order to avoid artificial diversity increases by erroneous sequences, the number of clonotypes was trimmed down by using a 96% cutoff, as described before by others [53]. For this, we sorted the clonotypes in regard to the abundance and cut of T cell receptor clonotypes that appear after 96% of the overall read frequency was reached. This led to the deletion of minor “clonotypes”, detected predominantly with only one or two reads. Warren et al. [53] suggests that the 4% of the repertoire with the lowest abundant clonotypes inflates the diversity due to mostly erroneous sequences from PCR and sequencing. The calculation of the Shannon–Wiener Index was performed with VDJ-tools [54], which normalizes the sequencing reads to the level of the highest sequencing depth (sample with the most reads, extrapolation). Graphical depiction was conducted using R and Prism 7.03 software (GraphPad Software).

2.7. Hydrogen Bond Calculations

Peptide MHC crystal structures 1fg2 (GP33/H-2Db), 3p4m (NP205/H-2Kb) and 1jpg (NP396/H-2Db) were acquired from the Protein Databank (PDB). PDB crystal structures were processed and visualized using ChimeraX. Briefly, individual peptide–MHC complexes were isolated and trimmed of their β-2 microglobulin and α3 domain. Hydrogen bonds were also calculated with ChimeraX using relaxation constraints of 0.4 angstrom distance and 20-degree angle tolerance. For salt bridges, these constraints were relaxed to 1 angstrom and 20 degrees.

2.8. Virus Titer Determination

LCMV titers were determined by plaque assay as performed [46] and described previously [55]. In summary, serial log10 dilutions of kidney tissue homogenate were incubated on Vero cells with ∼70% confluence in a 6-well plate. Staining was performed 4 days post infection with neutral red (Sigma-Aldrich, Taufkirchen, Germany); 2 days later, plaques were counted and PFUs per organ were calculated.

2.9. Statistics

Descriptive statistics are expressed as means ± standard error of the mean. Depending on the standard deviation, Student’s t tests, Mann–Whitney U tests, analysis of variance (ANOVA), or Kruskal–Wallis tests were performed, using Prism 9.04 software (GraphPad Software).

3. Results

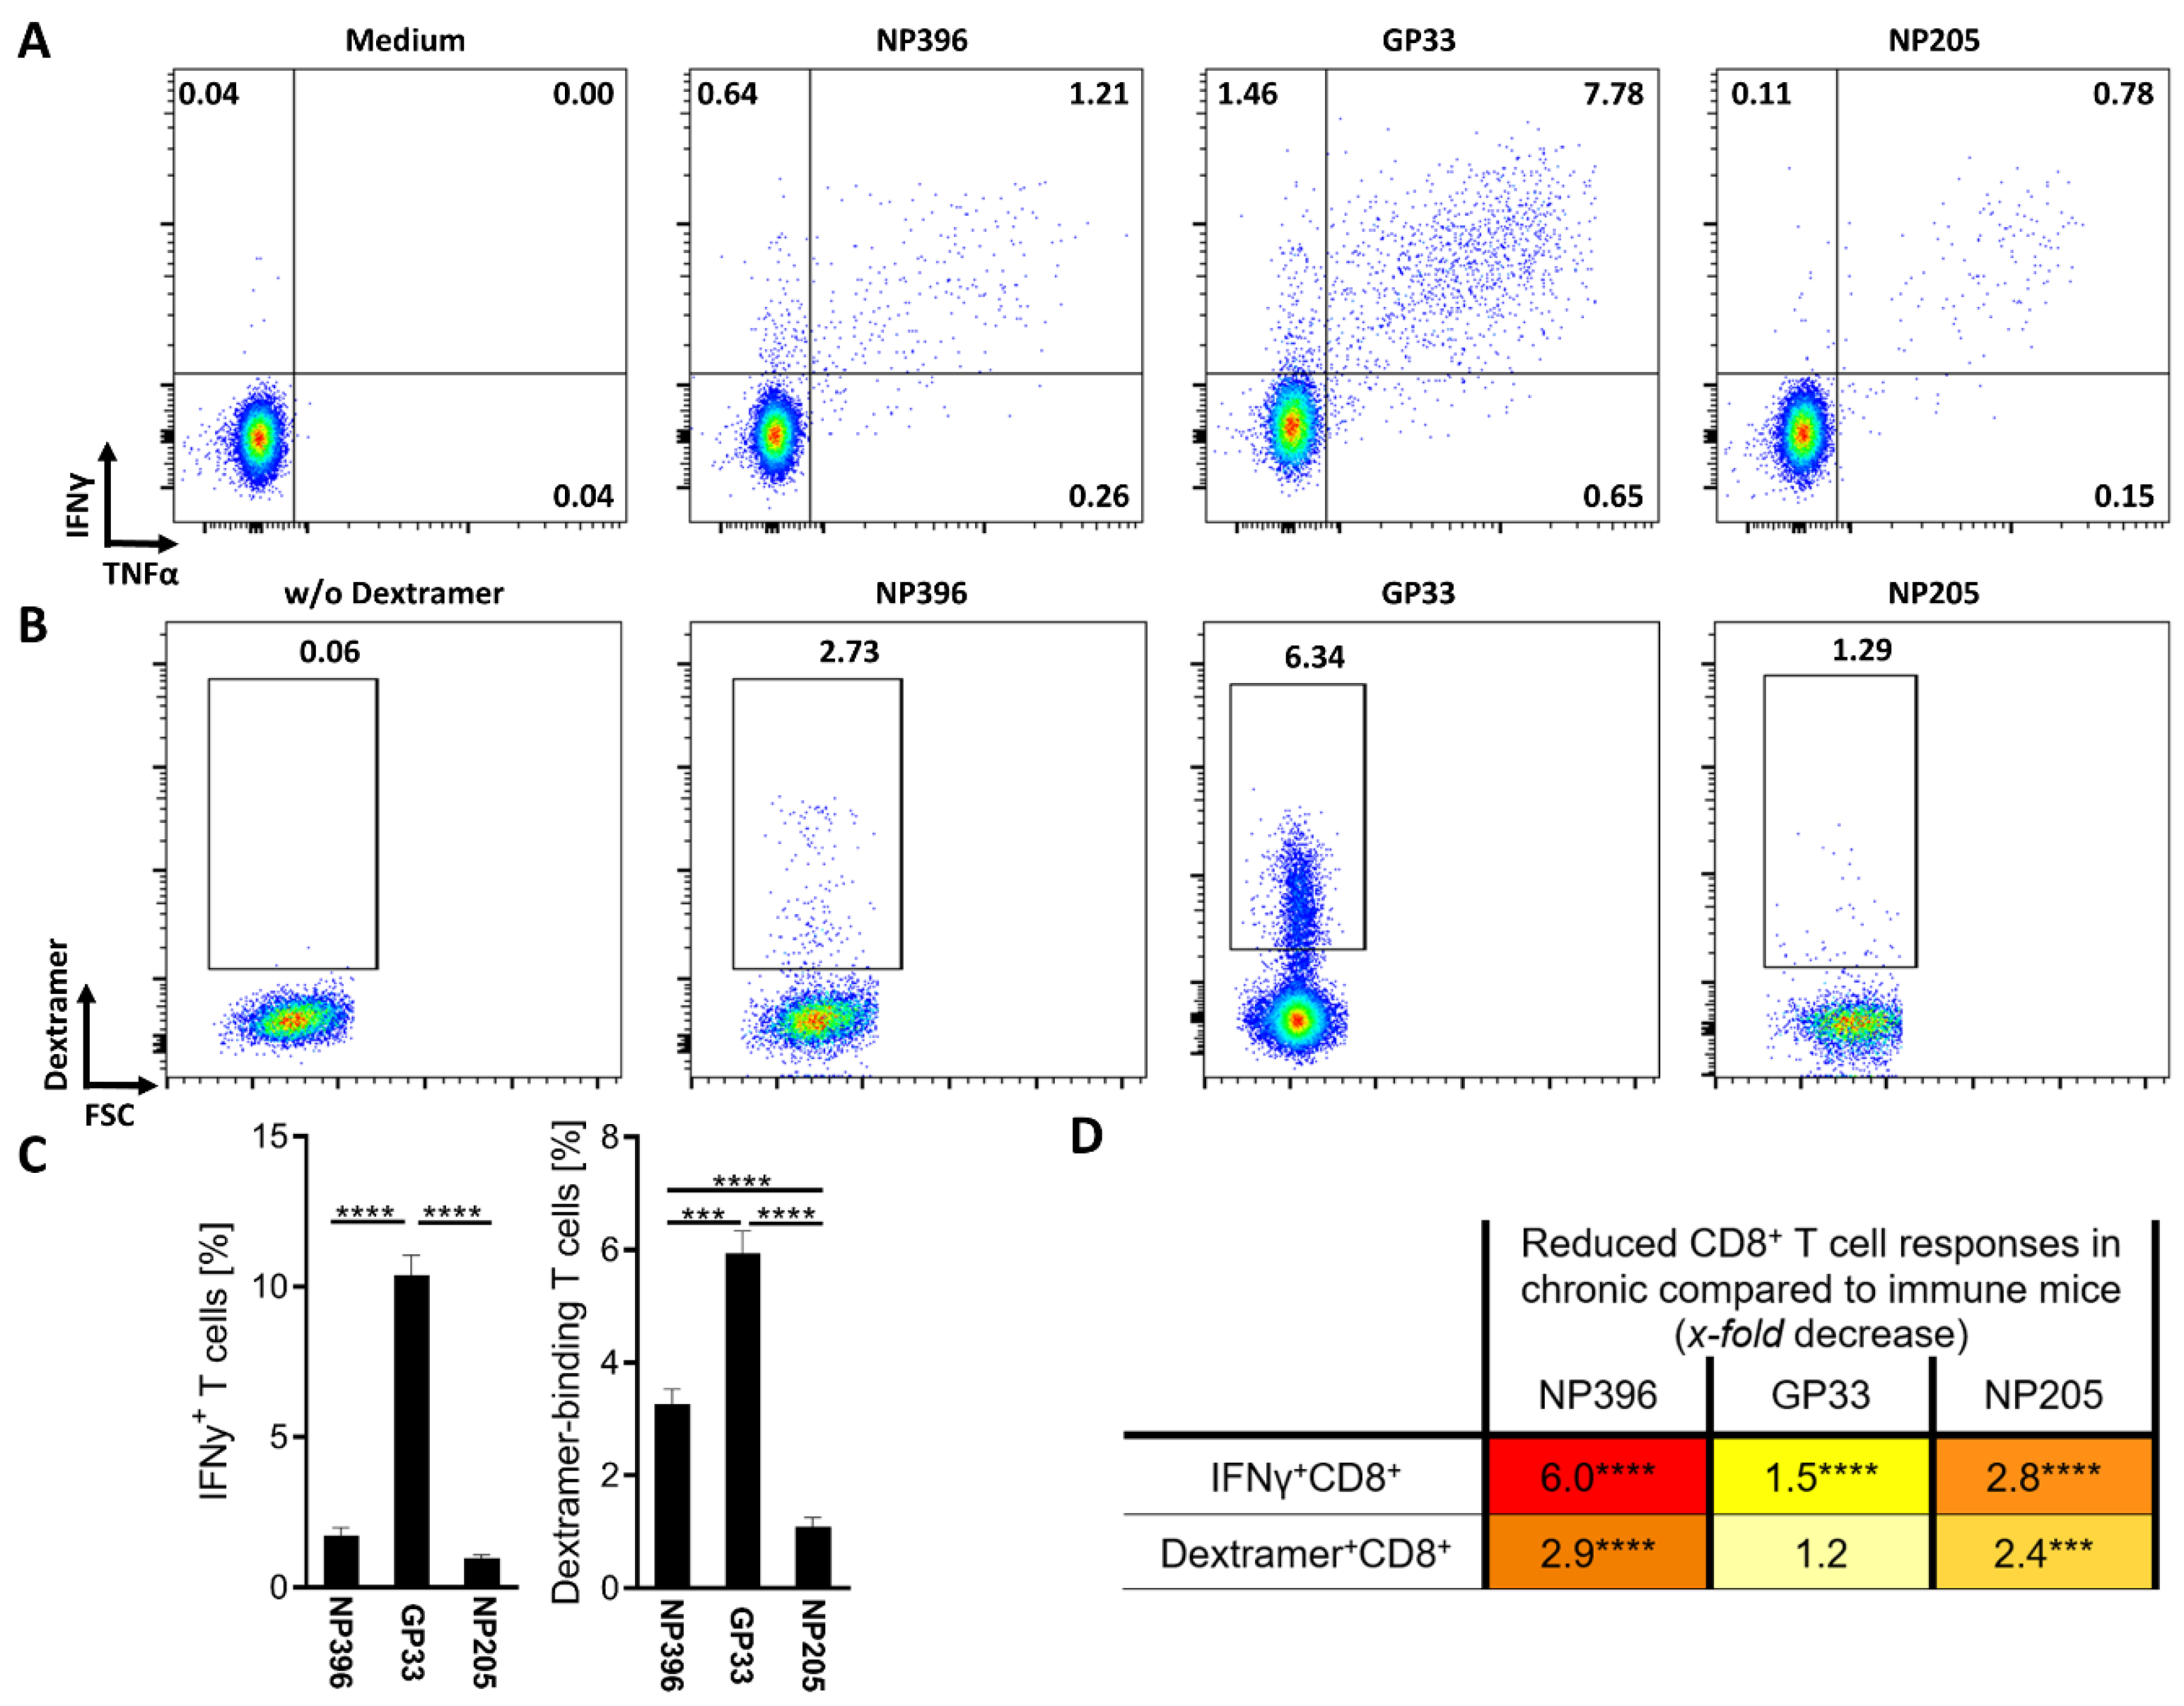
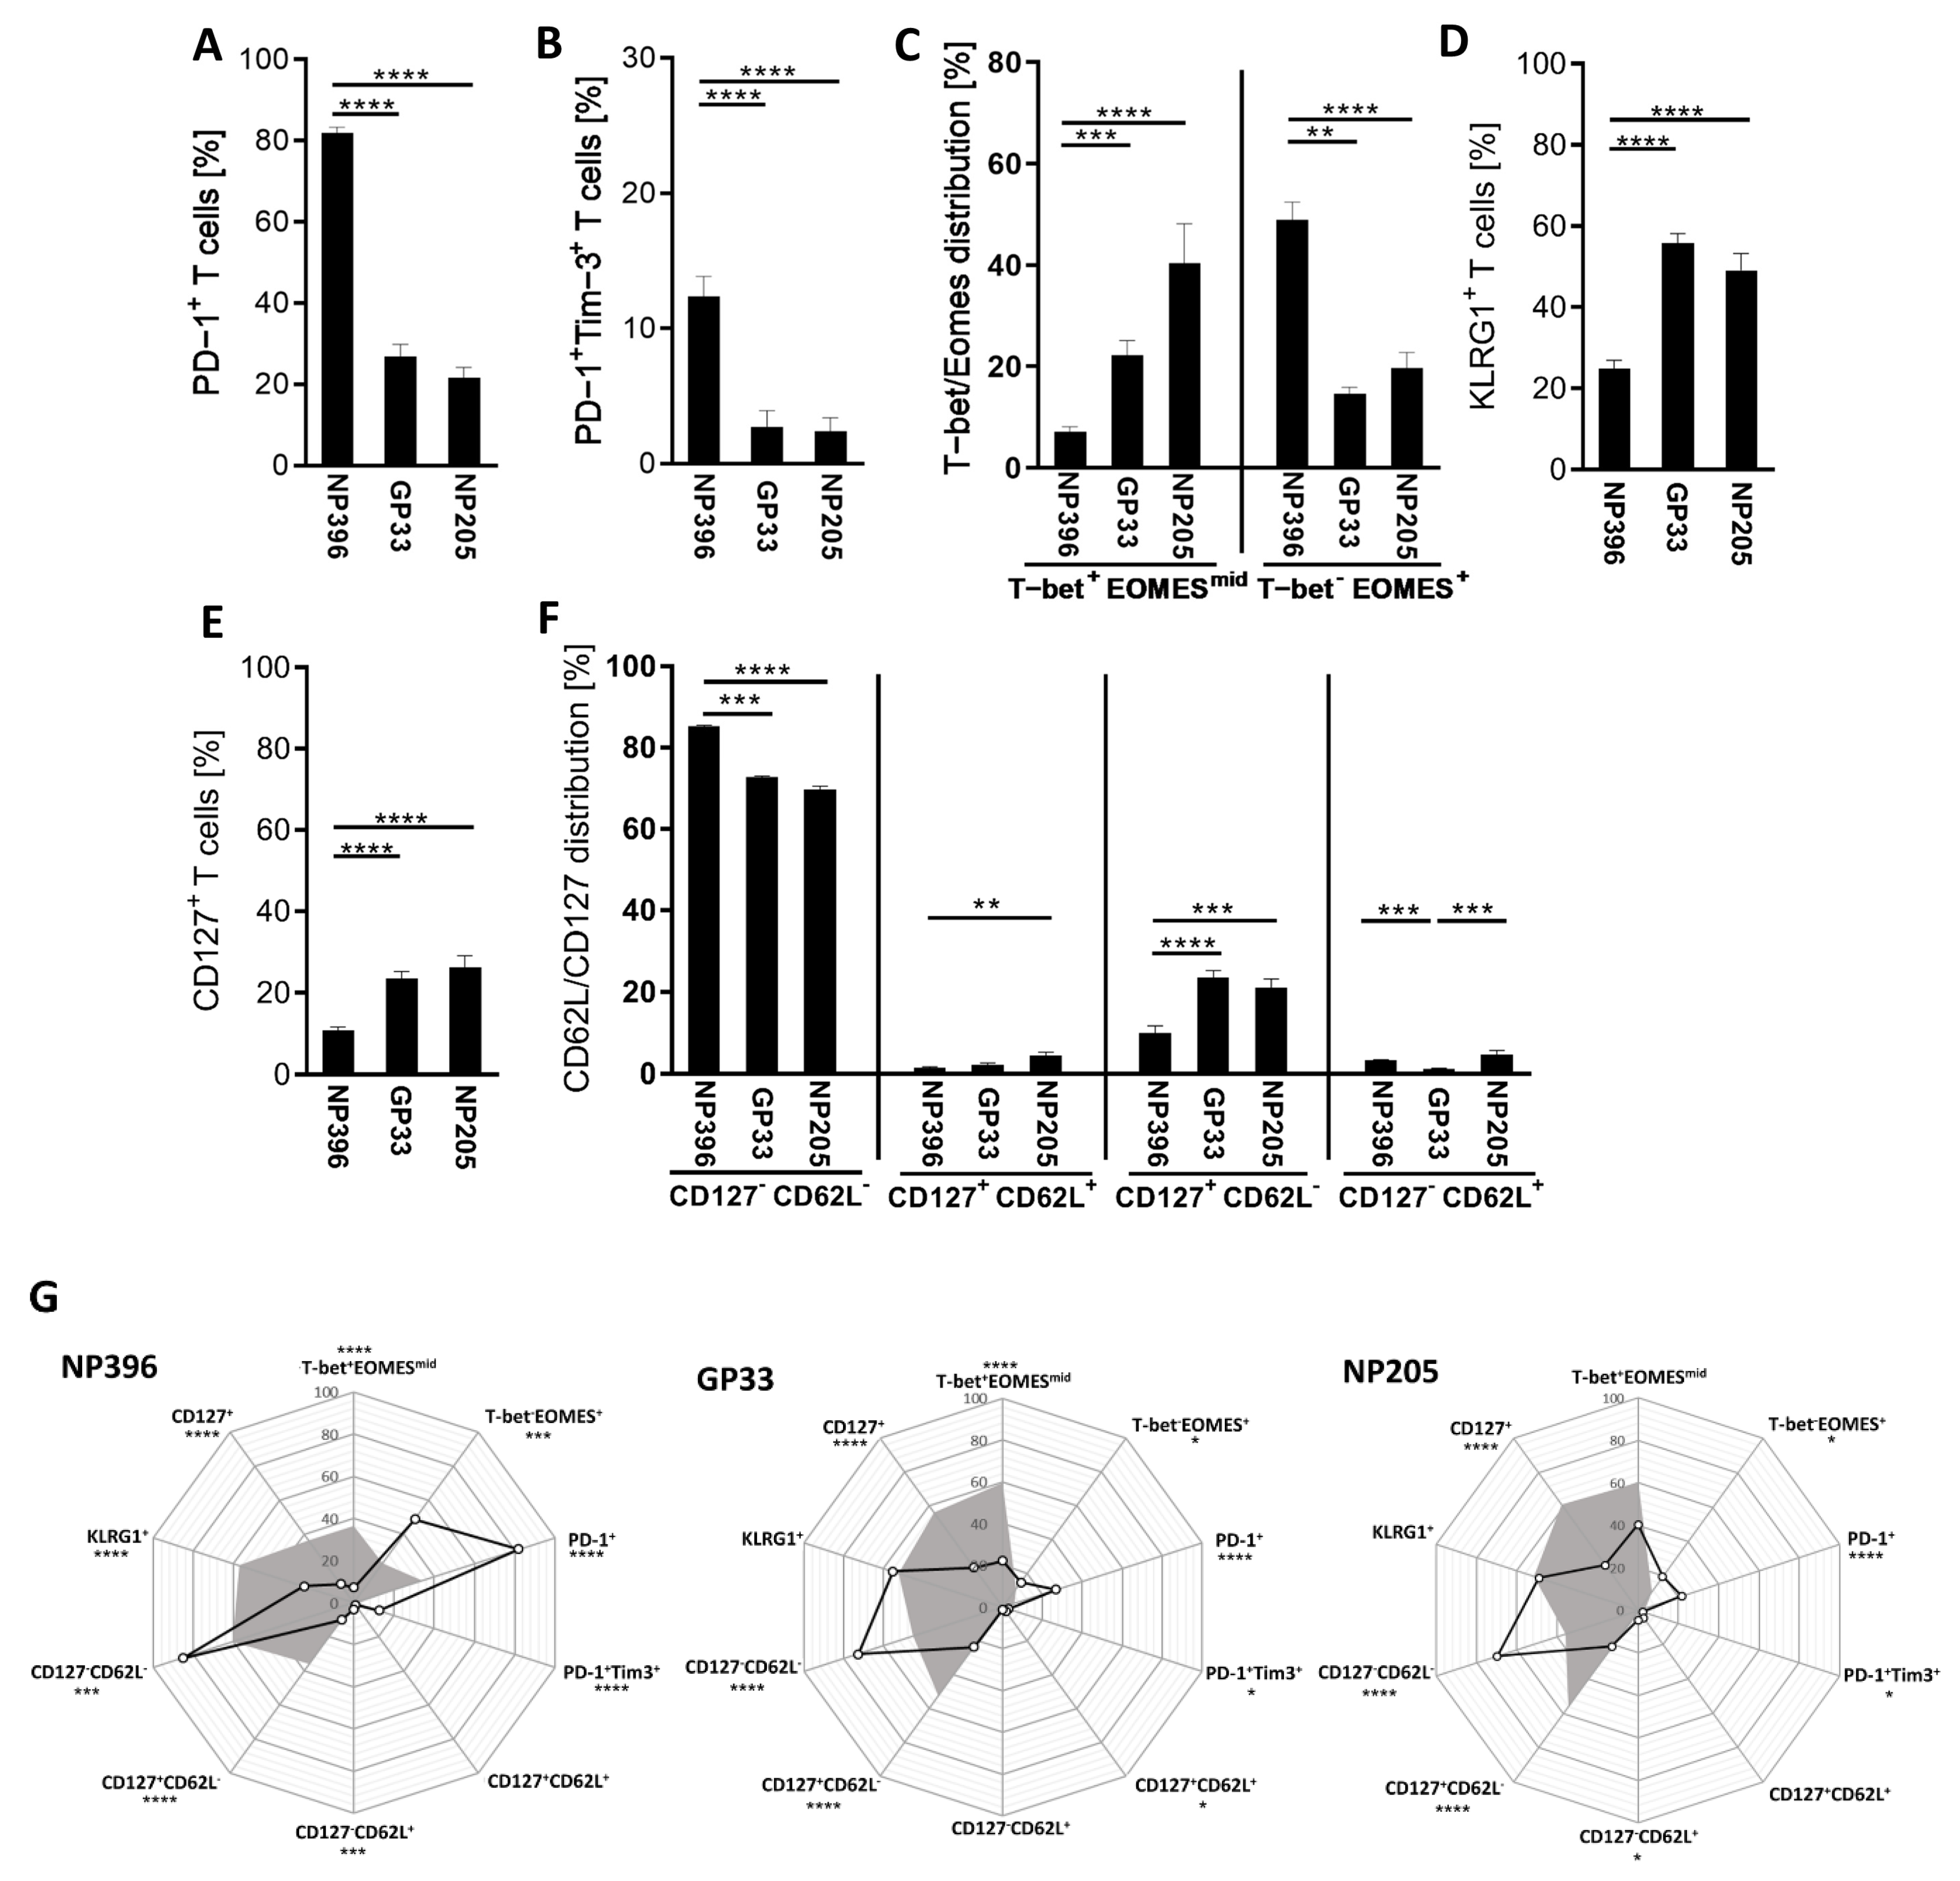
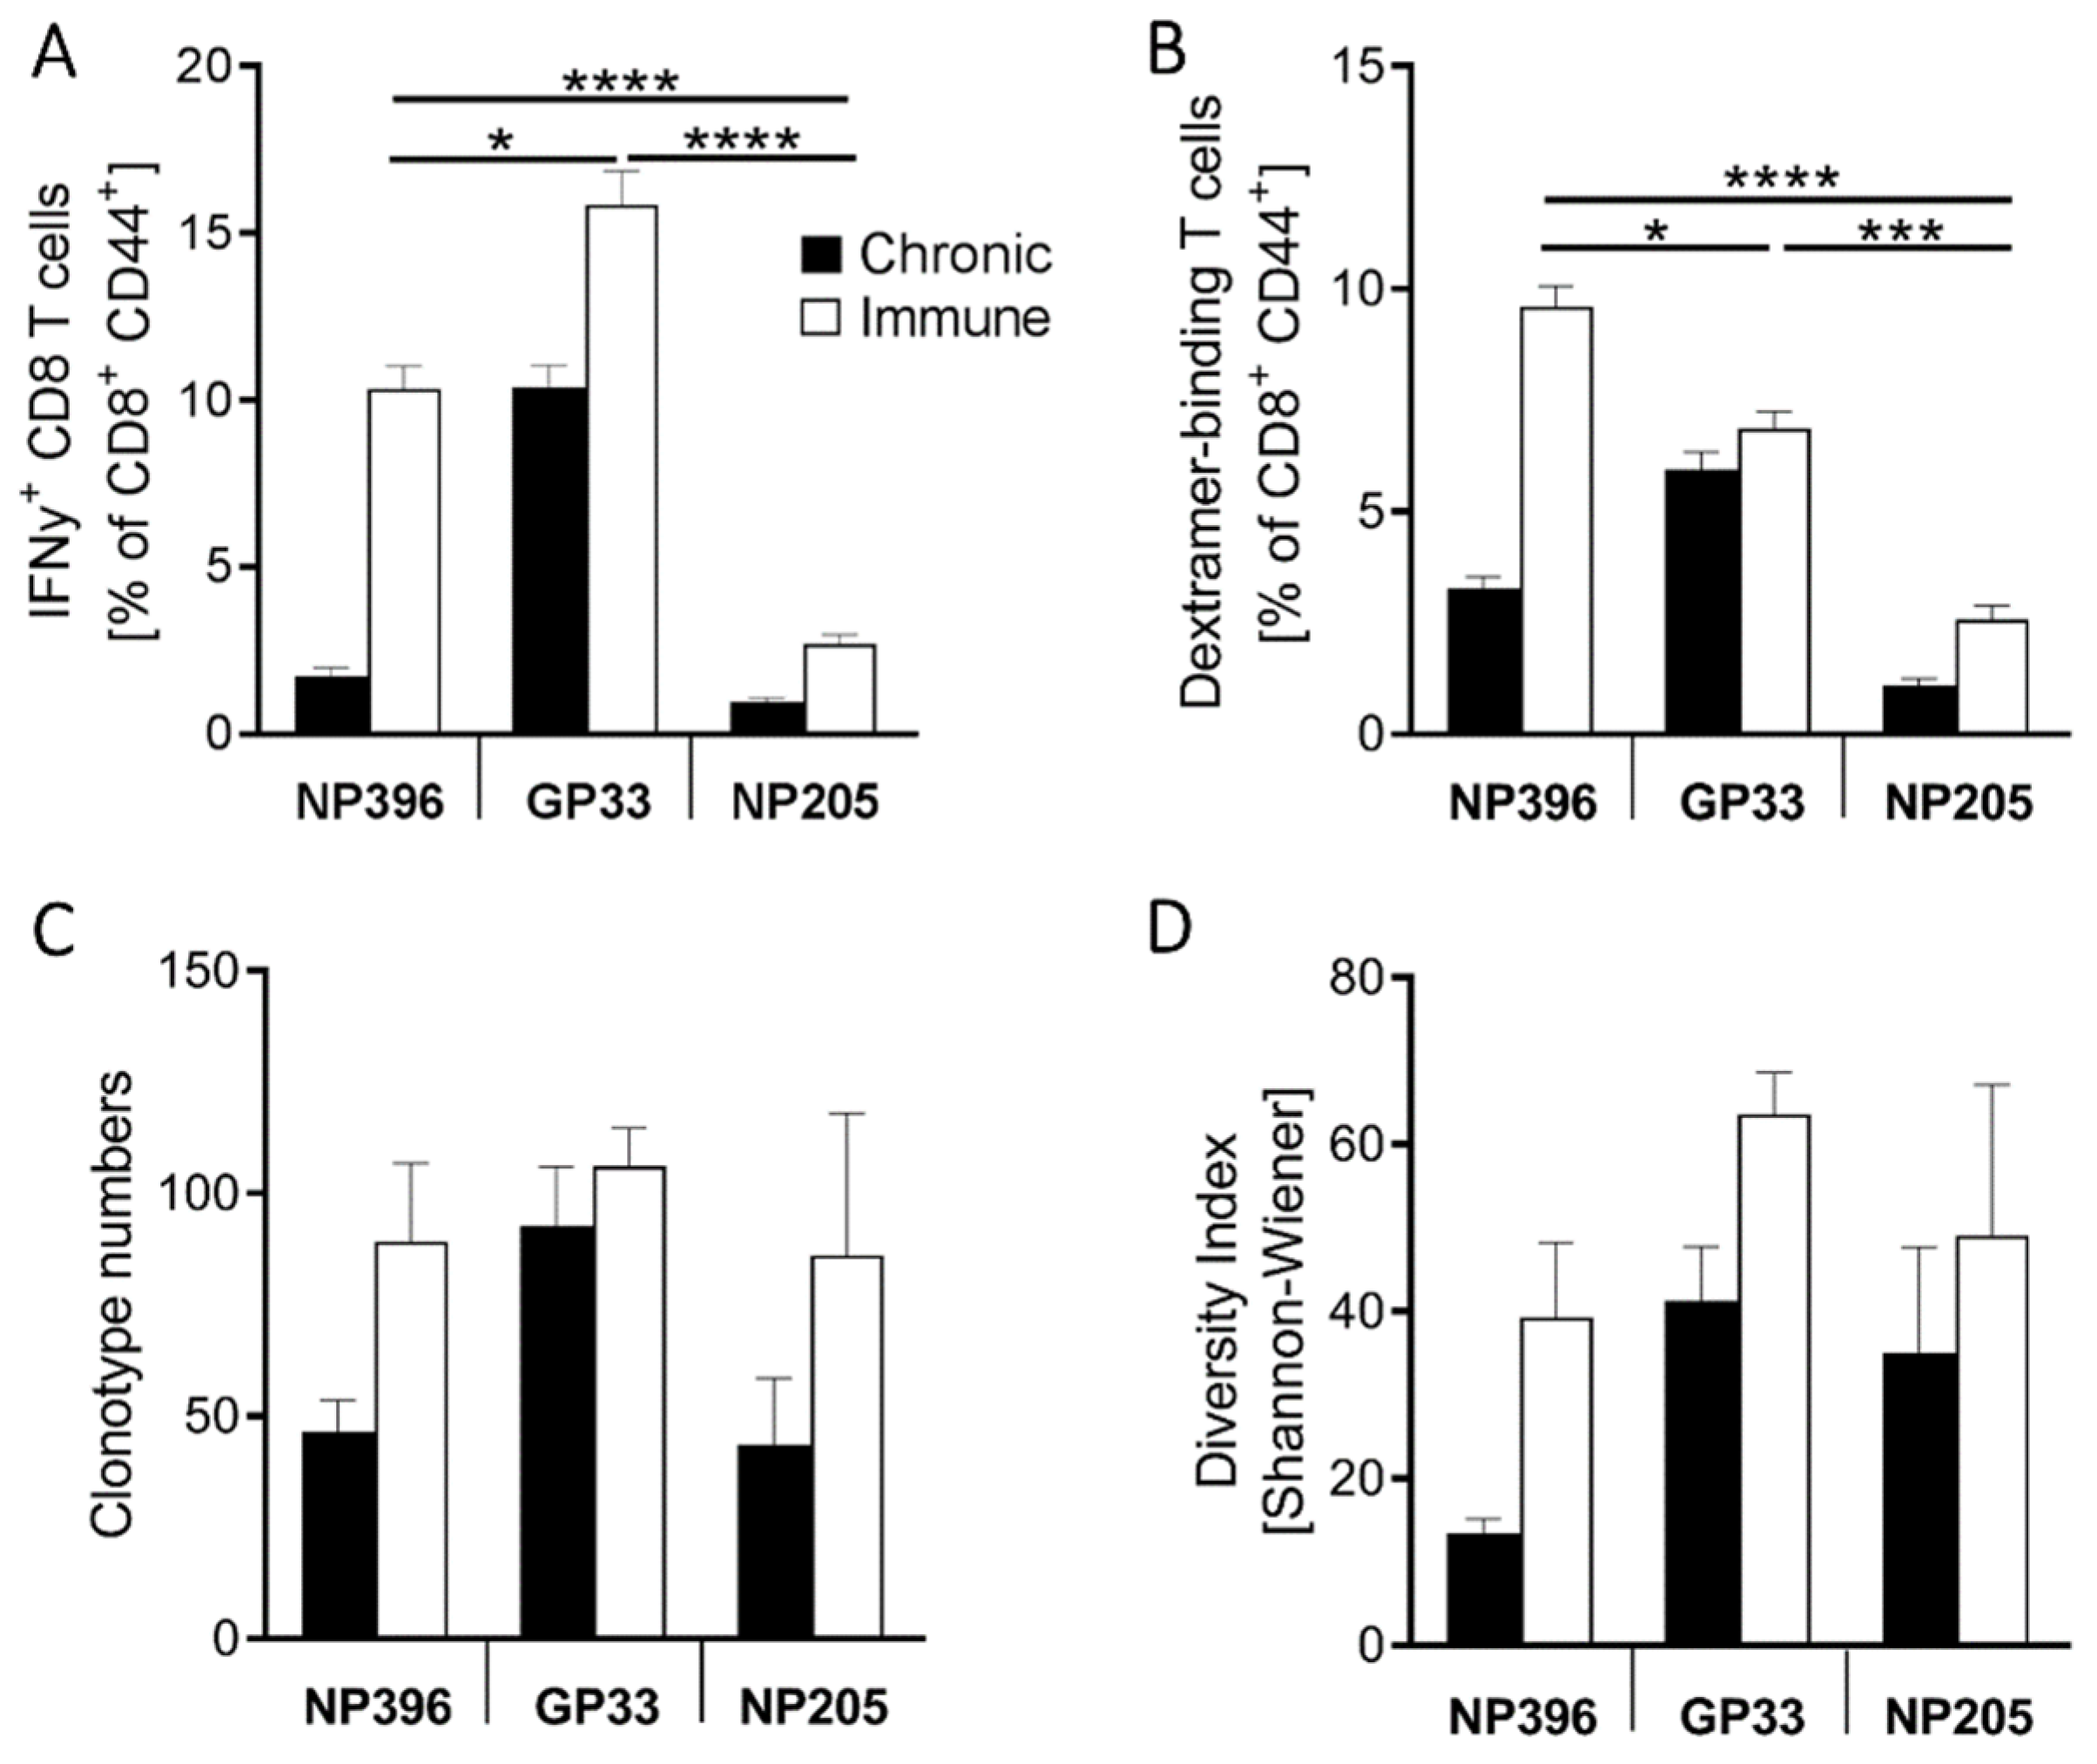
3.1. NP396-, GP33- and NP205-Specific T Cell Responses Can Be Used to Analyze TCR Repertoires of Differentially Exhausted Epitope-Specific Responses in Chronic LCMV Infection

The three LCMV-specific T cell responses, NP396, GP33 and NP205, are known to be differentially exhausted in chronically LCMVcl13-infected mice [12]. We could confirm highly significant differences between these three epitope-specific T cell responses, concerning IFNγ+ CD8+ T cells, dextramer-binding (Dextramer+) CD8+ T cells and phenotyping of the Dextramer+ CD8+ T cells (Figure 1A–C and Figure A2).
The highest frequency of IFNγ+ and Dextramer+ CD8+ T cells was detectable in GP33-specific T cells (Figure 1C), while NP396- and NP205-specific responses showed significantly lower frequencies. Comparing NP396- and NP205-specific T cells, NP396-specific T cells showed a significantly higher frequency of Dextramer+ CD8+ T cells, but similar frequencies of IFNγ+ CD8+ T cells. In addition to these differences, different phenotypes were detectable in regard to these epitope-specific responses (Figure A2). We could confirm a more exhausted phenotype of NP396-specific CD8+ T cells that had significantly higher frequencies of T cells than an exhausted phenotype (PD-1+, PD-1+Tim3+, T-betEomes+) and significantly less effector T cell characteristics (T-bet+Eomesmid) compared to the GP33- and NP205-specific responses (Figure A2A–C). GP33-specific T cell responses contained comparable frequencies of exhausted phenotype T cells (PD-1+, PD-1+Tim3+, T-betEomes+) to the NP205-specific response, but slightly lower frequencies of an effector phenotype (T-bet+Eomesmid) (Figure A2C). Additionally, most of the epitope-specific T cells were of CD127CD62L phenotype (effector and exhausted cells). Nevertheless, CD127 and long-lived CD127+ T cells showed significant phenotypical differences between the three investigated epitope-specific responses (Figure A2E,F). In line with the other phenotypical characteristics, the NP396-specific T cell responses revealed the lowest frequency of long-lived T cells, while the GP33- and NP205-specific T cell responses were similar.
To further confirm the exhaustion levels of the epitope-specific T cell responses, we compared the responses in chronically infected mice to those of acute resolved LCMV (named “immune”) mice, detecting overall decreased responses, but at an individual epitope-specific degree (Figure 1D). As previously shown, NP396+-specific CD8+ T cells showed the most severe, highly significant exhaustion [46]. The subdominant NP205-specific response also displayed a significant, 2.8-fold decrease in the frequency of IFNγ+ T cells, while the difference in GP33-specific responses was less pronounced between chronically LCMV-infected and LCMV-immune mice. The phenotype of these responses is also individual and differs between the epitope-specific T cell responses, although all showed a major shift in phenotype from immune to chronic mice (Figure A3A,B).

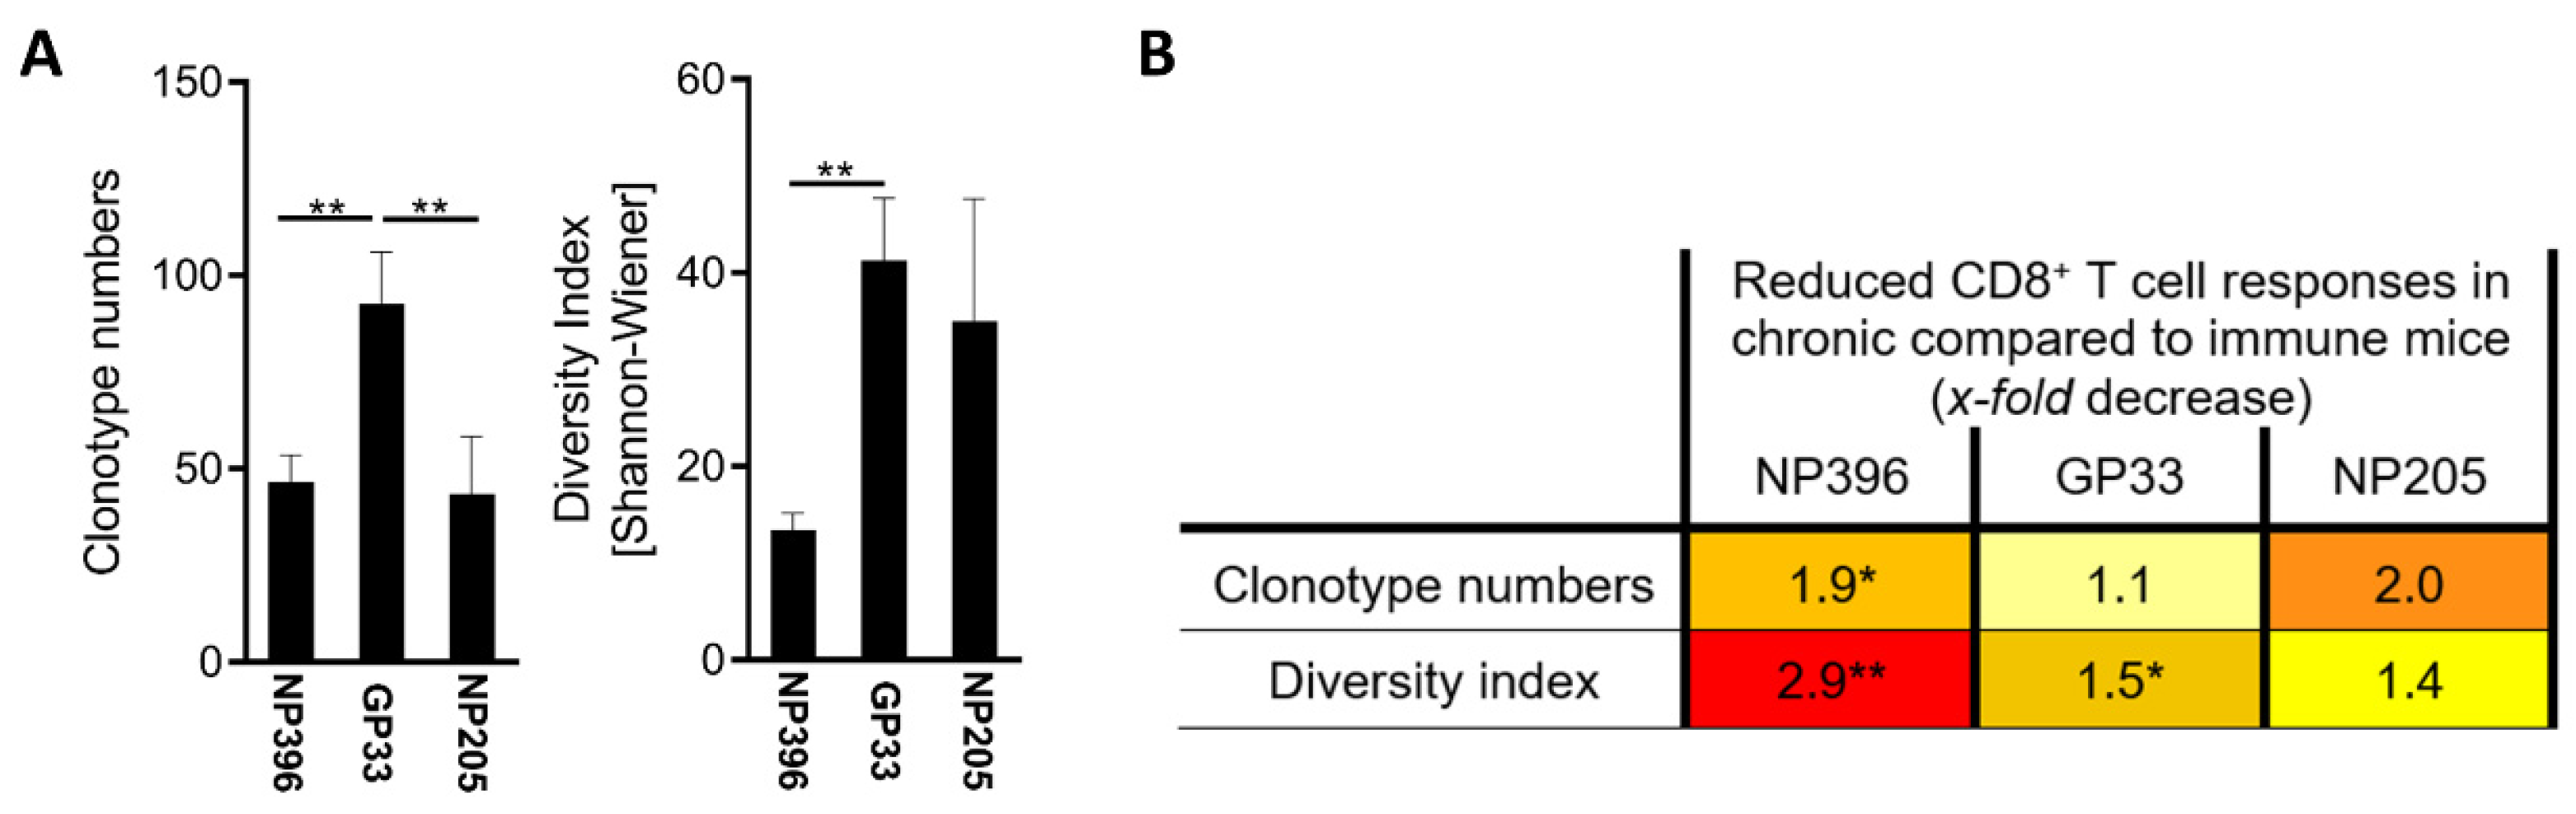
3.2. NP396-, GP33- and NP205-Specific T Cell Responses Displayed Differences in the TCR Repertoire in Chronic LCMV Infection

The number of clonotypes and diversity of the TCR repertoire were determined by next-generation sequencing of Dextramer+ T cells. A significantly higher number of GP33-specific clonotypes was detected compared to NP396- and NP205-specific T cells (Figure 2A), which is consistent with the analysis of IFNγ+ and Dextramer+ CD8+ T cells (Figure 1C). No differences were observed between the number of NP396- and NP205-specific clonotypes (Figure 2A). A higher GP33-specific clonotype number translated into significantly higher diversity compared to NP396-specific responses, but no differences were seen in NP205-specific responses. The diversity in NP396-specific T cell responses was lower than in NP205-specific responses. Comparing the constraints of the TCR repertoire between immune and chronic mice, we found significant decreases in clonotype number and diversity (Figure 2B and Figure A3C,D), with most prominent changes being revealed again in the response to NP396, followed by NP205-specific TCR responses.
These results indicate that the TCR repertoire of the investigated LCMV epitope-specific T cell responses evolves with the stage of exhaustion during chronic infection. The immune mice were further used as another benchmark to compare TCR-related differences between those epitopes.

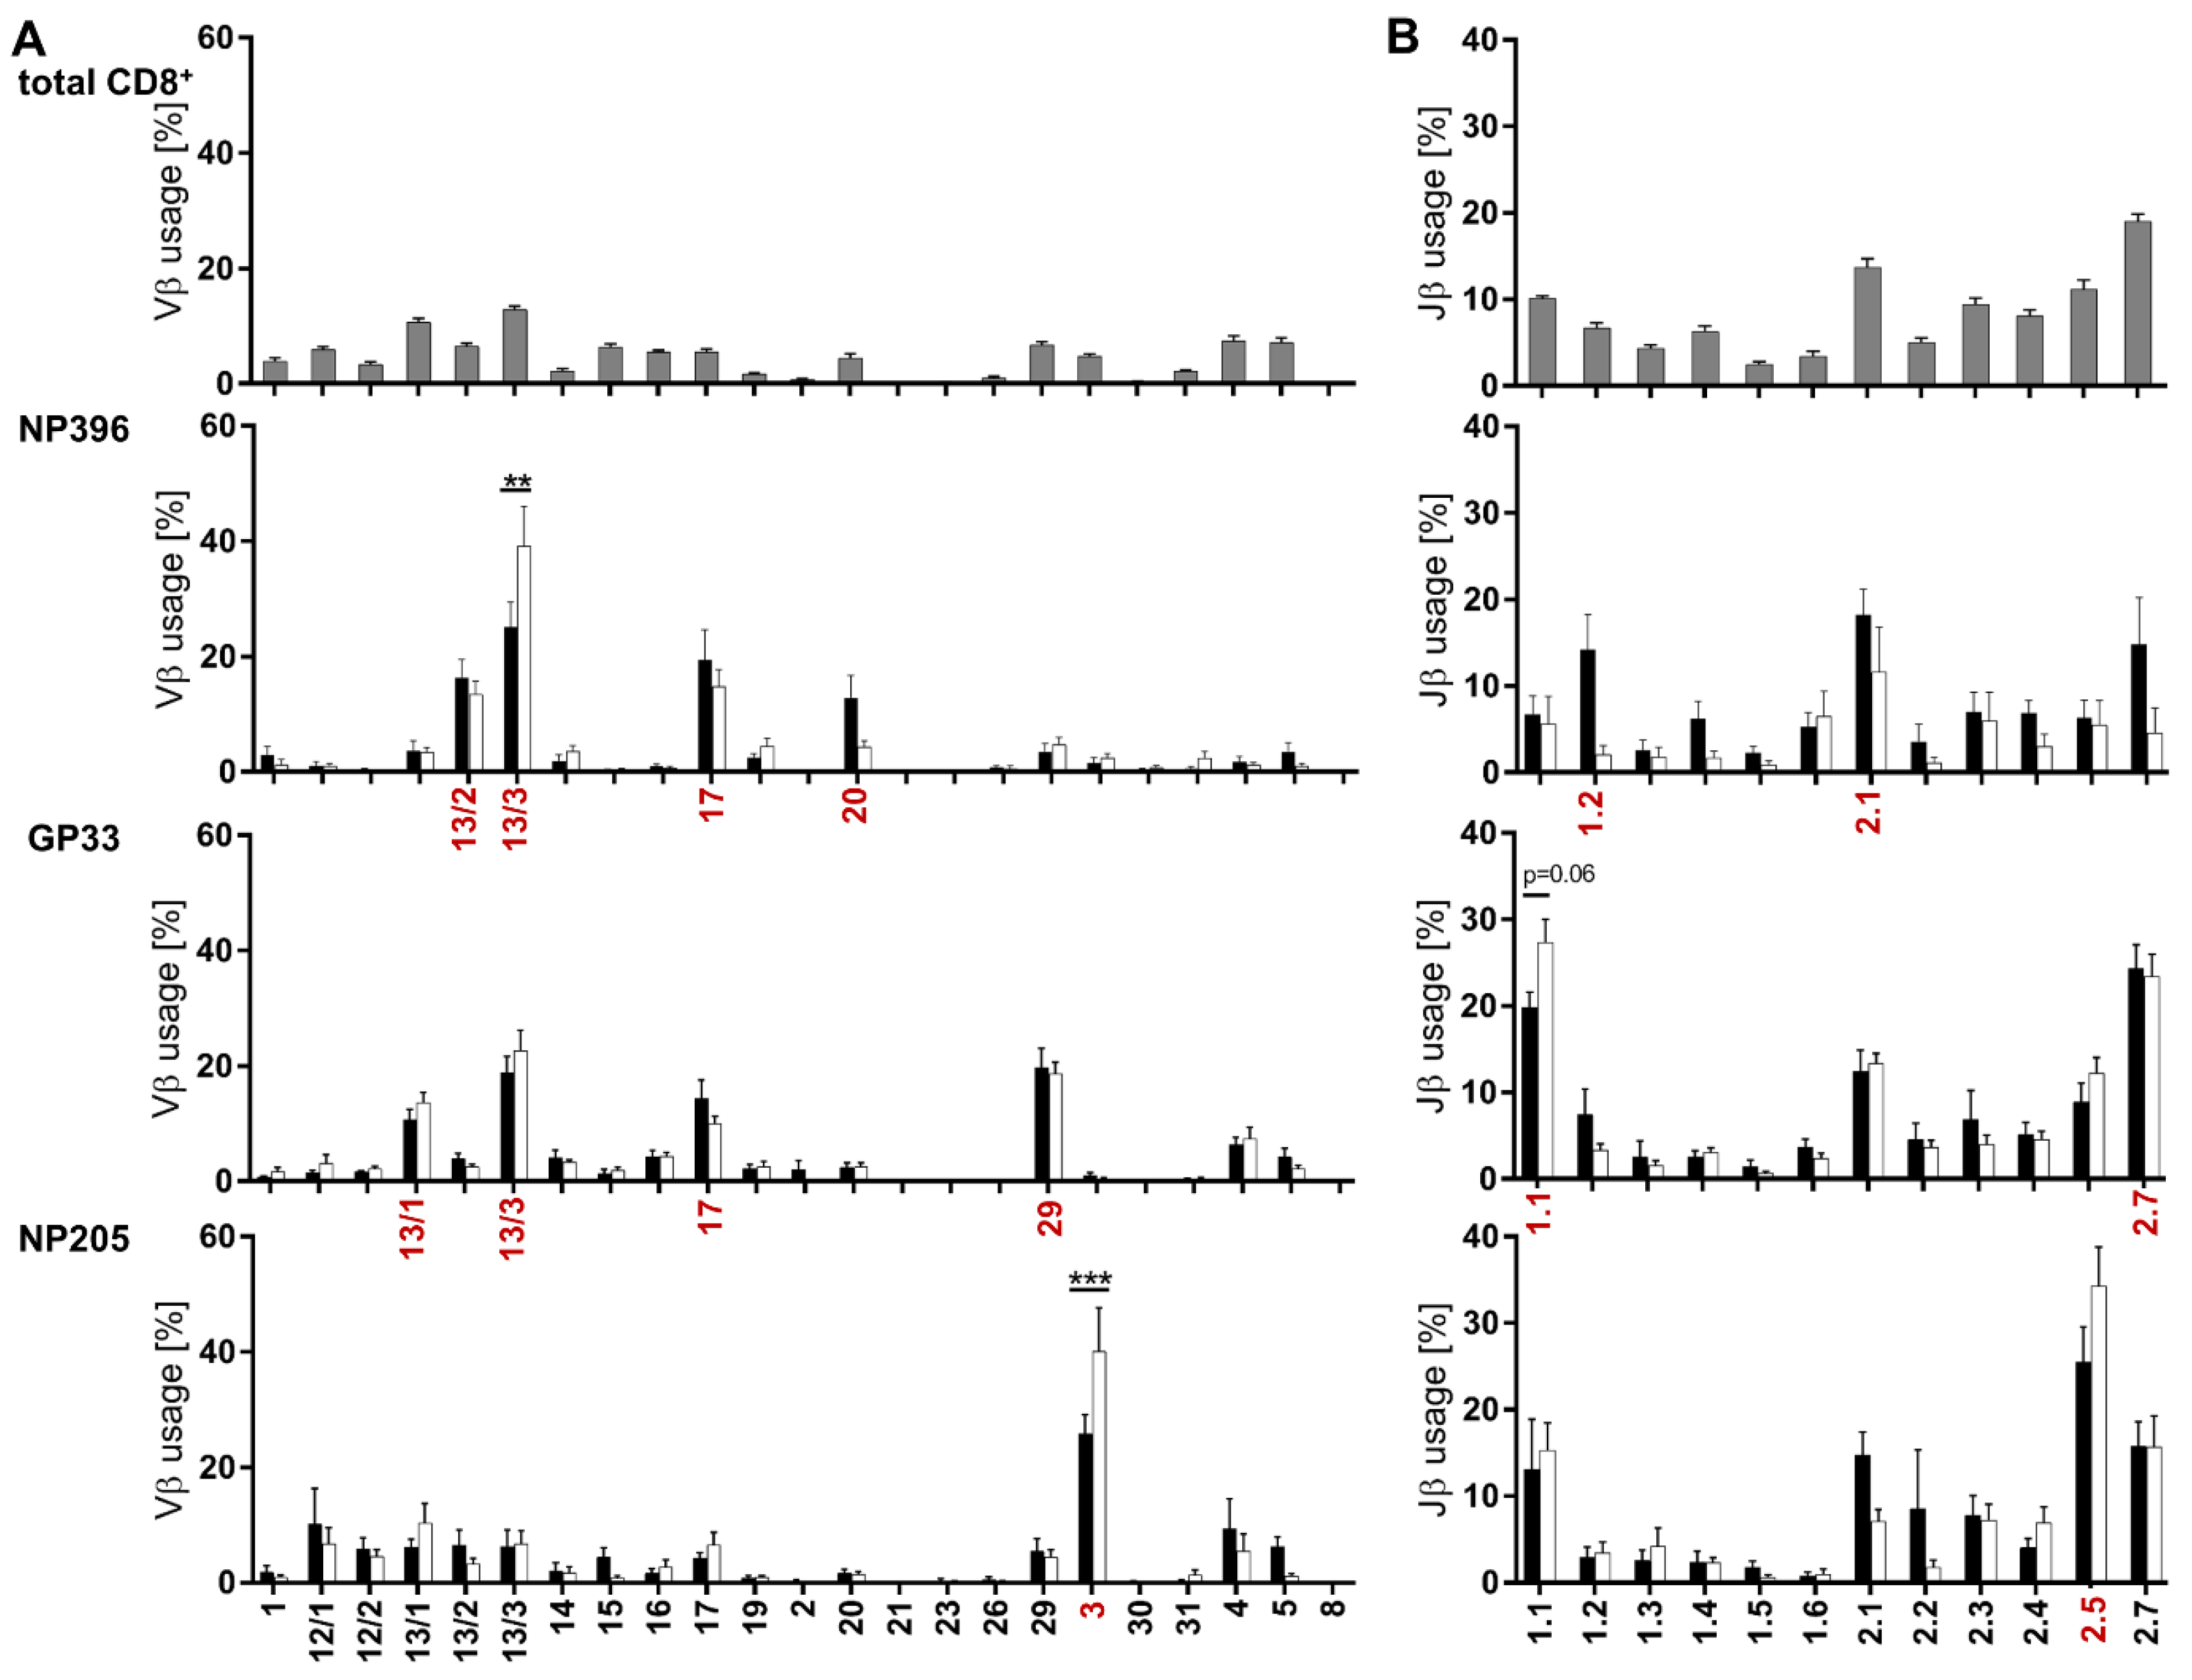
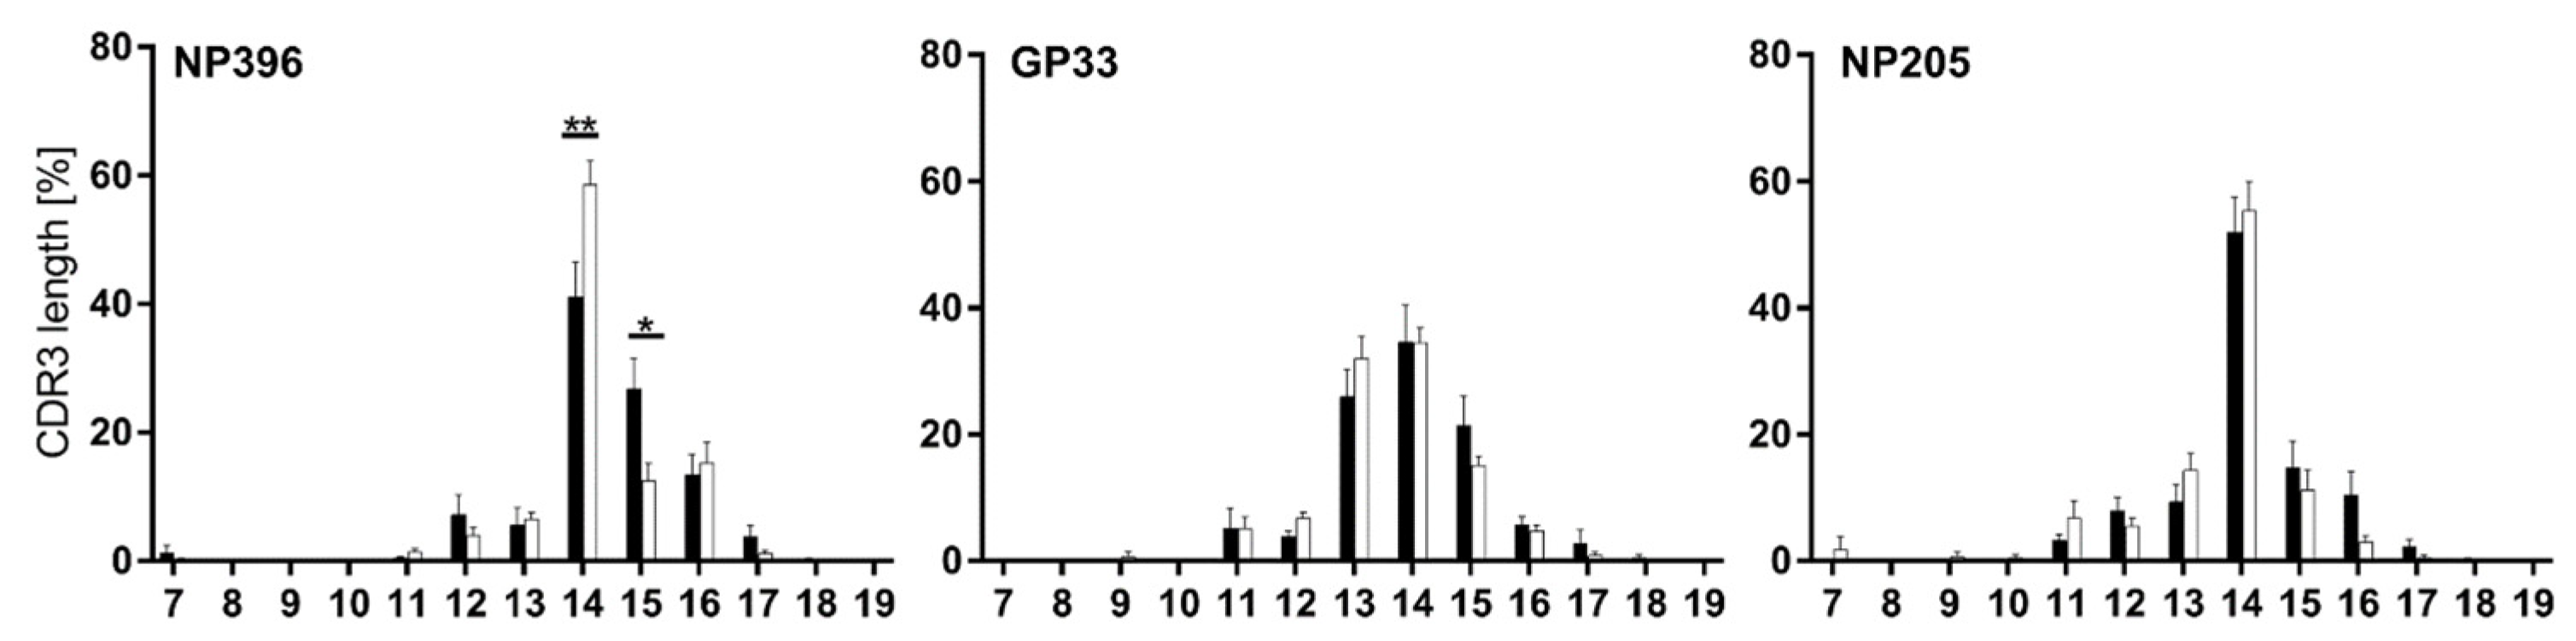
3.3. Distinct Vβ/Jβ Patterns Appeared in Individual Epitope-Specific TCR Repertoires

Altered clonotype number and diversity between the epitope-specific T cell responses in chronically infected mice (Figure 2A) indicated that the TCR repertoire might be altered. Therefore, we analyzed Vβ- and Jβ-chain usage, as well as the length of the complementary determining region 3 (CDR3) of the respective TCR repertoires. Additionally, we compared those results with T cell responses in LCMV-immune mice to detect exhaustion associated shifts.
Analysis of the Vβ- and Jβ-chain usage showed that all three epitope-specific T cell responses had a prominent increase in distinct Vβ- and Jβ-chain usages in comparison to the overall Vβ/Jβ usage of CD8+ T cells (Figure 3). NP396- and GP33-specific T cell responses predominately used four Vβ-chains and two Jβ-chains, whereas NP205-specific responses were focused on one Vβ- (Vβ3) and one Jβ-chain (Jβ2.5) in chronically infected mice (Figure 3, marked in red). Interestingly, the previously shown significant differences between chronic and immune mice (Figure 2B) induced only minor shifts in the Vβ- and Jβ-chain usage, despite two significant shifts (NP396 Vβ-13/3 and NP205 Vβ-3) (Figure 3A).
CDR3 length measurements revealed that all three epitope-specific responses favored 14 amino acids (aa) (Figure 4). This preference followed an approximately normal distribution for GP33, but was more pronounced for NP396 and especially for NP205.
In line with data shown in Figure 3, only minor changes appeared between TCR usage of chronic and immune mice, with significant shifts only in the NP396-specific T cell response (CDR3 length 14aa and 15aa) (Figure 4).
Overall, quantitative comparison indicated that NP396- and GP33-specific responses used more different Vβ- and Jβ-chains and CDR3 length compared to NP205-specific responses.

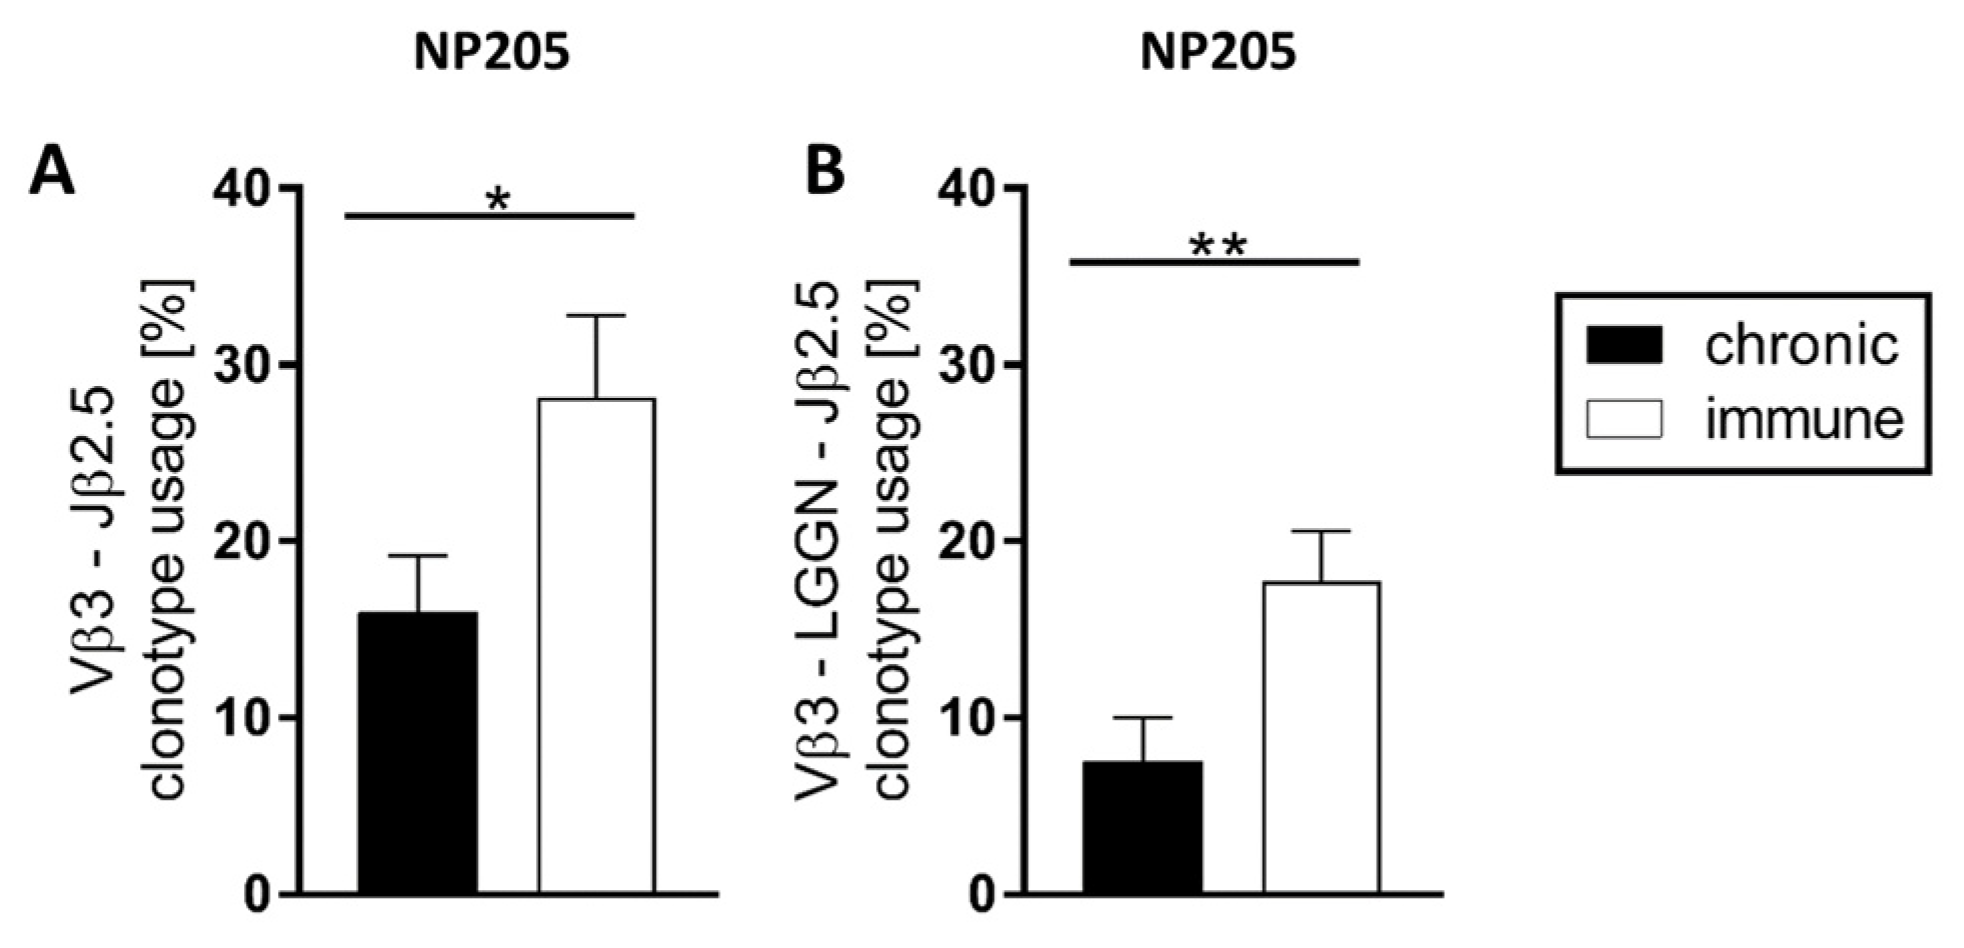
3.4. The TCR Repertoires to NP396 and GP33 Were Highly Private, Whereas NP205-Responses Revealed a Public TCR Repertoire

The Vβ- and Jβ-chain usage depends on the MHC composition of the host and is therefore relatively stable in the used genetically identical C57Bl/6 mice. However, on the aa level of the CDR3, public sequences, or closely related sequences (following a motif), are rarely seen among the highly abundant clonotypes, e.g., NP396 [46]. To further investigate whether this observation is also true for LCMV GP33- and NP205-specific responses, we analyzed the CDR3 aa sequences. Within the dominant NP396- and GP33-specific usages, no public sequences or repetitive motifs were detectable, revealing so-called private TCR repertoires.
In contrast, NP205-specific T cell responses were very focused on Vβ3 and Jβ2.5 (Figure 3), and these two dominant chains were paired for a relatively high frequency of 16% in chronic and 28% in immune mice (Figure 5A). In these Vβ3/Jβ2.5-clonotypes, a motif was detectable, using a four aa connection in the center of the CDR3, which is L-G-G-N (Leucine, Glycine, Glycine, Asparagine) or closely related to this (single aa changes). The relative frequency of this clonotype within the TCR repertoire is significantly reduced in chronic compared to immune mice (Figure 5B). Interestingly, most of the ‘LGGN’-clonotype carrying mice showed multiple nucleic acid sequences leading to the ‘LGGN’-clonotypes, indicating multiple selections of this clonotype in the thymus.
Concluding, NP396- and GP33-specific responses were found to be private, with neither a public clonotype nor a public motif. Therefore, the very profound dependence of the NP205-specific responses on one public motif was a unique feature. This separated NP205-specific from NP396- and GP33-specific T cell responses.
After finding these individual epitope-specific T cell responses, we were interested in knowing whether these epitope-specific responses influence and interact with each other. Therefore, we compared different epitope-specific T cell responses isolated from individual mice (Table A1). We could not find any indications of dependencies (e.g., substitution, suppression) between those epitope-specific responses searching for those correlations of and across many factors between epitopes.
Our data show that the exhaustion of LCMV-specific T cell responses is epitope-specifically independent and different in strength, phenotype and TCR repertoire in chronic infection.

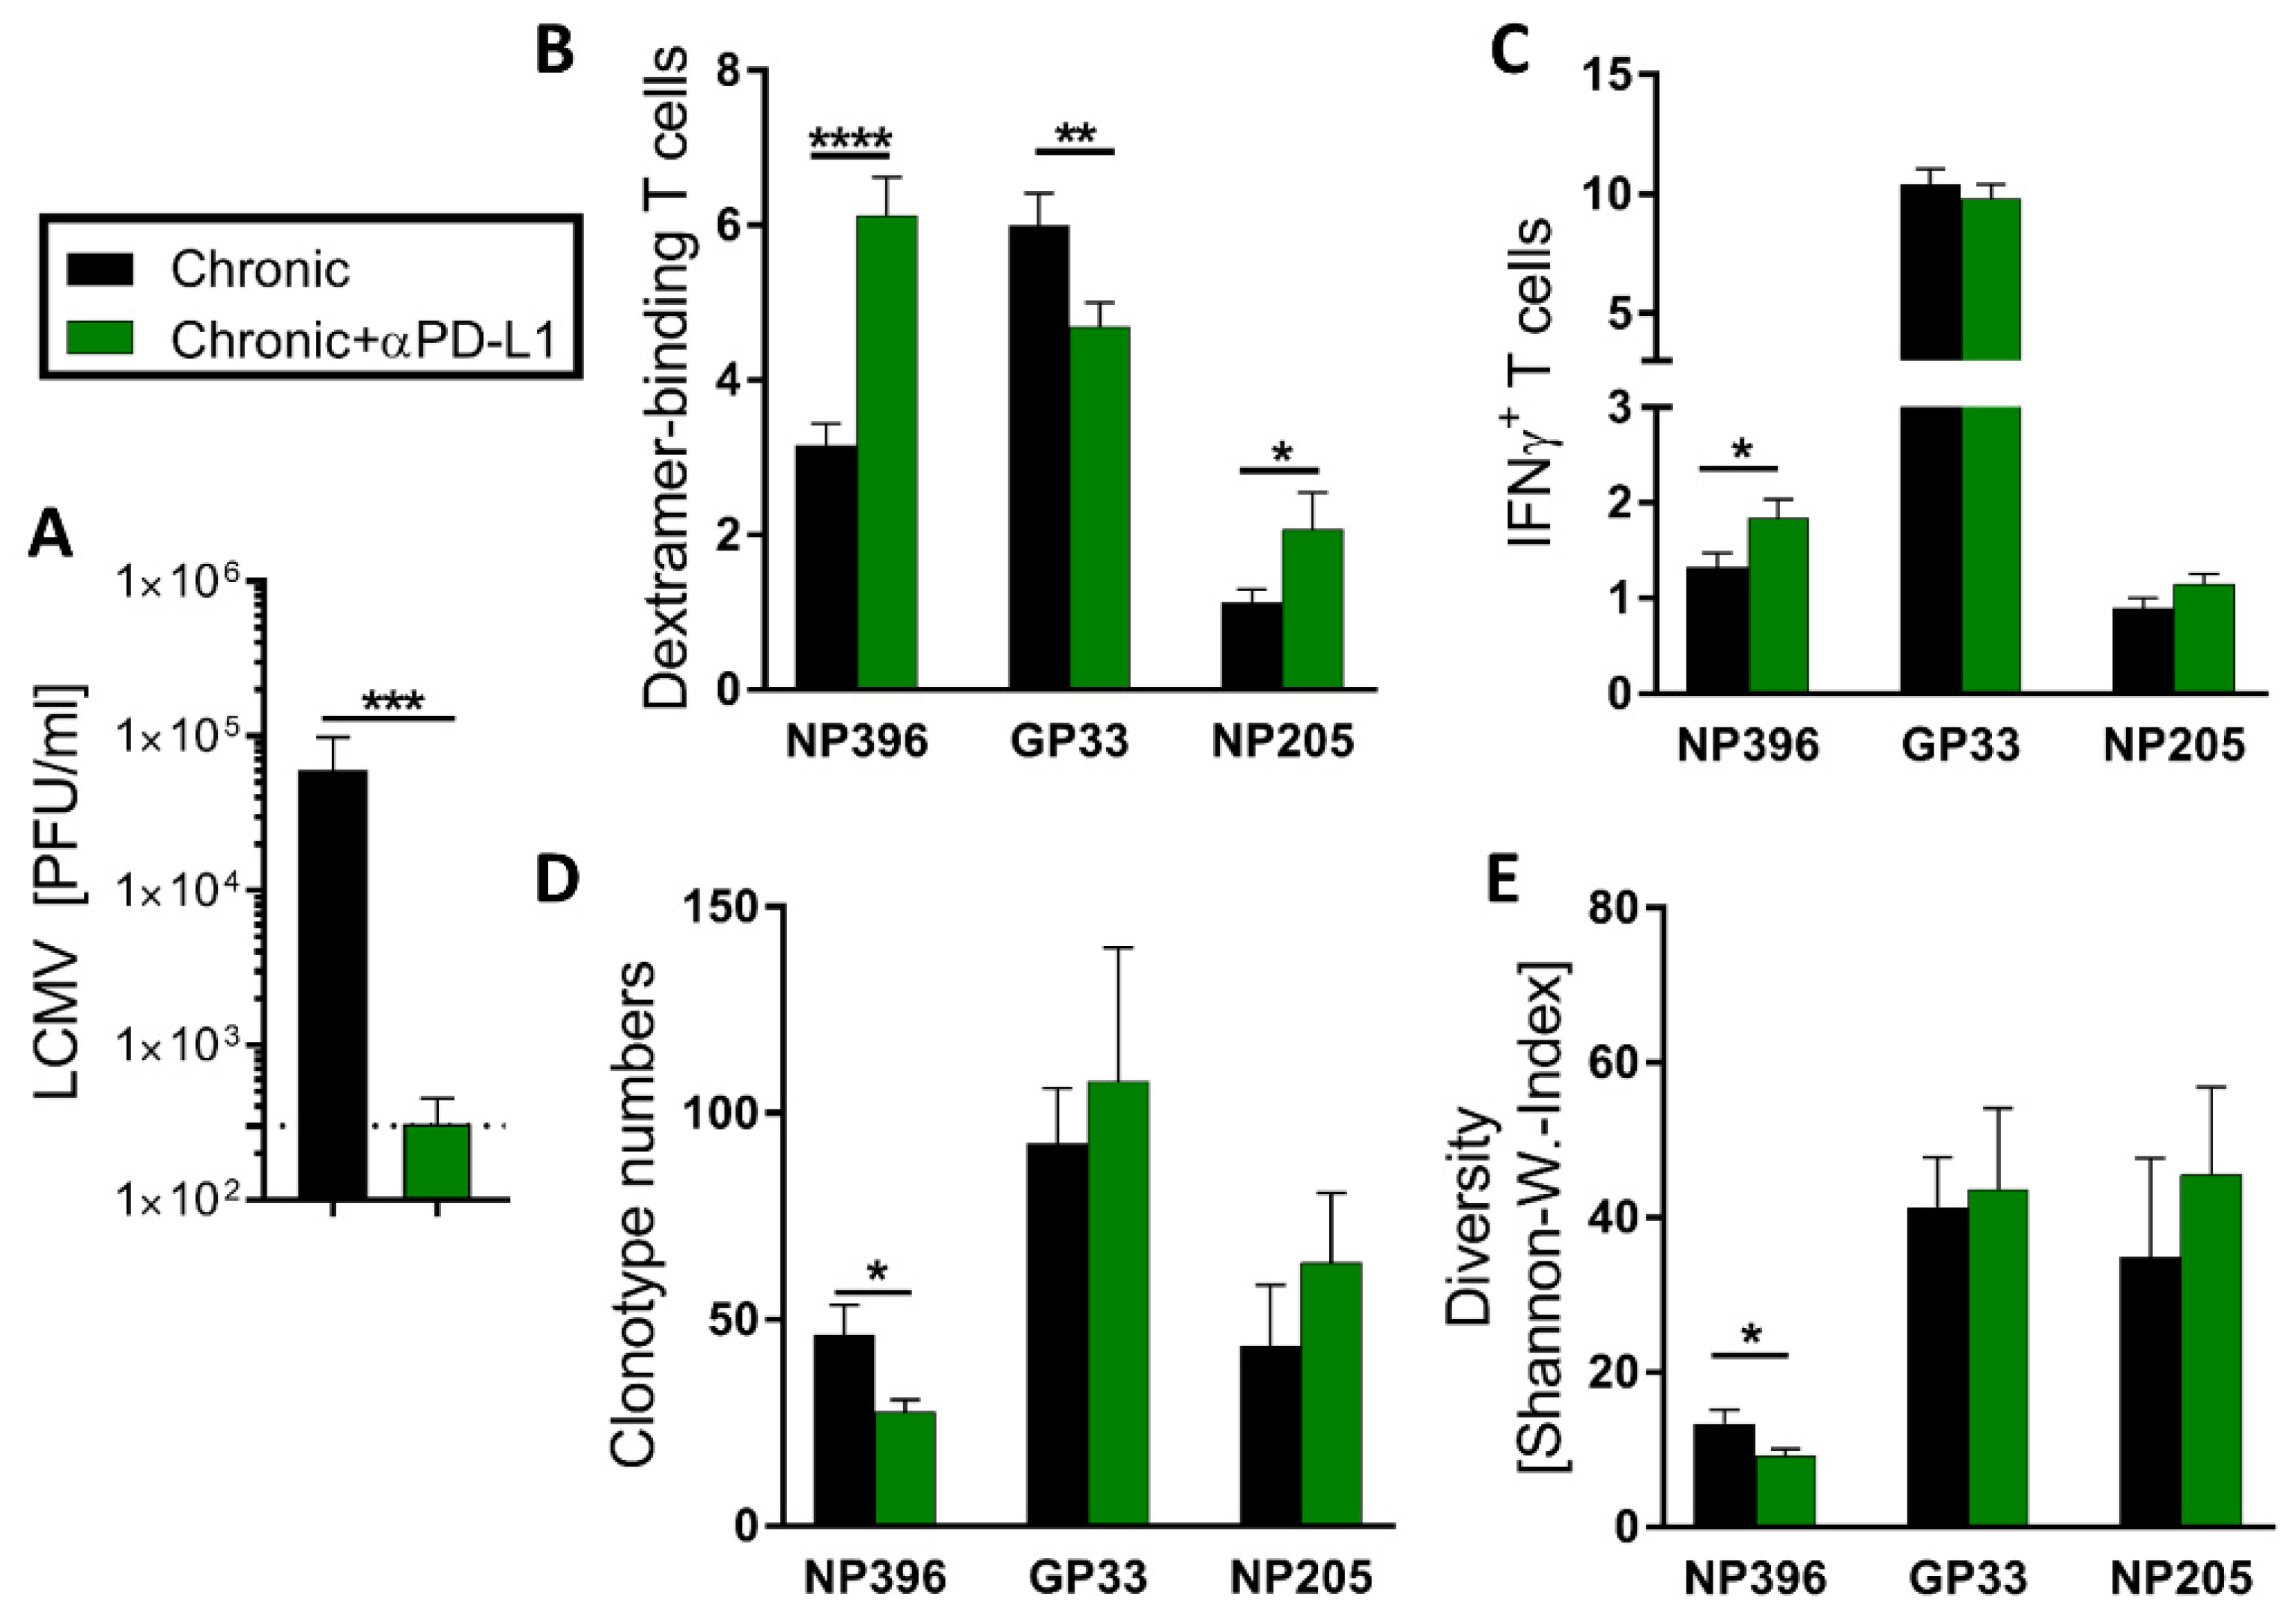
3.5. Checkpoint Inhibitor Treatment Shaped Predominantly the NP396- and NP205-Specific CD8+ TCR Repertoire, but Had Only Minor Effects on the GP33-Specific One

Anti-PD-L1 treatment in chronic-LCMV-infected mice restores exhausted virus-specific T cell responses and supports viral clearance (Figure 6A) [12,46]. Knowing from our data that LCMV epitope-specific T cell responses are differently exhausted in chronic LCMV infection, we were interested whether these differences also transfer into different sensitivity to treatment with ICI. We have previously reported profound effects of αPD-L1 on the response against NP396 [46]. Extending this analysis, we confirmed that the effect of αPD-L1 on NP396-specific responses resulted in significantly increased frequencies of Dextramer+ CD8+ T cells and IFNγ+ NP396-specific CD8+ T cells, as well as reduced clonotype number and diversity (Figure 6B–E). The response to NP205 was comparable to NP396-specific T cells in regard to a significantly increased frequency of Dextramer+ T cells and increased frequency of IFNγ+ NP205-specific CD8+ T cells (Figure 6B,C). However, whereas the clonotype number and the diversity of NP396-specific T cells were significantly reduced in αPD-L1-treated mice, the clonotype number and diversity of NP205-specific T cells were increased in tendencies compared to chronically LCMV-infected mice (Figure 6D,E). The frequency of GP33-Dextramer+ T cells decreased upon αPD-L1 therapy (Figure 6B), which could be a relative result from other responses increasing, rather than GP33-specific frequencies decreasing. Other than that, the αPD-L1 treatment showed hardly any effect on the GP33-specific CD8+ T cells (Figure 6C–E).
In contrast to NP396-specific responses, TCR repertoire sequencing of GP33- and NP205-specific T cells could not show significant modulations in TCR clonotype number (Figure 6D) or diversity (Figure 6E) from αPD-L1 treatment. However, NP205-specific responses displayed increased Dextramer+ T cell frequencies and clear tendencies towards broader TCR repertoires after treatment.
Our data showed that the responsiveness to ICI therapy was pronounced to NP396-specific T cell responses, whereas the responses against GP33 and NP205 were rather unaffected, revealing heterogeneous effects of ICI therapy on the virus epitope-specific level.

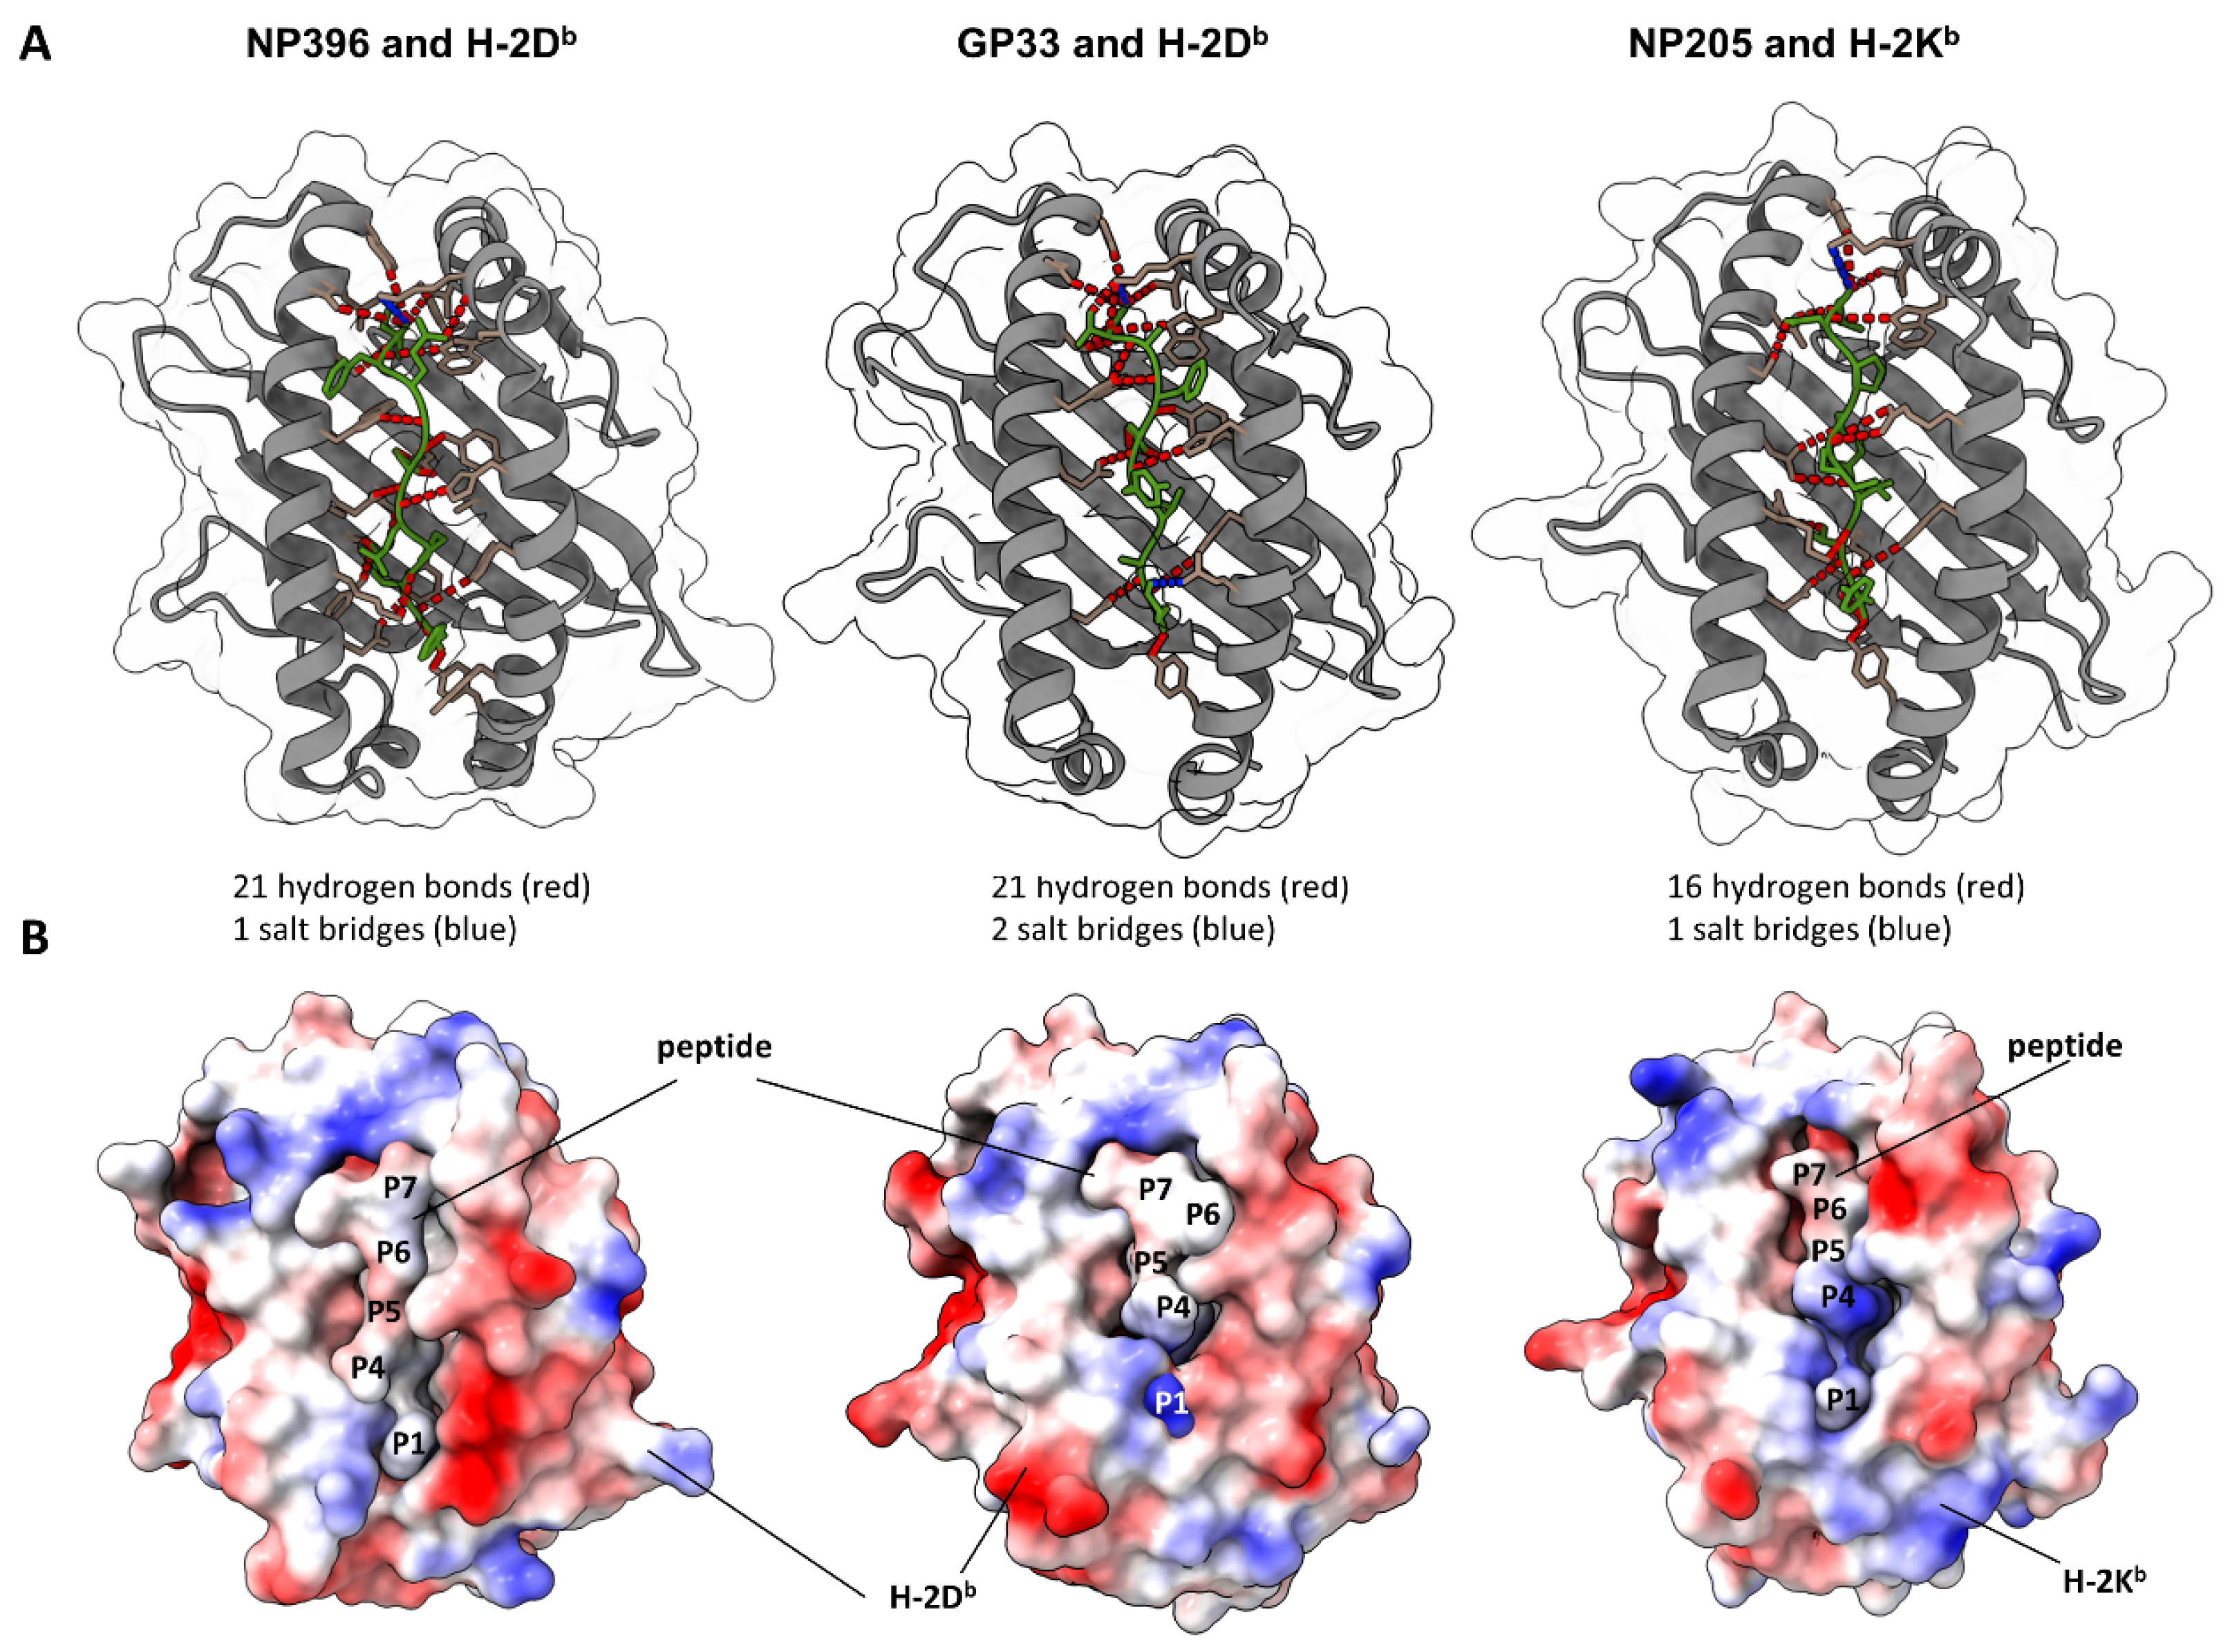
3.6. Crystallographic Structures of Peptide–MHC Complexes Indicated Differences in Epitope-Specific Antigen Presentation to CD8+ T Cells

Aside from different T cell clonotypes, epitope-specific T cell responses might also be shaped by different peptide presentations. To assess differences in this regard and appreciate the antigen presentation as a major factor for the shown epitope-specific differences, we obtained crystal structure models of the peptide–MHC complexes for our three analyzed peptides from the Protein Databank. These structures were used as input to compute peptide-MHC bonds and the electrostatic potential over the complex surface using UCSF ChimeraX. The calculation predicted 21 hydrogen bonds for NP396, 21 for GP33 and 16 for NP205 peptide binding to the MHC (Figure 7A). Additionally, one, two and one salt bridge(s) were predicted, respectively. Electrostatic coloring showed differences from a rather neutral and exposed NP396 peptide to a more hidden peptide with a positively charged P1 on GP33 (dark blue, lower part of the peptide, Lysine), and a more positively charged P4 on the NP205 peptide (Figure 7B). These different patterns of interaction reflect local rearrangements within the MHC-binding cleft which can affect peptide–MHC stability and presentation to the T cells. In addition, the different patterns observed for the peptide–MHC surfaces are consistent with different T cell populations being triggered by each one of these peptides. These findings might help to understand the detected differences in the epitope-specific CD8+ T cell responses.

4. Discussion

To our knowledge, this is one of the first studies comparing multiple epitope-specific CD8+ T cell responses within one chronic, virus-specific response in depth in regard to TCR repertoire, peptide presentation and responsiveness to ICI therapy. Many studies have investigated T cell responses in chronic viral infections focusing either on “the immune response” by combining individual epitope-specific responses or by using one epitope-specific response, extrapolating this knowledge to all virus epitope-specific responses (the overall response) [56,57,58]. Recently, we and others started to analyze and describe the vast variety that already appears on the level of epitope-specific responses in chronic infections [59,60,61,62]. In this study, we demonstrated that the three LCMV epitope-specific T cell responses (NP396, GP33, NP205), which are known to be individual in the strength of the induced response, loss of functionality and phenotype within a chronic immune response, revealed major differences in TCR repertoire and ICI treatment responsiveness.
For the NP396-specific response, we confirmed and extended the previously reported, severely exhausted phenotype [10,46,63], and found diminished clonotype number and diversity indices [46], accompanied by an oligoclonal TCR repertoire. The overall response revealed a high sensitivity to ICI treatment which resulted in even more pronounced oligoclonality in the TCR repertoire. The GP33-specific response dominated the LCMV-specific T cell responses and displayed significantly less exhaustion compared to NP396- as well as NP205-specific responses. Overall, all acquired data indicated that GP33-specific responses remained less affected during chronic LCMV infection, even under ICI therapy. The NP205-specific response showed similarities to the NP396 responses. In contrast to NP396 and GP33, the NP205-specific response showed a greater use of one public Vβ3/Jβ2.5-clonotype motif. Why this occurred in the NP205-specific response is still unknown. There is no indication that this is a feature of the H-2Kb, preferring Vβ3 binding. The fact that this ‘LGGN’-clonotype has been described not only for NP205-specific responses in LCMV-immune C57Bl/6 mice [44], but also in the p277 peptide (heat shock protein) [64] and in 27 out of 28 naïve C57Bl/6 mice [65], indicates its ubiquities presence. Therefore, it is likely that this clonotype is close to universal in C57Bl/6 mice, able to expand in nearly all mice in response to NP205 and probably related to a thymus-dependent selection process preferring this clonotype.
Besides the individual comparison of the three epitope-specific responses, we examined interactions between multiple epitope-specific responses by analyzing them within the same mouse. In correlation analysis, we found no dependencies, further strengthening our understanding of individual, epitope-specific T cell responses. Alternatively, one could suggest that the number of mice used in this study was too low to find significant dependencies. However, none of the analyzed interaction combinations were close to a significant correlation, while many significant differences appeared in other analyses. The absence of such dependencies is in line with previous results, showing intra-epitope competition for T cell responses [66,67], rather than across different epitopes, which is especially true in LCMV [68,69].
ICI therapy has been implemented as a very successful treatment in the clinics against cancer, and is also being evaluated for chronically hepatitis-B-virus-infected patients [70], although not all patients respond to it and immune responses are quite heterogeneous. It is known that this heterogeneity can originate, for example, from different levels of PD-1 expression on immune cells or mutations in the pdcd-1 gene [71]. However, little is known about whether epitope-specific differences also occur.
Anti-PD-L1 therapy in chronically LCMV-infected mice is effective for viral clearance [12,46]. We previously reported a profound effect on the TCR repertoire against NP396 [46] and showed in this study that the ICI therapy modulates the TCR repertories responding to GP33 and NP205 significantly less. Additionally, the effects on the number of responding T cells and function were lower, revealing overall epitope-specific differences in ICI responsiveness, which is in line with previous results [12]. This could be a consequence from less exhaustion of these responses or a dominant phenotype of T cells in the response that are not affected by ICI therapy (e.g., TCF1, [15]). In contrast to suggestions that less-exhausted T cells profit most from ICI therapy, we found the most prominent effect in the most-exhausted, NP396-specific response in a model system that undeniably profits from the treatment. Nevertheless, both results are in line with each other, when hypothesizing that the few remaining “less exhausted” T cells within NP396-specific responses are the origin of the detected effects. The low number of these cells could also explain the massive oligoclonality that is detected after ICI therapy. It has to be mentioned that frequency of cells was shown, since we focus on the differences between the epitope-specific responses. Due to the overall increase in cells, the GP33-specific T cell frequency is significantly reduced, but the absolute cell number is not significantly decreased after αPD-L1 treatment. Nevertheless, the shown frequency strengthens the point that GP33-specific responses are severely less affected than NP396-specific ones. Although it is currently impossible to target specific responses with ICI therapy, we would speculate on the basis of our data that restoring very exhausted epitope-specific responses, in order to restore broader epitope coverage, is more valuable than pushing less-exhausted ones. In the end, the question remains whether ICI-induced restoration actually saves T cells from exhaustion rather than boosting the subsequently responding T cells [72]. Dahling et al. have suggested that the response is “unleashed” by ICI therapy [73]. This is in line with the published data indicating that the phenotype of these restored T cells might be more exhausted [74].
Besides the T cells themselves, the importance of antigen presentation is also indicated by our results. NP396- and GP33-specific responses showed very private TCR repertoires between mice, but developed consistently in their individual phenotype throughout a chronic LCMV infection in all C57Bl/6 mice, indicating an unknown force guiding this development. Since each mouse used different TCR clonotypes, a TCR-independent factor has to be a major regulator for this. A likely explanation is that different antigen presentations of both peptides, originating from different binding affinities or stabilities of the respective peptide to the MHC H-2Db, allow for more or less presentation, T cell activation and functional T cell avidity. Our depicted modeling of the peptide–MHC complexes supports this concept of different antigen presentations, revealing different amounts of hydrogen bonds and distinctive electrostatic surfaces. While anchor amino acids (P2 and P9) appear similar between both complexes [75], the most differences are visible in the amino acids P5, P6 and P7 [76]. In this context, it has also been shown that NP396- H-2Db binding is much more profound than GP33-H-2Db binding [42], possibly supporting more TCR binding and faster exhaustion of the NP396-specific response. Importantly, GP33 can be presented by H-2Db and H-2Kb [77], which can be hypothesized to support the observed more diverse TCR response. These data indicate that epitope-specific alterations may partially originate from the MHC side, indicating that the antigen presentation is important to further explain epitope-specific differences. In regard to the NP205 motif, we hypothesize that it originates from the presence of the ubiquitous LGGN-clonotype prior to infection. Consequently, no such ubiquitous clonotype responds in high abundance to NP396 or GP33; therefore, no dominant motifs are detectable in these responses between different mice. In conclusion, the reason for the different development of epitope-specific responses is beyond the scope of this study. We think that the differences in antigen presentation are a major reason for our reported differences in exhaustion. Furthermore, we hypothesize that differences such as TCR changes and ICI responsiveness rely on the exhaustion status of the individual responses and may change over time. Indications for this can be drawn from a comparable LCMV mouse model where CD4+ T cells are depleted in order to generate a deeper exhaustion state. Under these slightly more artificial conditions, GP33-specific TCR repertoires are also significantly shifted [47].
The strength of this study is that we have revealed three very different epitope-specific responses with different exhaustion statuses (effect of exhaustion on the TCR repertoire and ICI treatment responsiveness) by analyzing nearly 50 mice, with flow cytometry as well as deep-sequencing techniques. We analyzed different epitope-specific responses within individual mice in order to systemically compare these responses in depth and find dependencies, interactions or substitutions. Some recent analyses of other TCRs have shown how phenotypically heterogeneous epitope-specific T cell responses can be [41,78], although they have identical TCR-carrying T cells [31,40,62]. Although these transgenic models are slightly more artificial with high numbers of GP33-specific P14 T cells, it nevertheless shows the restrictions of TCR repertoire and antigen presentation analysis, and that other important factors are yet to be found. A specific limitation of this study is that only TCRβ was determined. While being widely accepted as the main driver for TCR repertoire characteristics, the TCRα [79] and dual TCRα T cells (although mostly in CD4+ T cells) [80] should have an impact. It is also worth noting that we could not combine phenotypical and TCR data on a single-cell level, which will be an interesting topic of future work.

5. Conclusions

In this study, we showed that epitope-specific T cell responses are individual and independent. Therefore, T cells should be analyzed on an individual epitope level, rather than summarizing all to “one immune response”. Epitope-specific differences might help explain heterogeneity in immune responses from patients with chronic viral infections and cancer and in terms of responsiveness to ICI therapy. Our findings might open additional paths to generating new therapeutic options.

Author Contributions

Conceptualization, M.C. and A.R.M.K.; methodology, S.K., J.M., F.B., I.P. and D.A.A.; software, S.K., F.B. and D.A.A.; formal analysis, S.K. and J.M.; writing—original draft preparation, S.K.; writing—review and editing, A.R.M.K.; visualization, S.K., J.M. and A.R.M.K.; supervision, M.C. and A.R.M.K.; project administration, A.R.M.K.; funding acquisition, M.C. and A.R.M.K. All authors have read and agreed to the published version of the manuscript.

Funding

This work was supported by a grant from the German Research Association (DFG) [KR 2913/2-1 to ARMK].

Institutional Review Board Statement

For all animal experiments, the highest possible ethical standards were ensured, and all efforts were made to reduce the suffering of mice. All mouse experiments were performed in accordance with the guidelines of the Medical School Hannover (MHH), Germany, the national animal protection law and the animal experiment regulations. The study was approved by the State of Lower Saxony (LAVES—Niedersächsisches Landesamt für Verbraucherschutz und Lebensmittel-sicherheit—project number 33.12–42502-04-16/2127).

Data Availability Statement

Data will be made available upon publication on a local server RepoMed (mhh-publikationsserver.gbv.de).

Acknowledgments

This work was supported by the infrastructure of the SFB900 (project number 158989968, to MC), RESIST (EXC 2155—project number 390874280 to MC) and DZIF (TTU-05-702, TTU-05-708 to M.C.). We further thank Matthias Ballmaier and the Cell Sorting Core Facility at the Hannover Medical School supported in part by Deutsche Forschungsgemeinschaft. Thanks also to Anja Schimrock from the Department of Immunology for technical support as well as the central animal facility of the Hannover Medical School (ZTL) for taking great care of our animals during this study.

Conflicts of Interest

The authors declare no conflict of interest.

Appendix A

Figure A1. Flow cytometric gating strategy for IFN-γ+ and Dextramer+ T cells.
Pathogens 12 00716 g0a1
Figure A2. Phenotypical characterization revealed significant differences between the epitope-specific T cells. (AF) Flow-cytometric measurement of epitope-specific CD8+CD44+ T cells gated from Dextramer+ populations are shown from chronically LCMV-infected mice. Bar graphs depict means with SEM. (G) Radar plots depict phenotypical marker comparisons between LCMVcl13 (black line) and LCMV-immune (grey areas) mice. Stars imply significant differences between LCMCcl13 and LCMV-immune mice. All significance levels are depicted with * p < 0.05, ** p < 0.01, *** p < 0.001, **** p < 0.0001, n = 6–26.
Pathogens 12 00716 g0a2
Figure A3. Epitope-specific alterations were detectable in LCMV-specific T cell responses. Epitope-specific T cells were analyzed at day 36 post LCMVl13 (chronic) and LCMV (immune) infection. (A) Frequency of epitope-specific IFNγ+CD8+CD44+ T cell responses, (B) frequency of Dextramer+CD8+CD44+ T cells (n = 33–44) and (C) number of epitope-specific clonotypes are shown and (D) a diversity index of epitope-specific clonotypes is depicted (n = 6–18). Graphs depict means with standard error of the means (SEM), significance levels comparing the T cells in immune mice (white bars) are given, with * p < 0.05, *** p < 0.001, **** p < 0.0001.
Pathogens 12 00716 g0a3
Table A1. All mice that were used for TCR repertoire analysis are shown, with respective, measured epitope-specific TCR repertoires.
NP396GP33NP205
MouseTreatmentCells (Input)ReadsClonotypesDiversityCells (Input)ReadsClonotypesDiversityCells (Input)ReadsClonotypesDiversity
1chronic 900015,5517224.0
2chronic 900015,5845228.1830103,1832111.2
3chronic 11,00028,6286223.8
4chronic980028,2423010.911,80024,88715178.4
5chronic184018,4103821.312,10028,7648841.5
6chronic254019,488169.1880018,3037034.9
7chronic10,10030,5103711.212,20035,83110040.2
8chronic840027,0963311.0
9chronic12,30030,587549.2
10chronic10,00020,9623014.9
11chronic11,30020,1643315.7
12chronic10,00020,152265.1
13chronic880021,742359.9
14chronic620028,333478.9
15chronic680026,9485123.0
16chronic610021,29814736.2
17chronic590027,8595312.8
18chronic10,4003675495.7
19chronic980017,082868.2
20chronic10,00024,2395417.6
21chronic 11,10041,99518277.8402295112319.2
22chronic 15,10037,4355927.2144112,7972218.9
23chronic 10,80088939137.3254014,480124103.5
24chronic 554737,0826046.4
25chronic 219034,9814539.6
26chronic 11,90028,049106.2
27chronic650025,8375312.8
28chr.+αPD-L1960027,1303310.5800025,47510244.2
29chr.+αPD-L110,00028,383125.5900021,76213463.4
30chr.+αPD-L1946032,553297.914,20031,0206323.6
31chr.+αPD-L111,30027,8352910.8940028,88411640.0
32chr.+αPD-L111,00016,9003514.6
33chr.+αPD-L111,00017,2752910.4
34chr.+αPD-L110,00012,98185.2
35chr.+αPD-L110,00017,4072413.3
36chr.+αPD-L113,00015,7043613.8
37chr.+αPD-L112,00020,618288.7
38chr.+αPD-L1 10,20040,83327692.4297214,9827756.4
39chr.+αPD-L1 10,20037,557107.3286113,6837452.1
40chr.+αPD-L1 11,10042,3485434.42536882310563.7
41chr.+αPD-L110,00013,757208.6 571140,25010177.8
42chr.+αPD-L1 372246,2241210.4
43chr.+αPD-L114,70013,123104.6 13,50029,3091412.9
44immune 13,60036,28115689.8508820,02712471.2
45immune11,50017,8313317.0 786538,3681513.6
46immune13,60021,3828937.1 13,60032,4868648.3
47immune13,60017,7484415.1 13,40040,1002316.2
48immune15,50023,34914170.9
49immune10,00022,43512456.8
50immune890020,64810439.0
51immune 10,00019,3389745.6600316,620517767.4
52immune 10,00023,7129760.9606835,97098.2
53immune 10,00032,58110860.05709216,712362215.7
54immune 950024,9437648.111,02064,97598.3
55immune 10,00022,22010165.45140168,0597344.6
56immune 10,00024,53412576.615,393108,2202320.3
57immune 10,00020,3148862.03408135,5414525.7

References

  1. WHO Organization. World Health Organization Fact Sheets Hepatitis B, Hepatitis C and HIV 2022. Available online: https://www.who.int/news-room/fact-sheets/detail/ (accessed on 25 April 2023).
  2. Wherry, E.J.; Kurachi, M. Molecular and Cellular Insights into T Cell Exhaustion. Nat. Rev. Immunol. 2015, 15, 486–499. [Google Scholar] [CrossRef]
  3. Wherry, E.J. T Cell Exhaustion. Nat. Immunol. 2011, 12, 492–499. [Google Scholar] [CrossRef]
  4. Walunas, T.L.; Bakker, C.Y.; Bluestone, J.A. CTLA-4 Ligation Blocks CD28-Dependent T Cell Activation. J. Exp. Med. 1996, 183, 2541–2550. [Google Scholar] [CrossRef]
  5. Parry, R.V.; Chemnitz, J.M.; Frauwirth, K.A.; Lanfranco, A.R.; Braunstein, I.; Kobayashi, S.V.; Linsley, P.S.; Thompson, C.B.; Riley, J.L. CTLA-4 and PD-1 Receptors Inhibit T-Cell Activation by Distinct Mechanisms. Mol. Cell Biol. 2005, 25, 9543–9553. [Google Scholar] [CrossRef]
  6. Li, K.; Yuan, Z.; Lyu, J.; Ahn, E.; Davis, S.J.; Ahmed, R.; Zhu, C. PD-1 Suppresses TCR-CD8 Cooperativity during T-Cell Antigen Recognition. Nat. Commun. 2021, 12, 2746. [Google Scholar] [CrossRef]
  7. Bucks, C.M.; Norton, J.A.; Boesteanu, A.C.; Mueller, Y.M.; Katsikis, P.D. Chronic Antigen Stimulation Alone is Sufficient to Drive CD8+ T Cell Exhaustion. J. Immunol. 2009, 182, 6697–6708. [Google Scholar] [CrossRef]
  8. Mueller, S.N.; Ahmed, R. High Antigen Levels are the Cause of T Cell Exhaustion during Chronic Viral Infection. Proc. Natl. Acad. Sci. USA 2009, 106, 8623–8628. [Google Scholar] [CrossRef]
  9. Angelosanto, J.M.; Blackburn, S.D.; Crawford, A.; Wherry, E.J. Progressive Loss of Memory T Cell Potential and Commitment to Exhaustion during Chronic Viral Infection. J. Virol. 2012, 86, 8161–8170. [Google Scholar] [CrossRef]
  10. Wherry, E.J.; Blattman, J.N.; Murali-Krishna, K.; van der Most, R.; Ahmed, R. Viral Persistence Alters CD8 T-Cell Immunodominance and Tissue Distribution and Results in Distinct Stages of Functional Impairment. J. Virol. 2003, 77, 4911–4927. [Google Scholar] [CrossRef]
  11. Kemball, C.C.; Lee, E.D.H.; Vezys, V.; Pearson, T.C.; Larsen, C.P.; Lukacher, A.E. Late Priming and Variability of Epitope-Specific CD8+ T Cell Responses during a Persistent Virus Infection. J. Immunol. 2005, 174, 7950–7960. [Google Scholar] [CrossRef]
  12. Barber, D.L.; Wherry, E.J.; Masopust, D.; Zhu, B.; Allison, J.P.; Sharpe, A.H.; Freeman, G.J.; Ahmed, R. Restoring Function in Exhausted CD8 T Cells during Chronic Viral Infection. Nature 2006, 439, 682–687. [Google Scholar] [CrossRef]
  13. Bengsch, B.; Martin, B.; Thimme, R. Restoration of HBV-Specific CD8+ T Cell Function by PD-1 Blockade in Inactive Carrier Patients is Linked to T Cell Differentiation. J. Hepatol. 2014, 61, 1212–1219. [Google Scholar] [CrossRef]
  14. Wu, T.; Ji, Y.; Moseman, E.A.; Xu, H.C.; Manglani, M.; Kirby, M.; Anderson, S.M.; Handon, R.; Kenyon, E.; Elkahloun, A.; et al. The TCF1-Bcl6 Axis Counteracts Type I Interferon to Repress Exhaustion and Maintain T Cell Stemness. Sci. Immunol. 2016, 1, eaai8593. [Google Scholar] [CrossRef]
  15. Chen, Z.; Ji, Z.; Ngiow, S.F.; Manne, S.; Cai, Z.; Huang, A.C.; Johnson, J.; Staupe, R.P.; Bengsch, B.; Xu, C.; et al. TCF-1-Centered Transcriptional Network Drives an Effector Versus Exhausted CD8 T Cell-Fate Decision. Immunity 2019, 51, 840–855.e5. [Google Scholar] [CrossRef]
  16. Welten, S.P.M.; Yermanos, A.; Baumann, N.S.; Wagen, F.; Oetiker, N.; Sandu, I.; Pedrioli, A.; Oduro, J.D.; Reddy, S.T.; Cicin-Sain, L.; et al. Tcf1+ Cells are Required to Maintain the Inflationary T Cell Pool upon MCMV Infection. Nat. Commun. 2020, 11, 2295. [Google Scholar] [CrossRef]
  17. Martinez, G.J.; Pereira, R.M.; Aijo, T.; Kim, E.Y.; Marangoni, F.; Pipkin, M.E.; Togher, S.; Heissmeyer, V.; Zhang, Y.C.; Crotty, S.; et al. The Transcription Factor NFAT Promotes Exhaustion of Activated CD8+ T Cells. Immunity 2015, 42, 265–278. [Google Scholar] [CrossRef]
  18. Wang, Y.; Hu, J.; Li, Y.; Xiao, M.; Wang, H.; Tian, Q.; Li, Z.; Tang, J.; Hu, L.; Tan, Y.; et al. The Transcription Factor TCF1 Preserves the Effector Function of Exhausted CD8 T Cells during Chronic Viral Infection. Front. Immunol. 2019, 10, 169. [Google Scholar] [CrossRef]
  19. Renkema, K.R.; Huggins, M.A.; Borges da Silva, H.; Knutson, T.P.; Henzler, C.M.; Hamilton, S.E. KLRG1+ Memory CD8 T Cells Combine Properties of Short-Lived Effectors and Long-Lived Memory. J. Immunol. 2020, 205, 1059–1069. [Google Scholar] [CrossRef]
  20. Borst, L.; Sluijter, M.; Sturm, G.; Charoentong, P.; Santegoets, S.J.; van Gulijk, M.; van Elsas, M.J.; Groeneveldt, C.; van Montfoort, N.; Finotello, F.; et al. NKG2A is a Late Immune Checkpoint on CD8 T Cells and Marks Repeated Stimulation and Cell Division. Int. J. Cancer 2022, 150, 688–704. [Google Scholar] [CrossRef]
  21. Jadhav, R.R.; Im, S.J.; Hu, B.; Hashimoto, M.; Li, P.; Lin, J.X.; Leonard, W.J.; Greenleaf, W.J.; Ahmed, R.; Goronzy, J.J. Epigenetic Signature of PD-1+ TCF1+ CD8 T Cells that Act as Resource Cells during Chronic Viral Infection and Respond to PD-1 Blockade. Proc. Natl. Acad. Sci. USA 2019, 116, 14113–14118. [Google Scholar] [CrossRef]
  22. Siddiqui, I.; Schaeuble, K.; Chennupati, V.; Fuertes Marraco, S.A.; Calderon-Copete, S.; Pais Ferreira, D.; Carmona, S.J.; Scarpellino, L.; Gfeller, D.; Pradervand, S.; et al. Intratumoral Tcf1+ PD-1+ CD8+ T Cells with Stem-Like Properties Promote Tumor Control in Response to Vaccination and Checkpoint Blockade Immunotherapy. Immunity 2019, 50, 195–211.e10. [Google Scholar] [CrossRef]
  23. Fisicaro, P.; Valdatta, C.; Massari, M.; Loggi, E.; Biasini, E.; Sacchelli, L.; Cavallo, M.C.; Silini, E.M.; Andreone, P.; Missale, G.; et al. Antiviral Intrahepatic T-Cell Responses can be Restored by Blocking Programmed Death-1 Pathway in Chronic Hepatitis B. Gastroenterology 2010, 138, 682–693. [Google Scholar] [CrossRef]
  24. Urbani, S.; Amadei, B.; Tola, D.; Pedrazzi, G.; Sacchelli, L.; Cavallo, M.C.; Orlandini, A.; Missale, G.; Ferrari, C. Restoration of HCV-Specific T Cell Functions by PD-1/PD-L1 Blockade in HCV Infection: Effect of Viremia Levels and Antiviral Treatment. J. Hepatol. 2008, 48, 548–558. [Google Scholar] [CrossRef]
  25. de Miguel, M.; Calvo, E. Clinical Challenges of Immune Checkpoint Inhibitors. Cancer Cell 2020, 38, 326–333. [Google Scholar] [CrossRef]
  26. Robert, C. A Decade of Immune-Checkpoint Inhibitors in Cancer Therapy. Nat. Commun. 2020, 11, 3801. [Google Scholar] [CrossRef]
  27. Buggert, M.; Tauriainen, J.; Yamamoto, T.; Frederiksen, J.; Ivarsson, M.A.; Michaelsson, J.; Lund, O.; Hejdeman, B.; Jansson, M.; Sonnerborg, A.; et al. T-Bet and Eomes are Differentially Linked to the Exhausted Phenotype of CD8+ T Cells in HIV Infection. PLoS Pathog. 2014, 10, e1004251. [Google Scholar] [CrossRef]
  28. Im, S.J.; Hashimoto, M.; Gerner, M.Y.; Lee, J.; Kissick, H.T.; Burger, M.C.; Shan, Q.; Hale, J.S.; Lee, J.; Nasti, T.H.; et al. Defining CD8+ T Cells that Provide the Proliferative Burst After PD-1 Therapy. Nature 2016, 537, 417–421. [Google Scholar] [CrossRef]
  29. Snell, L.M.; MacLeod, B.L.; Law, J.C.; Osokine, I.; Elsaesser, H.J.; Hezaveh, K.; Dickson, R.J.; Gavin, M.A.; Guidos, C.J.; McGaha, T.L.; et al. CD8+ T Cell Priming in Established Chronic Viral Infection Preferentially Directs Differentiation of Memory-Like Cells for Sustained Immunity. Immunity 2018, 49, 678–694.e5. [Google Scholar] [CrossRef]
  30. Velu, V.; Titanji, K.; Zhu, B.; Husain, S.; Pladevega, A.; Lai, L.; Vanderford, T.H.; Chennareddi, L.; Silvestri, G.; Freeman, G.J.; et al. Enhancing SIV-Specific Immunity in Vivo by PD-1 Blockade. Nature 2009, 458, 206–210. [Google Scholar] [CrossRef]
  31. Sandu, I.; Cerletti, D.; Claassen, M.; Oxenius, A. Exhausted CD8+ T Cells Exhibit Low and Strongly Inhibited TCR Signaling during Chronic LCMV Infection. Nat. Commun. 2020, 11, 4454. [Google Scholar] [CrossRef]
  32. Colombetti, S.; Basso, V.; Mueller, D.L.; Mondino, A. Prolonged TCR/CD28 Engagement Drives IL-2-Independent T Cell Clonal Expansion through Signaling Mediated by the Mammalian Target of Rapamycin. J. Immunol. 2006, 176, 2730–2738. [Google Scholar] [CrossRef]
  33. Hofmann, M.; Radsak, M.; Rechtsteiner, G.; Wiemann, K.; Gunder, M.; Bien-Grater, U.; Offringa, R.; Toes, R.E.M.; Rammensee, H.; Schild, H. T Cell Avidity Determines the Level of CTL Activation. Eur. J. Immunol. 2004, 34, 1798–1806. [Google Scholar] [CrossRef]
  34. La Gruta, N.L.; Turner, S.J.; Doherty, P.C. Hierarchies in Cytokine Expression Profiles for Acute and Resolving Influenza Virus-Specific CD8+ T Cell Responses: Correlation of Cytokine Profile and TCR Avidity. J. Immunol. 2004, 172, 5553–5560. [Google Scholar] [CrossRef]
  35. Zhong, S.; Malecek, K.; Johnson, L.A.; Yu, Z.; Vega-Saenz de Miera, E.; Darvishian, F.; McGary, K.; Huang, K.; Boyer, J.; Corse, E.; et al. T-Cell Receptor Affinity and Avidity Defines Antitumor Response and Autoimmunity in T-Cell Immunotherapy. Proc. Natl. Acad. Sci. USA 2013, 110, 6973–6978. [Google Scholar] [CrossRef]
  36. Ploquin, M.J.; Eksmond, U.; Kassiotis, G. B Cells and TCR Avidity Determine Distinct Functions of CD4+ T Cells in Retroviral Infection. J. Immunol. 2011, 187, 3321–3330. [Google Scholar] [CrossRef]
  37. Cukalac, T.; Chadderton, J.; Zeng, W.; Cullen, J.G.; Kan, W.T.; Doherty, P.C.; Jackson, D.C.; Turner, S.J.; La Gruta, N.L. The Influenza Virus-Specific CTL Immunodominance Hierarchy in Mice is Determined by the Relative Frequency of High-Avidity T Cells. J. Immunol. 2014, 192, 4061–4068. [Google Scholar] [CrossRef]
  38. Tian, S.; Maile, R.; Collins, E.J.; Frelinger, J.A. CD8+ T Cell Activation is Governed by TCR-Peptide/MHC Affinity, Not Dissociation Rate. J. Immunol. 2007, 179, 2952–2960. [Google Scholar] [CrossRef]
  39. Nauerth, M.; Weissbrich, B.; Knall, R.; Franz, T.; Dossinger, G.; Bet, J.; Paszkiewicz, P.J.; Pfeifer, L.; Bunse, M.; Uckert, W.; et al. TCR-Ligand Koff Rate Correlates with the Protective Capacity of Antigen-Specific CD8+ T Cells for Adoptive Transfer. Sci. Transl. Med. 2013, 5, 192ra87. [Google Scholar] [CrossRef]
  40. Sandu, I.; Cerletti, D.; Oetiker, N.; Borsa, M.; Wagen, F.; Spadafora, I.; Welten, S.P.M.; Stolz, U.; Oxenius, A.; Claassen, M. Landscape of Exhausted Virus-Specific CD8 T Cells in Chronic LCMV Infection. Cell. Rep. 2020, 32, 108078. [Google Scholar] [CrossRef]
  41. Yermanos, A.; Sandu, I.; Pedrioli, A.; Borsa, M.; Wagen, F.; Oetiker, N.; Welten, S.P.M.; Pallmer, K.; Reddy, S.T.; Oxenius, A. Profiling Virus-Specific Tcf1+ T Cell Repertoires during Acute and Chronic Viral Infection. Front. Immunol. 2020, 11, 986. [Google Scholar] [CrossRef]
  42. Kotturi, M.F.; Scott, I.; Wolfe, T.; Peters, B.; Sidney, J.; Cheroutre, H.; von Herrath, M.G.; Buchmeier, M.J.; Grey, H.; Sette, A. Naive Precursor Frequencies and MHC Binding rather than the Degree of Epitope Diversity Shape CD8+ T Cell Immunodominance. J. Immunol. 2008, 181, 2124–2133. [Google Scholar] [CrossRef]
  43. Turner, S.J.; Kedzierska, K.; Komodromou, H.; La Gruta, N.L.; Dunstone, M.A.; Webb, A.I.; Webby, R.; Walden, H.; Xie, W.; McCluskey, J.; et al. Lack of Prominent Peptide-Major Histocompatibility Complex Features Limits Repertoire Diversity in Virus-Specific CD8+ T Cell Populations. Nat. Immunol. 2005, 6, 382–389. [Google Scholar] [CrossRef]
  44. Cornberg, M.; Chen, A.T.; Wilkinson, L.A.; Brehm, M.A.; Kim, S.K.; Calcagno, C.; Ghersi, D.; Puzone, R.; Celada, F.; Welsh, R.M.; et al. Narrowed TCR Repertoire and Viral Escape as a Consequence of Heterologous Immunity. J. Clin. Investig. 2006, 116, 1443–1456. [Google Scholar] [CrossRef]
  45. Yager, E.J.; Ahmed, M.; Lanzer, K.; Randall, T.D.; Woodland, D.L.; Blackman, M.A. Age-Associated Decline in T Cell Repertoire Diversity Leads to Holes in the Repertoire and Impaired Immunity to Influenza Virus. J. Exp. Med. 2008, 205, 711–723. [Google Scholar] [CrossRef]
  46. Klein, S.; Ghersi, D.; Manns, M.P.; Prinz, I.; Cornberg, M.; Kraft, A.R.M. PD-L1 Checkpoint Inhibition Narrows the Antigen-Specific T Cell Receptor Repertoire in Chronic LCMV Infection. J. Virol. 2020, 94, e00795-20. [Google Scholar] [CrossRef]
  47. Chang, Y.M.; Wieland, A.; Li, Z.; Im, S.J.; McGuire, D.J.; Kissick, H.T.; Antia, R.; Ahmed, R. T Cell Receptor Diversity and Lineage Relationship between Virus-Specific CD8 T Cell Subsets during Chronic Lymphocytic Choriomeningitis Virus Infection. J. Virol. 2020, 94, e00935-20. [Google Scholar] [CrossRef]
  48. Wherry, E.J.; Ahmed, R. Memory CD8 T-Cell Differentiation during Viral Infection. J. Virol. 2004, 78, 5535–5545. [Google Scholar] [CrossRef]
  49. Zehn, D.; Wherry, E.J. Immune Memory and Exhaustion: Clinically Relevant Lessons from the LCMV Model. Adv. Exp. Med. Biol. 2015, 850, 137–152. [Google Scholar]
  50. Mischke, J.; Klein, S.; Seamann, A.; Prinz, I.; Selin, L.; Ghersi, D.; Cornberg, M.; Kraft, A.R.M. Cross-Reactive T Cell Response Exists in Chronic Lymphocytic Choriomeningitis Virus Infection upon Pichinde Virus Challenge. Viruses 2022, 14, 2293. [Google Scholar] [CrossRef]
  51. Chen, S.; Zhou, Y.; Chen, Y.; Gu, J. Fastp: An Ultra-Fast all-in-One FASTQ Preprocessor. Bioinformatics 2018, 34, i884–i890. [Google Scholar] [CrossRef]
  52. Bolotin, D.A.; Poslavsky, S.; Mitrophanov, I.; Shugay, M.; Mamedov, I.Z.; Putintseva, E.V.; Chudakov, D.M. MiXCR: Software for Comprehensive Adaptive Immunity Profiling. Nat. Methods 2015, 12, 380–381. [Google Scholar] [CrossRef]
  53. Warren, R.L.; Freeman, J.D.; Zeng, T.; Choe, G.; Munro, S.; Moore, R.; Webb, J.R.; Holt, R.A. Exhaustive T-Cell Repertoire Sequencing of Human Peripheral Blood Samples Reveals Signatures of Antigen Selection and a Directly Measured Repertoire Size of at Least 1 Million Clonotypes. Genome Res. 2011, 21, 790–797. [Google Scholar] [CrossRef]
  54. Shugay, M.; Bagaev, D.V.; Turchaninova, M.A.; Bolotin, D.A.; Britanova, O.V.; Putintseva, E.V.; Pogorelyy, M.V.; Nazarov, V.I.; Zvyagin, I.V.; Kirgizova, V.I.; et al. VDJtools: Unifying Post-Analysis of T Cell Receptor Repertoires. PLoS Comput. Biol. 2015, 11, e1004503. [Google Scholar] [CrossRef]
  55. Welsh, R.M.; Seedhom, M.O. Lymphocytic Choriomeningitis Virus (LCMV): Propagation, Quantitation, and Storage. Curr. Protoc. Microbiol. 2008, 8, 15A.1.1–15A.1.11. [Google Scholar] [CrossRef]
  56. Bunztman, A.; Vincent, B.G.; Krovi, H.; Steele, S.; Frelinger, J.A. The LCMV gp33-Specific Memory T Cell Repertoire Narrows with Age. Immun. Ageing 2012, 9, 17. [Google Scholar] [CrossRef]
  57. Schurich, A.; Pallett, L.J.; Lubowiecki, M.; Singh, H.D.; Gill, U.S.; Kennedy, P.T.; Nastouli, E.; Tanwar, S.; Rosenberg, W.; Maini, M.K. The Third Signal Cytokine IL-12 Rescues the Anti-Viral Function of Exhausted HBV-Specific CD8 T Cells. PLoS Pathog. 2013, 9, e1003208. [Google Scholar] [CrossRef]
  58. Grusdat, M.; McIlwain, D.R.; Xu, H.C.; Pozdeev, V.I.; Knievel, J.; Crome, S.Q.; Robert-Tissot, C.; Dress, R.J.; Pandyra, A.A.; Speiser, D.E.; et al. IRF4 and BATF are Critical for CD8+ T-Cell Function Following Infection with LCMV. Cell Death Differ. 2014, 21, 1050–1060. [Google Scholar] [CrossRef]
  59. Schuch, A.; Alizei, E.S.; Heim, K.; Wieland, D.; Kiraithe, M.M.; Kemming, J.; Llewellyn-Lacey, S.; Sogukpinar, Ö.; Ni, Y.; Urban, S.; et al. Phenotypic and Functional Differences of HBV Core-Specific Versus HBV Polymerase-Specific CD8+ T Cells in Chronically HBV-Infected Patients with Low Viral Load. Gut 2019, 68, 905–915. [Google Scholar] [CrossRef]
  60. Egui, A.; Lopez, M.C.; Gomez, I.; Simon, M.; Segovia, M.; Thomas, M.C. Differential Phenotypic and Functional Profile of Epitope-Specific Cytotoxic CD8+ T Cells in Benznidazole-Treated Chronic Asymptomatic Chagas Disease Patients. Biochim. Biophys. Acta Mol. Basis Dis. 2020, 1866, 165629. [Google Scholar] [CrossRef]
  61. Aliabadi, E.; Urbanek-Quaing, M.; Maasoumy, B.; Bremer, B.; Grasshoff, M.; Li, Y.; Niehaus, C.E.; Wedemeyer, H.; Kraft, A.R.M.; Cornberg, M. Impact of HBsAg and HBcrAg Levels on Phenotype and Function of HBV-Specific T Cells in Patients with Chronic Hepatitis B Virus Infection. Gut 2022, 71, 2300–2312. [Google Scholar] [CrossRef]
  62. Kuhn, R.; Sandu, I.; Agrafiotis, A.; Hong, K.; Shlesinger, D.; Neimeier, D.; Merkler, D.; Oxenius, A.; Reddy, S.T.; Yermanos, A. Clonally Expanded Virus-Specific CD8 T Cells Acquire Diverse Transcriptional Phenotypes during Acute, Chronic, and Latent Infections. Front. Immunol. 2022, 13, 782441. [Google Scholar] [CrossRef] [PubMed]
  63. Fuller, M.J.; Khanolkar, A.; Tebo, A.E.; Zajac, A.J. Maintenance, Loss, and Resurgence of T Cell Responses during Acute, Protracted, and Chronic Viral Infections. J. Immunol. 2004, 172, 4204–4214. [Google Scholar] [CrossRef]
  64. Tikochinski, Y.; Elias, D.; Steeg, C.; Marcus, H.; Kantorowitz, M.; Reshef, T.; Ablamunits, V.; Cohen, I.R.; Friedmann, A. A Shared TCR CDR3 Sequence in NOD Mouse Autoimmune Diabetes. Int. Immunol. 1999, 11, 951–956. [Google Scholar] [CrossRef] [PubMed]
  65. Madi, A.; Shifrut, E.; Reich-Zeliger, S.; Gal, H.; Best, K.; Ndifon, W.; Chain, B.; Cohen, I.R.; Friedman, N. T-Cell Receptor Repertoires Share a Restricted Set of Public and Abundant CDR3 Sequences that are Associated with Self-Related Immunity. Genome Res. 2014, 24, 1603–1612. [Google Scholar] [CrossRef] [PubMed]
  66. Wolpert, E.Z.; Grufman, P.; Sandberg, J.K.; Tegnesjo, A.; Karre, K. Immunodominance in the CTL Response Against Minor Histocompatibility Antigens: Interference between Responding T Cells, rather than with Presentation of Epitopes. J. Immunol. 1998, 161, 4499–4505. [Google Scholar] [CrossRef] [PubMed]
  67. Sandberg, J.K.; Grufman, P.; Wolpert, E.Z.; Franksson, L.; Chambers, B.J.; Karre, K. Superdominance among Immunodominant H-2Kb-Restricted Epitopes and Reversal by Dendritic Cell-Mediated Antigen Delivery. J. Immunol. 1998, 160, 3163–3169. [Google Scholar] [CrossRef] [PubMed]
  68. Butz, E.A.; Bevan, M.J. Massive Expansion of Antigen-Specific CD8+ T Cells during an Acute Virus Infection. Immunity 1998, 8, 167–175. [Google Scholar] [CrossRef]
  69. Smith, A.L.; Wikstrom, M.E.; Fazekas de St Groth, B. Visualizing T Cell Competition for Peptide/MHC Complexes: A Specific Mechanism to Minimize the Effect of Precursor Frequency. Immunity 2000, 13, 783–794. [Google Scholar] [CrossRef]
  70. Gane, E.; Verdon, D.J.; Brooks, A.E.; Gaggar, A.; Nguyen, A.H.; Subramanian, G.M.; Schwabe, C.; Dunbar, P.R. Anti-PD-1 Blockade with Nivolumab with and without Therapeutic Vaccination for Virally Suppressed Chronic Hepatitis B: A Pilot Study. J. Hepatol. 2019, 71, 900–907. [Google Scholar] [CrossRef]
  71. Li, H.; van der Merwe, P.A.; Sivakumar, S. Biomarkers of Response to PD-1 Pathway Blockade. Br. J. Cancer 2022, 126, 1663–1675. [Google Scholar] [CrossRef]
  72. Abdel-Hakeem, M.S.; Manne, S.; Beltra, J.; Stelekati, E.; Chen, Z.; Nzingha, K.; Ali, M.; Johnson, J.L.; Giles, J.R.; Mathew, D.; et al. Epigenetic Scarring of Exhausted T Cells Hinders Memory Differentiation upon Eliminating Chronic Antigenic Stimulation. Nat. Immunol. 2021, 22, 1008–1019. [Google Scholar] [CrossRef] [PubMed]
  73. Dahling, S.; Mansilla, A.M.; Knopper, K.; Grafen, A.; Utzschneider, D.T.; Ugur, M.; Whitney, P.G.; Bachem, A.; Arampatzi, P.; Imdahl, F.; et al. Type 1 Conventional Dendritic Cells Maintain and Guide the Differentiation of Precursors of Exhausted T Cells in Distinct Cellular Niches. Immunity 2022, 55, 656–670.e8. [Google Scholar] [CrossRef]
  74. Hashimoto, M.; Araki, K.; Cardenas, M.A.; Li, P.; Jadhav, R.R.; Kissick, H.T.; Hudson, W.H.; McGuire, D.J.; Obeng, R.C.; Wieland, A.; et al. PD-1 Combination Therapy with IL-2 Modifies CD8+ T Cell Exhaustion Program. Nature 2022, 610, 173–181. [Google Scholar] [CrossRef]
  75. Madden, D.R.; Garboczi, D.N.; Wiley, D.C. The Antigenic Identity of Peptide-MHC Complexes: A Comparison of the Conformations of Five Viral Peptides Presented by HLA-A2. Cell 1993, 75, 693–708. [Google Scholar] [CrossRef]
  76. Antunes, D.A.; Vieira, G.F.; Rigo, M.M.; Cibulski, S.P.; Sinigaglia, M.; Chies, J.A.B. Structural Allele-Specific Patterns Adopted by Epitopes in the MHC-I Cleft and Reconstruction of MHC:Peptide Complexes to Cross-Reactivity Assessment. PLoS ONE 2010, 5, e10353. [Google Scholar] [CrossRef] [PubMed]
  77. Achour, A.; Michaelsson, J.; Harris, R.A.; Odeberg, J.; Grufman, P.; Sandberg, J.K.; Levitsky, V.; Karre, K.; Sandalova, T.; Schneider, G. A Structural Basis for LCMV Immune Evasion: Subversion of H-2D(B) and H-2K(B) Presentation of gp33 Revealed by Comparative Crystal Structure Analyses. Immunity 2002, 17, 757–768. [Google Scholar] [CrossRef]
  78. Cerletti, D.; Sandu, I.; Gupta, R.; Oxenius, A.; Claassen, M. Fate Trajectories of CD8+ T Cells in Chronic LCMV Infection. bioRxiv 2020. [Google Scholar] [CrossRef]
  79. Brandle, D.; Brduscha-Riem, K.; Hayday, A.C.; Owen, M.J.; Hengartner, H.; Pircher, H. T Cell Development and Repertoire of Mice Expressing a Single T Cell Receptor Alpha Chain. Eur. J. Immunol. 1995, 25, 2650–2655. [Google Scholar] [CrossRef]
  80. Yang, L.; Jama, B.; Wang, H.; Labarta-Bajo, L.; Zuniga, E.I.; Morris, G.P. TCRalpha Reporter Mice Reveal Contribution of Dual TCRalpha Expression to T Cell Repertoire and Function. Proc. Natl. Acad. Sci. USA 2020, 117, 32574–32583. [Google Scholar] [CrossRef]
Figure 1. LCMV epitope-specific T cell response alterations were detectable in chronic-LCMV-infected mice. (A) Representative plots from one individual mouse showing the frequency of epitope-specific IFNγ+CD8+CD44+ T cells and (B) epitope-specific Dextramer+CD8+CD44+ T cells on day 36 post LCMVcl13 infection. (C) The frequency of epitope-specific IFNγ+CD8+CD44+ T cells (n = 41–48) and Dextramer+CD8+CD44+ T cells (n = 31–42) is shown. Graphs depict means with standard error of the means (SEM). (D) The x-fold decrease in T cell responses from LCMV-immune (n = 19–27) to chronically LCMV-infected mice was calculated. Colors represent a range from weak reduction (light yellow) to strong reduction (red). Significance levels were determined by individual statistical comparison between the respective immune and chronic groups and are depicted directly next to the x-fold decrease. Significance levels are depicted with *** p < 0.001, **** p < 0.0001, representative of 9 experiments.
Pathogens 12 00716 g001
Figure 2. Epitope-specific differences in exhaustion translated to a different TCR repertoire. (A) The number of epitope-specific clonotypes from all Dextramer+CD8+CD44+ T cells and the diversity index of epitope-specific clonotypes is depicted day 36 post LCMVcl13 infection. Graphs depict means with standard error of the means (SEM). (B) The x-fold decreases in the T cell responses from LCMV-immune to chronically LCMV-infected mice were calculated. Colors represent the range from weak reduction (light yellow) to strong reduction (red). Significance levels were determined by individual statistical comparison between the respective immune and chronic groups and are depicted directly next to the x-fold decrease. Significance levels are depicted with * p < 0.05, ** p < 0.01, n = 7–18, representative of 3–5 experiments.
Pathogens 12 00716 g002
Figure 3. Vβ and Jβ usages were distinctly different between the analyzed epitope-specific responses. (A) Vβ-chain and (B) Jβ-chain usage is shown for TCRβ clonotypes of all CD8+ T cells (grey bars; all mice) and the three epitope-specific CD8+CD44+ T cell responses against NP396, GP33 and NP205 in chronically LCMV-infected (black bars) and immune mice (white bars). Graphs depict means with SEM, red labels indicate predominant usage within the respective epitope-specific response. Significance levels were depicted with ** p < 0.01 and *** p < 0.001, n = 6–18, representative of 3–5 experiments.
Pathogens 12 00716 g003
Figure 4. TCRβ CDR3 length revealed minimally different distributions between the epitope-specific responses. CDR3 length distribution from all TCRβ clonotypes is depicted for NP396-, GP33- and NP205-specific CD8+CD44+ T cells in chronically LCMV-infected (black bars) and immune mice (white bars). Graphs depict means with SEM, significance levels are shown with * p < 0.05 and ** p < 0.01, n = 6–18, representative of 3–5 experiments.
Pathogens 12 00716 g004
Figure 5. NP205-specific T cell responses showed a public Vβ3-‘LGGN’-Jβ2.5 pattern for clonotype selection. The relative frequency of (A) the most dominant Vβ3-Jβ2.5 combination and (B) the specific ‘LGGN’-clonotype in response to NP205 is depicted in chronically LCMV-infected (black bars) and immune mice (white bars) with means and SEM, significance levels are * p < 0.05, ** p < 0.01, n = 7–11, representative of 3 experiments.
Pathogens 12 00716 g005
Figure 6. Individual shaping of the epitope-specific T cell responses by checkpoint inhibitor αPD-L1 treatment. (A) Viral titers were determined in the kidney at day 36 after LCMVcl13 infection (n = 23–45). (B,C) LCMV NP396-, GP33- and NP205-specific CD8+CD44+ T cell responses were measured by Dextramer and IFNγ staining (n = 33–45). (D) The number of NP396-, GP33- and NP205-specific TCRβ clonotypes and (E) the resulting diversity (calculated of the repertoire with the Shannon–Wiener Index) was determined by sequencing (n = 6–18). Graph depicts means with SEM, significance levels with * p < 0.05, ** p < 0.01, *** p < 0.001, **** p < 0.0001, representative of 3–5 experiments.
Pathogens 12 00716 g006
Figure 7. Modeling of peptide–MHC complexes revealed different binding properties and electrostatic potential. (A) UCSF ChimeraX-based visualization of X-ray crystallographic protein structures. MHCs H-2Db (NP396 and GP33) and H-2Kb (NP205) are depicted in grey, respective peptides in green, anchor molecules in light brown. Hydrogen bonds are depicted in red, salt bridges in blue. (B) Electrostatic potential is depicted on a bubble structure by UCSF ChimeraX. Visualizing the peptide centrally within the binding groove of the MHC molecule. Red is negatively charged, blue is positive and white is neutral.
Pathogens 12 00716 g007
Disclaimer/Publisher’s Note: The statements, opinions and data contained in all publications are solely those of the individual author(s) and contributor(s) and not of MDPI and/or the editor(s). MDPI and/or the editor(s) disclaim responsibility for any injury to people or property resulting from any ideas, methods, instructions or products referred to in the content.

