1. Introduction
Global seafood production has been increasing dramatically during the last three decades [
1,
2]. Approximately 88% of this production was directly consumed by humans [
1]. China is the leading seafood producer (38.5% of global production) and is the foremost consumer worldwide [
3]. The U.S. is rated as the second largest consumer of seafood based on the United Nations Food and Agriculture Organization (FAO) consumption statistics from 2011 to 2013 [
3]. Shrimp, canned tuna, salmon, tilapia, Alaska pollock, pangasius, crab, cod, catfish and clams were the top ten and most favored seafood products consumed in the U.S. in 2016 [
4]. Ninety seven percent of the fish and shellfish are imported from overseas [
5,
6]. Nearly 50% of U.S. seafood imports were produced by aquaculture. Frozen seafood accounts for approximately 75% of the gross imports. Increased consumption and importation of seafood raise concerns over its safety [
4,
7].
The U.S. Centers for Disease Control and Prevention (CDC) reported that 53% of the seafood multistate outbreaks in 2014–2015 were caused by bacteria, 37% from viruses, 0.9% from parasites and 7% from chemical contaminants [
8,
9]. Iwamoto et al. [
10] reported that bacteria caused 76% of the seafood outbreaks, 21% by viruses and approximately 3% by parasites. Lipp and Rose [
11] reported that a third of foodborne outbreaks had seafood as the main etiologic vehicle.
Pathogenic
Vibrio spp.,
Vibrio cholerae, Vibrio parahaemolyticus and
Vibrio vulnificus cause outbreaks and sporadic illnesses usually associated with the consumption of raw or undercooked seafood [
10,
12,
13].
Salmonella is the second most common causative bacterial agent of illnesses in the U.S. food supply and frequently implicated in multistate outbreaks [
8,
9,
10,
13,
14,
15,
16]. Seafood-associated illnesses have led authorities to implement a zero-tolerance level for
Salmonella.
Campylobacter jejuni and
Campylobacter coli are the leading cause of bacterial gastrointestinal infections in humans. Fish and shellfish are incriminated as an etiological food that may transmit
C. jejuni to humans, which causes gastroenteritis [
17]. Recently reported seafood-associated outbreaks have heightened concerns for these pathogens [
18]. Currently, other than results of inspections reported by USFDA, adequate data on the prevalence of foodborne pathogens in domestic and imported seafood are not available. The objective of this study was to survey the prevalence and abundance of bacterial indicators,
V. parahaemolyticus,
V. vulnificus,
Salmonella and Campylobacter, in imported and domestic seafood obtained at retail stores on the Eastern Shore of Maryland.
2. Materials and Methods
2.1. Collection of Samples
A total of 440 frozen domestic and imported seafood samples (shrimp (whole), catfish (fillet) and tilapia (fillet)) were aseptically and randomly collected at monthly intervals from four retail stores on the Delmarva Peninsula on the Eastern Shore of Maryland from August 2012 to July 2013. The stores from which samples were collected were labeled as A, B, C and D, respectively. On each sampling day, up to 13 samples of each seafood type were collected from the four stores, depending on the availability. The type of seafood, country of origin and production date were also recorded during collection. The random collection of samples did not consider the duration and conditions of storage as well as the handling and transportation conditions due to the privacy of each store. All imported tilapia (n = 84) were from China while all imported catfish (n = 60) were from Vietnam. Imported shrimp originated from India (n = 20), Indonesia (n = 33) and Thailand (n = 29).
Samples collected frozen included shrimp (n = 142), catfish (n = 142) and tilapia (n = 156). Each sample weighed 500 g. After collection, all samples were placed in an ice chest with ice packs and a data logger (ACR Systems, Inc., Surrey, Canada) and transported directly to the Food Microbiology and Safety Laboratory at the University of Maryland Eastern Shore for analysis. All samples remained frozen during transport and all analyses were performed within four hours of collection.
2.2. Preparation of Samples
Upon arrival at the laboratory, samples were prepared according to Andrew et al. [
19]. All samples were defrosted and aseptically cut into smaller pieces, placed in a plastic bag and hand massaged for homogenization. A homogenate was made from 500 g of sample, 200 g were saved for other experiments and, from the remaining portion, 25 g of each sample of catfish and tilapia and 50 g of shrimp were weighed and placed in a plastic bag containing 225 mL for catfish and tilapia and 450 mL for shrimp of buffered peptone water (Becton Dickinson Diagnostic Systems, Sparks, MD, USA) as per Andrews et al. [
19]. The contents were massaged and stomached for 5 min and 20 mL of the rinse fluid was transferred to individual 50 mL screw-cap tubes including a portion of the sample (<10%) for subsequent microbiological analysis. The remaining samples were stored at −20 °C for quantitative experiments.
2.3. Aerobic Plate Count—APC and Coliforms/Escherichia coli Counts
Samples were analyzed for aerobic plate count (APC), total coliforms and
E. coli. The 3M total colony count Petri-films were used according to manufacturer instructions (Carolina Biological Supply Company, New York, NY, USA). One milliliter of the sample was inoculated on each Petri-film and incubated at 35 °C for 24 h. After incubation, colonies that appeared as pinkish red on Petri-films were counted and enumerated as CFU/g. The APC is indicative of the general quality as well as of the quality of handling and storage procedures [
10].
The 3M total coliforms/
E. coli Petri-films were used according to manufacturer instructions (Carolina Biological Supply Company, New York, NY, USA). One milliliter of the sample was inoculated on each Petri-film and incubated at 37 °C for 24 h. Red colonies with or without gas production and blue to red-blue colonies associated with gas bubbles were considered as coliforms and
E. coli, respectively. These colonies were counted and expressed as log CFU/g of sample. The existence of coliforms and/or
E. coli in marine food products is evidence of contamination from a terrigenous source [
10].
2.4. Total Vibrio, V. parahaemolyticus and V. vulnificus
Total
Vibrio and
Vibrio species were isolated using a method described by Kaysner et al. [
20]. Briefly, 25 g of the catfish or tilapia samples and 50 g of shrimp samples were added to 225 and 450 mL of alkaline peptone water (Becton Dickinson Diagnostic Systems, Sparks, MD, USA), respectively, stomached for 2 min and incubated at 35 °C for 24 h. The alkaline peptone water cultures were streaked onto thiosulfate citrate bile salts sucrose (TCBS) agar and modified cellobiose-polymyxin β-colistin agar (mCPC) (Becton Dickinson Diagnostic Systems, Sparks, MD, USA) plates for the isolation of
V. parahaemolyticus and
V. vulnificus, respectively. The plates were incubated at 35 °C for 24 h for TCBS agar and 40 °C for 24 h for mCPC agar. Five presumptive
Vibrio colonies (green or bluish-green, round and 2 to 4 mm in diameter for
V. parahaemolyticus on TCBS and flat yellow, fried-egg shape and 1 to 2 mm in diameter for
V. vulnificus on mCPC) were picked for confirmation using BAX-real time PCR assay according to the manufacturer’s instructions (Qualicon Diagnostic, Camarillo, CA, USA). Total
Vibrio levels were calculated by adding green and yellow colonies on TCBS plates.
2.5. Salmonella
Salmonella was isolated following a previous method [
19] with some modifications. In brief, aseptically, 25 g of each catfish and tilapia sample and 50 g of each shrimp sample were added to 225 mL and 450 mL of sterile lactose broth (Becton Dickinson Diagnostic Systems, Sparks, MD, USA), respectively, stomached for 2 min and incubated for 24 ± 2 h at 35 °C. For the second enrichment, 10 mL of Rappaport-Vassiliadis broth (RV) (Becton Dickinson Diagnostic Systems, Sparks, MD, USA) was inoculated with 1 mL of the previously incubated lactose broth mixture and incubated at 35 °C for 24 h. Enriched samples were streaked onto Xylose Lysine Trigitol 4 (XLT4) (Becton Dickinson Diagnostic Systems, Sparks, MD, USA) agar plates. Five colonies with typical
Salmonella phenotypes (black colonies) were confirmed by BAX-PCR assay for
Salmonella. 2.6. Campylobacter jejuni
According to Hunt et al. [
21], aseptically, 25 g of catfish and tilapia and 50 g of shrimp were added to 225 mL and 450 mL of the Bolton enrichment broth (Malthus Diagnostics, North Ridgeville, OH, USA) with lysed horse blood and antibiotic supplement (Malthus Diagnostics, North Ridgeville, OH, USA), respectively. The tightened containers were incubated at 37 °C for 4 h and then at 42 °C for 24 h. All subsequent incubations were conducted at 37 °C under microaerophilic conditions (85% N
2, 10% CO
2 and 5% O
2). The Bolton broth cultures were inoculated onto modified Campy blood-free agar (mCCDA) (Malthus Diagnostics, North Ridgeville, OH, USA) by using a cotton-tipped swab followed by streaking. After 48 h of incubation, five presumptive
Campylobacter colonies (small, grey, moist and flat spreading or drop-like) per sample were confirmed using
C. jejuni/C. coli/C. lari BAX-real time assay according to the manufacturer’s instructions.
2.7. Confirmation of Presumptive V. parahaemolyticus, V. vulnificus, Salmonella and Campylobacter Isolates Using BAX PCR
V. parahaemolyticus and V. vulnificus colonies were confirmed using Vibrio cholerae/parahaemolyticus/vulnificus BAX-real time PCR assay according to the manufacturer’s instructions (Qualicon Diagnostic, Camarillo, CA, USA). In brief, 10 mL of alkaline peptone water (APW) (Becton Dickinson Diagnostic Systems, Sparks, MD, USA) were inoculated with the presumptive V. parahaemolyticus and V. vulnificus isolates and incubated at 37 °C and 40 °C, respectively, for 24 h each. Five microliters of each incubated isolate were added to a 200 µL lysis reagent cluster tube (lysis reagents were prepared by adding 150 µL of protease to 12 mL lysis buffer). Tubes were heated at 37 °C for 20 min and then at 95 °C for 10 min. Tubes were cooled at 2 °C–8 °C for 5 min. Thirty microliters were transferred into each PCR tube and placed in a chilled cooling block. The tubes were placed in the cycler-detector and the samples were automatically run according to the manufacturer’s protocol (Qualicon). Within 1–2 h, the PCR amplified a DNA fragment that is specific to the target. After amplification, the automated system begins a detection phase in which the fluorescent signal is measured. The results were displayed as positive or negative symbols. A positive V. parahaemolyticus or V. vulnificus isolate was indicated by a sigmoid curve with a cycle threshold (Ct) from 20 to 40.
For Salmonella isolates’ confirmation, 10 mL of lactose broth tubes were inoculated with the presumptive Salmonella and incubated at 37 °C for 24–48 h. Lysis, heating, cooling and detection of incubated isolates were performed as described for V. parahaemolyticus and V. vulnificus. A positive Salmonella isolate was indicated by a sigmoid curve with a cycle threshold (Ct) from 20–40.
For confirmation of C. jejuni, in an air-tight tube, 10 mL of double strength Bolton broth with supplement (no blood) were inoculated with the presumptive C. jejuni and incubated micro-aerobically at 42 °C for 24–48 h. Lysis, heating, cooling and detection of incubated isolates were performed as described for V. parahaemolyticus, V. vulnificus and Salmonella. A positive C. jejuni isolate was indicated by a sigmoid curve with a cycle threshold (Ct) from 20 to 40.
The lower limit of detection for qualitative methods are 1 cell/25 g for all pathogens in tilapia and catfish and 1 cell /50 g of all pathogens in shrimp. Confirmed for V. parahaemolyticus and V. vulnificus isolates were stored at −80 °C in trypticase soy broth (TSB) and 1% NaCl with 24% glycerol (Becton Dickinson Diagnostic Systems, Sparks, MD, USA); confirmed Salmonella and Campylobacter isolates were stored at −80 °C in brain heart infusion broth with 24% glycerol (Becton Dickinson Diagnostic Systems, Sparks, MD, USA) for further analysis.
2.8. Most Probable Number (MPN)
Samples that were positive for bacterial pathogens were enumerated using the three tube Most Probable Number (MPN) method as described by Blodgett, [
22]. All samples were analyzed for MPN within 48 h. of collection as the BAX PCR system allowed detection and confirmation of isolates within 20 h. In brief, 10-fold serial dilutions (0.1–0.00001) of each sample were made in Phosphate Buffer Saline (PBS) (Becton Dickinson Diagnostic Systems, Sparks, MD, USA) and 1mL of each dilution was transferred to 3 × 10 mL of alkaline peptone water (APW), 3 × 10 mL of buffered peptone water (BPW) and 3 × 10 mL of Bolton broth for
V. parahaemolyticus and
V. vulnificus,
Salmonella,
C. jejuni, respectively, and incubated at 37 °C for 18–24 h. Secondary enrichment for MPN was only conducted for the enumeration of
Salmonella. Bacterial growth was determined by turbidity, then turbid tubes were streaked onto selective media for each pathogen. After incubation at 37 °C for 24 h, presumptive colonies were picked and confirmed using BAX-PCR as described in previous sections. Based on the presence/absence of confirmed colonies on each plate, MPN/g of sample was calculated using standard U.S. Food and Drug Administration (FDA) procedures and table (
https://www.fda.gov/food/foodscienceresearch/laboratorymethods/ucm109656.htm, accessed on 23 January 2022).
2.9. Serotyping of Salmonella
Salmonella serovars were determined by the USDA’s National Veterinary Services Laboratories (Ames, IA, USA). The
Salmonella somatic O antigen and the flagellar H antigen combination codes were tested against different antisera to subtype the organism [
23]. The
Salmonella somatic O antigen has been determined with corresponding antisera in the Bacterial Identification (BI) section of the Diagnostic Bacteriology and Pathobiology Laboratory (DBPL) at the National Veterinary Services Laboratories (NVSL) [
24]. The flagellar H antigen was determined after the determination of the surface O antigen [
25].
2.10. Data Analysis
Measurement outcomes were evaluated using one-way ANOVAs,
t-tests or Pearson correlation when quantitative, by the Fisher’s exact test when qualitative and by logistic regression when outcomes were both quantitative and qualitative. Aerobic plate counts were converted into log values (log CFU/mL) and sorted by seafood type and country of origin. Based on the APC limits established by the International Commission on Microbiological Specifications for Foods [
21,
26,
27], the percentages of seafood samples that fell into the microbiological quality categories of good (<5 × 10
5 CFU/g), marginally acceptable (5 × 10
5 to 1 × 10
7 CFU/g) and unacceptable (> 1 × 10
7 CFU/g) quality were calculated. Log transformed APC data sorted by seafood type, fresh/frozen status sampling store and sampling date were analyzed by using analysis of variance (SAS for Windows, version 9; SAS Institute NC., Cary, NC, USA). Logistic regression was used to evaluate associations between level of total coliforms (log transformed) and the detection of
Vibrio species,
Salmonella and C. jejuni and, for samples with detected and enumerated levels of one or more pathogens, associations between the level of total coliforms (log transformed) and the log MPN/g for each pathogen were evaluated by Pearson correlation. Due to low prevalence of detectable
E. coli, no correlation analysis was conducted between
E. coli and pathogens. Microbiological qualities data and differences in prevalence for each bacterium were analyzed by Fisher’s exact test. An alpha level of 0.05 was used when determining statistical significance.
4. Discussion
Concerns about seafood microbiological quality and safety in the U.S. have increased due to reported illnesses and outbreaks. To our knowledge, this is the most comprehensive study demonstrating both the prevalence and abundance of major bacterial pathogens and indicators in imported and domestic seafood. Shrimp, catfish and tilapia were chosen for this study because of their popularity and preference among consumers in the USA [
4].
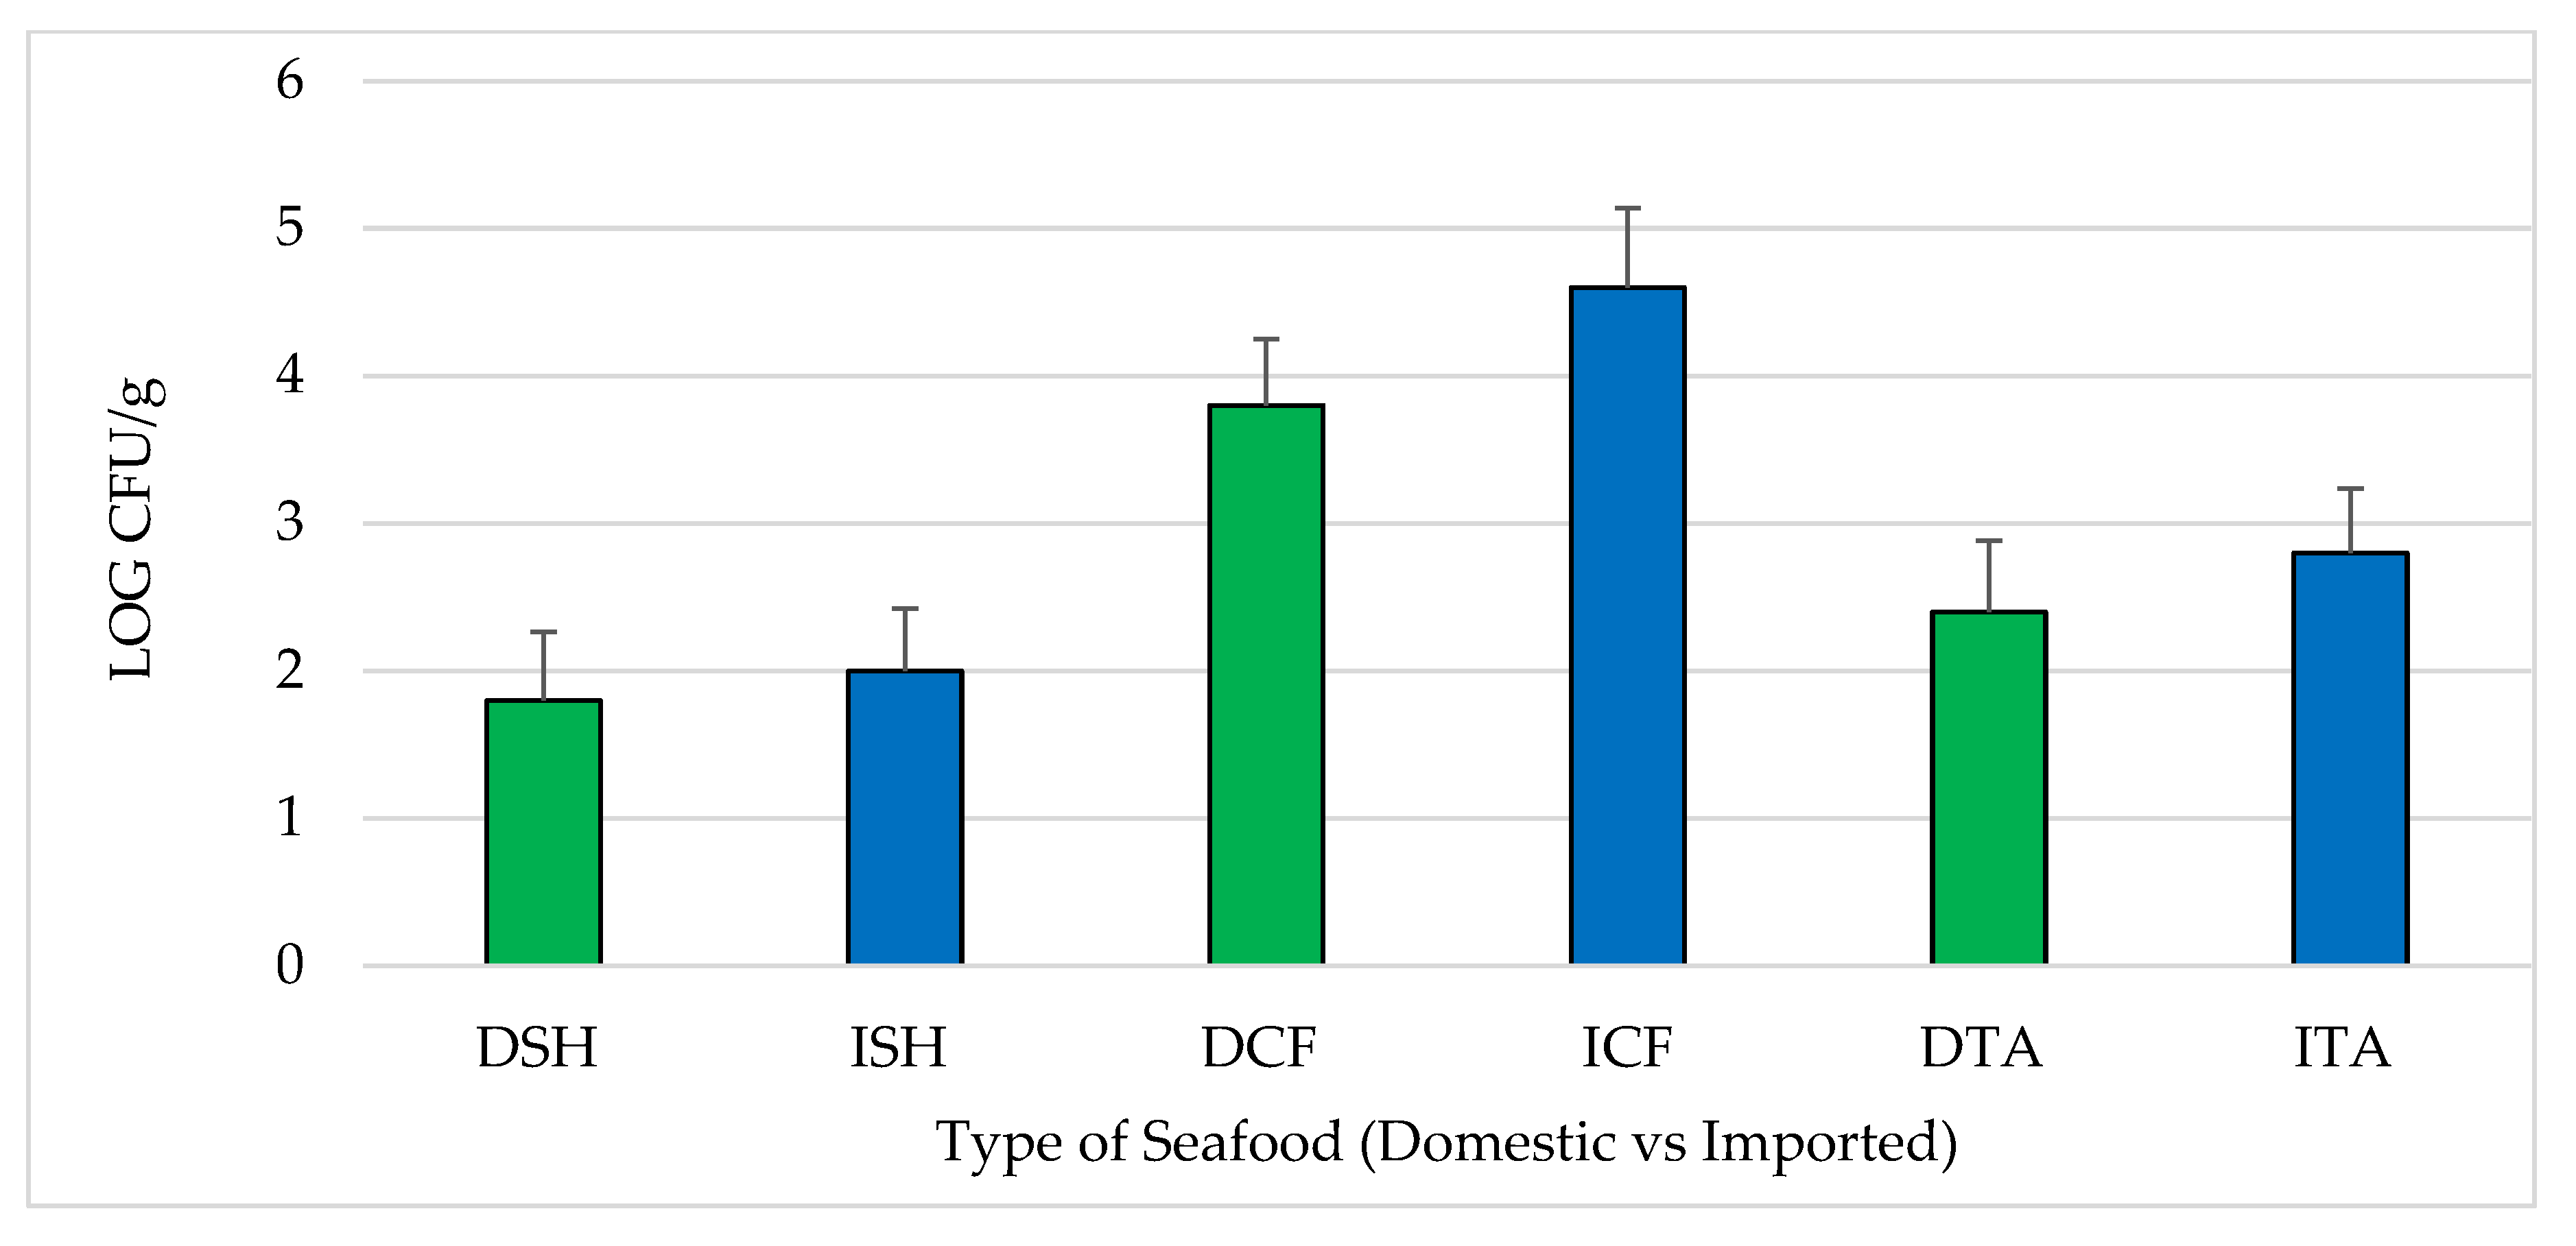
The absence of statistically significant differences in average log CFU/g for APC between domestic and imported seafood suggests equivalent microbial quality and hygienic practices. While the muscle tissue of catfish and tilapia are normally sterile, bacteria that are abundant in the intestines, skin and gills can cross-contaminate fillets during processing. On the other hand, the intestines of unpeeled shrimp remain with the product. APC levels in the current study are considerably lower than reported in most previous studies. APC values previously reported for shrimp ranged from 4.8–7.1 log CFU/g and estimated ranges for microbiologically unacceptable samples were ≤10% [
28,
29,
30,
31] and 13.6% for finfish (catfish, salmon, tilapia and trout) in the USA [
31,
32]. Low APC values observed in the current study relative to previous surveys are likely to reflect hygienic processing practices and/or little time between processing and freezing, which prevents further bacterial growth.
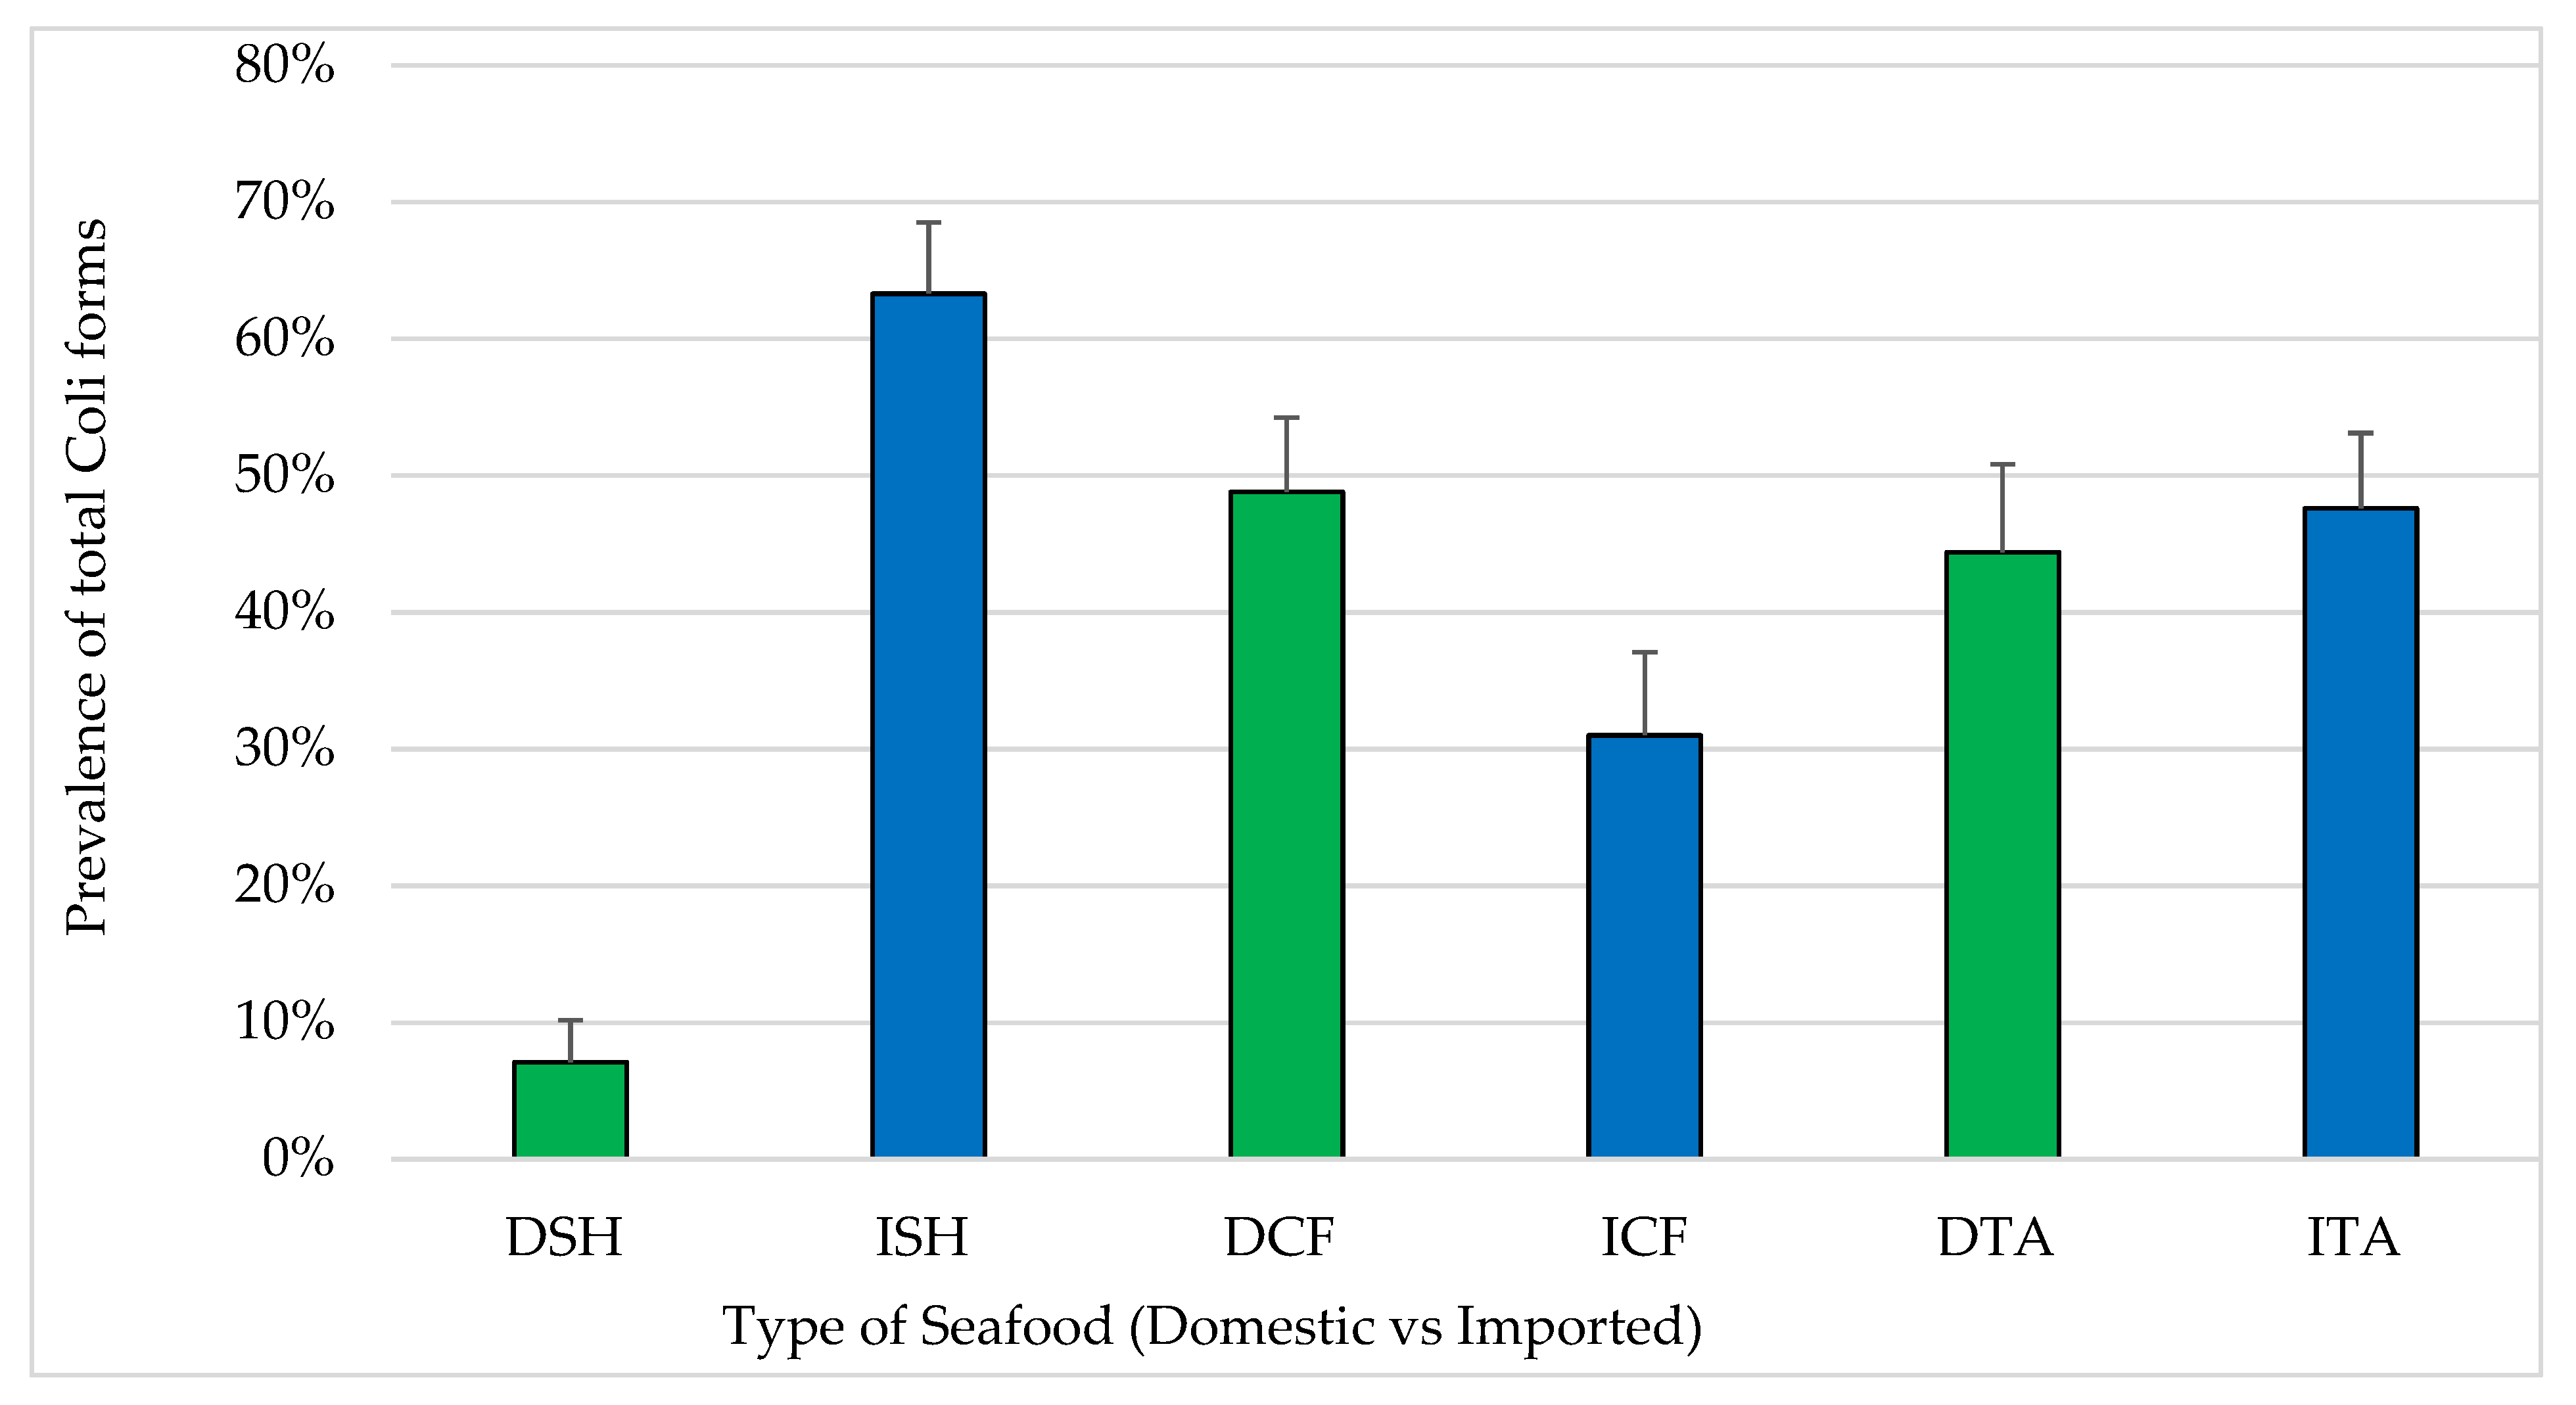
The prevalence of total coliforms (43%) and
E. coli (9.3%) in this study reflect the sanitation of production environments through the supply chain to retail. Similar prevalence of
E. coli (9.4%) was reported in a survey of imported shrimp [
32]. However, prevalence has varied significantly in other studies which reported prevalence below 7% and enumerated levels below 10 MPN/g [
28,
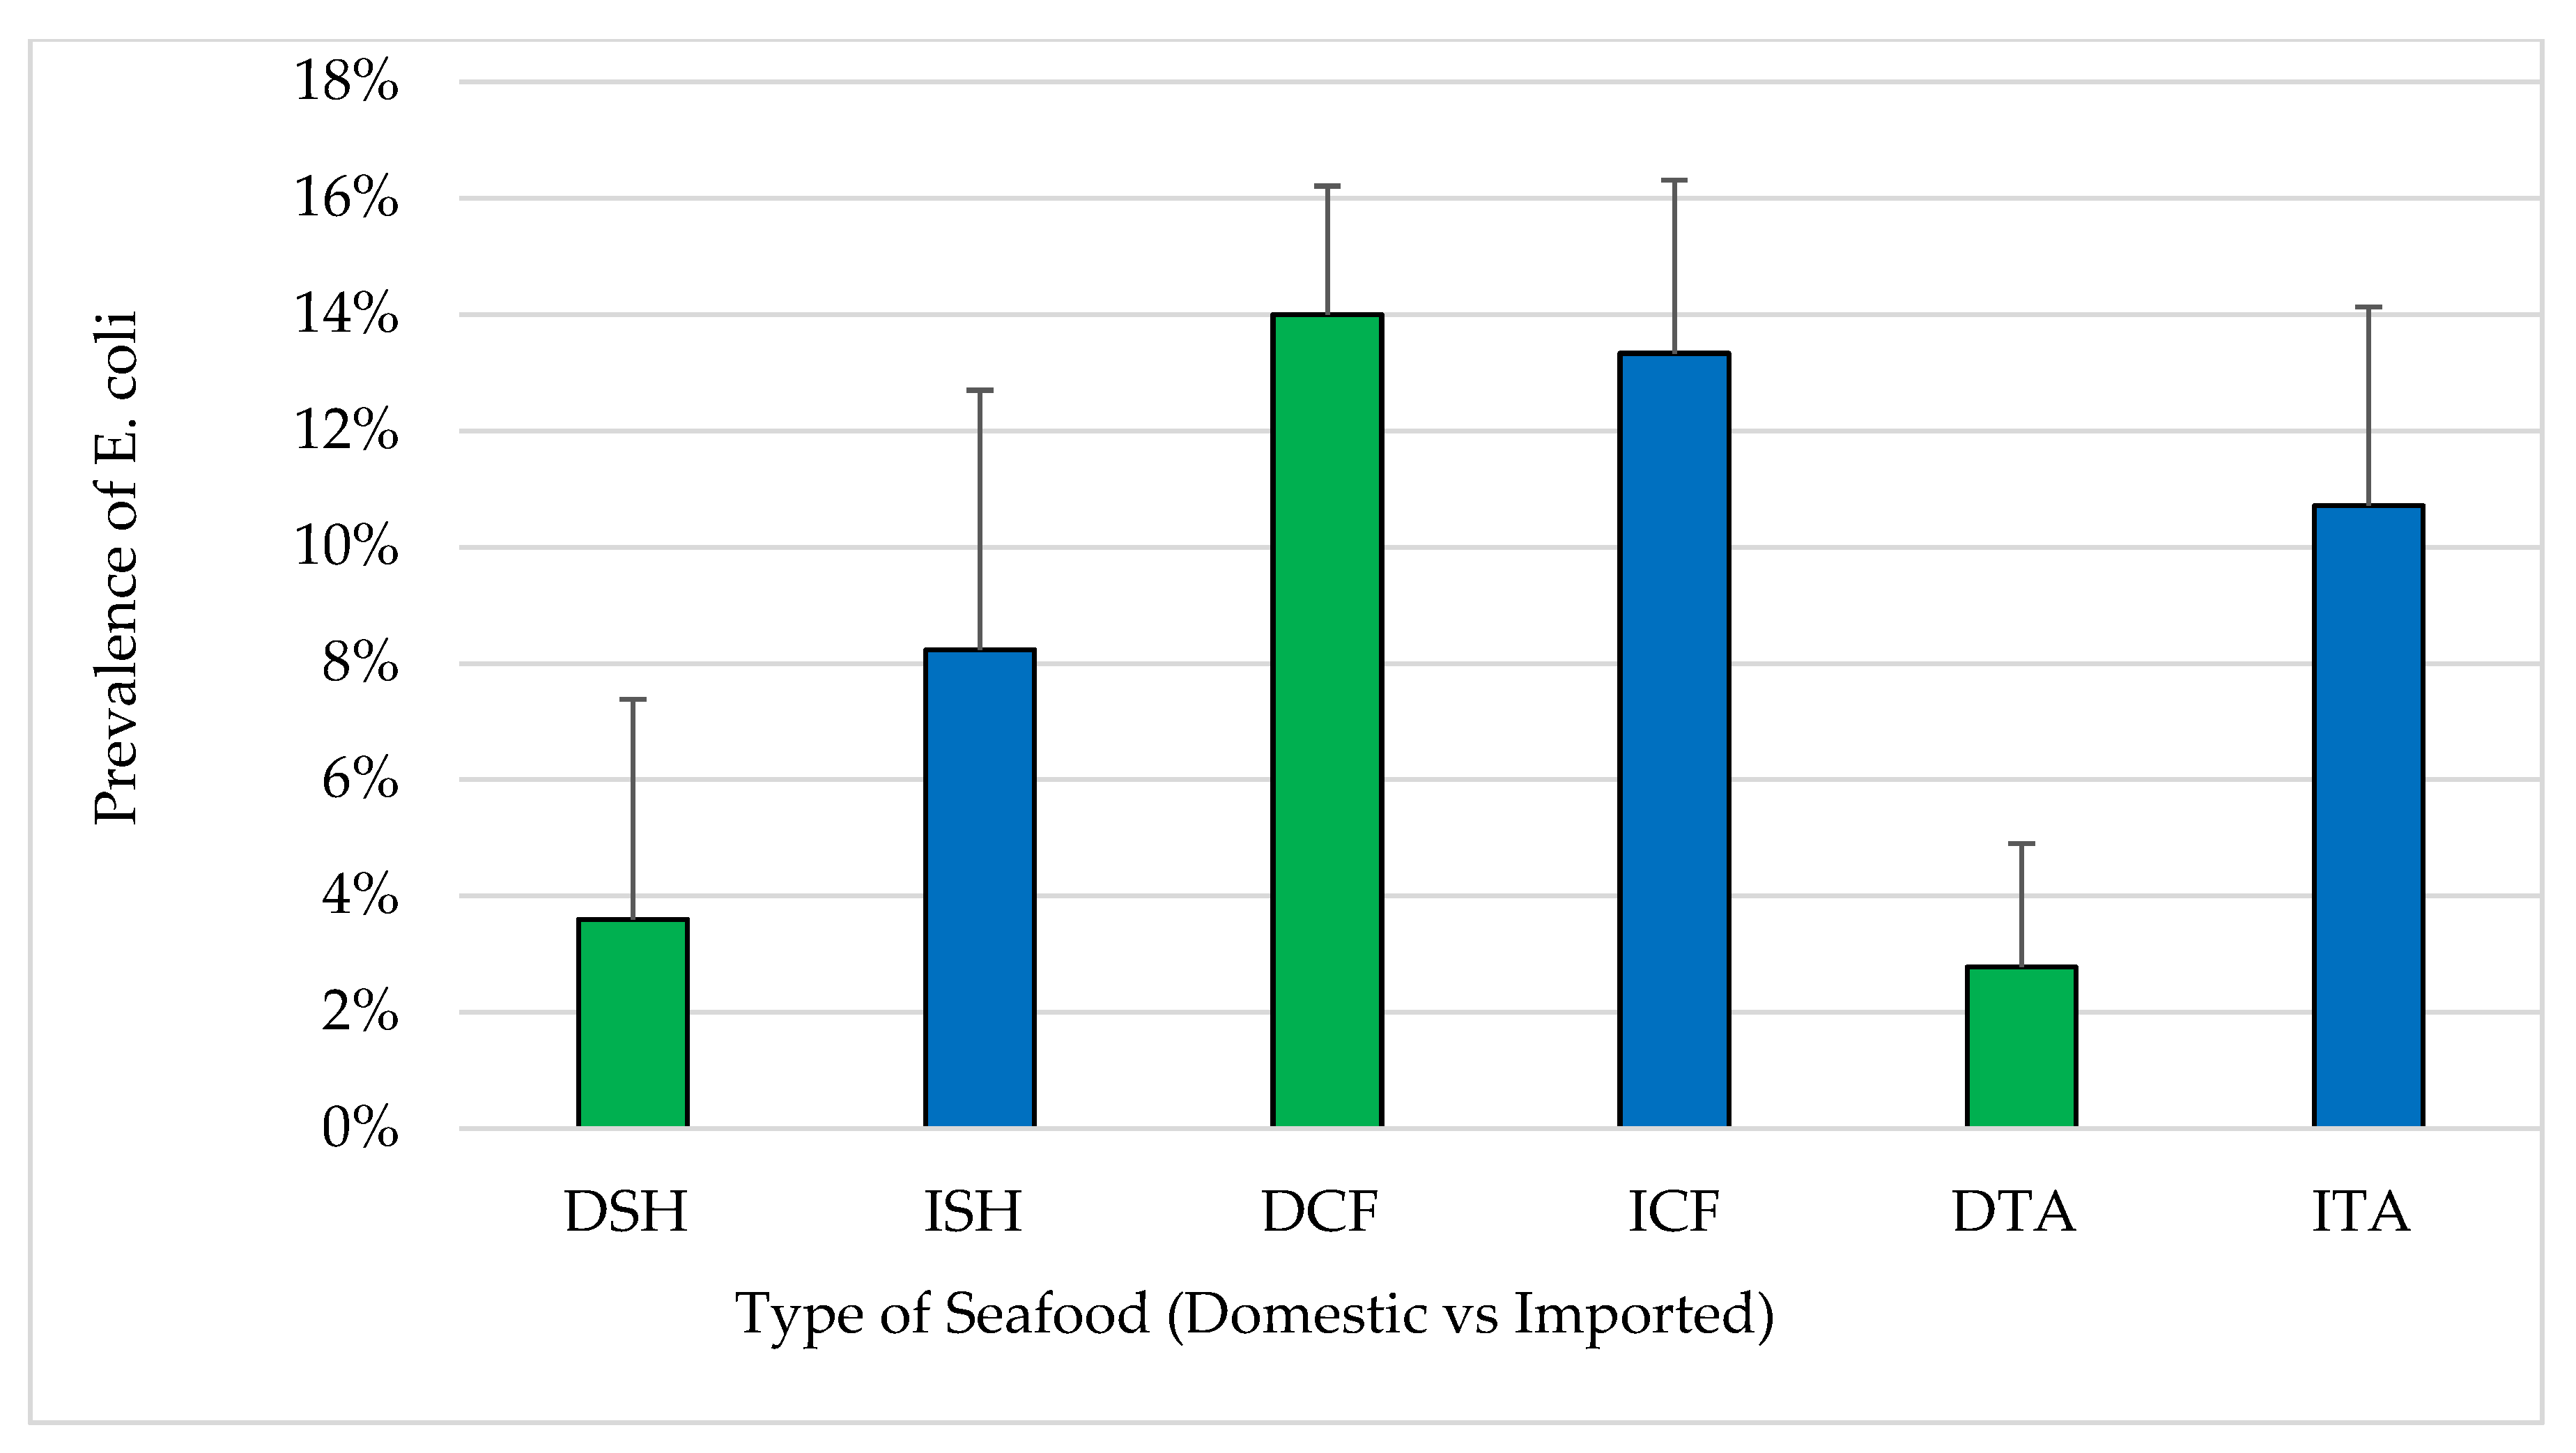
31].
E. coli was reported in higher prevalence in India and Vietnam because of poor seafood hygiene [
7]. However, the prevalence rate of
E. coli recovered from raw oysters was only 2.2%, and from dried squid products 14.3% [
33]. Wang et al. [
32] and other studies failed to detect
E. coli in imported seafood. The higher prevalence of coliforms and the higher amounts of unacceptable samples in this study indicated poor hygienic conditions. The finding of Atwill and Jeamsripong [
34] showed higher prevalence of
E. coli among seafood (85%) with a total average concentration of 2 × 10
4 (± 4 × 10
4 MPN/g). In addition, the same study [
34] determined the prevalence of fecal coliforms in seafood equal to 100% with total average of 9 × 10
4 MPN/g (± 4 × 10
4 MPN/g). Comparing domestic to imported seafood types in the current study, there were no statistically significant differences between them. The high prevalence of
E. coli (14%) among samples of catfish from domestic and imported sources in this study suggested poor management, a heavy infestation of reptiles and amphibians and/or sewage contamination of the aquaculture [
14]. On the other hand, low prevalence possibly indicated an improvement in the management and hygiene practices. Previous studies reported that 4.4–13.6% of shrimp and finfish samples were unacceptable in their microbiological quality [
22,
28,
30,
31,
32]. With respect to domestic vs. imported seafood, microbiologically unacceptable samples from domestic shrimp and domestic catfish were within the range and matched the previous findings (>1 × 10
7 CFU/g). However, none of the imported shrimp and catfish were unacceptable. Some of the domestic shrimp (<2%) and domestic catfish (9%) were determined as microbiologically marginally acceptable (
Table 1). The percentages of marginally acceptable imported shrimp (7%) and catfish (12%) were within the same range as the previous studies above. However, 6% of the domestic and 8% of imported tilapia were microbiologically marginally acceptable. The findings in this study showed that high percentages of seafood samples of all types met the standard of microbiologically good quality. There were no statistically significant differences (
p > 0.05) between the domestic and imported seafood of any type, which is consistent with the results of previous studies by Wang et al. [
32] and Berry et al. [
30] in imported seafood in the USA.
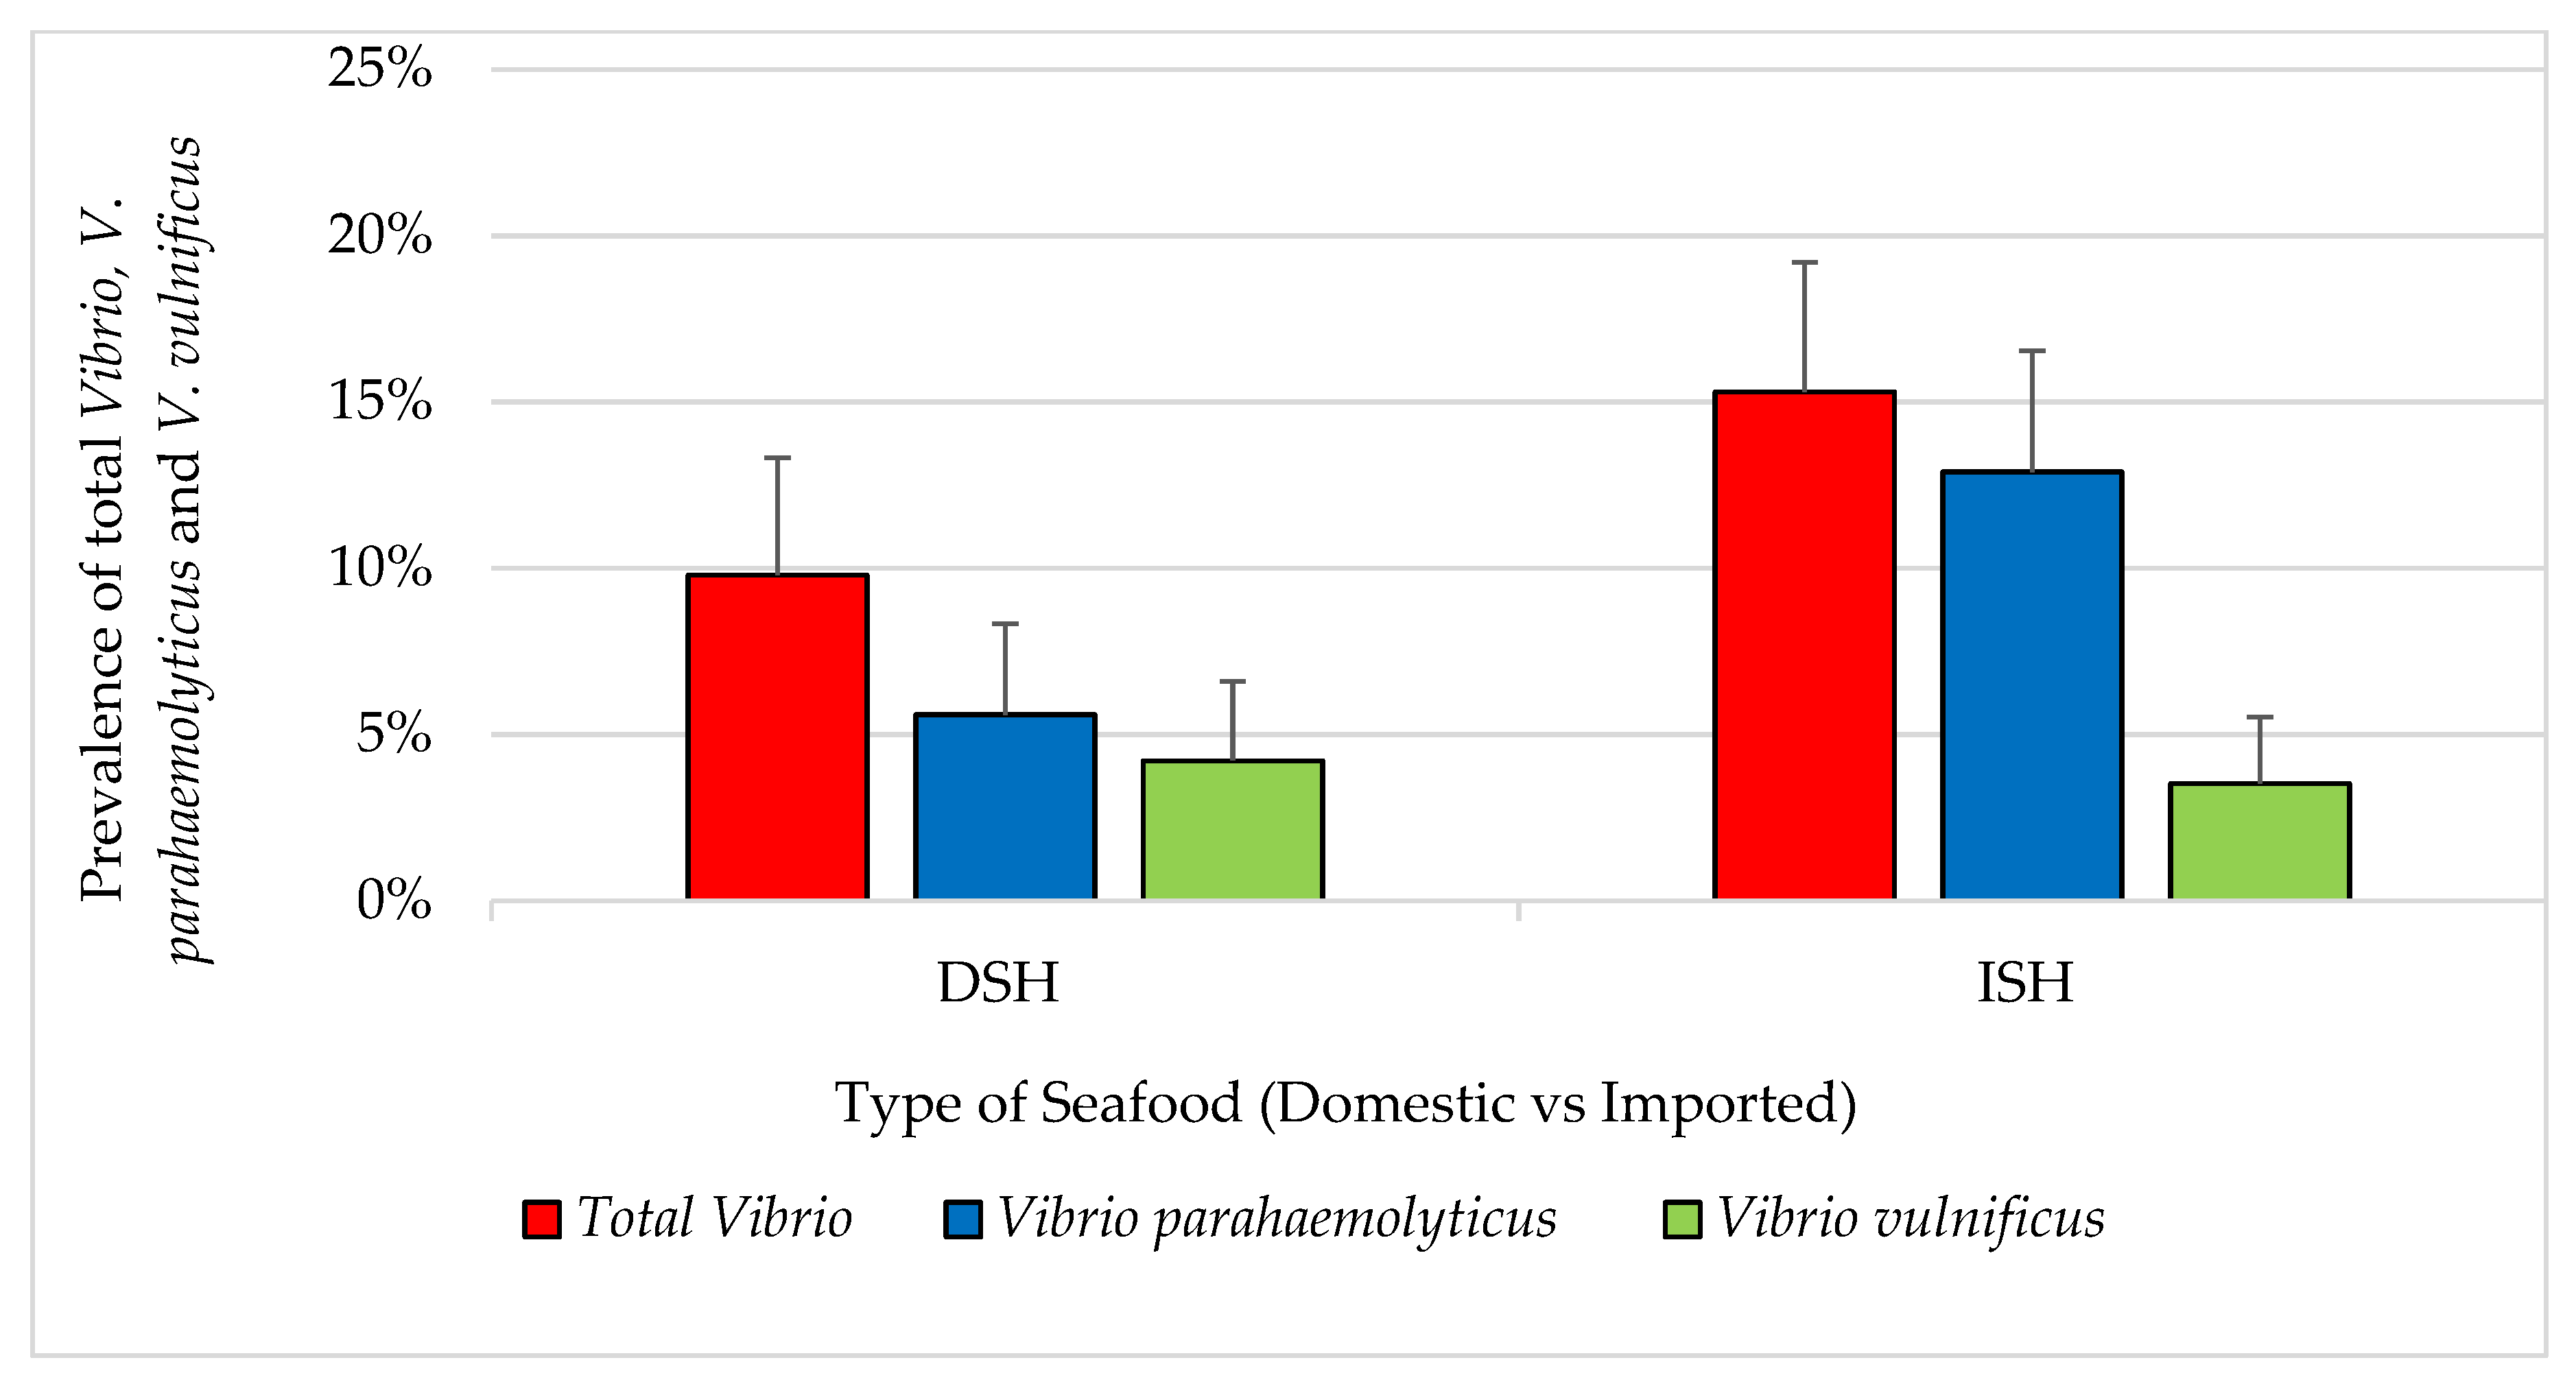
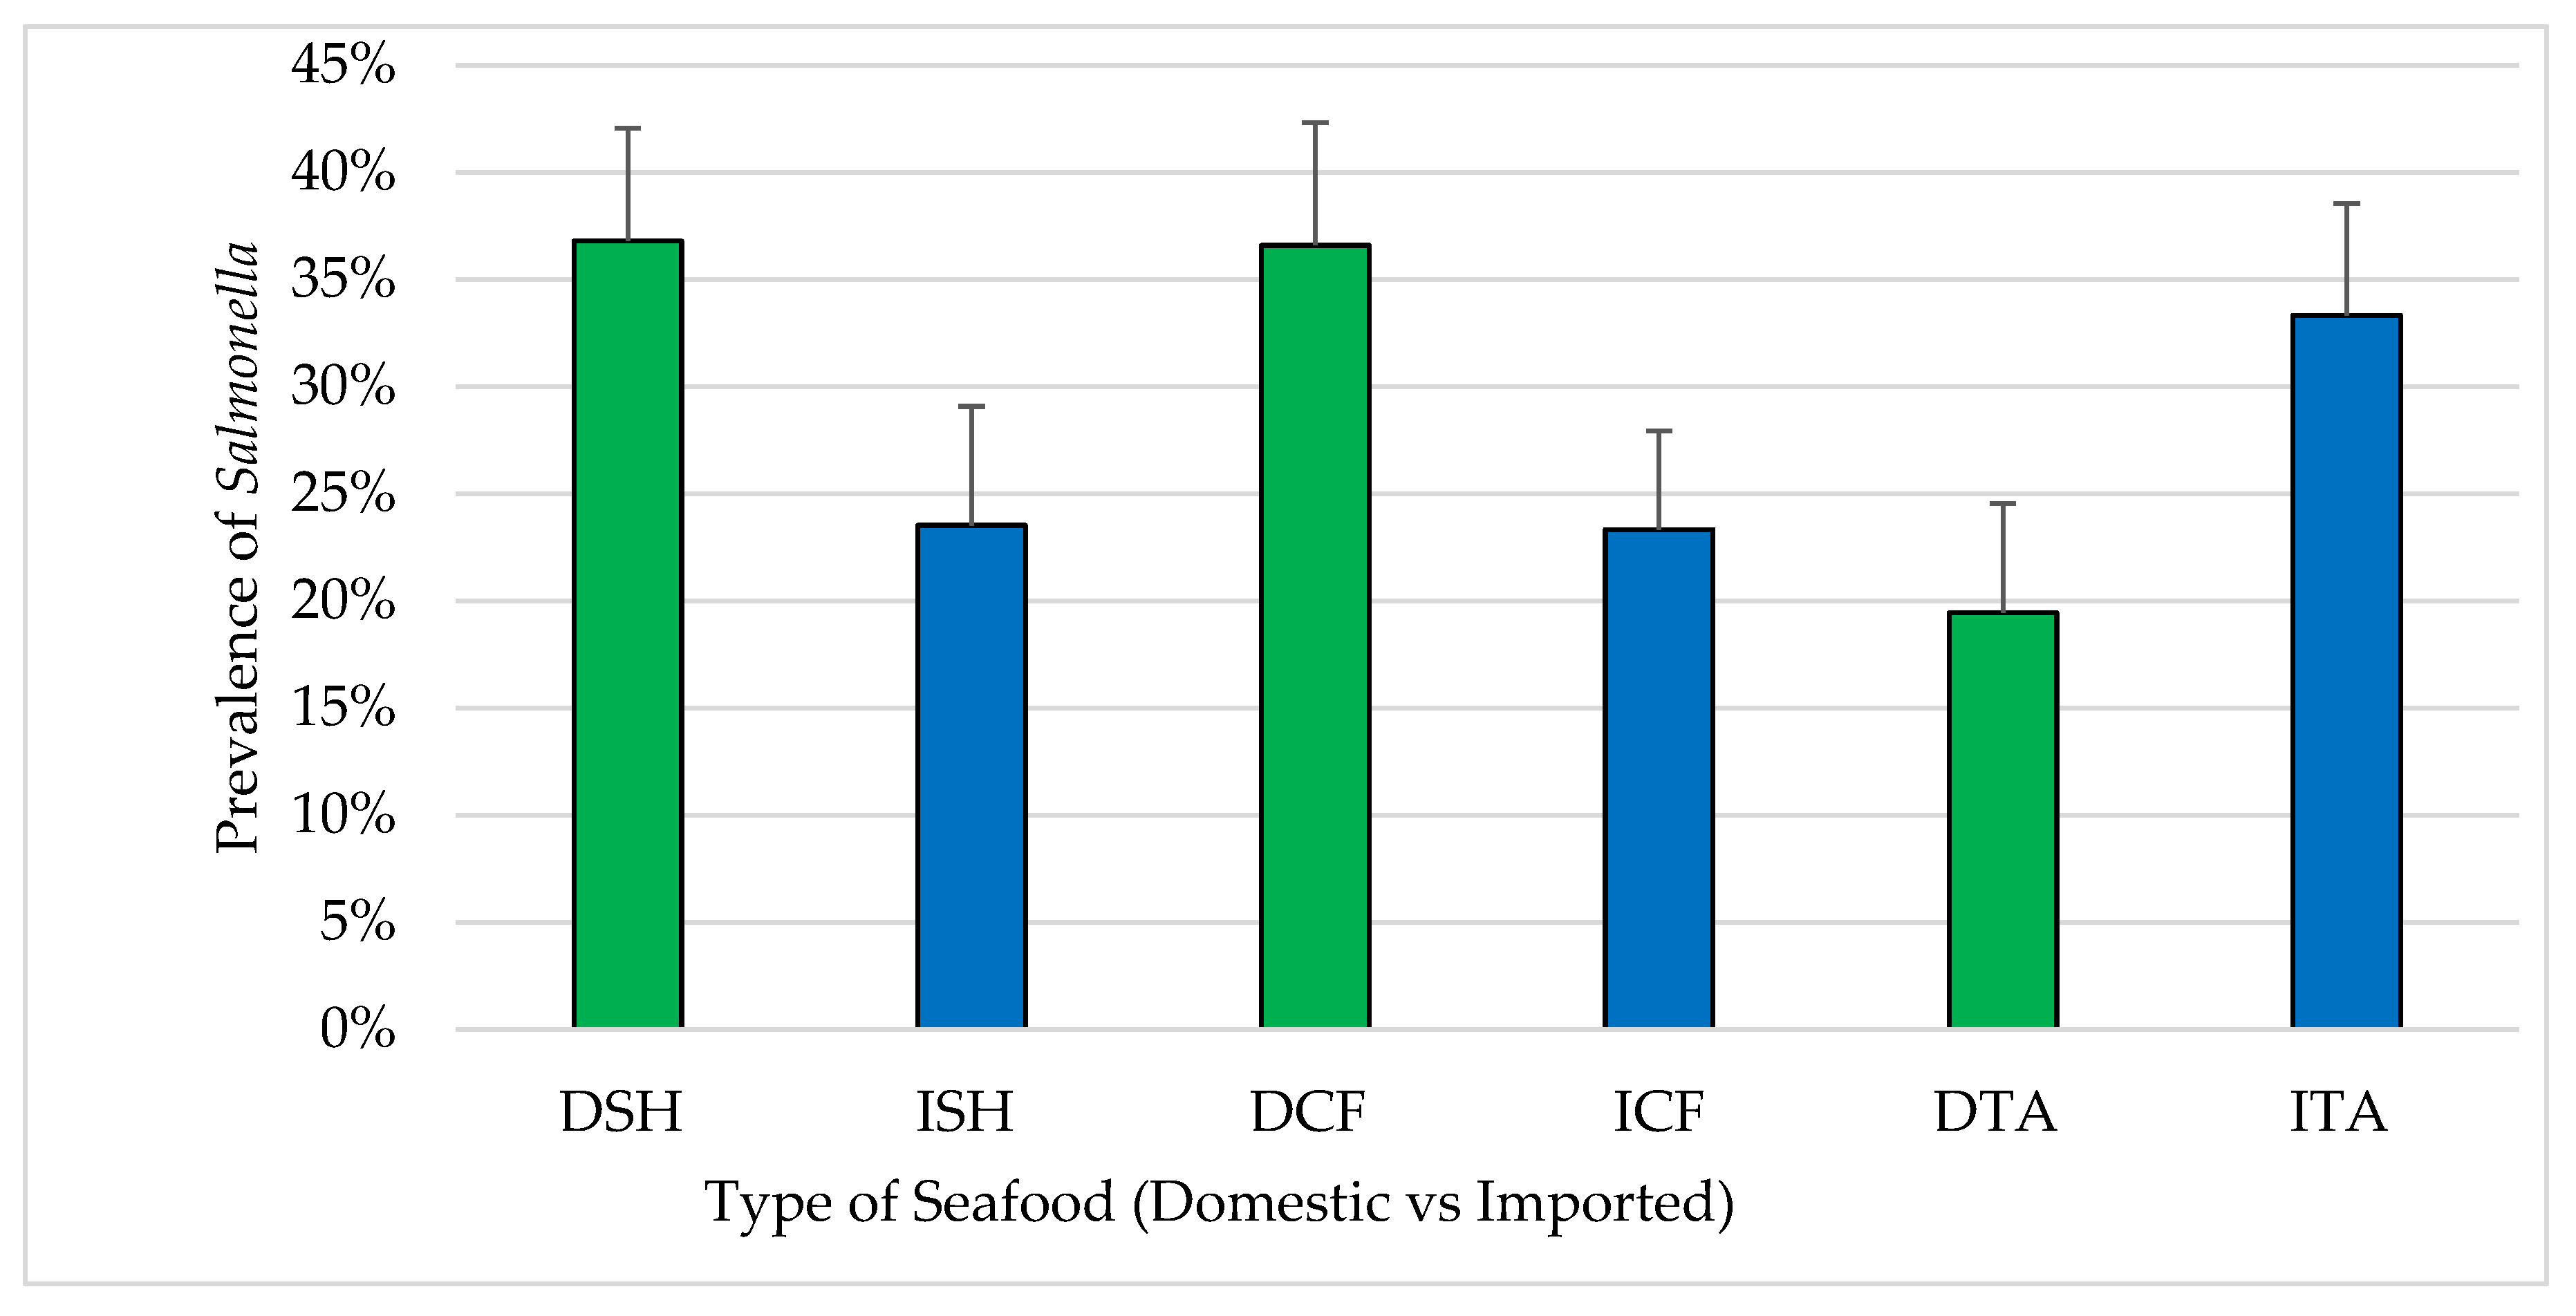
The prevalence was 4.5% for total
Vibrio species, 28.9% for
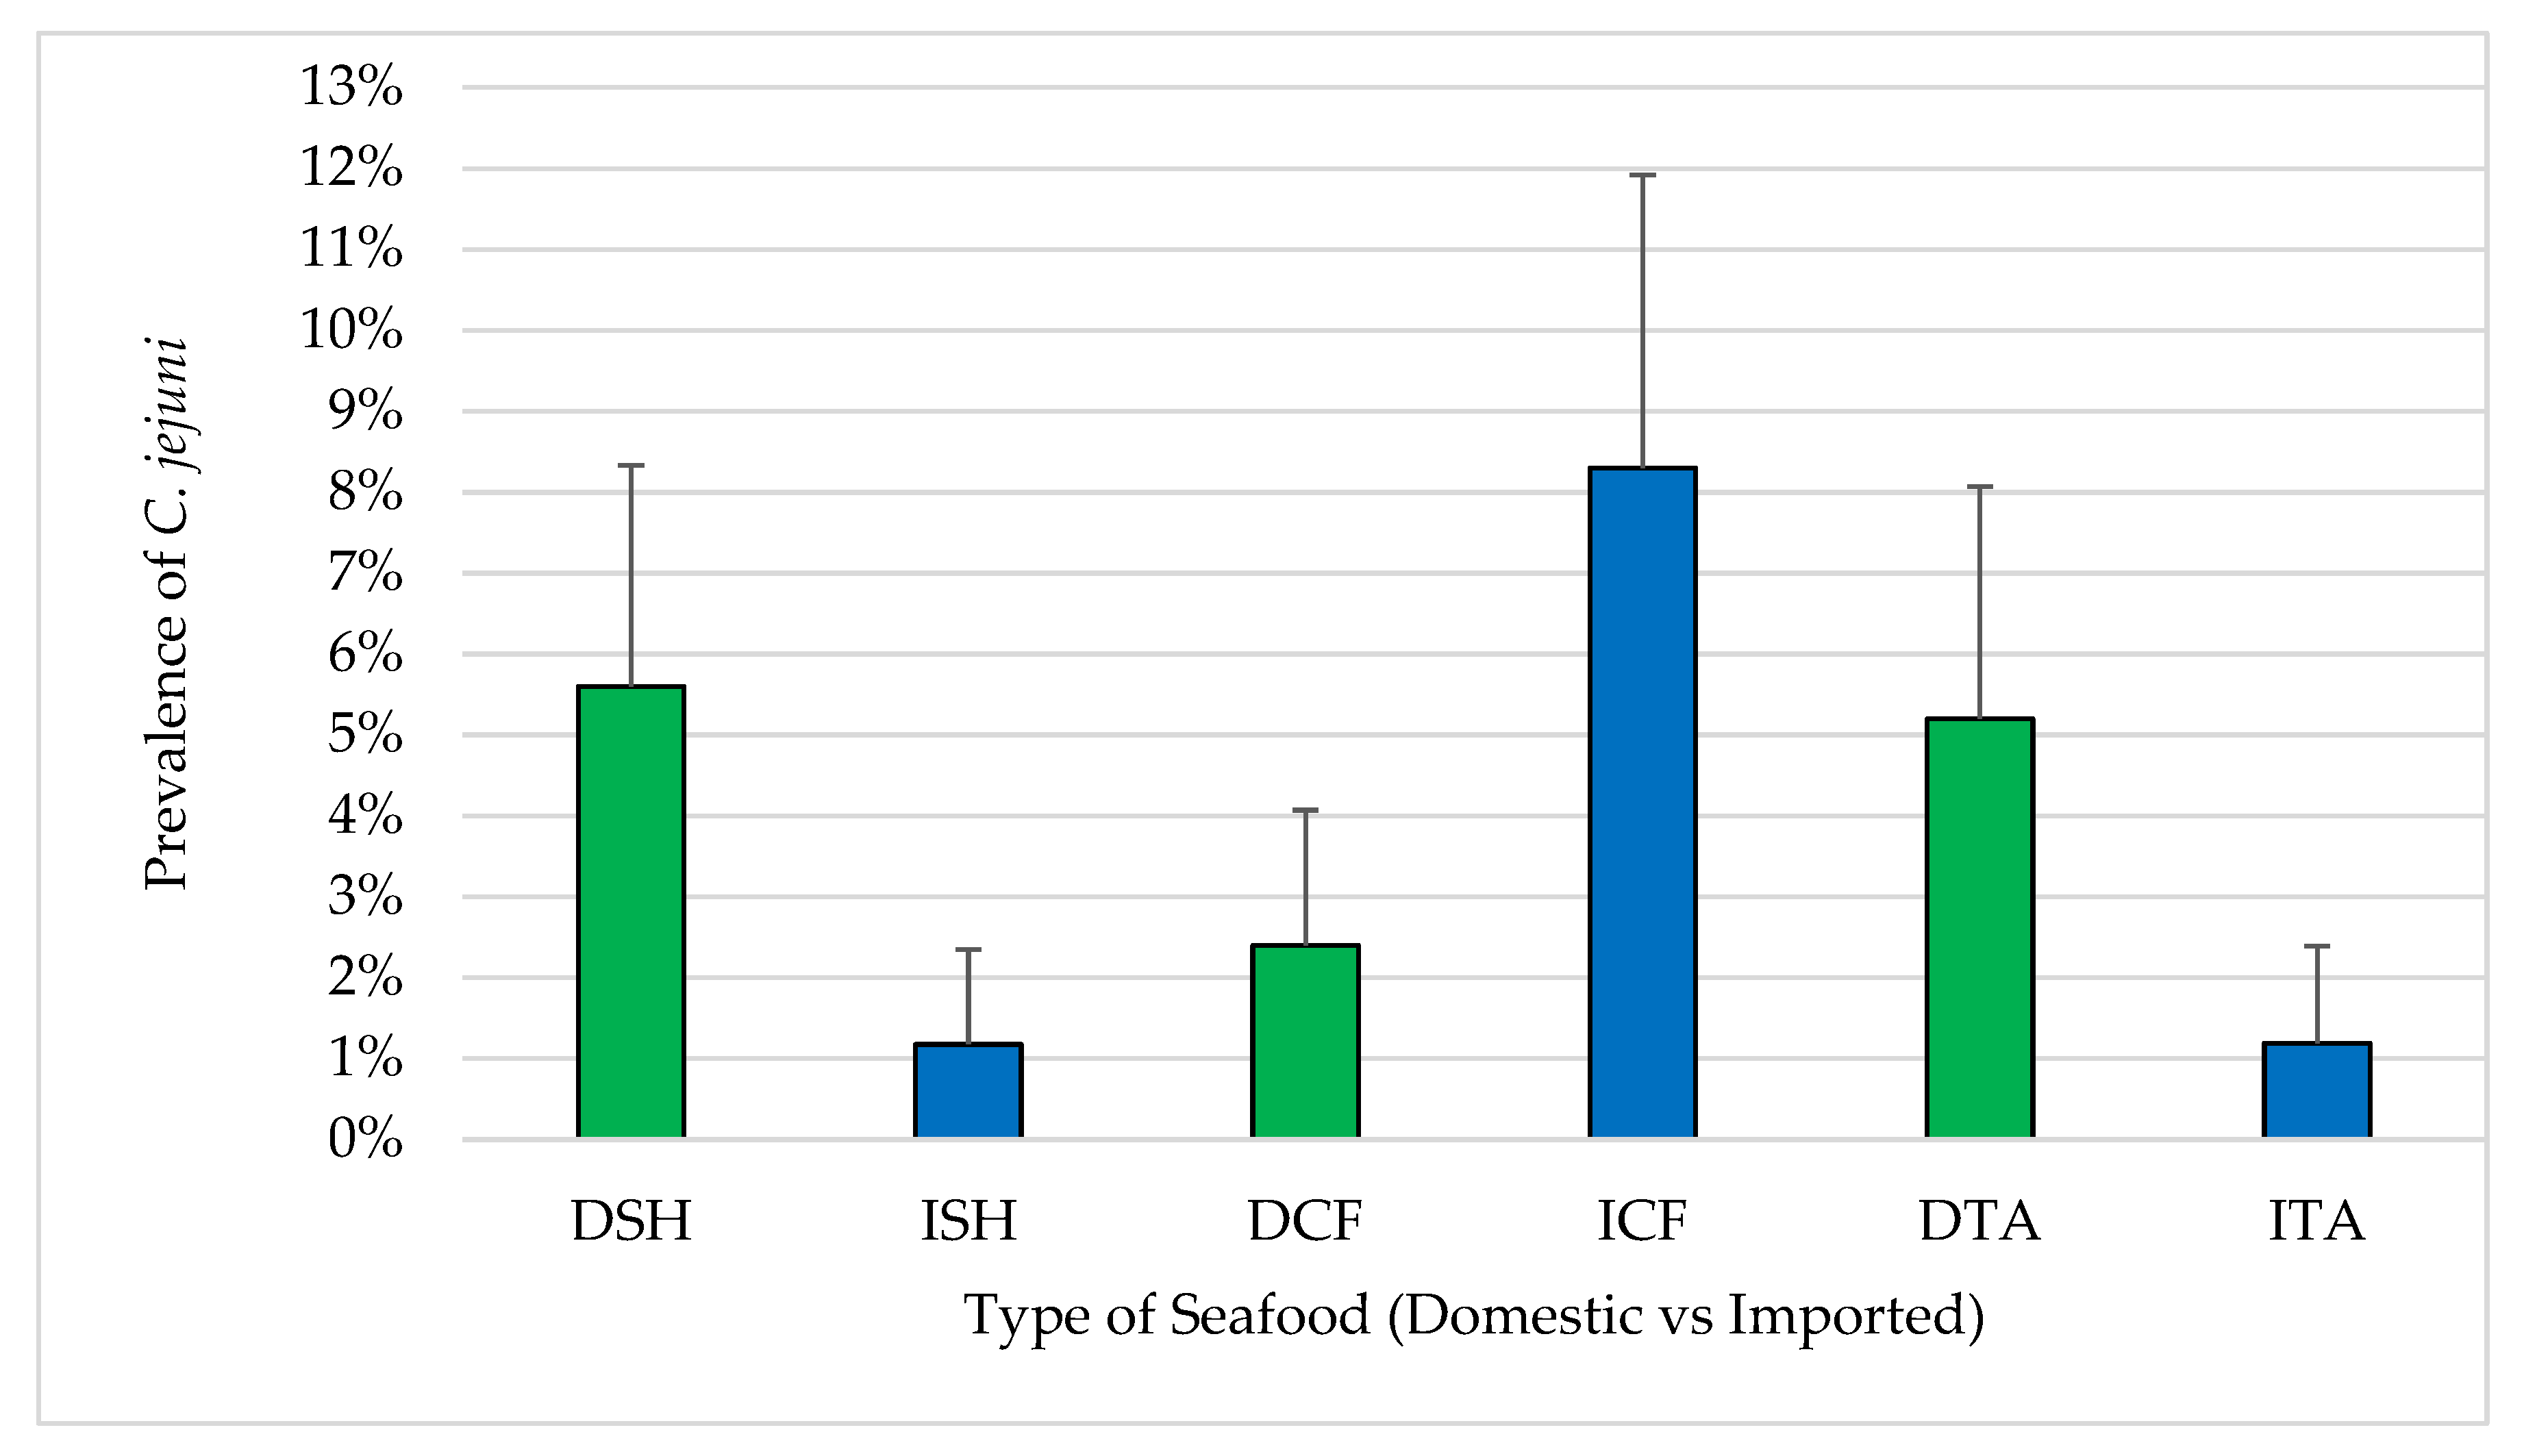
S. Typhimurium and 3.6% for
C. jejuni. There was a large difference between imported and domestic
Salmonella prevalence in shrimp, catfish and tilapia (36.8%, 36.6% and 19.4% of domestic and 23.5%, 23.3% and 33.3% of imported shrimp, catfish and tilapia, respectively). Some studies indicated that the prevalence of
Vibrio species ranged between 0% and 63% [
22,
28,
29,
30,
31,
32]. The prevalence of
Salmonella in a previous FDA study (1990–1998) was 10% [
26]. The prevalence of
S. Typhimurium was rated as 10th among different
Salmonella serovars [
26,
35]. Previous studies in the USA revealed no
Salmonella contamination in seafood [
28,
31]. In Japan, Hara-Kudo et al. [
33] reported a prevalence of 0.5%
Salmonella in raw oysters. However, some other studies reported prevalence rates of
Salmonella ranging between 4.3–18% [
7,
29,
32,
35]. Prevalence of
C.
jejuni of less than 1% was reported in seafood in previous studies [
10,
32]. Different methods in these studies, all of which may not have the same limit of detection (LOD), are maybe the cause of this wide range. In comparison to other studies, the findings of this study varied among pathogens. Prevalence of
Vibrio spp. (4.5%) in shrimps were among the lower rates compared to other studies which ranged from 0% to 63% in the USA [
28,
31]. The absence of fresh seafood and limiting the sample collection in this study to frozen seafood only may significantly impact the outcomes.
Salmonella prevalence (28.9%) was significantly higher compared to previous studies, where
Salmonella prevalence did not exceed 10% [
26,
32].
C. jejuni prevalence (3.6%) in this study was slightly elevated compared to other studies which reported around 1% prevalence recovered from seafood [
32,
36]. High rates of detection of
Salmonella and
C. jejuni in seafood is considered an alert for fecal contamination of aquaculture environments and/or cross-contamination [
4]. Such facts explained the high prevalence of these two pathogens. The findings of this study reported
S. Typhimurium as the only serovar recovered from all seafood regardless of the type and source. However, all isolates were genetically diverse when using pulsed-field gel electrophoresis (data not shown). There is no single explanation for this; however, it signals the need for future studies to determine a reasonable explanation. Other studies reported different serotypes isolated from raw oysters, such as Infantis, Schwarzengrund and Manhattan, as well as Typhimurium [
33].
S. Typhimurium was isolated by Wang et al. [
32] from imported tilapia.
Salmonella prevalence in this study was much greater than reported by previous studies [
26,
29]. Sources of
Salmonella in these seafood samples require additional studies to determine the role of pollution and natural aquatic occurrence, which is more difficult to control. With respect to type and source of seafood, the most notable difference between them was the prevalence of detectable
Salmonella in domestic tilapia.
In this study, the levels of
Vibrio,
Salmonella and Campylobacter were quantified whereas most previous studies only determined the prevalence of
Salmonella and
Campylobacter in seafood. Quantitative data improves the accuracy of risk assessment compared to previous data. The MPN ranged from 75 to 1100/g.
Vibrio levels in the current study were much lower than reported in live oysters and blue crabs during the warmer months when MPN ranges from 10 to >100,000 [
2,
12,
37]. This might be due to the collection and analysis of frozen samples instead of fresh/live samples. However, we were not able to compare the quantitative results of our study with previous studies on shrimp, tilapia and catfish due to lack of pathogen-specific quantitative data. Moreover, we did not find enough information on microbiological acceptability based on the level of specific pathogen
(Vibrio spp.,
Salmonella and/or
Campylobacter), though there is a plethora of information on seafood microbiological acceptability based on APC. We observed that none of the marginally acceptable and unacceptable samples were
V. parahaemolyticus, V. vulnificus and/or
C. jejuni positive. In contrast, only three samples from the marginally acceptable and none of the unacceptable were
Salmonella positive. Based on APC, all
Salmonella positive samples were acceptable for human consumption. However, based on FDA’s 2021 guidance for fish and fishery products, any sample with detectable
Salmonella exceeds the established safety level for that organism and may be considered unacceptable for human consumption [
37]. The findings of this study suggest that seafood should not be considered as safe for human consumption based only on APC levels.
Total coliform levels were weakly correlated with the prevalence of
Salmonella in the seafood samples collected in this study. Total coliforms and
Salmonella contamination can occur during production or due to poor hygiene in the processing or distribution chain. Based on the literature review, no such study or finding was documented. However, previous studies reported an association and/or correlation of fecal coliforms with bacterial pathogens in oysters in the USA [
38] and in different types of seafood in Thailand [
34].
Bacterial pathogens may be present at low levels in harvested seafood; however, the level of these pathogens may increase due to poor handling, improper processing, or unsanitary practices. In addition, cross-contamination is the consequence of unhygienic management practices. Cross-contamination can be prevented and controlled through proper handling, processing, transportation and storage. Although the data collected in this study are from a few years ago, these data were compared with data from previous [
6,
14,
22,
31] and more recent studies [
2,
17,
34,
39]. Furthermore, seafood aquaculture, harvesting and processing guidelines have not been changed significantly over the last several years [
37].
The results of this study improve our understanding of the microbial contamination of seafood, providing quantitative data for further risk assessment upon which seafood safety policy decisions can be made. These findings are of value to national and international regulatory agencies, the global seafood industry and academia. The results of this study warrant further studies to continuously monitor the microbiological quality and safety of domestic and imported seafood.


 ,
, 


