
Zika Virus Infection Alters Gene Expression and Poly-Adenylation Patterns in Placental Cells

 , , ,
, , ,
Abstract
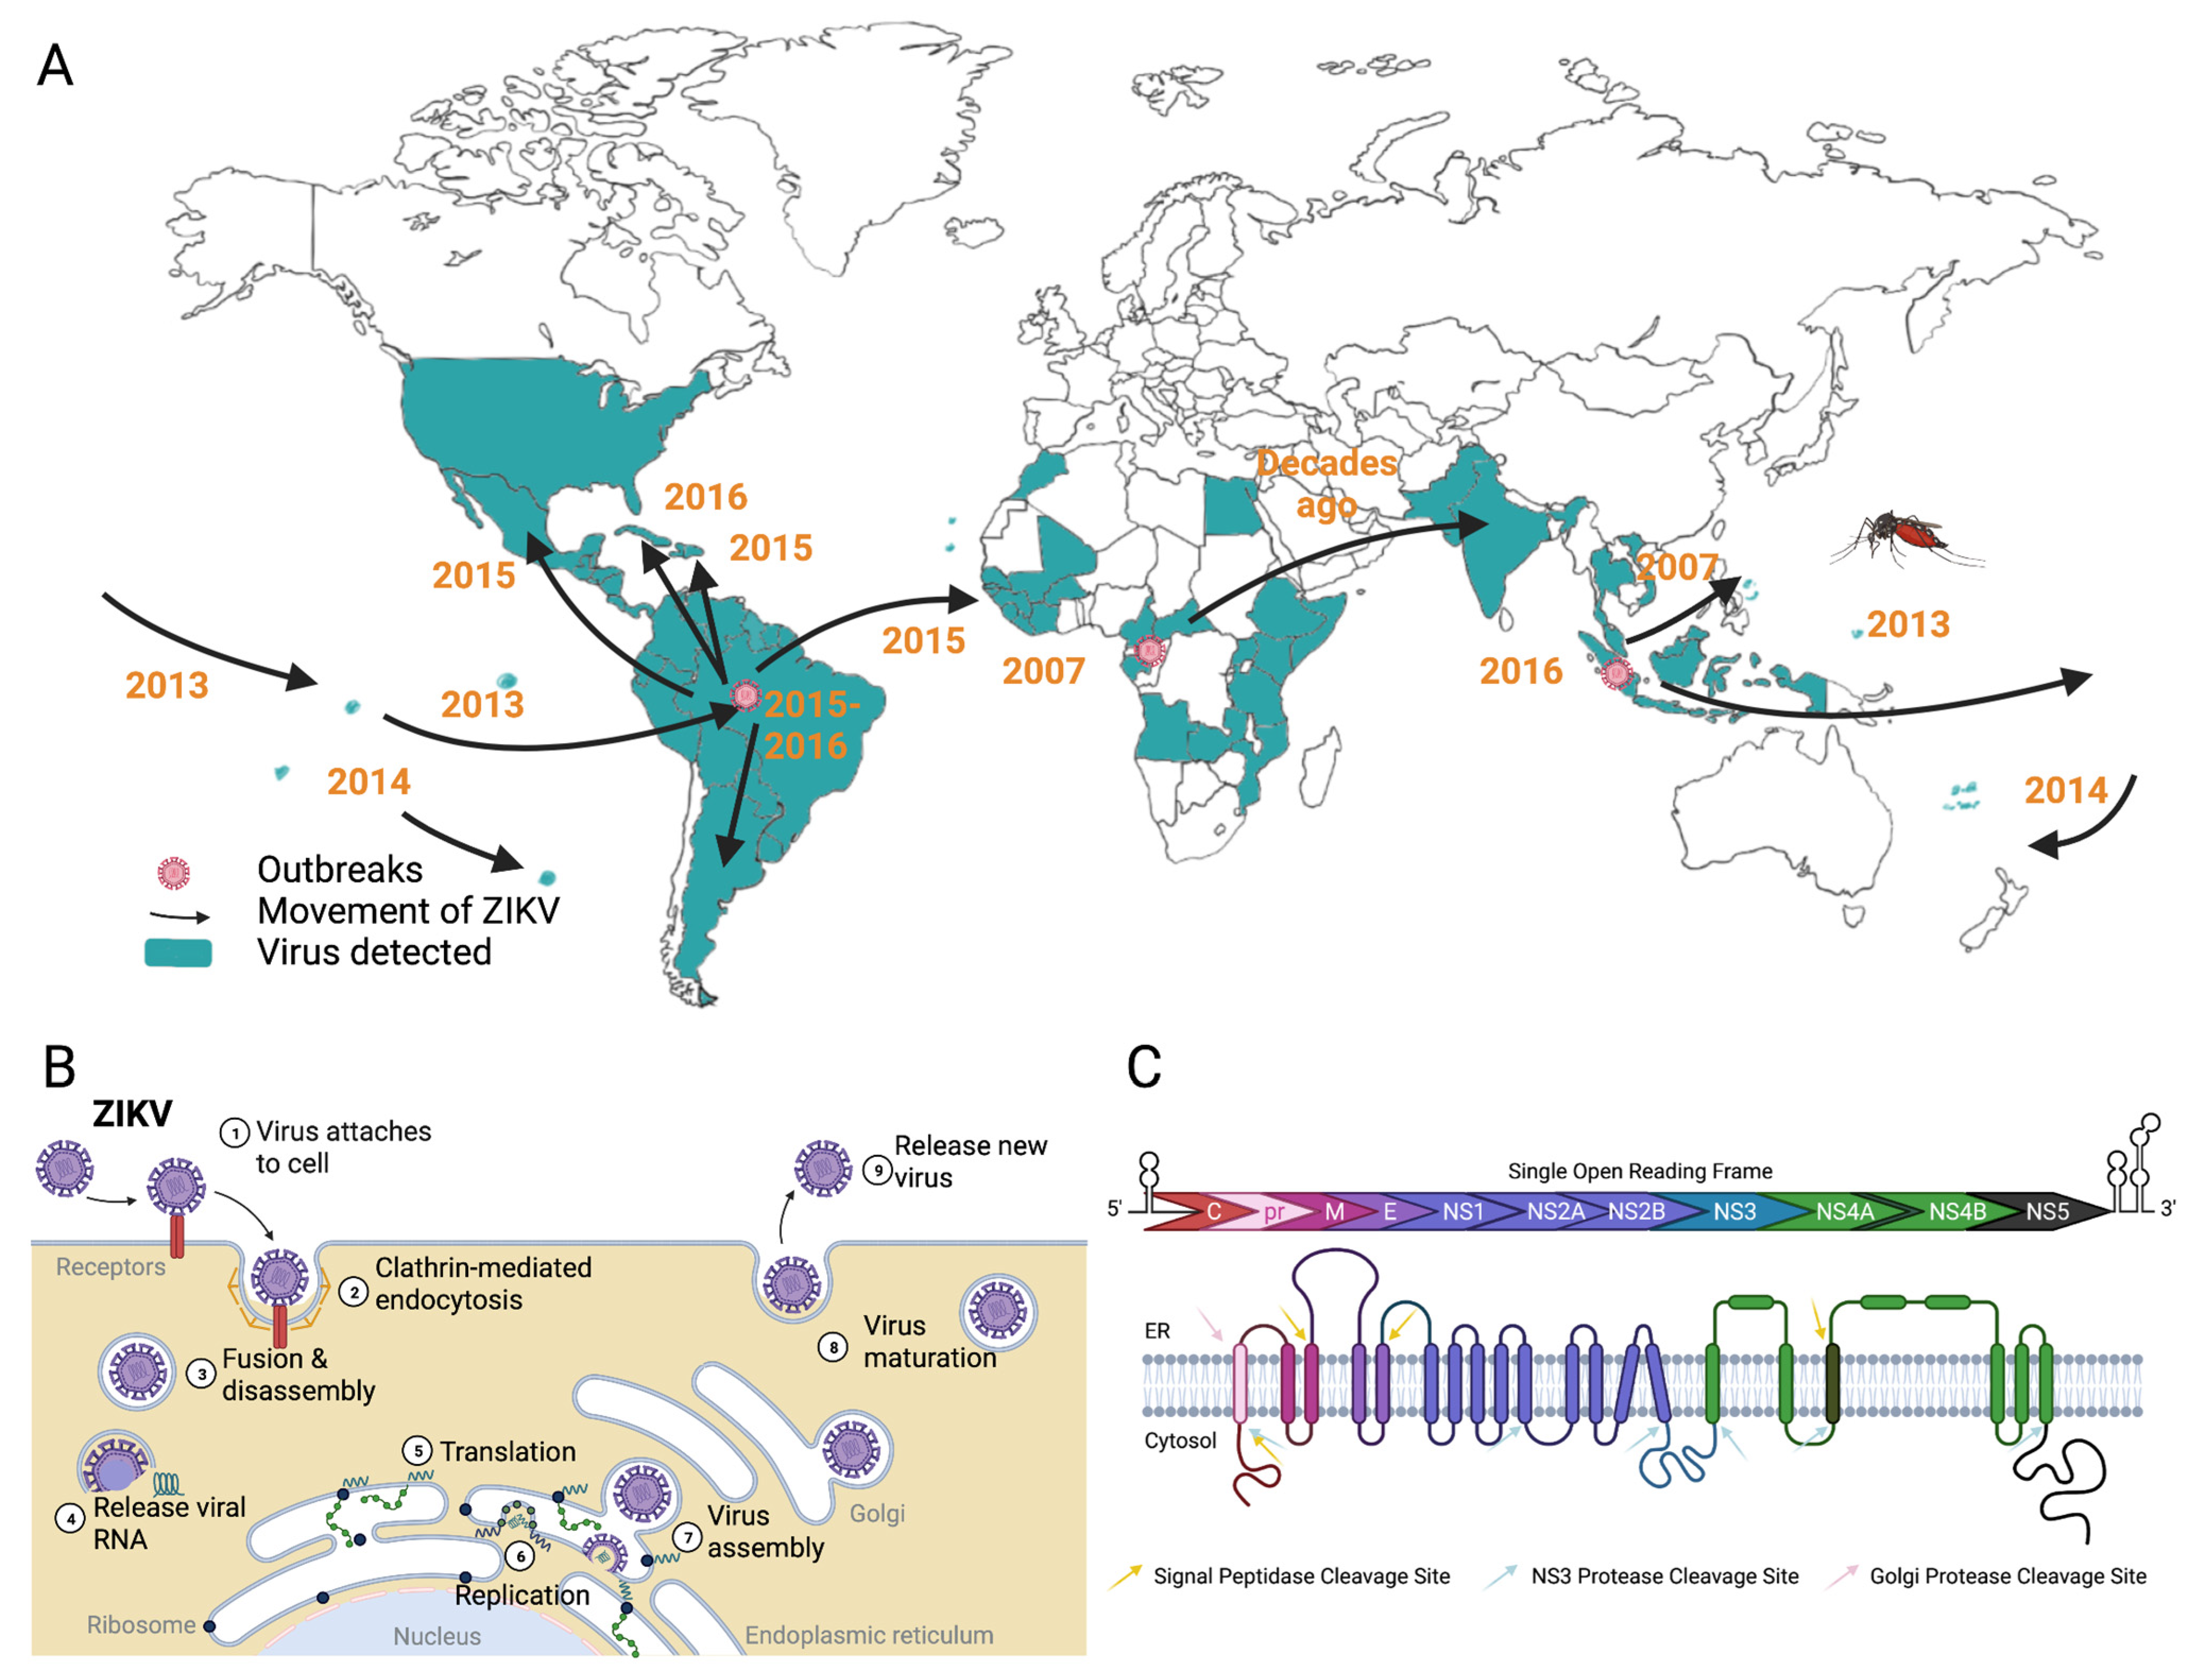
:1. Introduction
2. Materials and Methods
2.1. Cell Cultures and Reagents
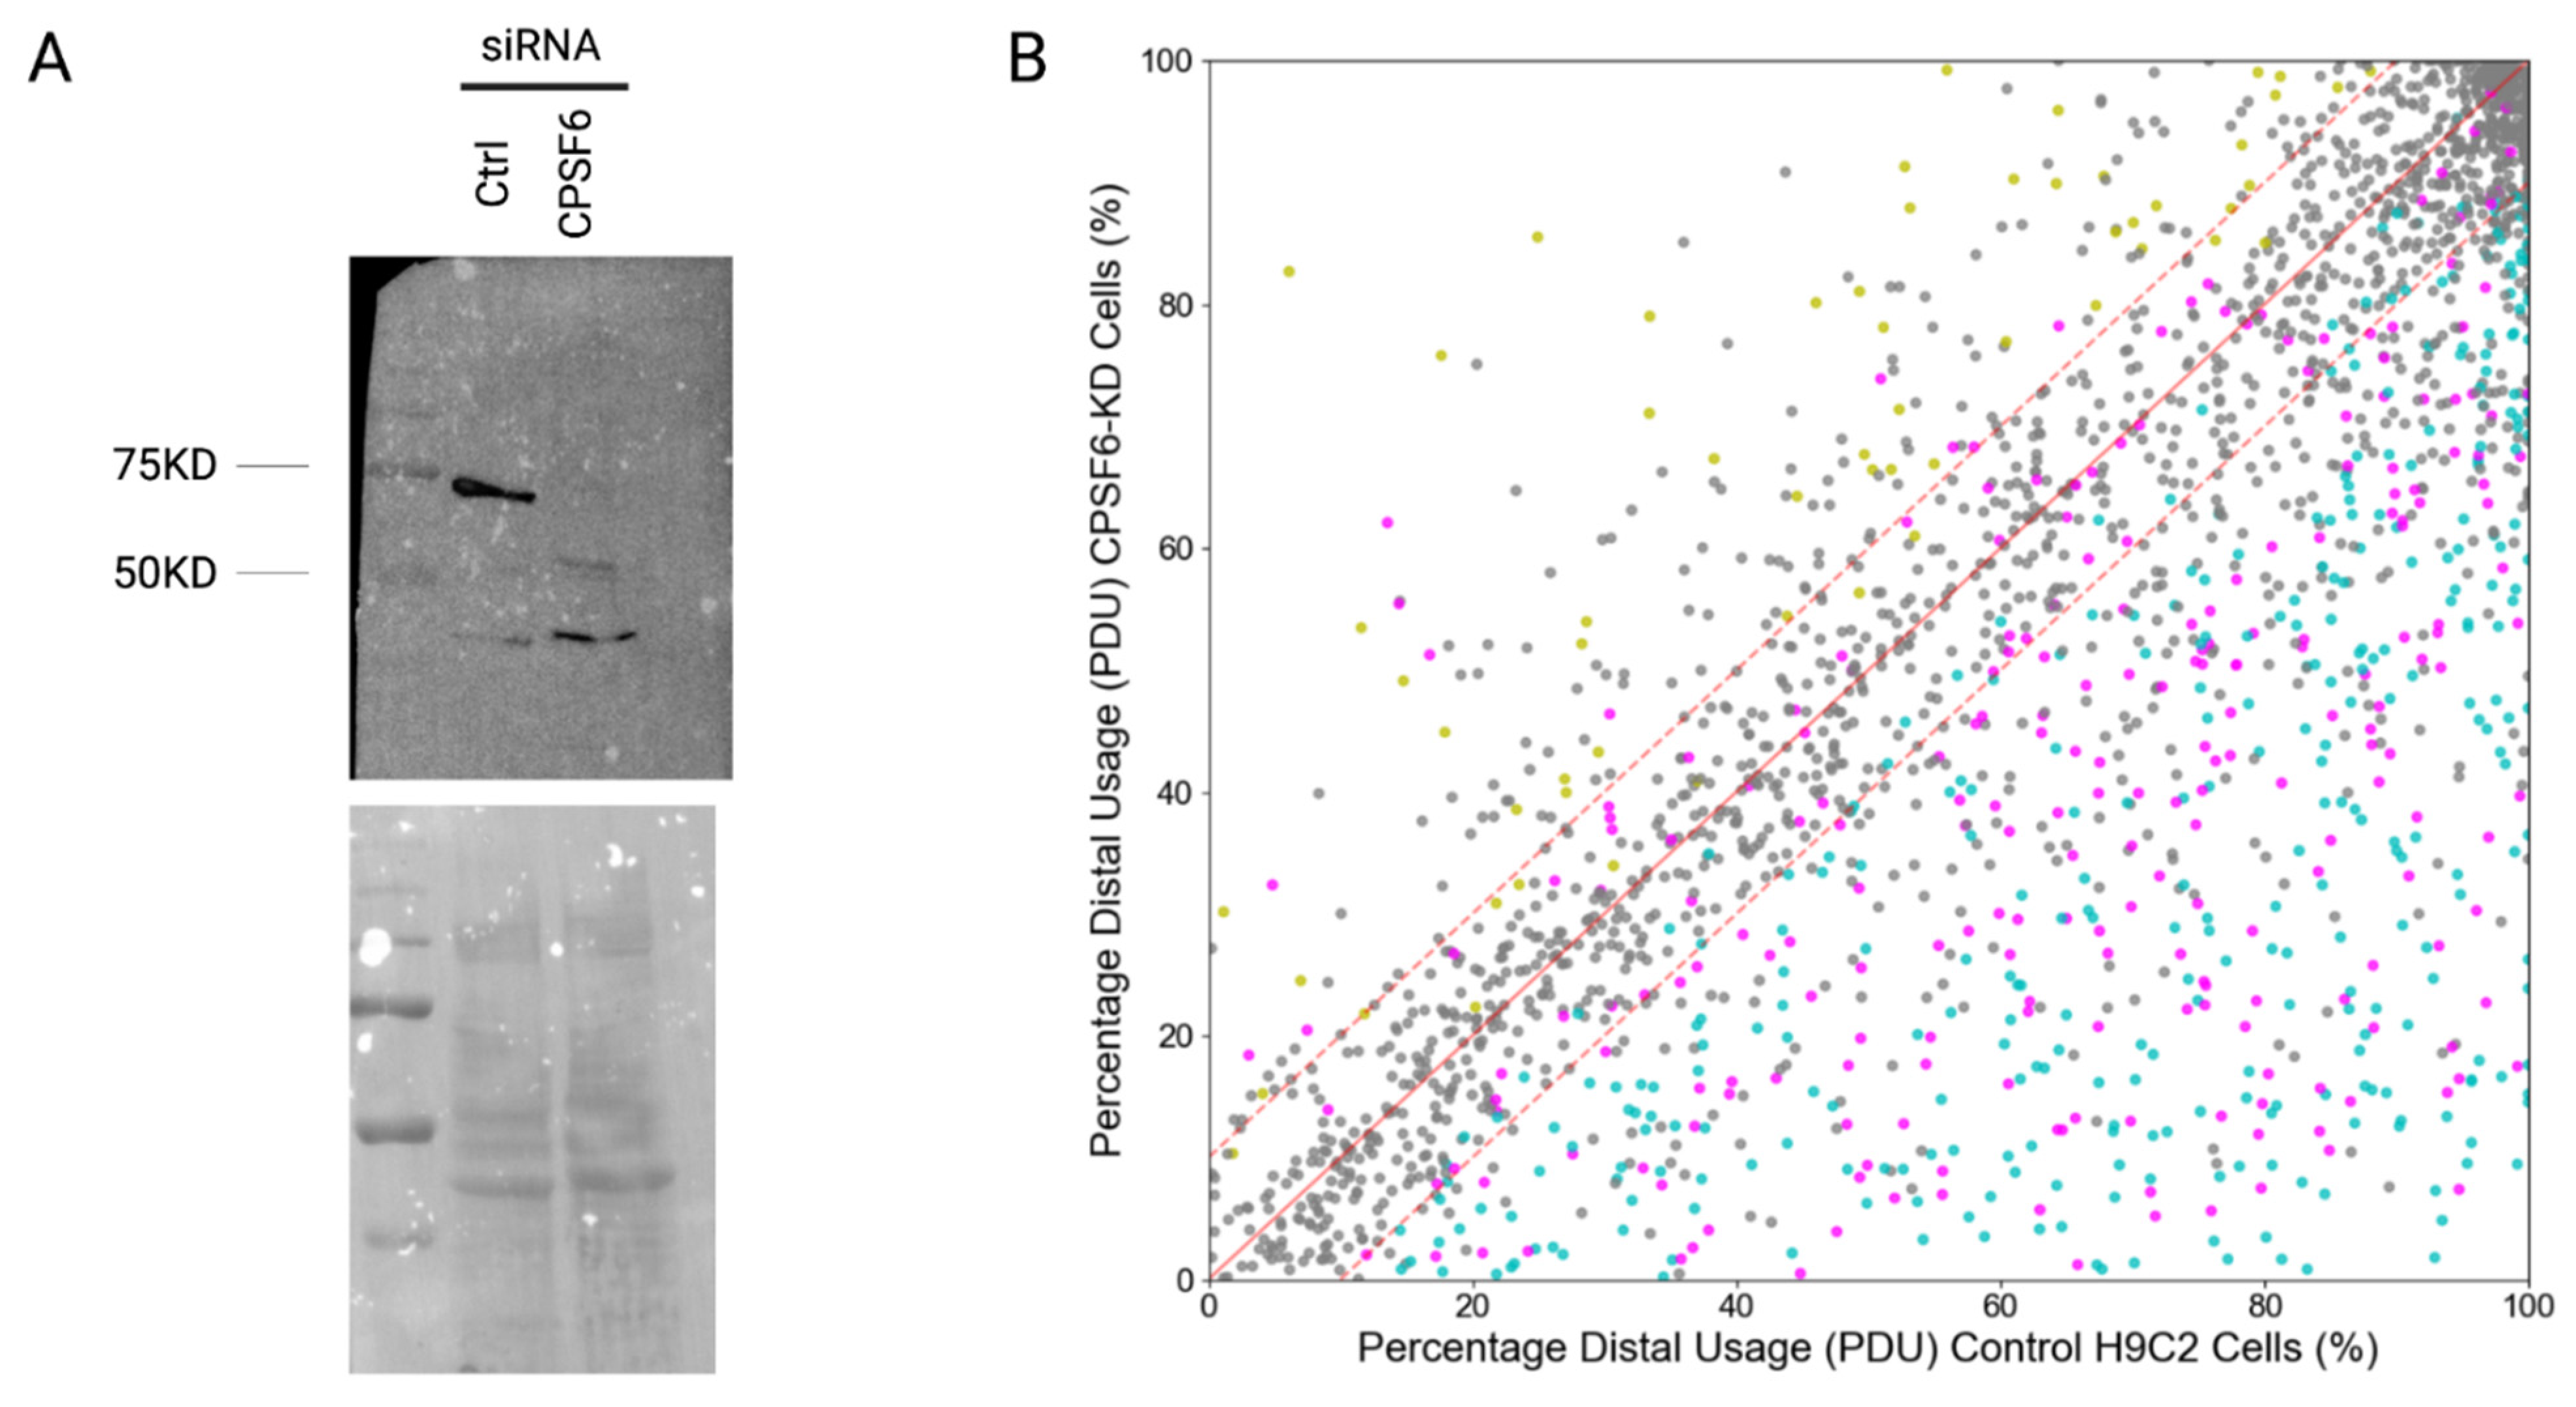
2.2. H9C2 Cells and KD of CPSF6
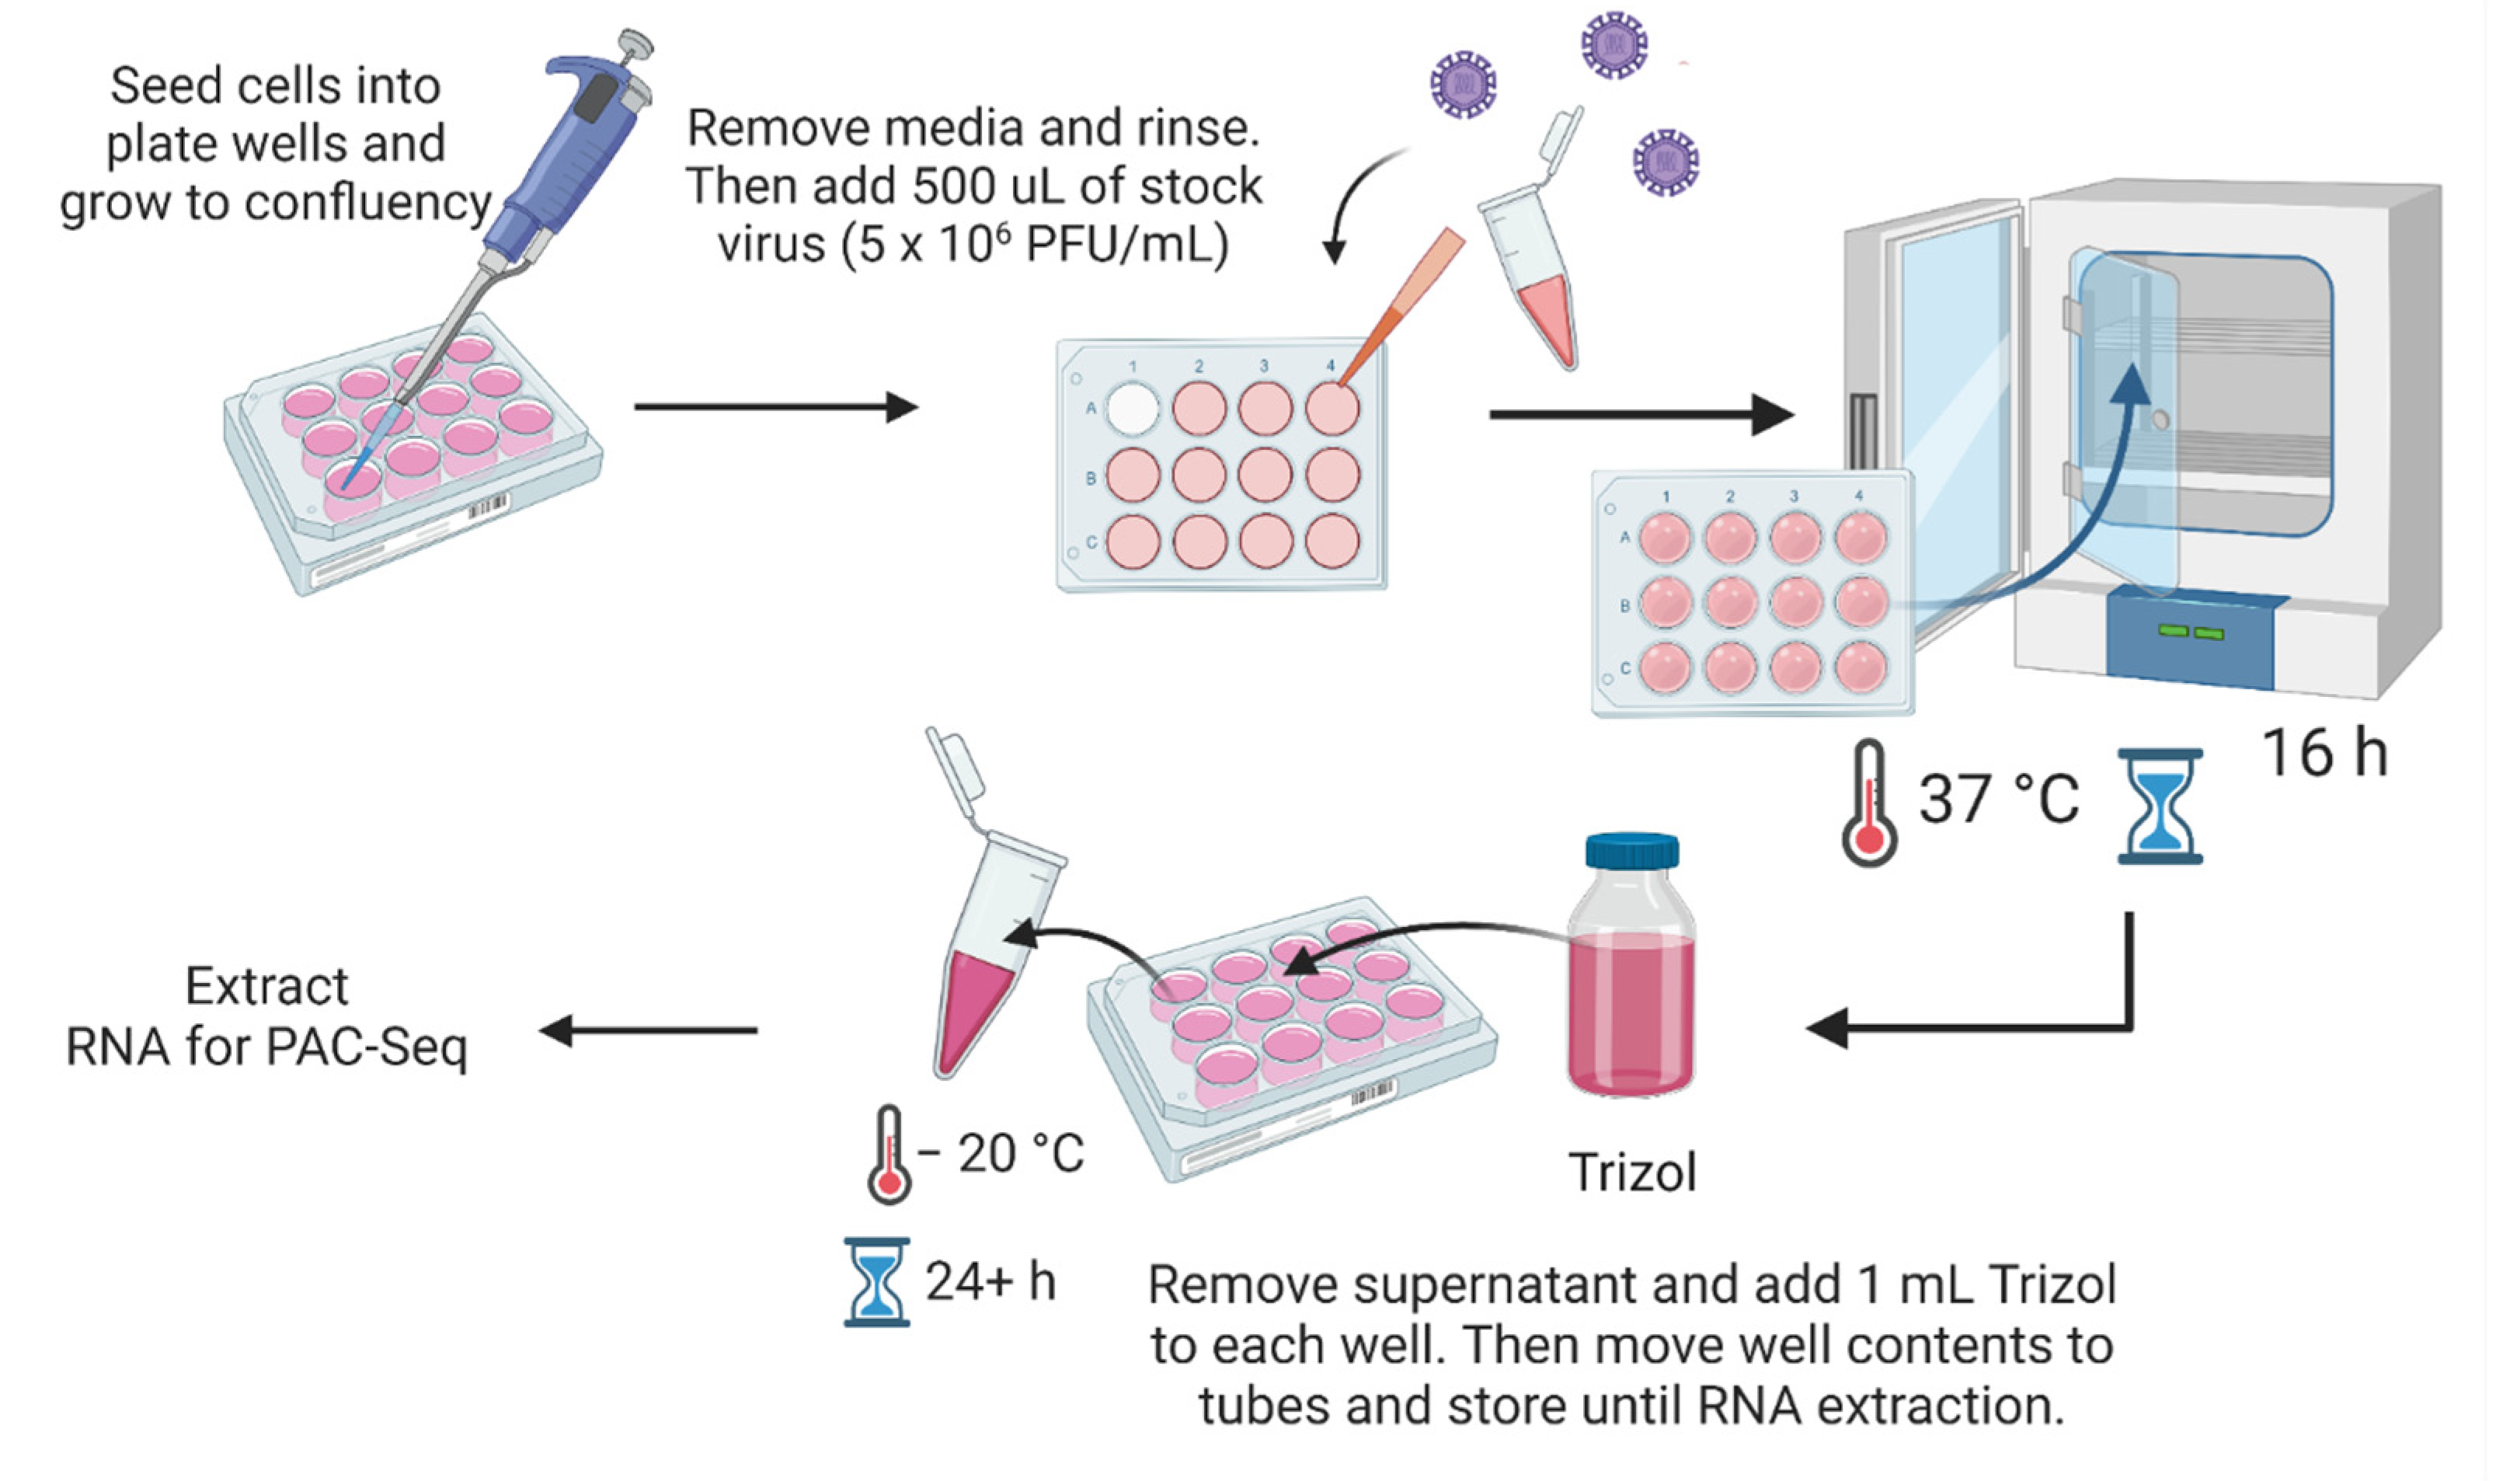
2.3. Viruses and Infections
2.4. RNA Extraction and Library Preparations
2.5. Differential Poly-A Cluster (DPAC) Analysis
2.6. Data and Software Availability
3. Results
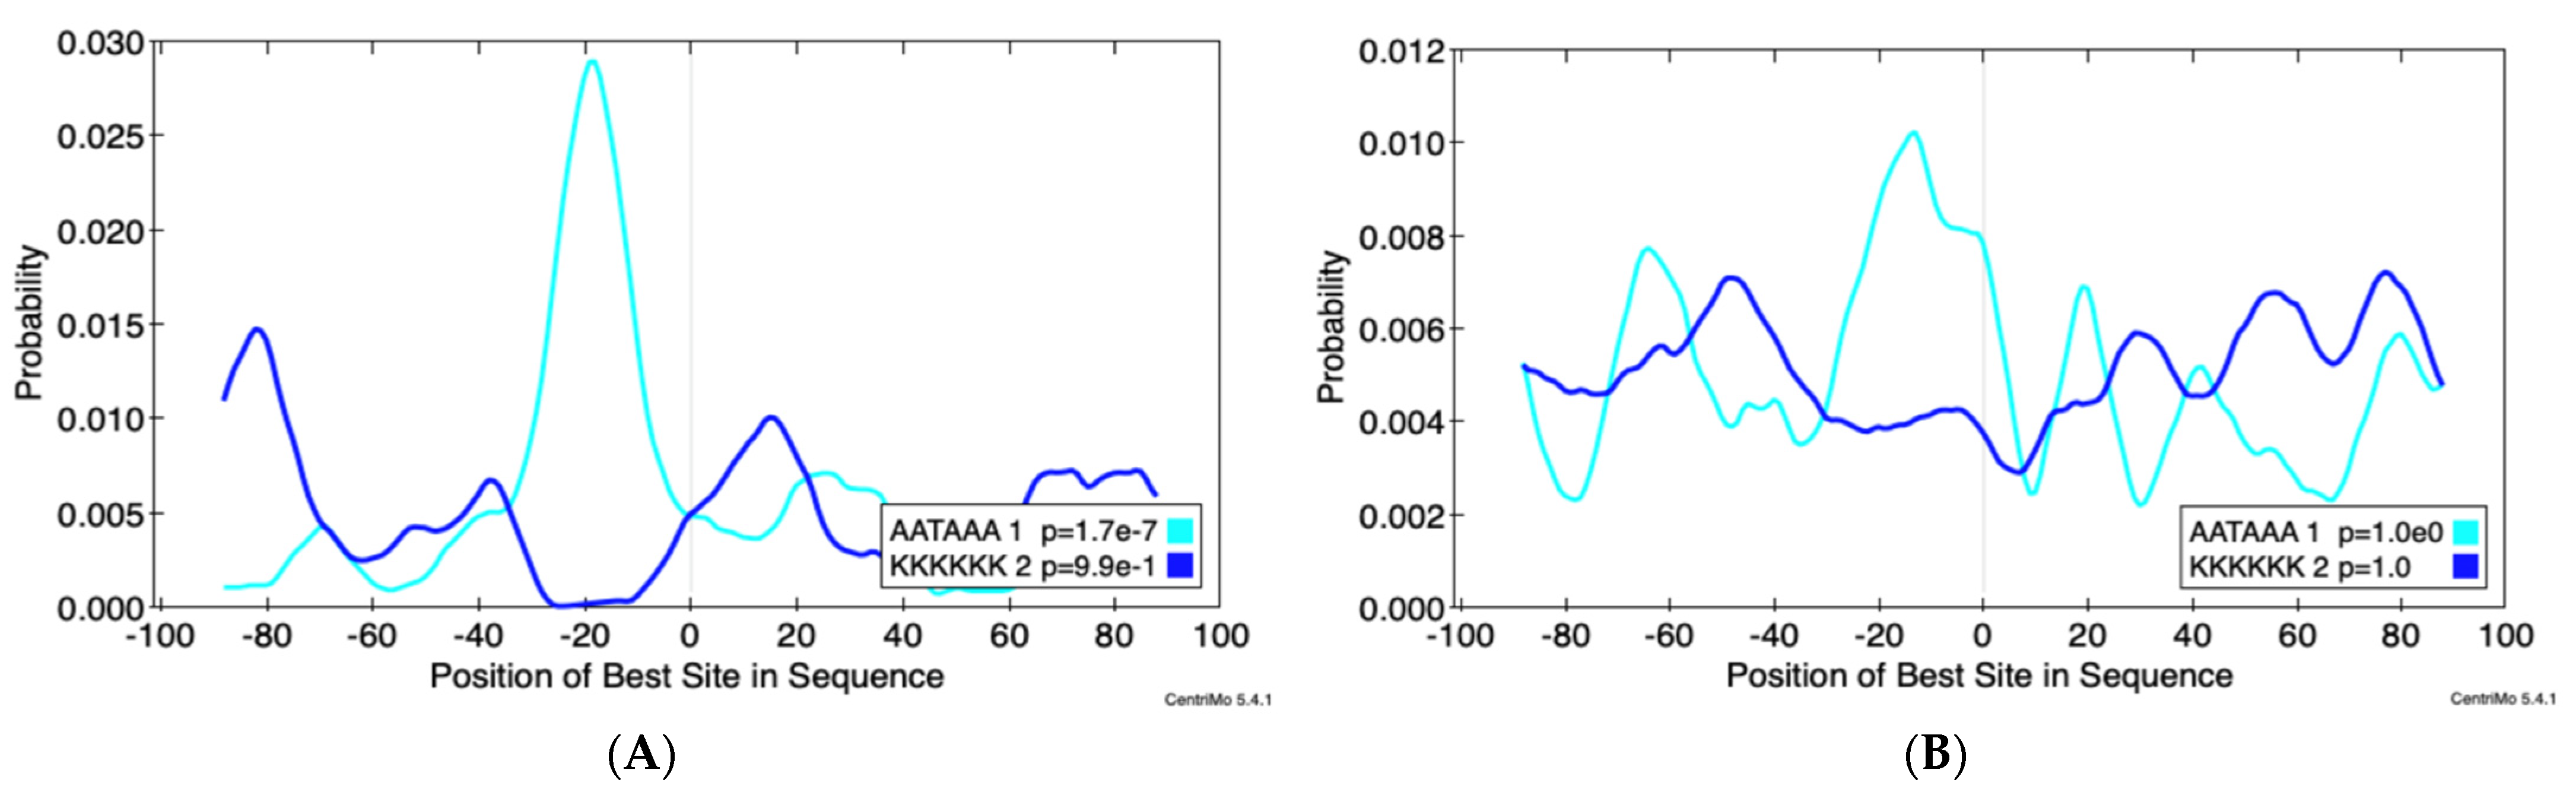
3.1. Updates in Differential Poly(A)-Clustering (DPAC) Pipeline to Report Percent Distal Usage (PDU)
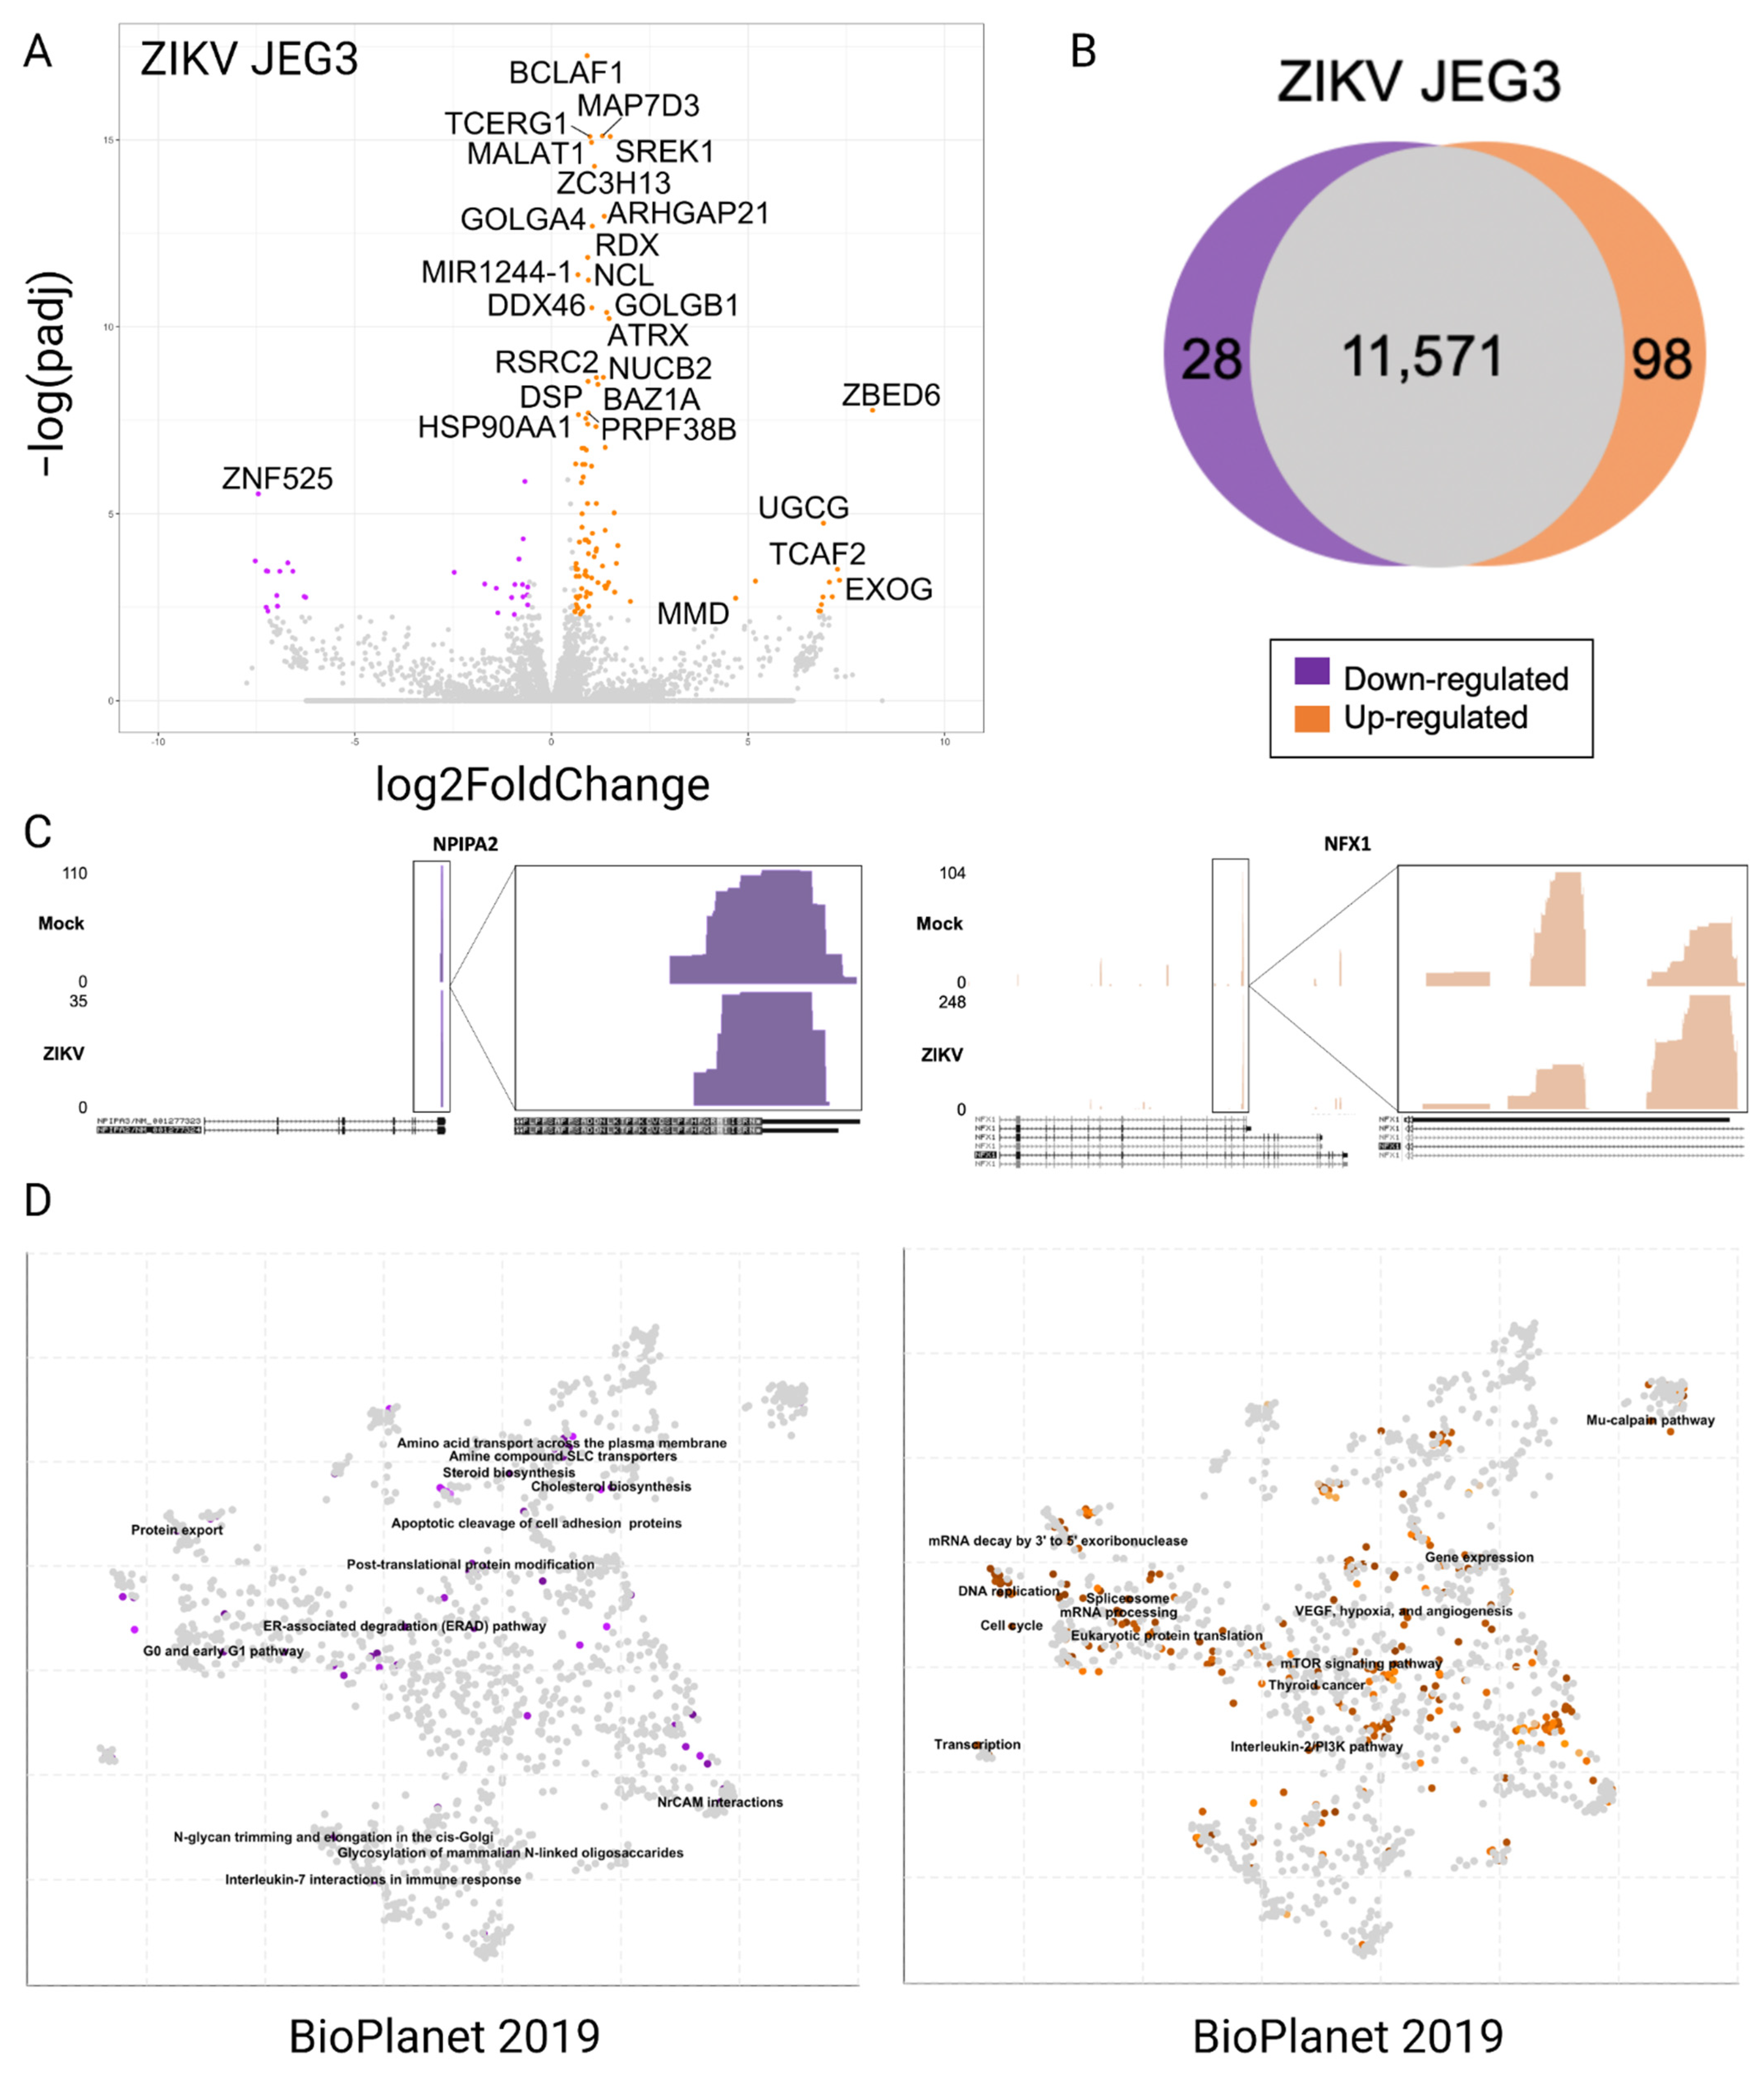
3.2. Differentially Expressed Genes in JEG3 Cells in Response to ZIKV Infection
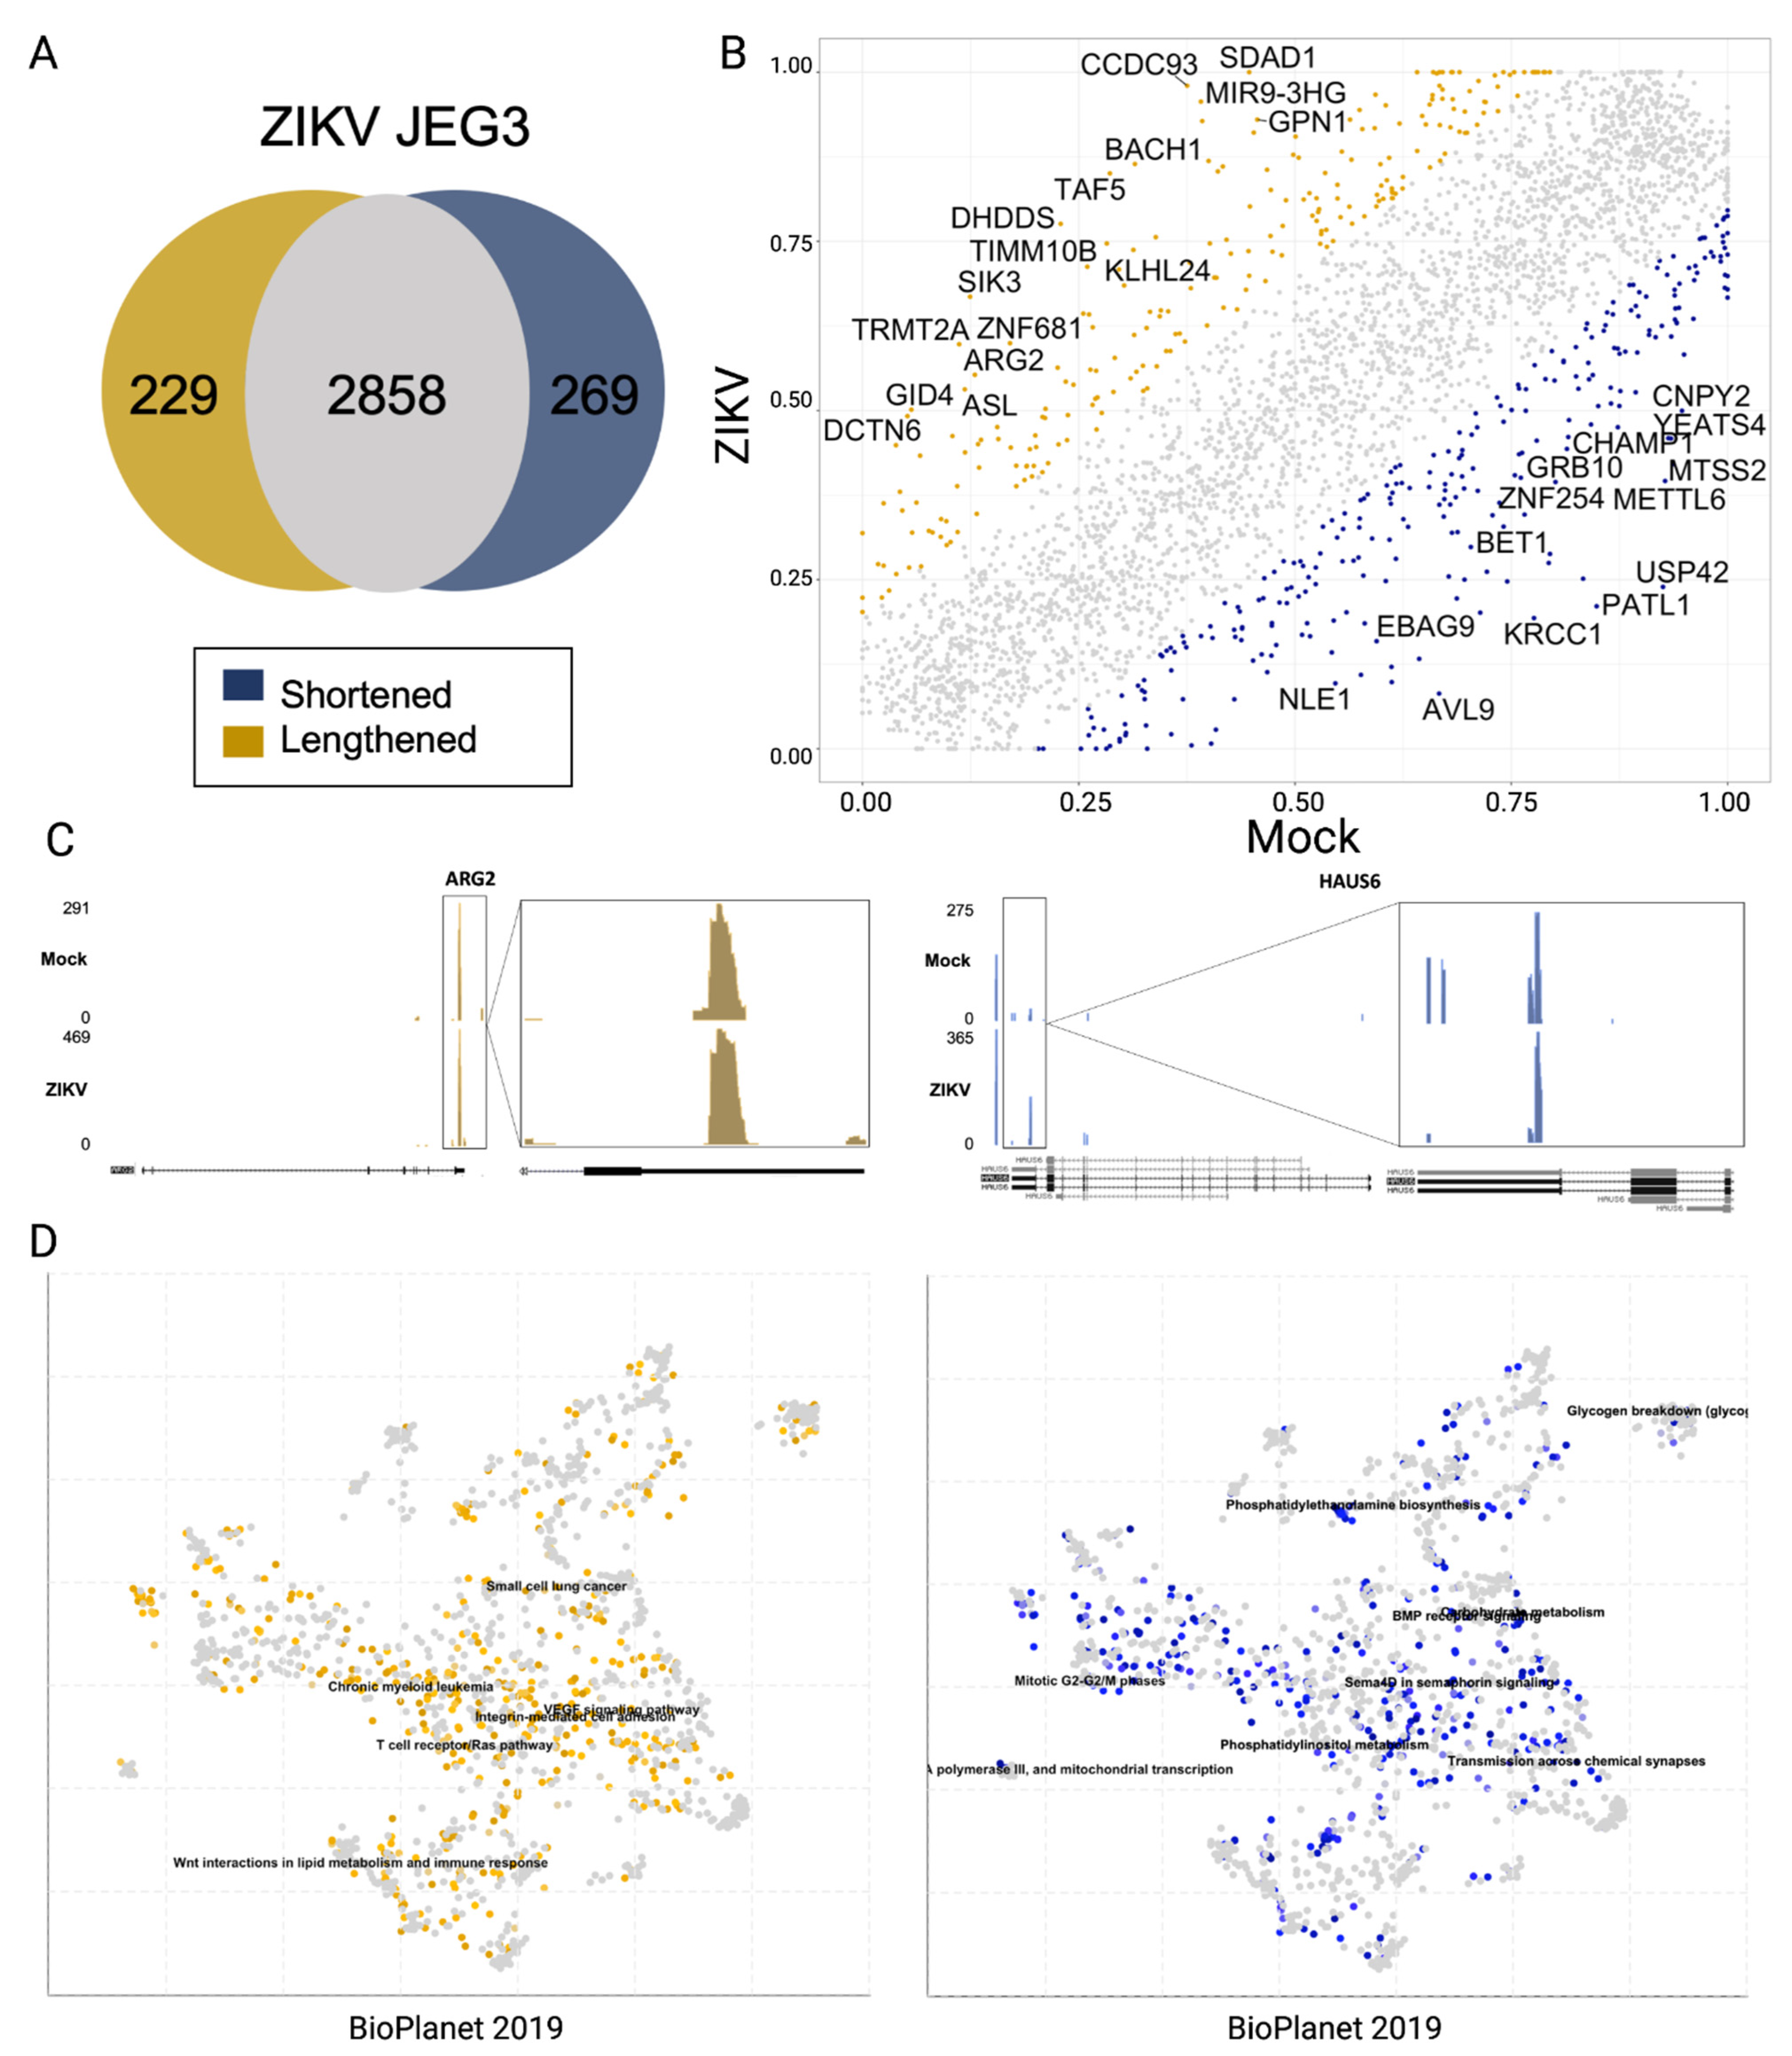
3.3. Alternative Poly-Adenylation in ZIKV Infected JEG3 Cells
4. Discussion
Supplementary Materials
Author Contributions
Funding
Data Availability Statement
Conflicts of Interest
References
- Perera, R.; Khaliq, M.; Kuhn, R.J. Closing the door on flaviviruses: Entry as a target for antiviral drug design. Antiviral. Res. 2008, 80, 11–22. [Google Scholar] [CrossRef] [PubMed]
- Song, B.H.; Yun, S.I.; Woolley, M.; Lee, Y.M. Zika virus: History, epidemiology, transmission, and clinical presentation. J. Neuroimmunol. 2017, 308, 50–64. [Google Scholar] [CrossRef] [PubMed]
- Armstrong, P.M.; Andreadis, T.G.; Shepard, J.J.; Thomas, M.C. Northern range expansion of the Asian tiger mosquito (Aedes albopictus): Analysis of mosquito data from Connecticut, USA. PLoS Negl. Trop. Dis. 2017, 11, e0005623. [Google Scholar] [CrossRef] [PubMed]
- Bartlow, A.W.; Manore, C.; Xu, C.; Kaufeld, K.A.; Del Valle, S.; Ziemann, A.; Fairchild, G.; Fair, J.M. Forecasting Zoonotic Infectious Disease Response to Climate Change: Mosquito Vectors and a Changing Environment. Vet. Sci. 2019, 6, 40. [Google Scholar] [CrossRef] [PubMed]
- Kraemer, M.U.; Sinka, M.E.; Duda, K.A.; Mylne, A.Q.; Shearer, F.M.; Barker, C.M.; Moore, C.G.; Carvalho, R.G.; Coelho, G.E.; Van Bortel, W.; et al. The global distribution of the arbovirus vectors Aedes aegypti and Ae. albopictus. Elife 2015, 4, e08347. [Google Scholar] [CrossRef]
- Kraemer, M.U.G.; Reiner, R.C., Jr.; Brady, O.J.; Messina, J.P.; Gilbert, M.; Pigott, D.M.; Yi, D.; Johnson, K.; Earl, L.; Marczak, L.B.; et al. Past and future spread of the arbovirus vectors Aedes aegypti and Aedes albopictus. Nat. Microbiol. 2019, 4, 854–863. [Google Scholar] [CrossRef]
- CDC. Vaccine Information Statement. Available online: https://www.cdc.gov/vaccines/hcp/vis/vis-statements/yf.html (accessed on 29 July 2022).
- Hadinegoro, S.R.; Arredondo-Garcia, J.L.; Capeding, M.R.; Deseda, C.; Chotpitayasunondh, T.; Dietze, R.; Muhammad Ismail, H.I.; Reynales, H.; Limkittikul, K.; Rivera-Medina, D.M.; et al. Efficacy and Long-Term Safety of a Dengue Vaccine in Regions of Endemic Disease. N. Engl. J. Med. 2015, 373, 1195–1206. [Google Scholar] [CrossRef]
- Villar, L.; Dayan, G.H.; Arredondo-Garcia, J.L.; Rivera, D.M.; Cunha, R.; Deseda, C.; Reynales, H.; Costa, M.S.; Morales-Ramirez, J.O.; Carrasquilla, G.; et al. Efficacy of a tetravalent dengue vaccine in children in Latin America. N. Engl. J. Med. 2015, 372, 113–123. [Google Scholar] [CrossRef]
- Weaver, S.C. Emergence of Epidemic Zika Virus Transmission and Congenital Zika Syndrome: Are Recently Evolved Traits to Blame? MBio 2017, 8, e02063-16. [Google Scholar] [CrossRef]
- Ming, G.L.; Tang, H.; Song, H. Advances in Zika Virus Research: Stem Cell Models, Challenges, and Opportunities. Cell Stem Cell 2016, 19, 690–702. [Google Scholar] [CrossRef]
- Amaral, M.S.; Goulart, E.; Caires-Junior, L.C.; Morales-Vicente, D.A.; Soares-Schanoski, A.; Gomes, R.P.; Olberg, G.G.O.; Astray, R.M.; Kalil, J.E.; Zatz, M.; et al. Differential gene expression elicited by ZIKV infection in trophoblasts from congenital Zika syndrome discordant twins. PLoS Negl. Trop. Dis. 2020, 14, e0008424. [Google Scholar] [CrossRef] [PubMed]
- Chen, Q.; Gouilly, J.; Ferrat, Y.J.; Espino, A.; Glaziou, Q.; Cartron, G.; El Costa, H.; Al-Daccak, R.; Jabrane-Ferrat, N. Metabolic reprogramming by Zika virus provokes inflammation in human placenta. Nat. Commun. 2020, 11, 2967. [Google Scholar] [CrossRef] [PubMed]
- Khaiboullina, S.; Uppal, T.; Kletenkov, K.; St Jeor, S.C.; Garanina, E.; Rizvanov, A.; Verma, S.C. Transcriptome Profiling Reveals Pro-Inflammatory Cytokines and Matrix Metalloproteinase Activation in Zika Virus Infected Human Umbilical Vein Endothelial Cells. Front. Pharmacol. 2019, 10, 642. [Google Scholar] [CrossRef] [PubMed]
- Rabelo, K.; de Souza, L.J.; Salomao, N.G.; Machado, L.N.; Pereira, P.G.; Portari, E.A.; Basilio-de-Oliveira, R.; Dos Santos, F.B.; Neves, L.D.; Morgade, L.F.; et al. Zika Induces Human Placental Damage and Inflammation. Front. Immunol. 2020, 11, 2146. [Google Scholar] [CrossRef]
- Sotcheff, S.; Routh, A. Understanding Flavivirus Capsid Protein Functions: The Tip of the Iceberg. Pathogens 2020, 9, 42. [Google Scholar] [CrossRef]
- Garcia-Blanco, M.A.; Vasudevan, S.G.; Bradrick, S.S.; Nicchitta, C. Flavivirus RNA transactions from viral entry to genome replication. Antiviral. Res. 2016, 134, 244–249. [Google Scholar] [CrossRef]
- Cortese, M.; Goellner, S.; Acosta, E.G.; Neufeldt, C.J.; Oleksiuk, O.; Lampe, M.; Haselmann, U.; Funaya, C.; Schieber, N.; Ronchi, P.; et al. Ultrastructural Characterization of Zika Virus Replication Factories. Cell Rep. 2017, 18, 2113–2123. [Google Scholar] [CrossRef]
- Neufeldt, C.J.; Cortese, M.; Acosta, E.G.; Bartenschlager, R. Rewiring cellular networks by members of the Flaviviridae family. Nat. Rev. Microbiol. 2018, 16, 125–142. [Google Scholar] [CrossRef]
- Bonenfant, G.; Meng, R.; Shotwell, C.; Badu, P.; Payne, A.F.; Ciota, A.T.; Sammons, M.A.; Berglund, J.A.; Pager, C.T. Asian Zika Virus Isolate Significantly Changes the Transcriptional Profile and Alternative RNA Splicing Events in a Neuroblastoma Cell Line. Viruses 2020, 12, 510. [Google Scholar] [CrossRef]
- Etebari, K.; Hegde, S.; Saldana, M.A.; Widen, S.G.; Wood, T.G.; Asgari, S.; Hughes, G.L. Global Transcriptome Analysis. mSphere 2017, 2, e00456-17. [Google Scholar]
- Hu, B.; Huo, Y.; Yang, L.; Chen, G.; Luo, M.; Yang, J.; Zhou, J. ZIKV infection effects changes in gene splicing, isoform composition and lncRNA expression in human neural progenitor cells. Virol. J. 2017, 14, 217. [Google Scholar] [CrossRef] [PubMed]
- Lima, M.C.; de Mendonca, L.R.; Rezende, A.M.; Carrera, R.M.; Anibal-Silva, C.E.; Demers, M.; D’Aiuto, L.; Wood, J.; Chowdari, K.V.; Griffiths, M.; et al. The Transcriptional and Protein Profile From Human Infected Neuroprogenitor Cells Is Strongly Correlated to Zika Virus Microcephaly Cytokines Phenotype Evidencing a Persistent Inflammation in the CNS. Front. Immunol. 2019, 10, 1928. [Google Scholar] [CrossRef] [PubMed]
- Singh, P.K.; Khatri, I.; Jha, A.; Pretto, C.D.; Spindler, K.R.; Arumugaswami, V.; Giri, S.; Kumar, A.; Bhasin, M.K. Determination of system level alterations in host transcriptome due to Zika virus (ZIKV) Infection in retinal pigment epithelium. Sci. Rep. 2018, 8, 11209. [Google Scholar] [CrossRef] [PubMed]
- De Maio, F.A.; Risso, G.; Iglesias, N.G.; Shah, P.; Pozzi, B.; Gebhard, L.G.; Mammi, P.; Mancini, E.; Yanovsky, M.J.; Andino, R.; et al. The Dengue Virus NS5 Protein Intrudes in the Cellular Spliceosome and Modulates Splicing. PLoS Pathog. 2016, 12, e1005841. [Google Scholar] [CrossRef] [PubMed]
- Kovanich, D.; Saisawang, C.; Sittipaisankul, P.; Ramphan, S.; Kalpongnukul, N.; Somparn, P.; Pisitkun, T.; Smith, D.R. Analysis of the Zika and Japanese Encephalitis Virus NS5 Interactomes. J. Proteome. Res. 2019, 18, 3203–3218. [Google Scholar] [CrossRef]
- Giraldo, M.I.; Xia, H.; Aguilera-Aguirre, L.; Hage, A.; van Tol, S.; Shan, C.; Xie, X.; Sturdevant, G.L.; Robertson, S.J.; McNally, K.L.; et al. Envelope protein ubiquitination drives entry and pathogenesis of Zika virus. Nature 2020, 585, 414–419. [Google Scholar] [CrossRef] [PubMed]
- Xia, H.; Luo, H.; Shan, C.; Muruato, A.E.; Nunes, B.T.D.; Medeiros, D.B.A.; Zou, J.; Xie, X.; Giraldo, M.I.; Vasconcelos, P.F.C.; et al. An evolutionary NS1 mutation enhances Zika virus evasion of host interferon induction. Nat. Commun. 2018, 9, 414. [Google Scholar] [CrossRef]
- Elrod, N.D.; Jaworski, E.A.; Ji, P.; Wagner, E.J.; Routh, A. Development of Poly(A)-ClickSeq as a tool enabling simultaneous genome-wide poly(A)-site identification and differential expression analysis. Methods 2019, 155, 20–29. [Google Scholar] [CrossRef]
- Routh, A.; Ji, P.; Jaworski, E.; Xia, Z.; Li, W.; Wagner, E.J. Poly(A)-ClickSeq: Click-chemistry for next-generation 3΄-end sequencing without RNA enrichment or fragmentation. Nucleic Acids Res. 2017, 45, e112. [Google Scholar] [CrossRef]
- Routh, A. DPAC: A Tool for Differential Poly(A)-Cluster Usage from Poly(A)-Targeted RNAseq Data. G3 2019, 9, 1825–1830. [Google Scholar] [CrossRef]
- Shah, A.; Mittleman, B.E.; Gilad, Y.; Li, Y.I. Benchmarking sequencing methods and tools that facilitate the study of alternative polyadenylation. Genome Biol. 2021, 22, 291. [Google Scholar] [CrossRef] [PubMed]
- Yalamanchili, H.K.; Alcott, C.E.; Ji, P.; Wagner, E.J.; Zoghbi, H.Y.; Liu, Z. PolyA-miner: Accurate assessment of differential alternative poly-adenylation from 3’Seq data using vector projections and non-negative matrix factorization. Nucleic Acids Res. 2020, 48, e69. [Google Scholar] [CrossRef] [PubMed]
- Xia, Z.; Donehower, L.A.; Cooper, T.A.; Neilson, J.R.; Wheeler, D.A.; Wagner, E.J.; Li, W. Dynamic analyses of alternative polyadenylation from RNA-seq reveal a 3’-UTR landscape across seven tumour types. Nat. Commun. 2014, 5, 5274. [Google Scholar] [CrossRef]
- Scarborough, A.M.; Flaherty, J.N.; Hunter, O.V.; Liu, K.; Kumar, A.; Xing, C.; Tu, B.P.; Conrad, N.K. SAM homeostasis is regulated by CFI. Elife 2021, 10, e64930. [Google Scholar] [CrossRef]
- Cao, J.; Verma, S.K.; Jaworski, E.; Mohan, S.; Nagasawa, C.K.; Rayavara, K.; Sooter, A.; Miller, S.N.; Holcomb, R.J.; Powell, M.J.; et al. RBFOX2 is critical for maintaining alternative polyadenylation patterns and mitochondrial health in rat myoblasts. Cell Rep. 2021, 37, 109910. [Google Scholar] [CrossRef]
- Kent, W.J.; Sugnet, C.W.; Furey, T.S.; Roskin, K.M.; Pringle, T.H.; Zahler, A.M.; Haussler, D. The human genome browser at UCSC. Genome Res. 2002, 12, 996–1006. [Google Scholar] [CrossRef]
- Chen, E.Y.; Tan, C.M.; Kou, Y.; Duan, Q.; Wang, Z.; Meirelles, G.V.; Clark, N.R.; Ma’ayan, A. Enrichr: Interactive and collaborative HTML5 gene list enrichment analysis tool. BMC Bioinform. 2013, 14, 128. [Google Scholar] [CrossRef] [PubMed]
- Kuleshov, M.V.; Jones, M.R.; Rouillard, A.D.; Fernandez, N.F.; Duan, Q.; Wang, Z.; Koplev, S.; Jenkins, S.L.; Jagodnik, K.M.; Lachmann, A.; et al. Enrichr: A comprehensive gene set enrichment analysis web server 2016 update. Nucleic Acids Res. 2016, 44, W90–W97. [Google Scholar] [CrossRef]
- Xie, Z.; Bailey, A.; Kuleshov, M.V.; Clarke, D.J.B.; Evangelista, J.E.; Jenkins, S.L.; Lachmann, A.; Wojciechowicz, M.L.; Kropiwnicki, E.; Jagodnik, K.M.; et al. Gene Set Knowledge Discovery with Enrichr. Curr. Protoc. 2021, 1, e90. [Google Scholar] [CrossRef] [PubMed]
- Tian, B.; Manley, J.L. Alternative polyadenylation of mRNA precursors. Nat. Rev. Mol. Cell Biol. 2017, 18, 18–30. [Google Scholar] [CrossRef]
- Gulino, A.; di Marcotullio, L.; Ferretti, E.; de Smaele, E.; Screpanti, I. Hedgehog signaling pathway in neural development and disease. Psychoneuroendocrinology 2017, 32 (Suppl. 1), S52–S56. [Google Scholar] [CrossRef] [PubMed]
- Goodrich, L.V.; Scott, M.P. Hedgehog and patched in neural development and disease. Neuron 1998, 21, 1243–1257. [Google Scholar] [CrossRef]
- Bailey, T.L. DREME: Motif discovery in transcription factor ChIP-seq data. Bioinformatics 2011, 27, 1653–1659. [Google Scholar] [CrossRef] [PubMed]
- Cook, K.B.; Kazan, H.; Zuberi, K.; Morris, Q.; Hughes, T.R. RBPDB: A database of RNA-binding specificities. Nucleic Acids Res. 2011, 39, D301–D308. [Google Scholar] [CrossRef] [PubMed]
- Bailey, T.L.; Machanick, P. Inferring direct DNA binding from ChIP-seq. Nucleic Acids Res. 2012, 40, e128. [Google Scholar] [CrossRef] [PubMed]
- Almeida, R.D.N.; Braz-de-Melo, H.A.; Santos, I.O.; Correa, R.; Kobinger, G.P.; Magalhaes, K.G. The Cellular Impact of the ZIKA Virus on Male Reproductive Tract Immunology and Physiology. Cells 2020, 9, 1006. [Google Scholar] [CrossRef]
- Matusali, G.; Houzet, L.; Satie, A.P.; Mahe, D.; Aubry, F.; Couderc, T.; Frouard, J.; Bourgeau, S.; Bensalah, K.; Lavoue, S.; et al. Zika virus infects human testicular tissue and germ cells. J. Clin. Investig. 2018, 128, 4697–4710. [Google Scholar] [CrossRef]
- Belanger, K.; Nutter, C.A.; Li, J.; Yu, P.; Kuyumcu-Martinez, M.N. A developmentally regulated spliced variant of PTBP1 is upregulated in type 1 diabetic hearts. Biochem. Biophys. Res. Commun. 2019, 509, 384–389. [Google Scholar] [CrossRef]
- Jacko, M.; Weyn-Vanhentenryck, S.M.; Smerdon, J.W.; Yan, R.; Feng, H.; Williams, D.J.; Pai, J.; Xu, K.; Wichterle, H.; Zhang, C. Rbfox Splicing Factors Promote Neuronal Maturation and Axon Initial Segment Assembly. Neuron 2018, 97, 853–868.e856. [Google Scholar] [CrossRef]
- Cao, J.; Jaworski, E.; Rayavara, K.; Belanger, K.; Sooter, A.; Miller, S.; Verma, S.; Ji, P.; Elrod, N.; Wagner, E.J.; et al. RBFOX2 is critical for maintaining alternative polyadenylation and mitochondrial health in myoblasts. bioRxiv 2020. [Google Scholar]
- Misra, C.; Bangru, S.; Lin, F.; Lam, K.; Koenig, S.N.; Lubbers, E.R.; Hedhli, J.; Murphy, N.P.; Parker, D.J.; Dobrucki, L.W.; et al. Aberrant Expression of a Non-muscle RBFOX2 Isoform Triggers Cardiac Conduction Defects in Myotonic Dystrophy. Dev. Cell 2020, 52, 748–763.e746. [Google Scholar] [CrossRef] [PubMed]


| −1 < PDUI < −0.1 | −1 < PDUI < −0.1 | −1 < PDUI < −0.1 | PDUI Not Calculated | |
|---|---|---|---|---|
| “Shortened” | 327 | 31 | 0 | 43 |
| “Both” | 184 | 62 | 11 | 12 |
| “Lengthened” | 0 | 11 | 50 | 19 |
| “No Change” | 436 | 1289 | 192 | 8958 |
Publisher’s Note: MDPI stays neutral with regard to jurisdictional claims in published maps and institutional affiliations. |
© 2022 by the authors. Licensee MDPI, Basel, Switzerland. This article is an open access article distributed under the terms and conditions of the Creative Commons Attribution (CC BY) license (https://creativecommons.org/licenses/by/4.0/).
Share and Cite
Sotcheff, S.L.; Chen, J.Y.-C.; Elrod, N.; Cao, J.; Jaworski, E.; Kuyumcu-Martinez, M.N.; Shi, P.-Y.; Routh, A.L. Zika Virus Infection Alters Gene Expression and Poly-Adenylation Patterns in Placental Cells. Pathogens 2022, 11, 936. https://doi.org/10.3390/pathogens11080936
Sotcheff SL, Chen JY-C, Elrod N, Cao J, Jaworski E, Kuyumcu-Martinez MN, Shi P-Y, Routh AL. Zika Virus Infection Alters Gene Expression and Poly-Adenylation Patterns in Placental Cells. Pathogens. 2022; 11(8):936. https://doi.org/10.3390/pathogens11080936
Chicago/Turabian StyleSotcheff, Stephanea L., John Yun-Chung Chen, Nathan Elrod, Jun Cao, Elizabeth Jaworski, Mugé N. Kuyumcu-Martinez, Pei-Yong Shi, and Andrew L. Routh. 2022. "Zika Virus Infection Alters Gene Expression and Poly-Adenylation Patterns in Placental Cells" Pathogens 11, no. 8: 936. https://doi.org/10.3390/pathogens11080936
APA StyleSotcheff, S. L., Chen, J. Y.-C., Elrod, N., Cao, J., Jaworski, E., Kuyumcu-Martinez, M. N., Shi, P.-Y., & Routh, A. L. (2022). Zika Virus Infection Alters Gene Expression and Poly-Adenylation Patterns in Placental Cells. Pathogens, 11(8), 936. https://doi.org/10.3390/pathogens11080936