Article

Performance of Loop-Mediated Isothermal Amplification Technique in Milk Samples for the Diagnosis of Bovine Tuberculosis in Dairy Cattle Using a Bayesian Approach

by
Tawatchai Singhla
,
Surachai Pikulkaew
and
Sukolrat Boonyayatra
*
Department of Food Animal Clinic, Faculty of Veterinary Medicine, Chiang Mai University, Chiang Mai 50100, Thailand
*
Author to whom correspondence should be addressed.
Pathogens 2022, 11(5), 573; https://doi.org/10.3390/pathogens11050573
Submission received: 11 April 2022 / Revised: 6 May 2022 / Accepted: 11 May 2022 / Published: 12 May 2022

Abstract

:
This study aimed to estimate the sensitivity (Se) and specificity (Sp) of loop-mediated isothermal amplification (LAMP) and single intradermal tuberculin (SIT) tests for the diagnosis of bovine tuberculosis (bTB) in dairy cattle in Thailand using a Bayesian approach. The SIT test was performed in 203 lactating dairy cattle from nine dairy farms located in Chiang Mai province, Thailand. Milk samples were collected for the LAMP test. Kappa analysis was performed to determine the agreement between the two tests. A one-population conditional independence Bayesian model was applied to estimate the Se and Sp of the two tests. Of 203 dairy cattle, 2 were positive for the SIT test using standard interpretation, whereas 38 were positive for the LAMP test. A poor agreement (kappa = 0) was observed between the two tests. The median Se and Sp of the SIT test using standard interpretation were 63.5% and 99.1%, respectively. The median Se and Sp of the LAMP test were 67.2% and 82.0%, respectively. The estimated true prevalence of bTB was 3.7%. The LAMP test with milk samples can potentially be used as a non-invasive screening test for the diagnosis of bTB in dairy cattle.

1. Introduction

Bovine tuberculosis (bTB) is caused by Mycobacterium bovis (M. bovis), which is a member of the Mycobacterium tuberculosis complex. Domestic and wild animals, especially beef and dairy cattle, can also be infected with the bacterium. Moreover, M. bovis can be transmitted to humans as a neglected zoonotic disease, and it can result in economic losses worldwide [1]. The World Health Organization reported that the number of new cases of human zoonotic tuberculosis caused by M. bovis in 2017 was 142,000, with over 12,500 deaths, mainly in Africa and Southeast Asia [2]. It has been estimated that bTB causes annual losses of approximately USD 3 billion in the livestock economy worldwide [3].
The success of the bTB eradication program depends on the accuracy of the diagnostic test and removal of infected animals. Single intradermal tuberculin (SIT) tests are generally used for bTB diagnosis in live animals in many countries. The SIT test is based on the detection of the cell-mediated immune (CMI) response and is performed by inoculating bovine purified protein derivative (PPD) into the skin of animals. The test results are interpreted by measuring the difference in skin thickness before and after inoculation [4]. This technique is easy and inexpensive to perform. However, the SIT test is a laborious technique, and its accuracy varies with sensitivity (Se) and specificity (Sp) with ranges of 43.2–96.8% and 82.9–99.0%, respectively [4,5]. Moreover, the test results can be influenced by cross-reactions with other mycobacteria and host response variation [6].
Molecular techniques have been increasingly used to enhance the accuracy of bTB diagnoses [7]. Polymerase chain reaction (PCR) is a fast and highly sensitive technique that has been widely used for bTB detection. However, this technique should be performed as a post-mortem diagnostic test and requires a well-equipped laboratory [8]. Loop-mediated isothermal amplification (LAMP) is another method developed for the diagnosis of several diseases in animals, including brucellosis and leptospirosis [9,10]. The LAMP technique does not require expensive equipment. Moreover, the procedure is rapid and easy to perform with incubation at a constant temperature. This method could detect M. bovis genomic DNA as low as 10 copies within 40 min [11]. Several studies have reported the development of LAMP for the detection of pathogens causing various diseases in bovine milk, such as brucellosis and mycoplasma mastitis [9,12]. However, the performance of this method in the detection of M. bovis in raw milk has not been assessed.
The accuracy of a diagnostic test is generally evaluated by comparing the results with those of a gold standard or a reference test. However, in many situations, the results of the gold standard are unavailable. To address this problem, Bayesian latent class modeling can be used to determine the efficacy of a diagnostic test. The Bayesian approach has been increasingly applied to many novel diagnostic tests for various diseases [13,14,15]. Therefore, this study aimed to estimate the Se and Sp of LAMP performed in raw milk and SIT tests using a Bayesian approach.

2. Results

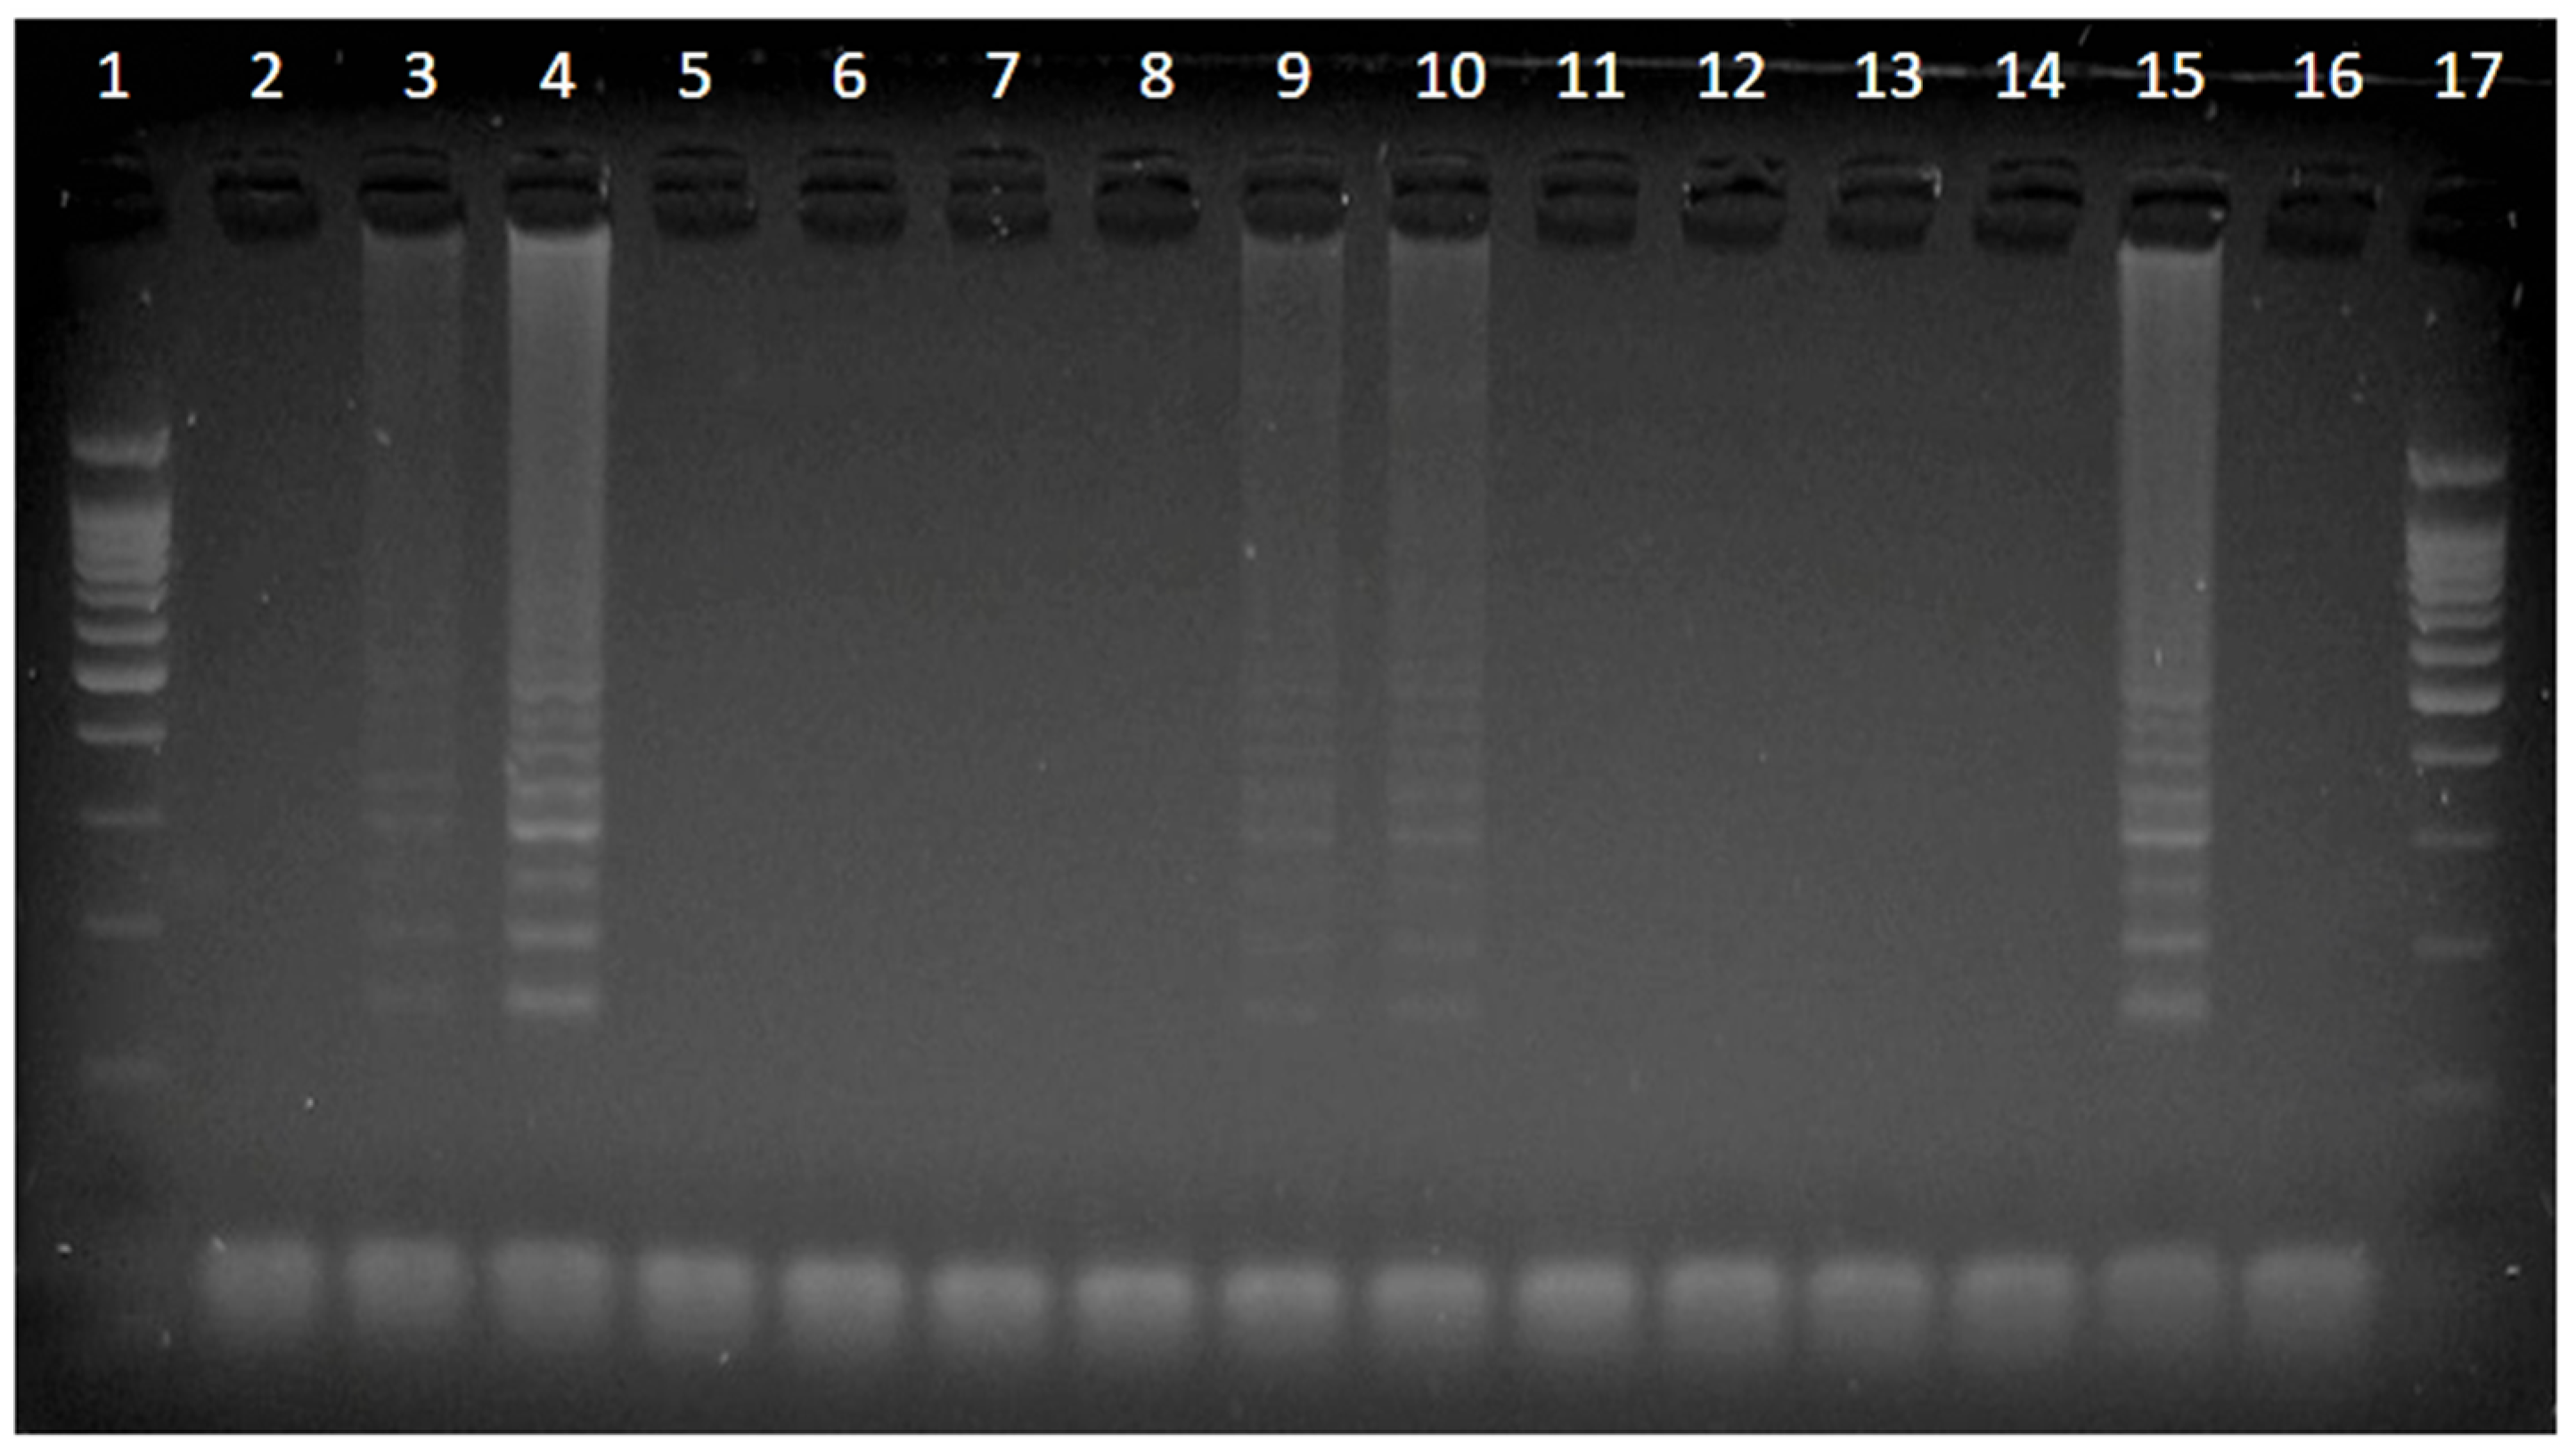
2.1. bTB Detection Using SIT and LAMP Tests

Of 203 dairy cows, 2 (1%) and 13 (6.4%) were SIT-positive using the standard and severe interpretations, respectively. Compared with the SIT test, a higher proportion of positive results was detected among the study animals using the LAMP test (38/203, 18.7%) (Table 1). The agreement between the LAMP test and the SIT test using both standard (kappa = 0) and severe interpretations (kappa = 0.13) was poor.

2.2. Test Performance of SIT and LAMP Tests

The posterior estimates for the Se of the SIT test were 63.5% (95% posterior probability interval (PPI) = 42.1–81.9%) and 76.1% (95% PPI = 55.7–90.9%) when standard and severe interpretations were applied, respectively. The posterior estimates of the Se of the SIT were lower than the prior estimates. The posterior estimates for the Sp of the SIT test were similar to their prior estimates, regardless of the standard (99.1%) and severe interpretations (96.0%) (Table 2 and Table 3).
The posterior estimates for the Se of the LAMP test were 67.2% (95% PPI = 40.5–88.4%) and 68.8% (95% PPI = 44.8–88.9%) when analyzed in the models with the standard and severe interpretations of the SIT test results, respectively. The posterior estimates for the Sp of the LAMP test were 82.0% (95% PPI = 76.1–87.1%) and 84.1% (95% PPI = 78.2–89.2%) when analyzed in the models with the standard and severe interpretations of the SIT test results, respectively. The posterior estimates of the Sp in the LAMP test were lower than the prior estimates.
The posterior estimates of the true prevalence of bTB in dairy cattle were lower than the prior estimates and varied depending on the interpretation criteria used for the SIT test results, with median values ranging from 1.4% (standard interpretation) to 12.1% (severe interpretation) (Table 2 and Table 3, respectively).
After a visual inspection of the Gelman–Rubin diagnostic plot, the final model converged properly, and autocorrelation was eliminated after omission of the first 10,000 iterations. For the sensitivity analyses, there was no appreciable effect (change > 25% of the median value) in the posterior estimates for the Se of the LAMP test and the Sp of both tests when non-informative distributions were used as priors for any parameter. This finding is interpreted as evidence of the robustness of the model. However, a larger change in the posterior estimates for the SIT test using the standard interpretation (67.2%–26.2%) and severe interpretation (76.1%–35.3%) was observed. Similarly, the prevalence estimates of bTB in the dairy cattle population decreased from 3.7% to 0.7% for the SIT test using standard interpretation and from 6.7% to 4.6% for the SIT test using severe interpretation when a non-informative prior was used. Therefore, these results suggest that these parameter priors have strong effects on the model.

3. Discussion

The present study assessed the performance of a bTB screening test routinely used in the national bTB control program (SIT test) in Thailand and an alternative molecular technique (LAMP test) performed in milk samples using a Bayesian approach. A one-population model was chosen for the analysis because the screening tests were performed in infected dairy herds located in the same region and with similar management practices. Therefore, considering all dairy cattle as a single population is reasonable, as assumed in previous studies [5,16].
In general, the main route of infection of M. bovis in cattle is via inhalation. Therefore, bTB lesions are mostly found in the respiratory tract, such as the lungs and associated lymph nodes. However, the pathogen can spread via lymphatic ducts and enter other lymph nodes, such as mesenteric and supramammary lymph nodes, which consequently causes the presence of M. bovis in bovine milk [1]. The current study reported a higher bTB detection rate when the LAMP technique was used to detect M. bovis DNA in milk than when the SIT test was used. A study in India reported the successful isolation of M. bovis from milk samples of cows [17]. Moreover, a study in Brazil suggested the detection of M. bovis in the milk samples of cattle with negative results of intradermal tuberculin tests when multiplex PCR was applied [18]. These previous studies, together with the results from the present study, confirm that M. bovis can contaminate the milk of infected cows, even though some of them showed negative reactions to the intradermal tuberculin test. This phenomenon might explain the disagreement between the LAMP and SIT tests observed in the current study.
SIT tests are generally performed to control or eradicate bTB worldwide. The test performance indicated that Se and Sp can differ between standard and severe interpretations. Using the standard interpretation, the current study reported the Se of SIT to be 63.5%, which is similar to previous findings in Australia (63.2%) [19] and Thailand (62.4%) [5]. When a severe interpretation was used for the SIT test, a higher Se of 76.1% was estimated in the present study. This finding is similar to a study in Spain reporting the Se of the SIT test to be 69.4% for severe interpretation and 56.6% for standard interpretation [16]. In contrast to Se, the Sp of the SIT test was reported to be high: 99.1% for the standard interpretation and 96% for the severe interpretation. This finding is similar to results previously reported in low-prevalence areas, which range from 83.6% to 100% [16,19]. Both the size of the skin test response and pathological lesions are positively associated with the stage of infection [4,20]. The test-and-slaughter policy has been implemented in Thai dairy cattle for a decade. In some areas, SIT reactors have been continually removed from infected herds. Therefore, animals with advanced stages of infection are rare in dairy herds. This could decrease the Se and increase the Sp of the SIT test when the standard interpretation (inconclusive results defined as negative) is used.
Using a Bayesian approach, the Se estimates of the LAMP test (67.2–68.8%) agree with the Se of the SIT test. However, the Sp estimates of the LAMP test (82–84.1%) have been reported to be lower than those of the SIT test. A previous study reported that the LAMP test had a high Se and yielded 100% positive results when the test was performed on samples from SIT-positive animals [21]. Moreover, Zhang et al. demonstrated that the LAMP test can detect the DNA of M. bovis without any cross-reaction with other mycobacterial DNA, indicating a high Sp of the test [22]. However, the performance of the LAMP test may be affected by the high concentration of calcium ions in milk, which can competitively bind to DNA polymerases with magnesium ions, a necessary cofactor for the reaction [23]. Additionally, prior estimates of disease prevalence given in the current study are based on the reports of previous surveys using only the SIT test. Therefore, the prior estimate of disease prevalence could potentially be underestimated, which could influence the estimation of Se and Sp in both tests.
Currently, the national bTB eradication program using the test-and-cull policy has been implemented in dairy cattle in Thailand. However, administrating SIT to all adult dairy cattle in all herds every year is very labor intensive, costly, and time consuming. Based on our findings, we suggest the use of the LAMP technique as a screening test performed with individual cow’s milk prior to the SIT. For those cattle whose milk samples are LAMP-positive, they should be considered as infected animals and removed from the herd without performing SIT. This strategy can reduce the number of animals required to be tested with SIT by testing only lactating cows with negative LAMP results and non-lactating animals. Moreover, the application of SIT has a limitation on the frequency of testing. In general, if an animal is injected with bovine PPD, that particular animal should not be re-tested with SIT within 60 days after the last injection [24,25,26]. It has been well described that repeated SIT testing in animals infected with M. bovis within a period shorter than 60 days might result in a false-negative result due to the desensitization during this period [24]. Therefore, the progress on the eradication of bTB from an infected herd can be prolonged. In contrast, LAMP with milk samples can be performed many times without limitation. In short, the use of LAMP can potentially improve the progress and success of the bTB control and eradication programs in the country.

4. Materials and Methods

4.1. Study Population

The study was conducted between April and October, 2016. Nine dairy herds with a history of SIT-positive cattle from the Chiang Mai province of Thailand were selected for this study. These herds were previously considered to be bTB-infected based on the presence of at least one SIT-positive animal on the farm during 2011–2015. These farms were smallholder dairy farms with 20–60 lactating cows. Dairy cattle raised on these farms were mixed Holstein Friesian. Three farms used tied stalls, whereas the other six farms adopted free stalls for farm management.
This study was approved by the Animal Use Ethics Committee of the Faculty of Veterinary Medicine at Chiang Mai University (S30/2559). All farm owners were informed of the study and provided consent before participation.

4.2. SIT Test

The caudal fold SIT test was performed by the staff of the Thai Department of Livestock Development as part of the regular annual testing of bTB in dairy cattle. Briefly, bovine PPD (Bovituber® PPD, Synbiotics, Lyon, France) was applied to all adult dairy cattle (age > 1 year) in each herd. The caudal-fold SIT test was performed on dairy cattle by an intradermal injection of 0.1 mL of bovine PPD (2000 IU). The skin thickness at the inoculation site was measured pre- and 72 h post-injection using calipers. Interpretations of the test results were performed according to the Thai agricultural standard for screening tests for bTB [27]. The results were defined as positive when the increase in the skinfold thickness at the inoculation site was >5 mm and/or signs of swelling, edema, exudation, necrosis, and/or inflammation were observed; inconclusive when the increase in the skinfold thickness was 2–5 mm and clinical signs at the inoculation site were not observed; and negative when the skinfold thickness increased by <2 mm and clinical lesions at the injection site were not observed. Depending on the interpretation used, inconclusive animals were considered positive (severe interpretation) or negative (standard interpretation) for the data analysis.

4.3. Milk Sample Collection

A total of 203 lactating dairy cows from all nine herds were randomly selected for the study. A composite milk sample from each cow was aseptically collected as described by the National Mastitis Council [28]. Briefly, the udders and teats of the cows were washed and dried. Several streams of foremilk were discarded from all four quarters. The teat end was scrubbed using a cotton ball soaked in 70% alcohol. Milk samples were collected from all quarters into the same labeled test tube. Milk samples were kept in an icebox and transferred to the Central Laboratory of the Faculty of Veterinary Medicine, Chiang Mai University.

4.4. Genomic DNA Extraction from Milk

Genomic DNA was extracted from the milk samples using the NucleoSpin® Tissue kit (MACHEREY-NAGEL GmbH&KG, Düren, Germany). Briefly, 10 mL of the milk sample was centrifuged at 8000× g for 5 min. The supernatant was discarded, and the pellet was added to 180 µL of buffer T1. Then, 25 µL of proteinase K was added to the pellet. The mixture was then centrifuged and incubated at 56 °C for 1–3 h. After incubation, the mixture was transferred to a spin column and centrifuged at 11,000× g for 1 min. The flow-through solution was discarded. The column was washed by adding 500 µL of buffer BW and spinning at 11,000× g for 1 min. After the centrifugation, the flow-through solution was discarded, and the column was washed again using 500 µL of buffer B5 followed by centrifugation at 11,000× g for 1 min. The column was again centrifuged at 11,000× g for 1 min in order to dry the column. The column was transferred to a 1.5 mL microcentrifuge tube. To elute DNA, 100 µL of BE buffer was added to the column, incubated at room temperature for 1 min, and centrifuged at 11,000× g for 1 min. The extracted DNA was stored at −20 °C until use.

4.5. LAMP Test

The LAMP reaction was previously performed by mixing 2.6 µL of extracted genomic DNA with 12.4 µL of the reaction solution composed of 10 mM MgSO4, 1 M Betaine, 0.6 mM dNTPs, 1.6 µM of inner primers (FIP, BIP), 0.2 µM of outer primers (F3, B3), 1X ThermoPol buffer (20 mM Tris-HCl (pH 8.8), 10 mM KCl, 10 mM (NH4)2SO4, 0.1% Triton X-100), and 8 U of Bst DNA polymerase (Lucigen®, Lucigen, WI, USA). The primers used in this study were designed by Hong et al. [25] and are listed in Table 4. The reaction was started at 65 °C for 60 min and stopped at 80 °C for 2 min. Then, 5 µL of each of the LAMP products was analyzed using 2% agarose gel electrophoresis and stained with ethidium bromide. Samples were considered positive when a ladder-like band pattern was observed (Figure 1).

4.6. Sensitivity and Specificity Estimations

The agreement between the SIT and LAMP test results was assessed using Cohen’s kappa analysis. The agreement was interpreted as a slight, fair, moderate, substantial, and almost perfect agreement when the estimated kappa values were 0–0.20, 0.21–0.40, 0.41–0.60, 0.61–0.80, and over 0.80, respectively [30].
The characteristics of the SIT and LAMP tests for the detection of bTB in milk samples and the true prevalence of the disease were analyzed using Bayesian latent class analysis. The Bayesian model assumes that, for the k populations, the counts (Yk) of the different combinations of test results, such as +/+, +/−, −/+, and −/− for the two tests follow a multinomial distribution: Yk | Pqrk ~ multinomial (nk, {Pqrk}), where qr is the multinomial cell probability for the two-test outcome combination, and Pqrk is a vector of probabilities of observing the individual combinations of test results. Priors for the Se and Sp of the SIT and LAMP tests and priors for bTB prevalence rates were derived from previous studies and experts’ opinions [5,19,20,31,32]. The most likely value (mode) of each parameter was created from the published report means of the central values. The lowest modal was used as a 95% lower limit for the prior distributions to accommodate for the expected large variability in the test performance. These priors were modeled as beta distributions. Prior estimates for the Se and Sp of the SIT test were considered differently for the standard and severe interpretations as shown in Table 5 and Table 6, respectively. The principle for bTB diagnosis of the SIT test is based on the indirect detection of the CMI response, whereas the LAMP test is based on the direct detection of the pathogen DNA. Therefore, a Bayesian model for two conditionally independent tests was implemented in a single population to evaluate the Se and Sp of each test and true disease prevalence [13]. All analyses were performed in JAGS 4.3.0, using the rjags and R2jags packages in R version 4.1.0 [33,34,35]. Posterior distributions were computed after 100,000 iterations of the models, with the first 10,000 discarded as the burn-in phase.
The convergence of the model was checked by a visual inspection of the Gelman–Rubin diagnostic plot using three sample chains with different initial values [36]. Sensitivity analysis of the model was carried out to evaluate the influence of the prior information and the assumption of conditional independence between the SIT and LAMP tests on the posterior estimates [13,14]. These analyses were performed by replacing each prior with a non-informative uniform 0–1 distribution and comparing the DIC between models with and without the covariance term [13].

5. Conclusions

This study provides estimates of the characteristics of the currently available test for bTB diagnosis in Thailand (SIT test) and an alternative molecular technique (LAMP test) in milk, using a Bayesian approach. The results emphasize the importance of improving the performance of bTB control and eradication programs. Nevertheless, the low number of positive results limits the estimation of the test performance. Therefore, further studies should be performed in larger dairy cattle populations or areas.

Author Contributions

Conceptualization, S.B.; methodology, S.B. and S.P.; formal analysis, T.S.; writing—original draft preparation, T.S.; writing—review and editing, S.B.; supervision, S.B.; project administration, S.B.; funding acquisition, S.B. All authors have read and agreed to the published version of the manuscript.

Funding

This research was funded by Huvepharma Thailand Ltd. through the Faculty of Veterinary Medicine, Chiang Mai University, Thailand (grant number: R000009894).

Institutional Review Board Statement

The animal study protocol was approved by the Animal Use Ethics Committee of the Faculty of Veterinary Medicine at Chiang Mai University (S30/2559).

Data Availability Statement

The data presented in this study are available upon request to the corresponding author.

Acknowledgments

The authors are grateful for the technical support for the laboratory work dedicated by Jarupat Khamcha, Assana Siripat, and Sarawut Saimoh.

Conflicts of Interest

The authors declare no conflict of interest.

References

  1. Ayele, W.Y.; Neill, S.D.; Zinsstag, J.; Weiss, M.G.; Pavlik, I. Bovine Tuberculosis: An Old Disease but a New Threat to Africa. Int. J. Tuberc. Lung Dis. 2004, 8, 924–937. [Google Scholar]
  2. WHO. Global Tuberculosis Report 2018; WHO Document Services: Geneva, Switzerland, 2018. [Google Scholar]
  3. Waters, W.R.; Palmer, M.V.; Buddle, B.M.; Vordermeier, H.M. Bovine Tuberculosis Vaccine Research: Historical Perspectives and Recent Advances. Vaccine 2012, 30, 2611–2622. [Google Scholar] [CrossRef]
  4. De la Rua-Domenech, R.; Goodchild, A.T.; Vordermeier, H.M.; Hewinson, R.G.; Christiansen, K.H.; Clifton-Hadley, R.S. Ante Mortem Diagnosis of Tuberculosis in Cattle: A Review of the Tuberculin Tests, Gamma-Interferon Assay and Other Ancillary Diagnostic Techniques. Res. Vet. Sci. 2006, 81, 190–210. [Google Scholar] [CrossRef]
  5. Singhla, T.; Boonyayatra, S.; Chulakasian, S.; Lukkana, M.; Alvarez, J.; Sreevatsan, S.; Wells, S.J. Determination of the Sensitivity and Specificity of Bovine Tuberculosis Screening Tests in Dairy Herds in Thailand Using a Bayesian Approach. BMC Vet. Res. 2019, 15, 149. [Google Scholar] [CrossRef]
  6. Grabau, J.C.; DiFerdinando, G.T., Jr.; Novick, L.F. False Positive Tuberculosis Skin Test Results. Public Health Rep. 1995, 110, 703–706. [Google Scholar]
  7. Rahman, M.M.; Noor, M.; Islam, K.M.; Uddin, M.B.; Hossain, F.M.; Zinnah, M.A.; Al Mamun, M.; Islam, M.R.; Eo, S.K.; Ashour, H.M. Molecular Diagnosis of Bovine Tuberculosis in Bovine and Human Samples: Implications for Zoonosis. Future Microbiol. 2015, 10, 527–535. [Google Scholar] [CrossRef]
  8. OIE. Bovine Tuberculosis; World Organisation for Animal Health: Paris, France, 2014; Chapter 2.4.7. [Google Scholar]
  9. Song, L.; Li, J.; Hou, S.; Li, X.; Chen, S. Establishment of Loop-Mediated Isothermal Amplification (LAMP) for Rapid Detection of Brucella spp. and Application to Milk and Blood Samples. J. Microbiol. Methods 2012, 90, 292–297. [Google Scholar] [CrossRef]
  10. Suwancharoen, D.; Limlertvatee, S.; Chetiyawan, P.; Tongpan, P.; Sangkaew, N.; Sawaddee, Y.; Inthakan, K.; Wiratsudakul, A. A Nationwide Survey of Pathogenic Leptospires in Urine of Cattle and Buffaloes by Loop-Mediated Isothermal Amplification (LAMP) Method in Thailand, 2011–2013. J. Vet. Med. Sci. 2016, 78, 1495–1500. [Google Scholar] [CrossRef] [Green Version]
  11. Kapalamula, T.F.; Thapa, J.; Akapelwa, M.L.; Hayashida, K.; Gordon, S.V.; Ombe, B.M.H.; Munyeme, M.; Solo, E.S.; Bwalya, P.; Nyenje, M.E.; et al. Development of a loop-mediated isothermal amplification (LAMP) method for specific detection of Mycobacterium bovis. PLoS Negl. Trop. Dis. 2021, 15, e0008996. [Google Scholar] [CrossRef]
  12. Appelt, S.; Aly, S.S.; Tonooka, K.; Glenn, K.; Xue, Z.; Lehenbauer, T.W.; Marco, M.L. Development and Comparison of Loop-Mediated Isothermal Amplification and Quantitative Polymerase Chain Reaction Assays for the Detection of Mycoplasma bovis in Milk. J. Dairy Sci. 2019, 102, 1985–1996. [Google Scholar] [CrossRef]
  13. Branscum, A.J.; Gardner, I.A.; Johnson, W.O. Estimation of Diagnostic-Test Sensitivity and Specificity Through Bayesian Modeling. Prev. Vet. Med. 2005, 68, 145–163. [Google Scholar] [CrossRef]
  14. Rahman, A.K.; Saegerman, C.; Berkvens, D.; Fretin, D.; Gani, M.O.; Ershaduzzaman, M.; Ahmed, M.U.; Emmanuel, A. Bayesian Estimation of True Prevalence, Sensitivity and Specificity of Indirect ELISA, Rose Bengal Test and Slow Agglutination Test for the Diagnosis of Brucellosis in Sheep and Goats in Bangladesh. Prev. Vet. Med. 2013, 110, 242–252. [Google Scholar] [CrossRef]
  15. Singhla, T.; Tankaew, P.; Sthitmatee, N. Validation of a Novel ELISA for the Diagnosis of Hemorrhagic Septicemia in Dairy Cattle From Thailand Using a Bayesian Approach. Vet. Sci. 2020, 7, 163. [Google Scholar] [CrossRef]
  16. Alvarez, J.; Perez, A.; Bezos, J.; Marqués, S.; Grau, A.; Saez, J.L.; Mínguez, O.; de Juan, L.; Domínguez, L. Evaluation of the Sensitivity and Specificity of Bovine Tuberculosis Diagnostic Tests in Naturally Infected Cattle Herds Using a Bayesian Approach. Vet. Microbiol. 2012, 155, 38–43. [Google Scholar] [CrossRef]
  17. Srivastava, K.; Chauhan, D.S.; Gupta, P.; Singh, H.B.; Sharma, V.D.; Yadav, V.S.; Katoch, V.M. Isolation of Mycobacterium bovis and M. tuberculosis from Cattle of Some Farms in North India—Possible Relevance in Human Health. Indian J. Med. Res. 2008, 128, 26–31. [Google Scholar]
  18. Zarden, C.F.; Marassi, C.D.; Figueiredo, E.E.; Lilenbaum, W. Mycobacterium bovis Detection From Milk of Negative Skin Test Cows. Vet. Rec. 2013, 172, 130. [Google Scholar] [CrossRef] [Green Version]
  19. Wood, P.R.; Corner, L.A.; Rothel, J.S.; Baldock, C.; Jones, S.L.; Cousins, D.B.; McCormick, B.S.; Francis, B.R.; Creeper, J.; Tweddle, N.E. Field Comparison of the Interferon-Gamma Assay and the Intradermal Tuberculin Test for the Diagnosis of Bovine Tuberculosis. Aust. Vet. J. 1991, 68, 286–290. [Google Scholar] [CrossRef]
  20. Norby, B.; Bartlett, P.C.; Fitzgerald, S.D.; Granger, L.M.; Bruning-Fann, C.S.; Whipple, D.L.; Payeur, J.B. The Sensitivity of Gross Necropsy, Caudal Fold and Comparative Cervical Tests for the Diagnosis of Bovine Tuberculosis. J. Vet. Diagn. Investig. 2004, 16, 126–131. [Google Scholar] [CrossRef] [Green Version]
  21. Zhang, J.; Zhang, G.H.; Yang, L.; Huang, R.; Zhang, Y.; Jia, K.; Yuan, W.; Li, S.J. Development of a Loop-Mediated Isothermal Amplification Assay for the Detection of Mycobacterium bovis. Vet. J. 2011, 187, 393–396. [Google Scholar] [CrossRef]
  22. Zhang, H.; Wang, Z.; Cao, X.; Wang, Z.; Sheng, J.; Wang, Y.; Zhang, J.; Li, Z.; Gu, X.; Chen, C. Loop-Mediated Isothermal Amplification Assay Targeting the mpb70 Gene for Rapid Differential Detection of Mycobacterium bovis. Arch. Microbiol. 2016, 198, 905–911. [Google Scholar] [CrossRef]
  23. Moon, Y.J.; Lee, S.Y.; Oh, S.W. A Review of Isothermal Amplification Methods and Food-Origin Inhibitors Against Detecting Food-borne Pathogens. Foods 2022, 11, 322. [Google Scholar] [CrossRef]
  24. Monaghan, M.L.; Doherty, M.L.; Collins, J.D.; Kazda, J.F.; Quinn, P.J. The tuberculin test. Vet. Microbiol. 1994, 40, 111–124. [Google Scholar] [CrossRef]
  25. Thom, M.L.; Morgan, J.H.; Hope, J.C.; Villarreal-Ramos, B.; Martin, M.; Howard, C.J. The effect of repeated tuberculin skin testing of cattle on immune responses and disease following experimental infection with Mycobacterium bovis. Vet. Immunol. Immunopathol. 2004, 102, 399–412. [Google Scholar] [CrossRef]
  26. Coad, M.; Clifford, D.; Rhodes, S.G.; Hewinson, R.G.; Vordermeier, H.M.; Whelan, A.O. Repeat tuberculin skin testing leads to desensitisation in naturally infected tuberculous cattle which is associated with elevated interleukin-10 and decreased interleukin-1 beta responses. Vet. Res. 2010, 41, 14. [Google Scholar] [CrossRef] [Green Version]
  27. Ministry of Agricultural and Cooperatives. Diagnostic Test of Bovine Tuberculosis; Royal Gazette: Bangkok, Thailand, 2004.
  28. Oliver, S.P.; Gonzalez, R.N.; Hogan, J.S.; Jayarao, B.M.; Owens, W.E. Microbiological Procedures for the Diagnosis of Bovine Udder Infection and Determination of Milk Quality, 4th ed.; National Mastitis Council: Verona, WI, USA, 2004. [Google Scholar]
  29. Hong, M.; Zha, L.; Fu, W.; Zou, M.; Li, W.; Xu, D. A Modified Visual Loop-Mediated Isothermal Amplification Method for Diagnosis and Differentiation of Main Pathogens From Mycobacterium tuberculosis Complex. World J. Microbiol. Biotechnol. 2012, 28, 523–531. [Google Scholar] [CrossRef]
  30. Landis, J.R.; Koch, G.G. The Measurement of Observer Agreement for Categorical Data. Biometrics 1977, 33, 159–174. [Google Scholar] [CrossRef] [Green Version]
  31. Whipple, D.L.; Palmer, M.V.; Slaughter, R.E.; Jones, S.L. Comparison of Purified Protein Derivatives and Effect of Skin Testing on Results of a Commercial Gamma Interferon Assay for Diagnosis of Tuberculosis in Cattle. J. Vet. Diagn. Investig. 2001, 13, 117–122. [Google Scholar] [CrossRef] [Green Version]
  32. Farnham, M.W.; Norby, B.; Goldsmith, T.J.; Wells, S.J. Meta-Analysis of Field Studies on Bovine Tuberculosis Skin Tests in United States Cattle Herds. Prev. Vet. Med. 2012, 103, 234–242. [Google Scholar] [CrossRef]
  33. Plummer, M.; Stukalov, A.; Denwood, M. Rjags: Bayesian Graphical Models Using MCMC. 2019. Available online: https://cran.r-project.org/web/packages/rjags/rjags.pdf (accessed on 19 August 2021).
  34. R Core Team. R: A Language and Environment for Statistical Computing; R Foundation for Statistical Computing: Vienna, Austria, 2021. [Google Scholar]
  35. Su, Y.S.; Yajima, M.R. 2jags: Using R to Run. J. Am. Geriatr. Soc. 2021. Available online: https://cran.r-project.org/web/packages/R2jags/R2jags.pdf (accessed on 19 August 2021).
  36. Gelman, A.; Rubin, D.B. Inference From Iterative Simulation Using Multiple Sequences. Stat. Sci. 1992, 7, 457–511. [Google Scholar] [CrossRef]
Figure 1. Loop-mediated isothermal amplification (LAMP) products as analyzed on a 2% agarose gel. Lanes 1 and 17: 100 bp molecular ruler; lanes 2–14: samples; lane 15: positive control; lane 16: negative control. Lanes 3, 4, 9, and 10 demonstrate the ladder-like band patterns, which are considered LAMP-positive.
Pathogens 11 00573 g001
Table 1. Cross-classified test results for bovine tuberculosis in dairy cattle from the SIT test and LAMP test.
Test ResultsSIT (Standard) aSIT (Severe) b
PositiveNegativePositiveNegative
LAMP cpositive038632
negative21639156
a Single intradermal tuberculin (SIT) test (standard interpretation). b Single intradermal tuberculin test (severe interpretation). c Loop-mediated isothermal amplification (LAMP) test.
Table 2. Posterior estimates for median and 95% posterior probability interval (PPI) for sensitivity and specificity of the SIT test using standard interpretation and the LAMP test for the diagnosis of bovine tuberculosis, and prevalence of the disease.
Diagnostic TestsParametersMedian (%)95% PPI a (%)
SIT (standard) aSensitivity63.542.1–81.9
Specificity99.197.1–99.9
LAMP bSensitivity67.240.5–88.4
Specificity82.076.1–87.1
Disease prevalence 3.71.4–7.8
a Single intradermal tuberculin (SIT) test (standard interpretation). b Loop-mediated isothermal amplification (LAMP) test.
Table 3. Posterior estimates for median and 95% posterior probability interval (PPI) for sensitivity and specificity of the SIT test using severe interpretation and the LAMP test for the diagnosis of bovine tuberculosis, and prevalence of the disease.
Diagnostic TestsParametersMedian (%)95% PPI a (%)
SIT (severe) aSensitivity76.155.7–90.9
Specificity9692.6–98.5
LAMP bSensitivity68.844.8–88.9
Specificity84.178.2–89.2
Disease prevalence 6.73.2–12.1
a Single intradermal tuberculin (SIT) test (severe interpretation). b Loop-mediated isothermal amplification (LAMP) test.
Table 4. Primers for the loop-mediated isothermal amplification (LAMP) test designed by Hong et al. [29].
PrimerDNA Sequence (5′-3′)LengthTarget
F3CCGGGTGAGGATCCTGAC18 bpesat6
B3GACTGGTCGAGCTTCAGC18 bpesat6
FIPGAAAGCACCGCGACGGTGTCTTTTCAGACGGATGACCGATTTGG44 bpesat6
BIPCGAGGTGTTGGAAGACACGCCTTTTGAACGCCCACACGCCTT42 bpesat6
Table 5. Prior estimates for mode and 95% confidence interval (CI) for sensitivity and specificity values of SIT test (standard interpretation) and LAMP test, and prevalence of disease (%).
Diagnostic TestsParametersMode95% CI a
SIT test (standard) bSensitivity71.0>53.2
Specificity98.6>89.2
LAMP test cSensitivity75.0>50.0
Specificity95.0>50.0
Disease prevalence 10.0<20.0
a 95% lower or upper confidence interval bound. b Single intradermal tuberculin (SIT) test (standard interpretation). c Loop-mediated isothermal amplification (LAMP) test.
Table 6. Prior estimates for mode and 95% confidence interval (CI) for sensitivity and specificity values of SIT test (severe interpretation) and LAMP test, and prevalence of the disease (%).
Diagnostic TestsParametersMode95% CI a
SIT test (standard) bSensitivity81.0>63.0
Specificity95.6>89.2
LAMP test cSensitivity75.0>50.0
Specificity95.0>50.0
Disease prevalence 10.0<20.0
a 95% lower or upper confidence interval bound. b Single intradermal tuberculin (SIT) test (severe interpretation). c Loop-mediated isothermal amplification (LAMP) test.
Publisher’s Note: MDPI stays neutral with regard to jurisdictional claims in published maps and institutional affiliations.

