Article

Complement Factor H Is an Early Predictive Biomarker of the Therapeutic Efficacy of Sublingual Immunotherapy for Japanese Cedar Pollinosis

1
Department of Otorhinolaryngology, Head and Neck Surgery, Chiba University Graduate School of Medicine, 1-8-1 Inohana, Chuo-ku, Chiba 260-8670, Japan
2
Department of Otolaryngology, Head and Neck Surgery, Yamanashi University Hospital, 1110 Shimokato, Chuo, Yamanashi 409-3898, Japan
3
Department of Immunology, Chiba University Graduate School of Medicine, 1-8-1 Inohana, Chuo-ku, Chiba 260-8670, Japan
4
Chiba Rosai Hospital, 2-16 Tatsumidaihigashi, Ichihara 290-0003, Japan
*
Author to whom correspondence should be addressed.
Pathogens 2022, 11(11), 1280; https://doi.org/10.3390/pathogens11111280
Submission received: 25 September 2022 / Revised: 26 October 2022 / Accepted: 28 October 2022 / Published: 1 November 2022
(This article belongs to the Special Issue Allergy and Immunotherapy)

Abstract

:
Sublingual immunotherapy for Japanese cedar pollinosis can improve the symptoms of allergic rhinitis and modify its natural course. However, sublingual immunotherapy requires a long treatment period and some patients do not respond to treatment. In this study, we aimed to identify biomarkers that could predict the efficacy of sublingual immunotherapy at an early stage. In this study, 40 patients from phase III trials were recruited and divided into good and poor response groups. Using peripheral blood mononuclear cells from before and two months after the start of medication, microarray, discriminant analysis, and real-time polymerase chain reaction were performed to extract candidate genes that could be biomarkers. Furthermore, these genes were validated in 30 patients in general clinical practice. Complement factor H was upregulated in the good response group and downregulated in the poor response group. Complement factor H may be a useful biomarker for predicting the efficacy of sublingual immunotherapy for Japanese cedar pollinosis at early time points after treatment initiation.

1. Introduction

Japanese cedar pollinosis (JCP) is an allergic rhinitis unique to Japan and the number of patients continues to increase annually. The incidence of JCP in children, which was previously thought to be rare, is also becoming a problem [1,2]. As the number of JCP patients increases, it has become clear that the disease also has a significant impact on sleep, learning, and labor productivity and reduces the quality of the daily life of patients. In addition, once JCP has developed, spontaneous improvement is rare except in elderly patients, and there is a need for effective basic treatment and the prevention of its onset [3,4,5,6].
Allergen-specific immunotherapy is the only therapy that can modify the natural course of allergic rhinitis and improve its symptoms. Sublingual immunotherapy (SLIT), in which antigens are administered under the tongue, has been confirmed to be efficacious and safe. In Japan, SLIT for JCP was launched in 2014, and SLIT for mite allergic rhinitis in 2015. Currently, the Japanese guidelines for allergic rhinitis recommend SLIT for all severities of JCP [1,7].
However, SLIT must be continued for at least three years to maintain efficacy. Moreover, despite the long treatment period, treatment efficacy has been found to be poor in 20–30% of cases [6,8]. In addition, at least one treatment season is required to determine the efficacy of SLIT for JCP. It is also difficult to determine its efficacy objectively. In fact, in a double-blind, placebo-controlled Phase III trial, the proportion of patients with symptoms that improved in the first season was 61% in the actual drug group compared to 39.4% in the placebo group. SLIT is considered a treatment with a high placebo effect [6]. Patient satisfaction was high in the actual drug group, although because improvement in subjective symptoms includes a placebo effect, patients with high satisfaction due to the placebo effect may experience a relapse of symptoms after SLIT completion. Owing to the long treatment period, a high dropout rate has been reported [9]. Although several markers are associated with SLIT mechanisms, there is no consensus on suitable prognostic, predictive, or surrogate biomarker candidates for clinical responses to SLIT [10,11,12,13,14]. It is difficult to determine whether SLIT should be continued in patients who do not respond clearly in the first season; therefore, if its efficacy can be predicted earlier than the first season, it may motivate patients to continue SLIT. However, for patients with poor efficacy, alternative medicine can be suggested, which benefits patients by reducing the burden. Thus, there is a great need to identify a biomarker that can predict the efficacy of SLIT before therapy or early during therapy and establish it as an assessment method. This study aimed to identify early biomarkers of SLIT and predict their efficacy. We examined two different populations: Study 1 and Study 2. The patient population was divided into good and poor response groups according to their response to SLIT. In Study 1, blood samples from patients in a double-blind placebo-controlled trial were used. Using these samples, microarray, discriminant analysis, and real-time polymerase chain reaction (PCR) were performed to identify candidate biomarker genes. In Study 2, the candidate biomarker gene was revalidated by real-time PCR in general clinical patients.

2. Materials and Methods
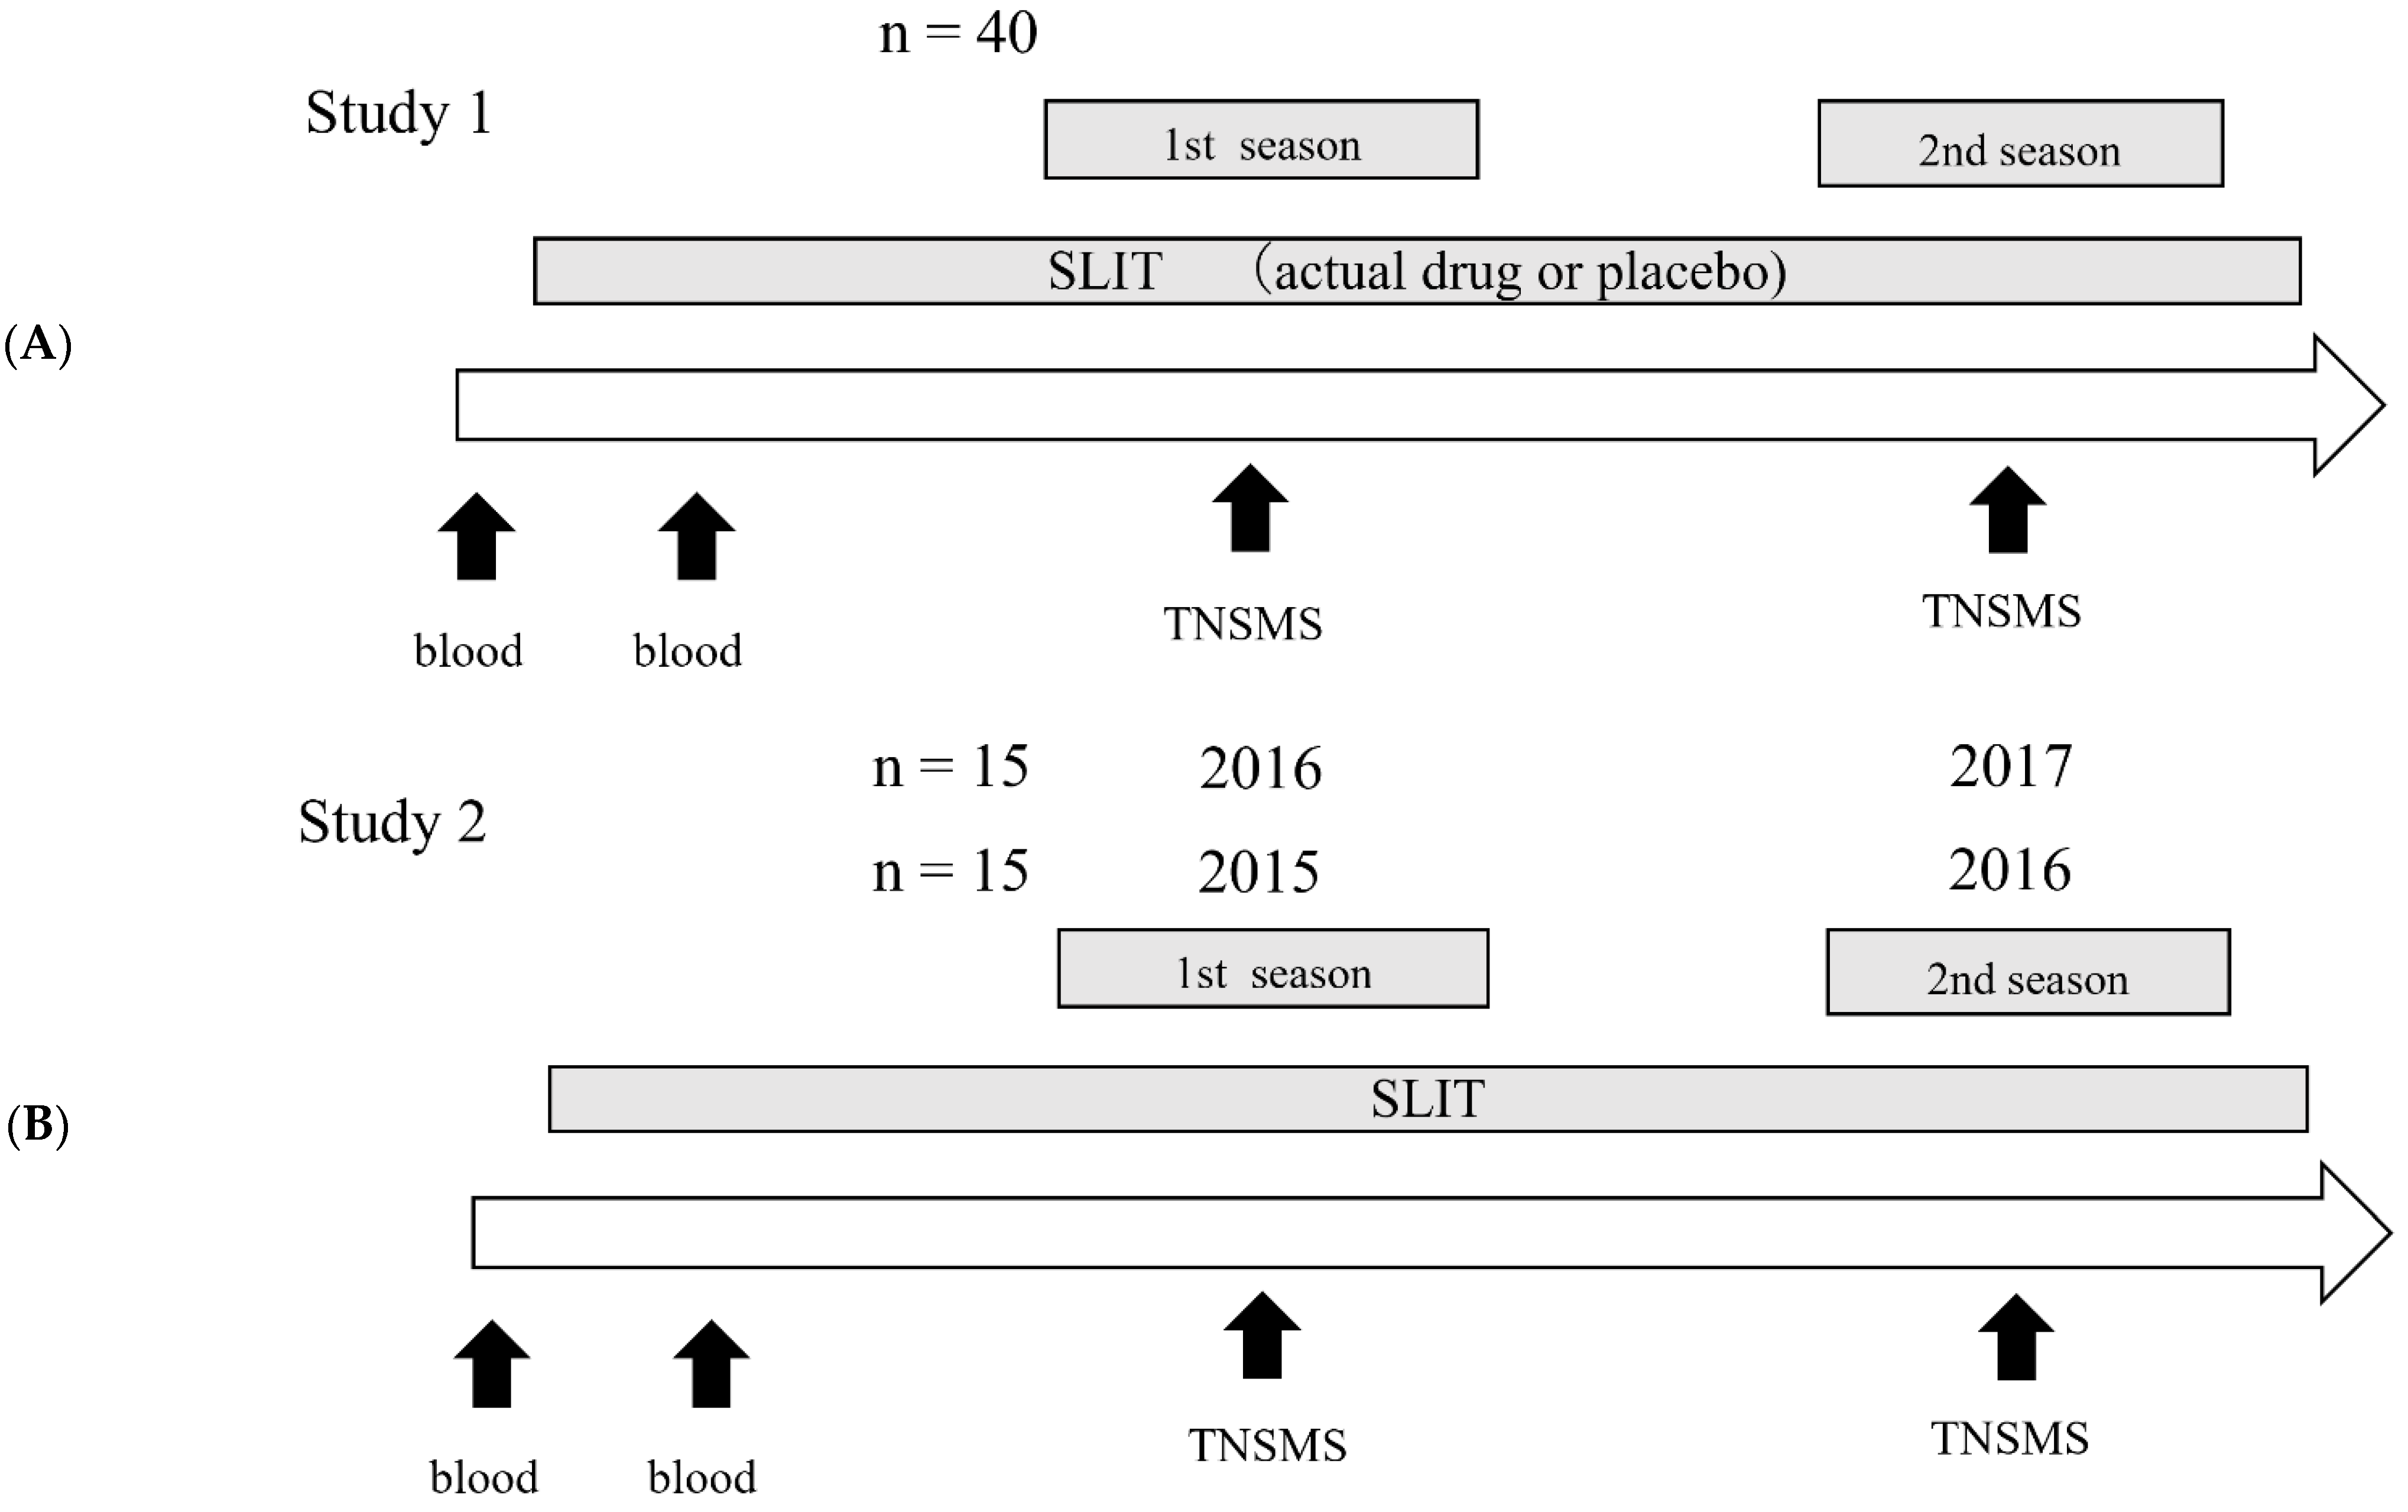
2.1. Study Design

In Study 1, 40 patients from a double-blind, placebo-controlled trial of the efficacy and safety of SLIT for JCP patients conducted from 2010 to 2012 were included in the analysis at Chiba University Hospital. Patients were treated with either the actual drug or placebo from the non-pollen season until the end of the second cedar pollen dispersal season (Figure 1A).
In Study 2, 30 patients who received SLIT for JCP from general clinical practice at Chiba University Hospital were recruited. Fifteen patients started SLIT in the non-pollen season in 2014 and continued through the cedar dispersal season in 2015 and 2016; 15 patients started SLIT in the non-pollen season in 2015 and passed the cedar dispersal season in 2016 and 2017 (Figure 1B). In both Studies 1 and 2, blood samples were collected before and two months after the initiation of medication.
The pollen counts for each year were 6537, 1256, 2910, 3304, and 1820/cm2 in 2011, 2012, 2015, 2016, and 2017, respectively.
Efficacy was evaluated using the Total Nasal Symptom and Medication Score (TNSMS) from the Japanese nasal allergy guidelines [1]. The TNSMS was calculated as the sum of nasal symptoms—sneezing, rhinorrhea, and nasal congestion—using a 5-point scale (0, none; 1, mild; 2, moderate; 3, severe; 4, very severe) and the drug scores of oral drugs and nasal sprays.

2.2. Determination of Treatment Efficacy

The good and poor response groups in Studies 1 and 2 were defined differently because the amount of cedar pollen dispersal varied from year to year.

2.2.1. Study 1

The TNSMS in the peak symptom period was calculated in the first and second seasons and classified into four levels of severity according to the Japanese nasal allergy guidelines: most severe, severe, moderate, and mild. The good response group consisted of patients whose symptoms improved by two or more steps in the second season or improved to mild in the second season. The poor response group consisted of patients whose symptoms did not improve or worsen during the second season. Patients who did not meet these criteria were excluded from this study. Based on these criteria, the patients were divided into four groups: good response in the SLIT group (Act/good), poor response in the SLIT group (Act/poor), good response in the placebo group (Plc/good), and poor response in the placebo group (Plc/poor). Of the 40 patients, 7 were assigned to the Act/good group, 4 to the Act/poor group, 5 to the Plc/good group, and 7 to the Plc/poor group (Table 1).

2.2.2. Study 2

As in Study 1, the TNSMS in the peak symptom period was calculated in the first and second seasons. The rate of change in TNSMS between the first and second seasons was determined, and 15 patients whose symptoms improved from the median rate of change were in the good response group and 15 patients whose symptoms did not improve were in the poor response group (Table 2).

2.3. Microarray

Peripheral blood mononuclear cells (PBMCs) were isolated from peripheral blood using LYMPHO SEPARATION MEDIUM (MP Biomedical, Aurora, OH, USA), as previously reported [15]. Total RNA was isolated from PBMCs, and labeled cRNA was prepared using the Quick Amp Labeling Kit (Agilent Technologies, Santa Clara, CA, USA), followed by hybridization. Microarray slides were analyzed using an Agilent DNA microarray scanner (Agilent Technologies, Santa Clara, CA, USA). The measured image data were quality-checked and quantified using Feature Extraction software (Agilent Technologies, Santa Clara, CA, USA).
Two-way analysis of variance (ANOVA) with one-factor correspondence was performed. The Tukey–Kramer method in the time-point direction and the Steel–Dwass test in the sample direction were used to identify significant differences. Variable genes with p-values < 0.05 were extracted by ANOVA, followed by checking for fold-change and sub-testing.

2.4. Real-Time PCR

RNA was reverse-transcribed to cDNA using the Superscript VILO cDNA reverse transcription kit (Life Technologies, Carlsbad, CA, USA) following the manufacturer’s instructions. TaqMan PCR primers were obtained as proprietary pre-optimized reagents (Life Technologies, Carlsbad, CA, USA), and probes were obtained from the Universal Probe Library (Roche, Basel, Switzerland). PCR primers and probes were combined with TaqMan gene expression master mix in real-time PCR reactions (7900HT Fast Real-Time PCR System; Applied Biosystems, Waltham, MA). The relative quantitation of mRNA expression was performed using the 2∆∆Ct method relative to the housekeeping gene (18S rRNA).

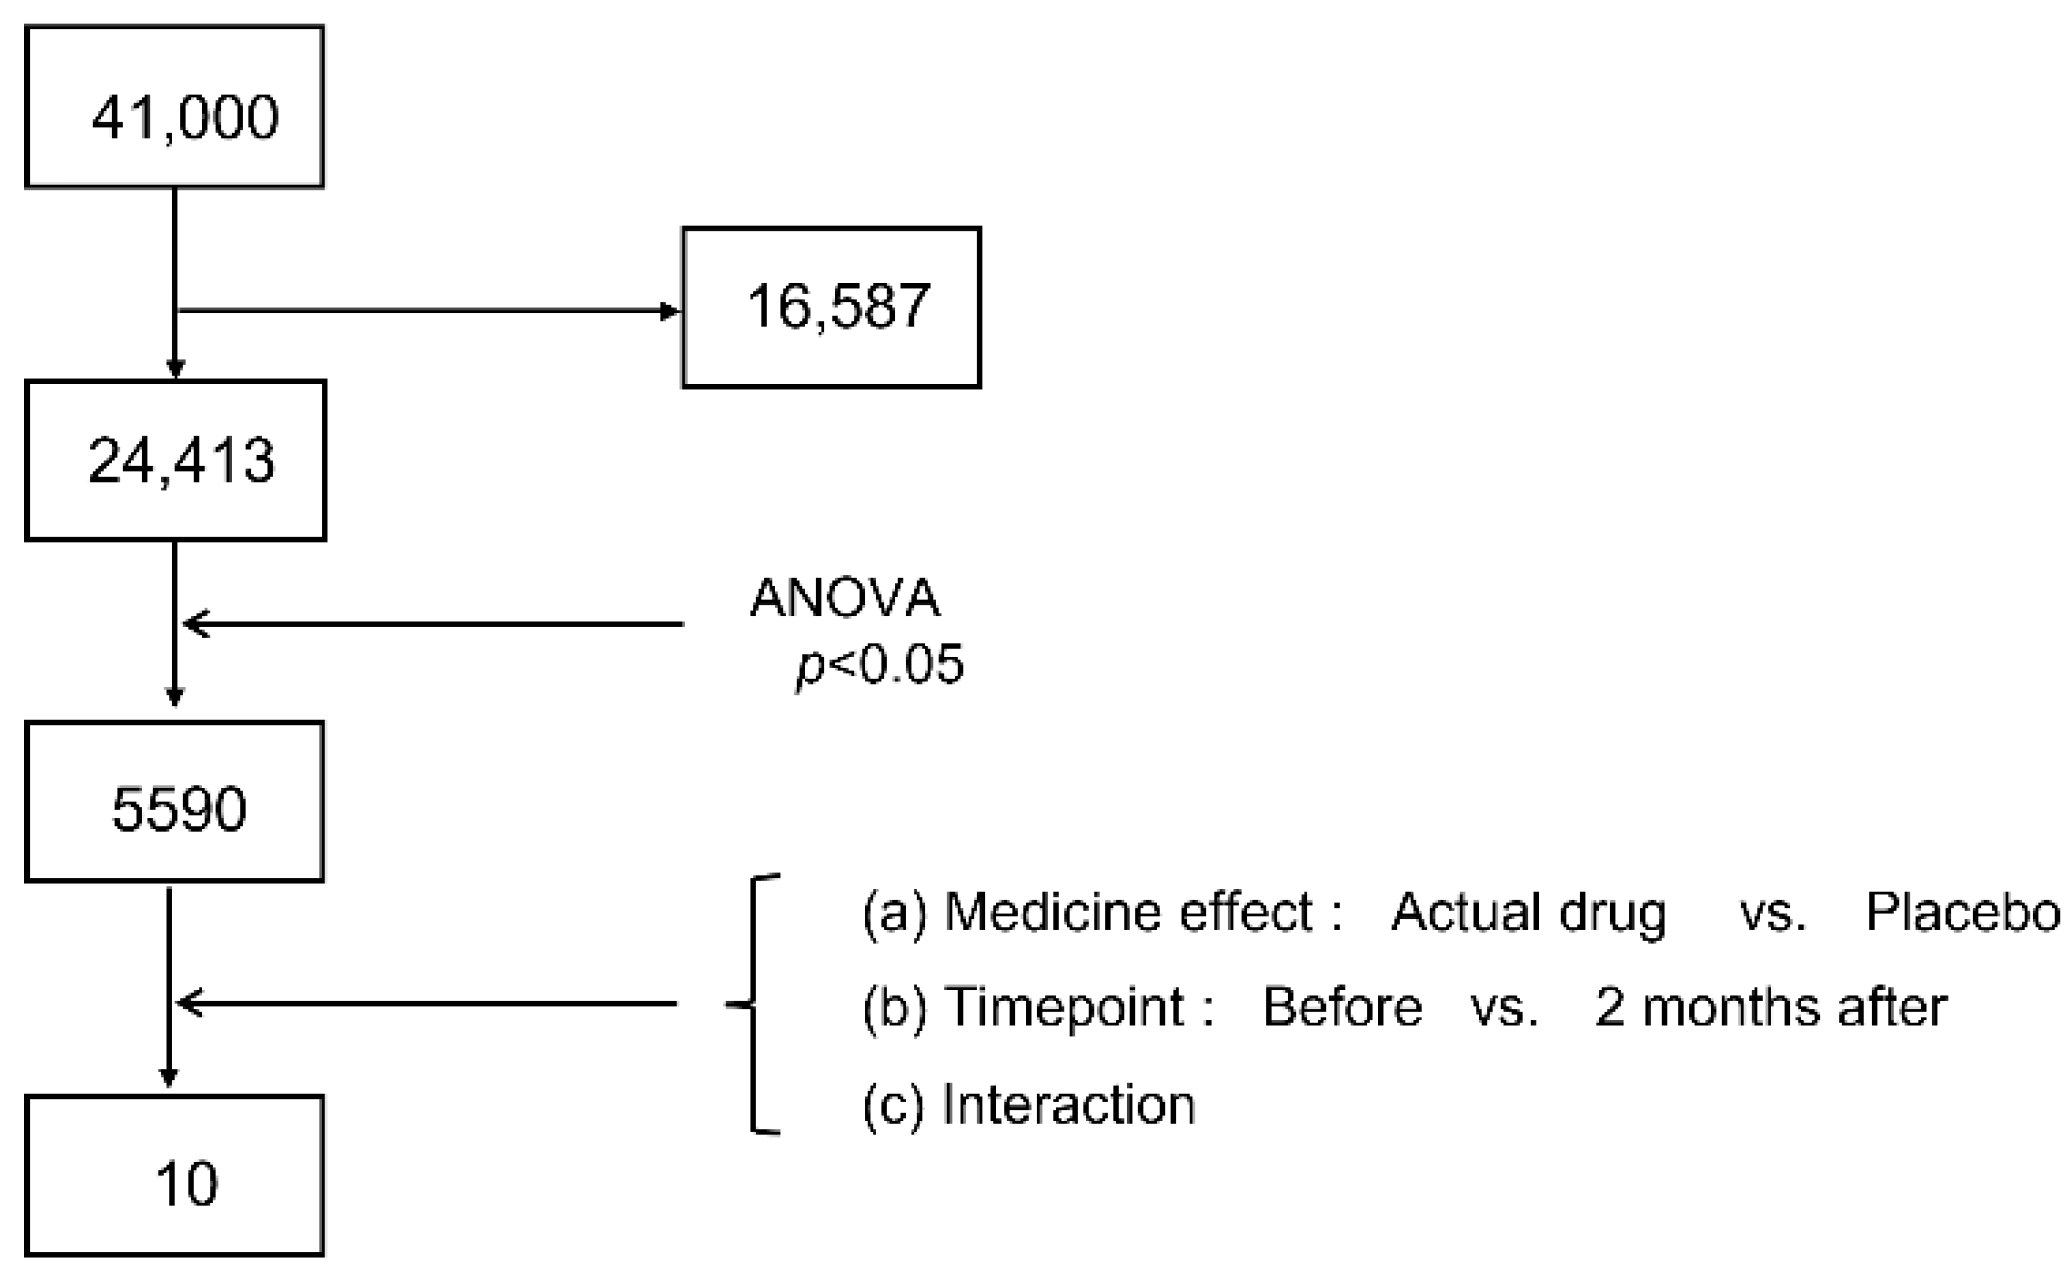
2.5. Statistical Analysis

Discriminant analysis was conducted by constructing discriminant equations for each gene, using the treatment’s good or poor response as the objective variable and the numerical data before and two months after the medication started as the explanatory variables. The “qda” function in MASS, an R package, was used for analysis (R Foundation for Statistical Computing, Vienna, Austria). Posterior probabilities greater than 50% were considered correct. The Mann–Whitney U test was used to compare two groups using GraphPad Prism software (version 8.43; GraphPad Software, San Diego, CA, USA), and the significance level was set at p < 0.05.

3. Results

3.1. Candidate Narrowing by Microarray

In Study 1, candidate genes for predictive biomarkers were narrowed down by dividing them into four groups: Act/good, Act/poor, Plc/good, and Plc/poor. Of the 41,000 probes mounted on the microarray, 24,413 were selected for analysis, and the remaining probes were removed with signal values equivalent to the background (Figure 2). Among the selected probes, 5590 probes were selected as probes with a p-value < 0.05 by ANOVA. We compared the selected genes according to two main effects and their interaction. The main effects were (a) the medicine effect (actual drug vs. placebo) and (b) the time point (before vs. two months after the medication started), and the third factor was (c) their interaction with the main effect. Candidate genes were selected if they varied with a p-value of < 0.05, and if their behavior differed only in the Act/good group; that is, if they were upregulated or downregulated only in the Act/good group. Three genes (CFH, PRKCB, and SEPT7P2) were selected for the comparison between the SLIT and placebo groups. GOLIM4 was selected as a candidate gene for comparison between before and two months after the initiation of medication. Six genes were selected for the interaction between the two factors: EIF2D, FSCN1, DTX3, TTC39C, TUBB3, and ATP8B3. Ten genes were selected as candidate predictive biomarkers (Table 3).

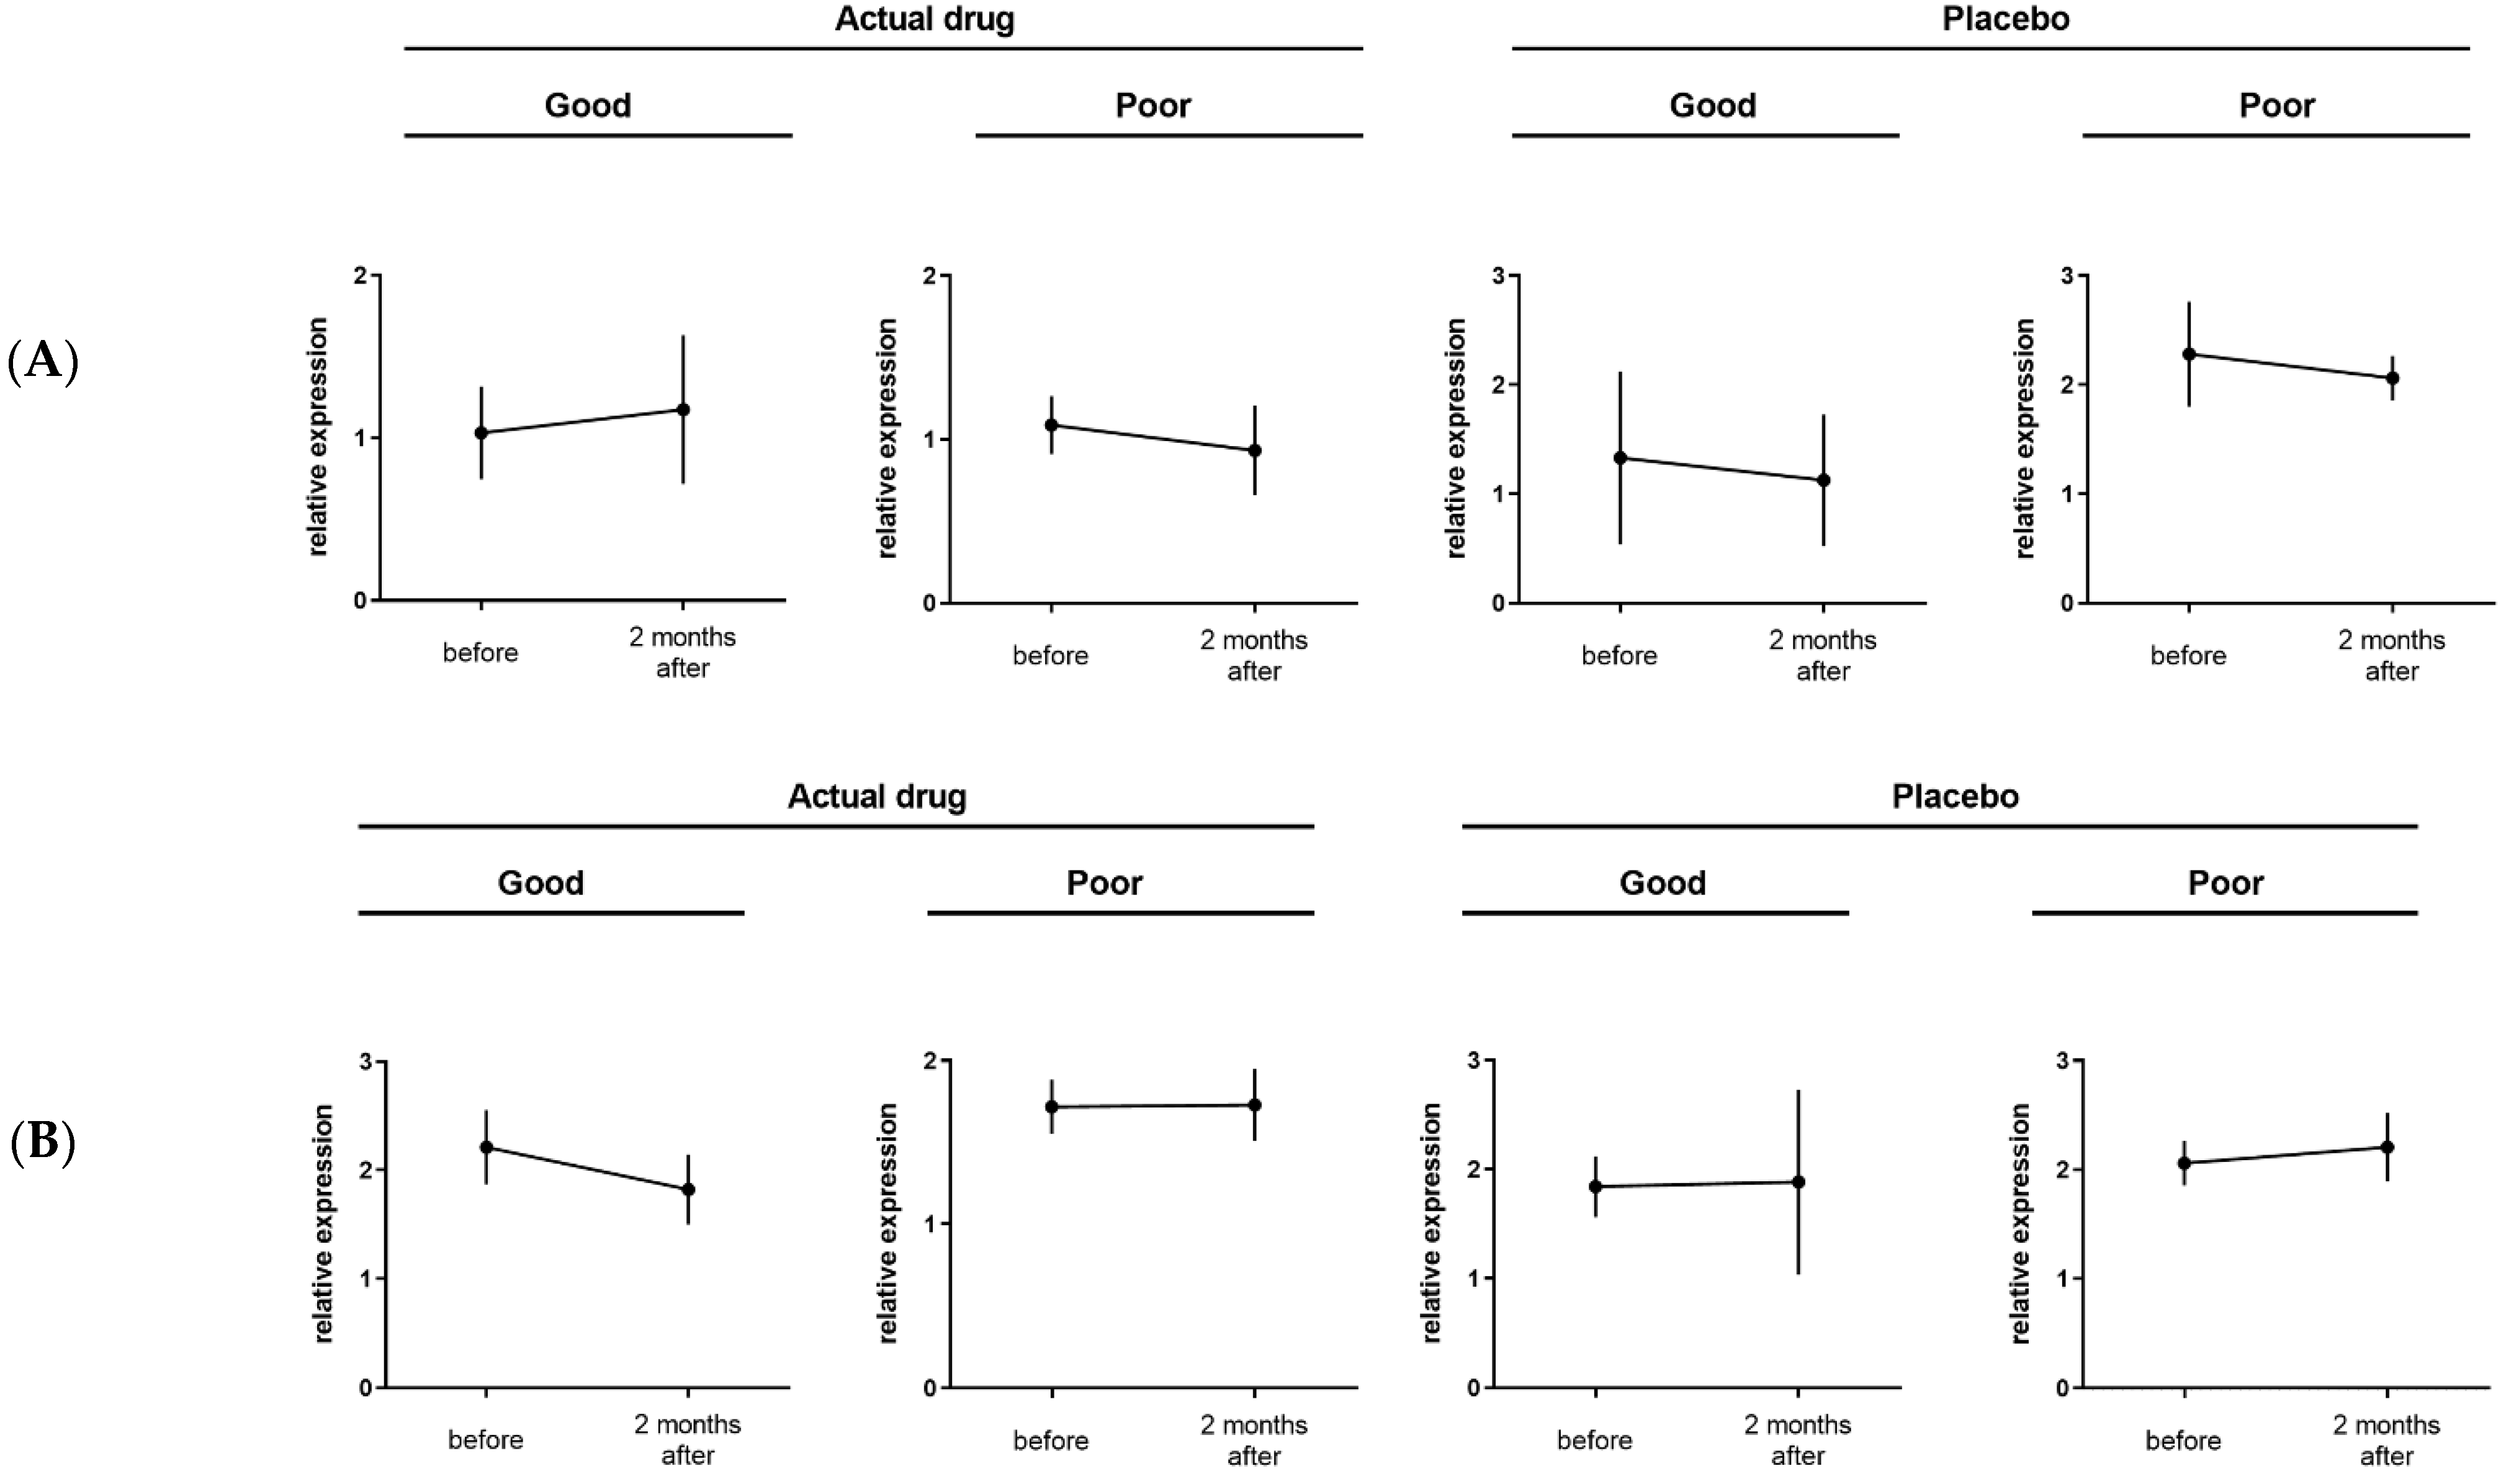
3.2. Candidate Narrowing by Real-Time PCR

Real-time PCR was performed for ten candidate genes that were selected by microarray in Study 1 using PBMCs collected before and two months after the start of treatment. Gene expression changes before and two months after the start of medication were analyzed in each of the four groups: Act/good, Act/poor, Plc/good, and Plc/poor. Among the ten candidate biomarker genes, CFH and GOLIM4 were selected as genes whose variation showed the same behavior as the microarray results (Figure 3): CFH in the Act/good group was upregulated from before to two months after the medication started, and GOLIM4 in the Act/good group was downregulated from before to two months after the medication started. Due to the small number of cases, there was no significant difference in gene expression levels before and two months after the initiation of medication.

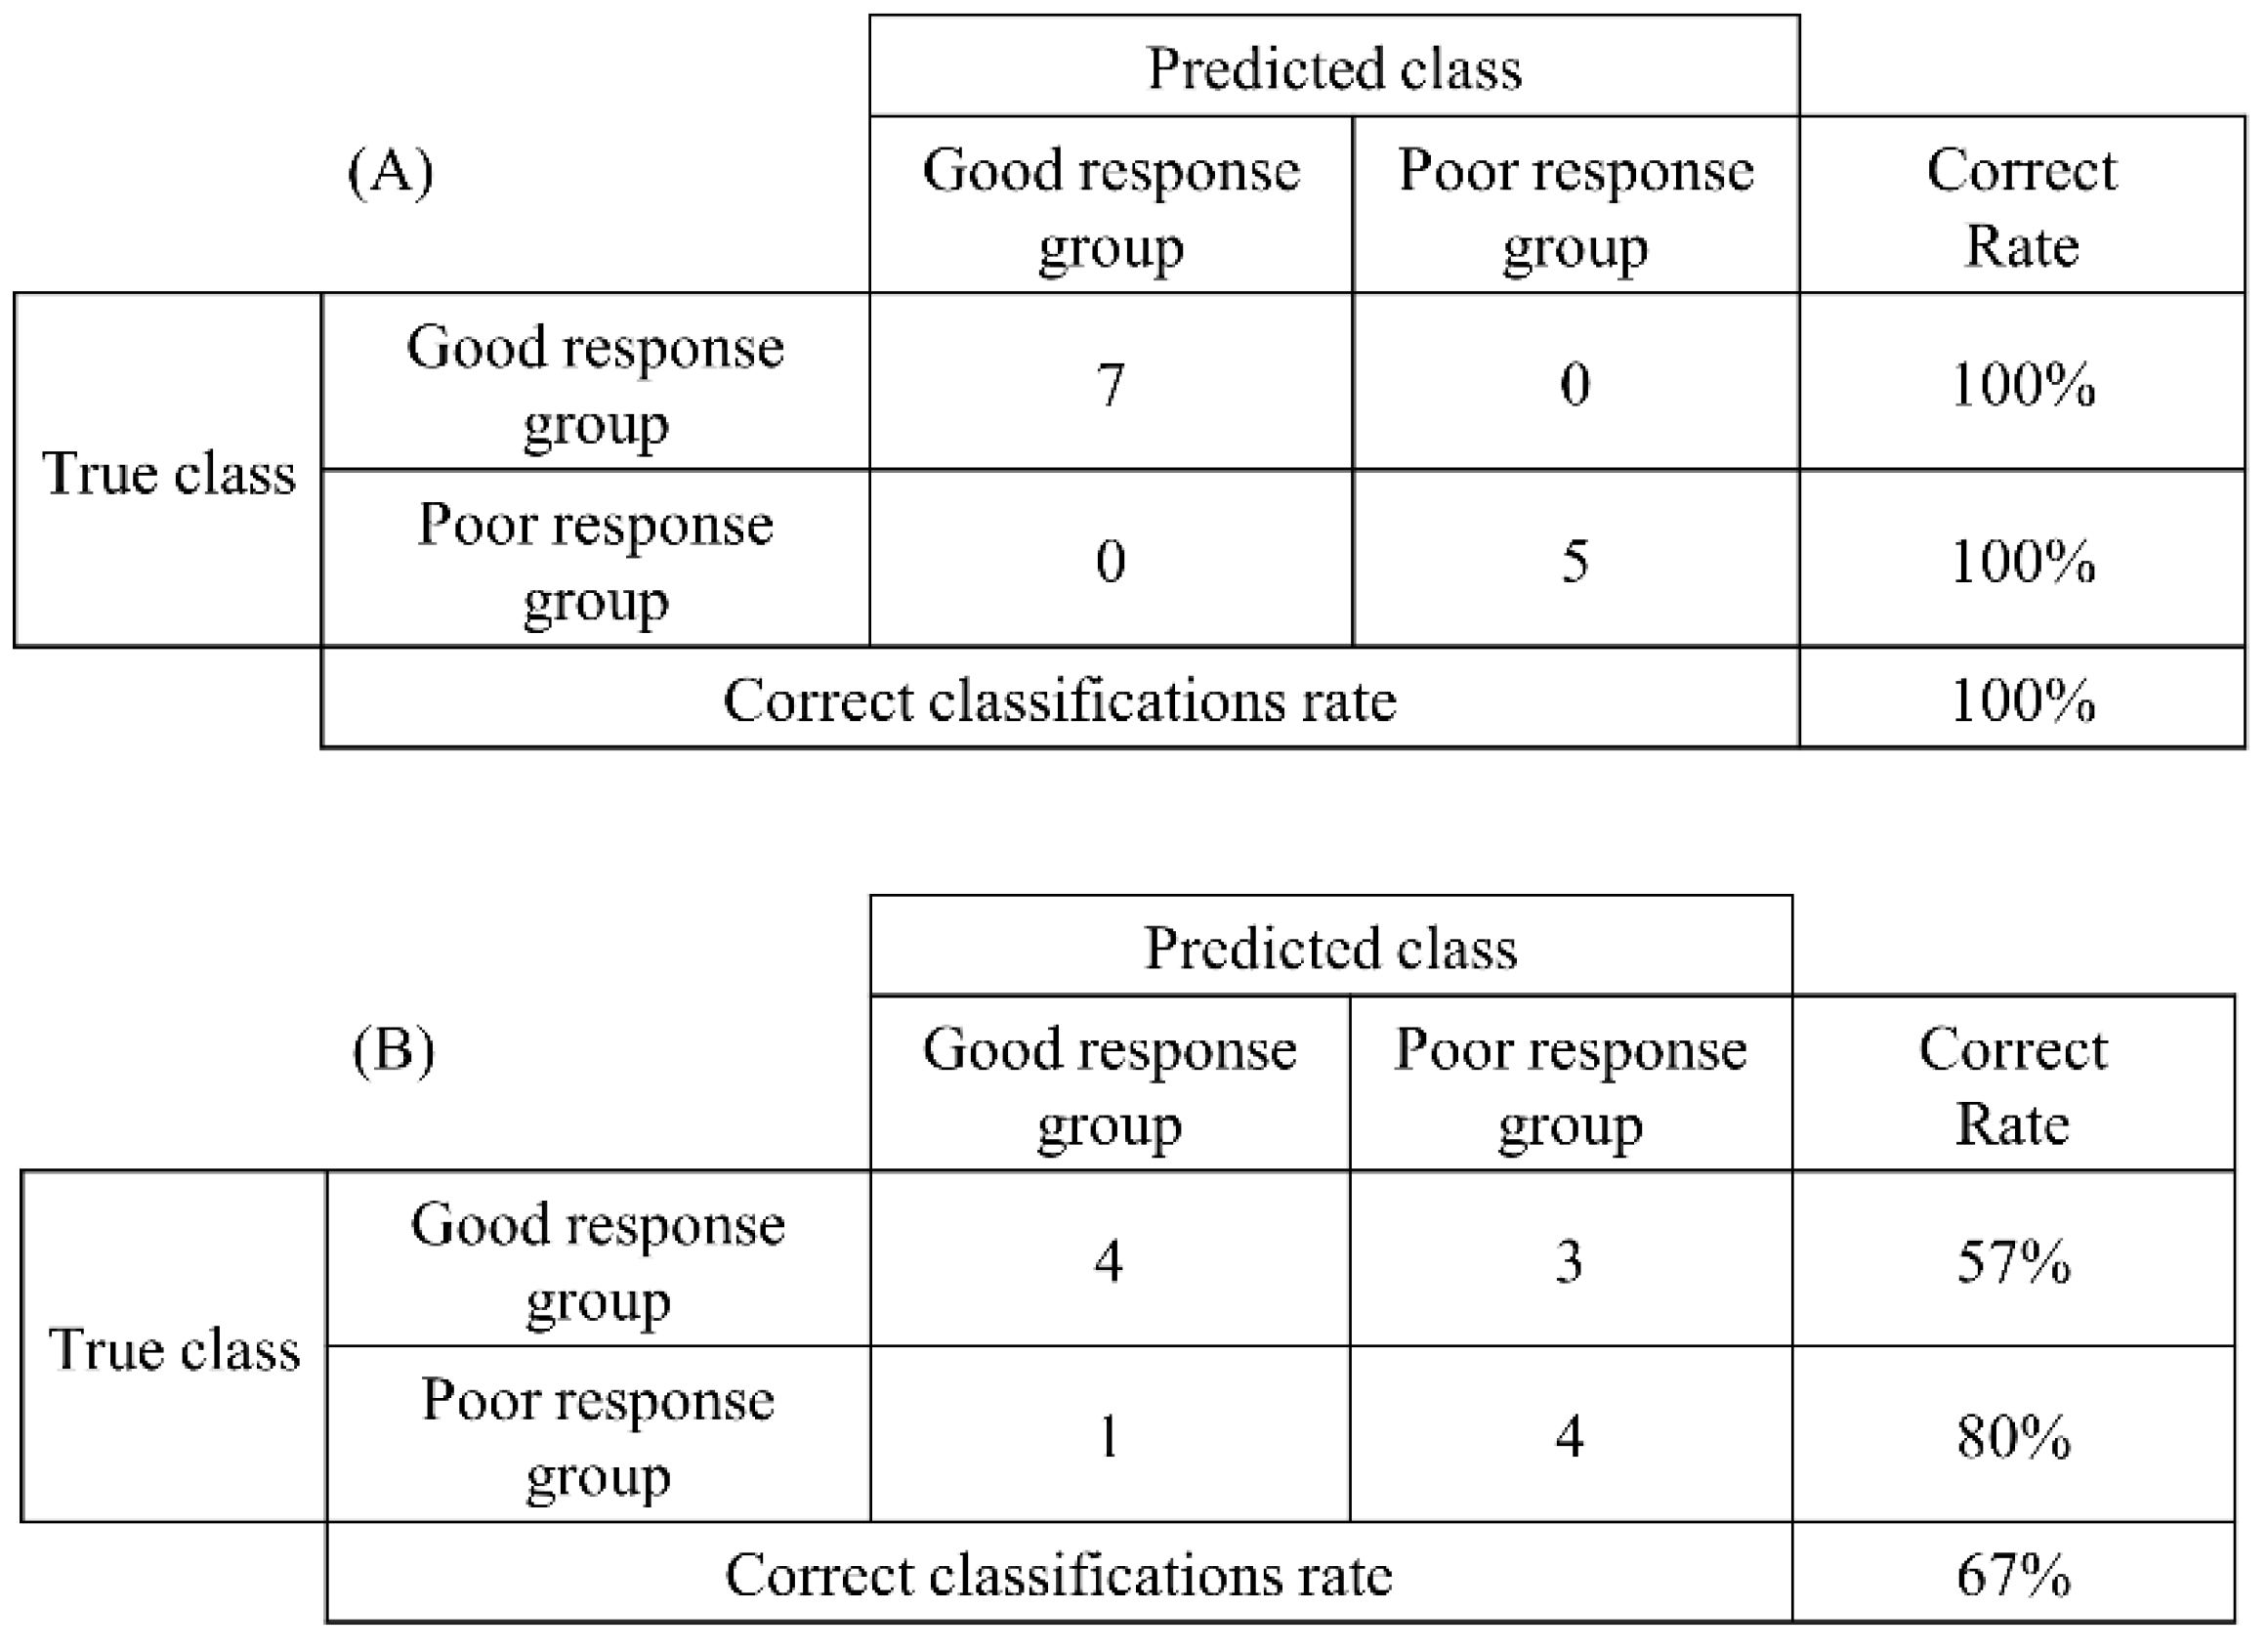
3.3. Evaluation of Prediction Accuracy by Discriminant Analysis

The accuracy of CFH and GOLIM4, determined using real-time PCR in Study 1, as predictive biomarkers for the efficacy of SLIT was analyzed using discriminant analysis. Analysis was performed on the Act/good and Act/poor groups. The results of the discriminant analysis are presented in a confusion matrix. The non-linear discriminant analysis of the changes in CFH expression from before to two months after the medication started showed a 100% correct rate in both the Act/good and Act/poor groups. The correct classification rate was 100%. The non-linear discriminant analysis of the changes in GOLIM4 expression from before to two months after the medication started showed a 57% correct rate in the Act/good group and an 80% correct rate in the Act/poor group. The correct classification rate was 67% (Figure 4).
These results suggest that CFH can predict the efficacy of SLIT with a high degree of accuracy by measuring gene expression changes before and two months after the start of treatment.

3.4. Efficacy of CFH as a Biomarker

CFH expression before and two months after the start of medication was confirmed in Study 2. Real-time PCR was performed using PBMCs before and two months after the initiation of medication. The CFH expression two months after the start of medication was compared to that before the medication started. The ratio of CFH expression before the start of treatment to two months after the start of treatment was obtained. The ratio was set to 1 when there was no change between before and two months after the start of medication. The ratio was greater than 1 when CFH expression increased from before to two months after the start of medication and was less than 1 when decreased. The mean values of the ratio in the good and poor response groups were 1.43 (standard deviation (SD) = 1.23) and 0.71 (SD = 0.44), respectively. T-test results showed a significant difference between the two groups (t (28) = 2.06, p < 0.05). CFH increased in the good response group and decreased in the poor response group. This is consistent with the results of Study 1 (Figure 5A). Using a receiver operating characteristic curve and setting the cutoff value to 0.99, the specificity and sensitivity were 80% and 60%, respectively (Figure 5B).

4. Discussion

Several studies have predicted the efficacy of SLIT; however, there is still no established predictive model. We investigated the factors that could predict SLIT efficacy at an early stage. A microarray, real-time PCR, and discriminant analysis were used to narrow down candidate genes in PBMCs from a double-blind, placebo-controlled trial. Based on the microarray results, ten genes were identified as candidate predictive biomarkers. Two genes were selected that behaved similarly to the microarray results obtained by real-time PCR: CFH and GOLIM4. These two genes, CFH and GOLIM4, encode complement factor H (CFH) and Golgi integral membrane protein 4 (GOLIM4), respectively. The accuracy of these two genes as predictive biomarkers was examined using discriminant analysis, and a high correct classification rate was obtained for CFH. Real-time PCR was performed on samples from general clinical patients and showed the same behavior as the microarray. In both studies, CFH was found to increase in the good response group and decrease in the poor response group when comparing levels before and two months after the medication started. The cutoff value for the rate of change in CFH was 0.99, with a sensitivity of 60% and specificity of 80%. CFH expression has been suggested as a potential predictive biomarker for the therapeutic efficacy of SLIT for JCP.
CFH is the first protein regulated in the alternative pathway of the complement system. CFH is a single-chain glycoprotein that binds to the active forms of C3 and C3b and promotes the dissociation and deactivation of the C3 convertase C3bBb or C3bBbP (P: properdin) in the alternative pathway when bound to C3b [16]. In addition, it controls C5 convertase activity by competitively inhibiting the binding of C3b to C5. CFH acts as a cofactor for factor I, which cleaves C3b to inactive iC3b. C3a and C5a are involved in allergic inflammation, such as by anaphylatoxins, in the migration of eosinophils and mast cells, and C5a participates in the migration of macrophages, neutrophils, and basophils. When these cells are activated, leukotrienes, histamines, cytokines, and chemokines are released. Complement activation affects the allergic state via the complement activation pathway, including the classical and alternative pathways [17,18]. There are reports that serum C3a and C5a levels are significantly decreased by the long-term administration of SLIT [19,20,21]. Since CFH acts as an inhibitor of the alternative pathway, C3a and C5a are thought to decrease when CFH is upregulated in the good response group. In this study, the change in CFH was attributed to SLIT. Elevated CFH causes C3a and C5a to decrease and, as a result, inhibits the allergic reaction and suppresses allergens other than cedar. However, since this is an antigen-specific immunotherapy, it is unlikely that the observed CFH expression changes in PBMCs affect overall immunity. Although its effectiveness as a biomarker is expected, its relevance as a mechanism of action remains unknown. Further studies are required to clarify the mechanism of action and to determine if CFH can be used as a valuable biomarker for other sublingual immunotherapies.
The classification of the good and poor response groups in these studies has limitations. In Study 1, the amount of cedar pollen dispersal varied from year to year, with large amounts in the first season and small amounts in the second season; therefore, the classification was based on changes in symptoms from the first to the second season. In Study 2, there was no significant change in the amount of dispersal over the three years; therefore, we classified whether symptoms improved from the first to the second season. In both Studies 1 and 2, we compared the change in symptoms between the first and second seasons to classify the good and poor response groups. However, patients whose symptoms improved immediately after the medication started were already classified as mild in the first season and did not improve thereafter. These cases might have been lost to follow-up in the poor response group.
We determined the ratios of CFH expression before and two months after the start of treatment and compared them between the good and poor response groups. However, the SDs were large; thus, in most cases, the ratios were approximately 1. Among the individual patients, those with even a slight increase in CFH expression were more likely to benefit from treatment, whereas those with decreased CFH expression experienced a limited effect.
The cutoff value was 0.99, with a sensitivity of 60% and specificity of 80%, making it a useful predictive biomarker of the good response group, although less accurate as a predictive biomarker of the poor response group. A good response motivates patients to continue treatment even if they do not clearly respond in the first season. For the poor response group, it is possible to suggest the discontinuation of SLIT and transition to alternative treatment; however, the results of this study were not precise enough to exclude the poor response group. We will continue to investigate the significance of this predictive biomarker not only in the good response group but also in the poor response group, based on prospective comparative studies.

5. Conclusions

We searched for biomarkers that could predict the efficacy of SLIT for JCP at an early stage of therapy. CFH expression was found to increase in the good response group and decrease in the poor response group early after medication initiation, indicating that CFH may be a biomarker that can predict the efficacy of SLIT early during treatment.

Author Contributions

R.Y. designed experiments and wrote the manuscript. Y.S., T.A. and J.K. contributed to data analysis and interpretation. T.I. and S.Y. contributed to the data collection and interpretation. D.S., Y.O. and T.H. designed and conducted experiments and critically reviewed the manuscript. All authors have read and agreed to the published version of the manuscript.

Funding

This research was funded by the Japan Agency for Medical Research and Development (AMED) under grant number JP16ek0410009 and the city area project of Chiba Prefecture, and Japan Society for the Promotion of Science Grants-in-Aid for Scientific Research (KAKENHI) grant 22K16924.

Institutional Review Board Statement

The study was conducted according to the guidelines of the Declaration of Helsinki and approved by the Ethics Committee of Chiba University (Study 1: protocol code 803-10, date of approval 1 October 2010; Study 2: protocol code 742, date of approval 16 December 2014).

Informed Consent Statement

Informed consent was obtained from all patients involved in the study. Written informed consent has been obtained from the patients to publish this paper.

Data Availability Statement

The data that support the findings of this study are available on request from the corresponding author. The data are not publicly available due to patents.

Acknowledgments

We sincerely thank Osamu Ohara (Kazusa DNA Research Institute), Ken Nonaka (DNA Chip Research Inc.) and Ayako Inamine for performing statistical analyses.

Conflicts of Interest

T.I. received grants from Sanofi and honoraria from Kyorin, Sanofi, and Taiho. S.Y. received grants from Thermo Fisher Diagnostic and Kyowa Kirin; consulting fees from Torii; and honoraria from Torii, Novartis Pharma, Sanofi, Kyorin, Mitsubishi Tanabe, Hisamitsu, Taiho, and Meiji Seika Pharma. Y.O. received consulting fees from Torii and honoraria from Torii, Mitsubishi Tanabe, Taiho, Shionogi, and Kyorin. T.H. received honoraria from Sanofi, Kyorin, and Mitsubishi Tanabe. The rest of the authors declare that they have no relevant conflicts of interest.

References

  1. Okubo, K.; Kurono, Y.; Ichimura, K.; Enomoto, T.; Okamoto, Y.; Kawauchi, H.; Suzaki, H.; Fujieda, S.; Masuyama, K. Japanese Society of Allergology. Japanese guidelines for allergic rhinitis 2020. Allergol. Int. 2020, 69, 331–345. [Google Scholar] [CrossRef] [PubMed]
  2. Yamada, T.; Saito, H.; Fujieda, S. Present state of Japanese cedar pollinosis: The national affliction. J. Allergy Clin. Immunol. 2014, 133, 632–639.e5. [Google Scholar] [CrossRef] [PubMed]
  3. Horiguchi, S.; Okamoto, Y.; Yonekura, S.; Okawa, T.; Yamamoto, H.; Kunii, N.; Sakurai, D.; Fujimura, T.; Nakazawa, K.; Yasueda, H. A randomized controlled trial of sublingual immunotherapy for Japanese cedar pollinosis. Int. Arch. Allergy Immunol. 2008, 146, 76–84. [Google Scholar] [CrossRef]
  4. Okubo, K.; Gotoh, M.; Fujieda, S.; Okano, M.; Yoshida, H.; Morikawa, H.; Masuyama, K.; Okamoto, Y.; Kobayashi, M. A randomized double-blind comparative study of sublingual immunotherapy for cedar pollinosis. Allergol. Int. 2008, 57, 265–275. [Google Scholar] [CrossRef] [PubMed] [Green Version]
  5. Fujimura, T.; Yonekura, S.; Horiguchi, S.; Taniguchi, Y.; Saito, A.; Yasueda, H.; Inamine, A.; Nakayama, T.; Takemori, T.; Taniguchi, M.; et al. Increase of regulatory T cells and the ratio of specific IgE to total IgE are candidates for response monitoring or prognostic biomarkers in 2-year sublingual immunotherapy (SLIT) for Japanese cedar pollinosis. Clin. Immunol. 2011, 139, 65–74. [Google Scholar] [CrossRef] [PubMed]
  6. Okamoto, Y.; Okubo, K.; Yonekura, S.; Hashiguchi, K.; Goto, M.; Otsuka, T.; Murata, T.; Nakao, Y.; Kanazawa, C.; Nagakura, H.; et al. Efficacy and safety of sublingual immunotherapy for two seasons in patients with Japanese cedar pollinosis. Int. Arch. Allergy Immunol. 2015, 166, 177–188. [Google Scholar] [CrossRef]
  7. Yonekura, S.; Gotoh, M.; Kaneko, S.; Kanazawa, K.; Takeuji, Y.; Okubo, K.; Okamoto, Y. Treatment duration-dependent efficacy of Japanese cedar pollen sublingual immunotherapy: Evaluation of a phase II/III trial over three pollen dispersal seasons. Allergol. Int. 2019, 68, 494–505. [Google Scholar] [CrossRef]
  8. Sakurai, D.; Yonekura, S.; Iinuma, T.; Sakurai, T.; Morimoto, Y.; Mita, Y.; Arai, T.; Suzuki, S.; Okuma, Y.; Kaneko, S.; et al. Sublingual immunotherapy for allergic rhinitis: Subjective versus objective tools to evaluate its success. Rhinology 2016, 54, 221–230. [Google Scholar] [CrossRef]
  9. Antico, A. Long-term adherence to sublingual therapy: Literature review and suggestions for management strategies based on patients’ needs and preferences. Clin. Exp. Allergy 2014, 44, 1314–1326. [Google Scholar] [CrossRef]
  10. Shamji, M.H.; Kappen, J.H.; Akdis, M.; Jensen-Jarolim, E.; Knol, E.F.; Kleine-Tebbe, J.; Bohle, B.; Chaker, A.M.; Till, S.J.; Valenta, R.; et al. Biomarkers for monitoring clinical efficacy of allergen immunotherapy for allergic rhinoconjunctivitis and allergic asthma: An EAACI Position Paper. Allergy 2017, 72, 1156–1173. [Google Scholar] [CrossRef]
  11. Piconi, S.; Trabattoni, D.; Rainone, V.; Borgonovo, L.; Passerini, S.; Rizzardini, G.; Frati, F.; Iemoli, E.; Clerici, M. Immunological effects of sublingual immunotherapy: Clinical efficacy is associated with modulation of programmed cell death ligand 1, IL-10, and IgG4. J. Immunol. 2010, 185, 7723–7730. [Google Scholar] [CrossRef] [PubMed] [Green Version]
  12. Scadding, G.W.; Shamji, M.H.; Jacobson, M.R.; Lee, D.I.; Wilson, D.; Lima, M.T.; Pitkin, L.; Pilette, C.; Nouri-Aria, K.; Durham, S.R. Sublingual grass pollen immunotherapy is associated with increases in sublingual Foxp3-expressing cells and elevated allergen-specific immunoglobulin G4, immunoglobulin A and serum inhibitory activity for immunoglobulin E-facilitated allergen binding to B cells. Clin. Exp. Allergy 2010, 40, 598–606. [Google Scholar] [CrossRef] [PubMed] [Green Version]
  13. Shimabukuro, T.T.; Cole, M.; Su, J.R. Reports of anaphylaxis after receipt of mRNA COVID-19 vaccines in the US-December 14, 2020–January 18, 2021. JAMA 2021, 325, 1101–1102. [Google Scholar] [CrossRef]
  14. Shamji, M.H.; Durham, S.R. Mechanisms of allergen immunotherapy for inhaled allergens and predictive biomarkers. J. Allergy Clin. Immunol. 2017, 140, 1485–1498. [Google Scholar] [CrossRef] [PubMed] [Green Version]
  15. Fujimura, T.; Yonekura, S.; Taniguchi, Y.; Horiguchi, S.; Saito, A.; Yasueda, H.; Nakayama, T.; Takemori, T.; Taniguchi, M.; Sakaguchi, M.; et al. The induced regulatory T cell level, defined as the proportion of IL-10+Foxp3+ cells among CD25+CD4+ leukocytes, is a potential therapeutic biomarker for sublingual immunotherapy: A preliminary report. Int. Arch. Allergy Immunol. 2010, 153, 378–387. [Google Scholar] [CrossRef]
  16. Makou, E.; Herbert, A.P.; Barlow, P.N. Functional anatomy of complement factor H. Biochemistry 2013, 52, 3949–3962. [Google Scholar] [CrossRef] [PubMed]
  17. Klos, A.; Tenner, A.J.; Johswich, K.O.; Ager, R.R.; Reis, E.S.; Köhl, J. The role of the anaphylatoxins in health and disease. Mol. Immunol. 2009, 46, 2753–2766. [Google Scholar] [CrossRef] [Green Version]
  18. Zhang, X.; Köhl, J. A complex role for complement in allergic asthma. Expert Rev. Clin. Immunol. 2010, 6, 269–277. [Google Scholar] [CrossRef] [Green Version]
  19. Sakashita, M.; Yamada, T.; Imoto, Y.; Hirota, T.; Tamari, M.; Ito, Y.; Kubo, S.; Osawa, Y.; Takahashi, N.; Fujieda, S. Long-term sublingual immunotherapy for Japanese cedar pollinosis and the levels of IL-17A and complement components 3a and 5a. Cytokine 2015, 75, 181–185. [Google Scholar] [CrossRef]
  20. Li, H.; Xu, E.; He, M. Cytokine responses to specific immunotherapy in house dust mite-induced allergic rhinitis patients. Inflammation 2015, 38, 2216–2223. [Google Scholar] [CrossRef]
  21. Yoshida, K.; Takabayashi, T.; Imoto, Y.; Sakashita, M.; Kato, Y.; Narita, N.; Fujieda, S. Increased thrombin-activatable fibrinolysis inhibitor in response to sublingual immunotherapy for allergic rhinitis. Laryngoscope 2021, 131, 2413–2420. [Google Scholar] [CrossRef] [PubMed]
Figure 1. Outline of the medication and follow-up procedures in (A) Study 1 and (B) Study 2. SLIT, sublingual immunotherapy; TNSMS, Total Nasal Symptom and Medication Score.
Pathogens 11 01280 g001
Figure 2. Schema of gene narrowing by microarray. ANOVA, analysis of variance.
Pathogens 11 01280 g002
Figure 3. Relative expression of (A) CFH and (B) GOLIM4 selected by real-time polymerase chain reaction.
Pathogens 11 01280 g003
Figure 4. Discriminant analysis of real-time polymerase chain reaction results. (A) CFH and (B) GOLIM4. A high percentage of correct classifications reflects a good result.
Pathogens 11 01280 g004
Figure 5. Variation in CFH expression. (A) The ratio of CFH expression before to two months after the start of medication between the good and poor response groups. (B) Receiver operating characteristic curve for the rate of change in CFH.
Pathogens 11 01280 g005
Table 1. Patient characteristics in Study 1.
Act/GoodSexAgesIgEFirst Season
Severity
Second Season
Severity
F6050.9moderatemild
M6131.4very severemoderate
M5220.4very severemoderate
F4316.0severemild
F478.7moderatemild
F298.5moderatemild
F486.7severemild
Act/PoorSexAgesIgEFirst Season
Severity
Second Season
Severity
F55100.0moderatemoderate
F4210.5moderatemoderate
M488.9moderatemoderate
F515.2moderatesevere
Plc/GoodSexAgesIgEFirst Season
Severity
Second Season
Severity
F4952.8very severemoderate
M4319.5very severemoderate
F378.8severemild
F488.8severemild
F415.8moderatemild
Plc/PoorSexAgesIgEFirst Season
Severity
Second Season
Severity
M5838.1moderatesevere
F5227.1moderatemoderate
M4316.5severesevere
M5815.6moderatemoderate
F498.2moderatemoderate
F285.2moderatemoderate
F263.8moderatemoderate
F, female; M, male; Act/good, good response to SLIT; Act/poor, poor response to SLIT; Plc/good, good response to placebo; Plc/poor, poor response to placebo; SLIT, sublingual immunotherapy; sIgE, specific IgE.
Table 2. Patient characteristics in Study 2.
GoodSexAgesIgEFirst Season TNSMSSecond Season TNSMS
F3596.97.585.10
M4385.75.944.35
F4165.97.685.00
F6258.45.714.32
M3439.38.326.48
F1837.88.435.05
F4134.36.842.76
M2132.63.001.43
F2520.78.893.00
F6319.24.433.26
F4917.85.103.11
F6110.17.165.67
M617.33.322.86
M275.25.053.71
F553.92.381.53
PoorSexAgesIgEFirst Season TNSMSSecond Season TNSMS
F5039.33.673.21
M2421.33.113.38
M2815.34.195.84
F3011.13.163.00
F5410.56.057.53
F428.68.298.16
F528.05.008.05
M497.22.222.53
F577.14.163.95
F566.86.206.17
F455.92.813.42
F454.84.195.16
M483.52.703.26
F601.81.742.62
M311.13.213.10
F, female; M, male; Good, good response group; Poor, poor response group; sIgE, specific IgE; TNSMS, Total Nasal Symptom and Medication Score.
Table 3. Ten genes selected by microarray.
ANOVALower Rank Test
MedicationTimeInteractionAct/GoodAct/PoorPlc/GoodPlc/Poor
Gene SymbolANOVA Categoryp-Valuep-Valuep-ValueFCReg.FCReg.FCReg.FCReg.
CFHa0.02390.74490.48671.23up1.08down1.10down1.02down
PRKCBa0.03210.69970.17851.14down1.06up1.04up1.02up
SEPT7P2a0.02370.80030.29651.14down1.06up1.03up1.04up
GOLIM4b0.58540.01510.27641.50down1.03up1.14up1.24up
EIF2Dc0.58910.48640.00911.08up1.00down1.03down1.10down
FSCN1c0.54310.82820.04151.83up1.70down1.06down1.10down
DTX3c0.44750.07930.00971.13up1.32down1.01down1.17down
TTC39Cc0.26510.23080.02781.12up1.18down1.03down1.12down
TUBB3c0.57860.25740.00581.30down1.14up1.00up1.52up
ATP8B3c0.35150.11760.01141.18down1.13up1.17up1.23up
Act/good, good response to SLIT; Act/poor, poor response to SLIT; Plc/good, good response to placebo; Plc/poor, poor response to placebo; FC, fold change; Reg., regulation; SLIT, sublingual immunotherapy; ANOVA, analysis of variance.
Publisher’s Note: MDPI stays neutral with regard to jurisdictional claims in published maps and institutional affiliations.

