
Mapping the Spatial Distribution of the Rumen Fluke Calicophoron daubneyi in a Mediterranean Area


 ,
, 
Abstract
:1. Introduction
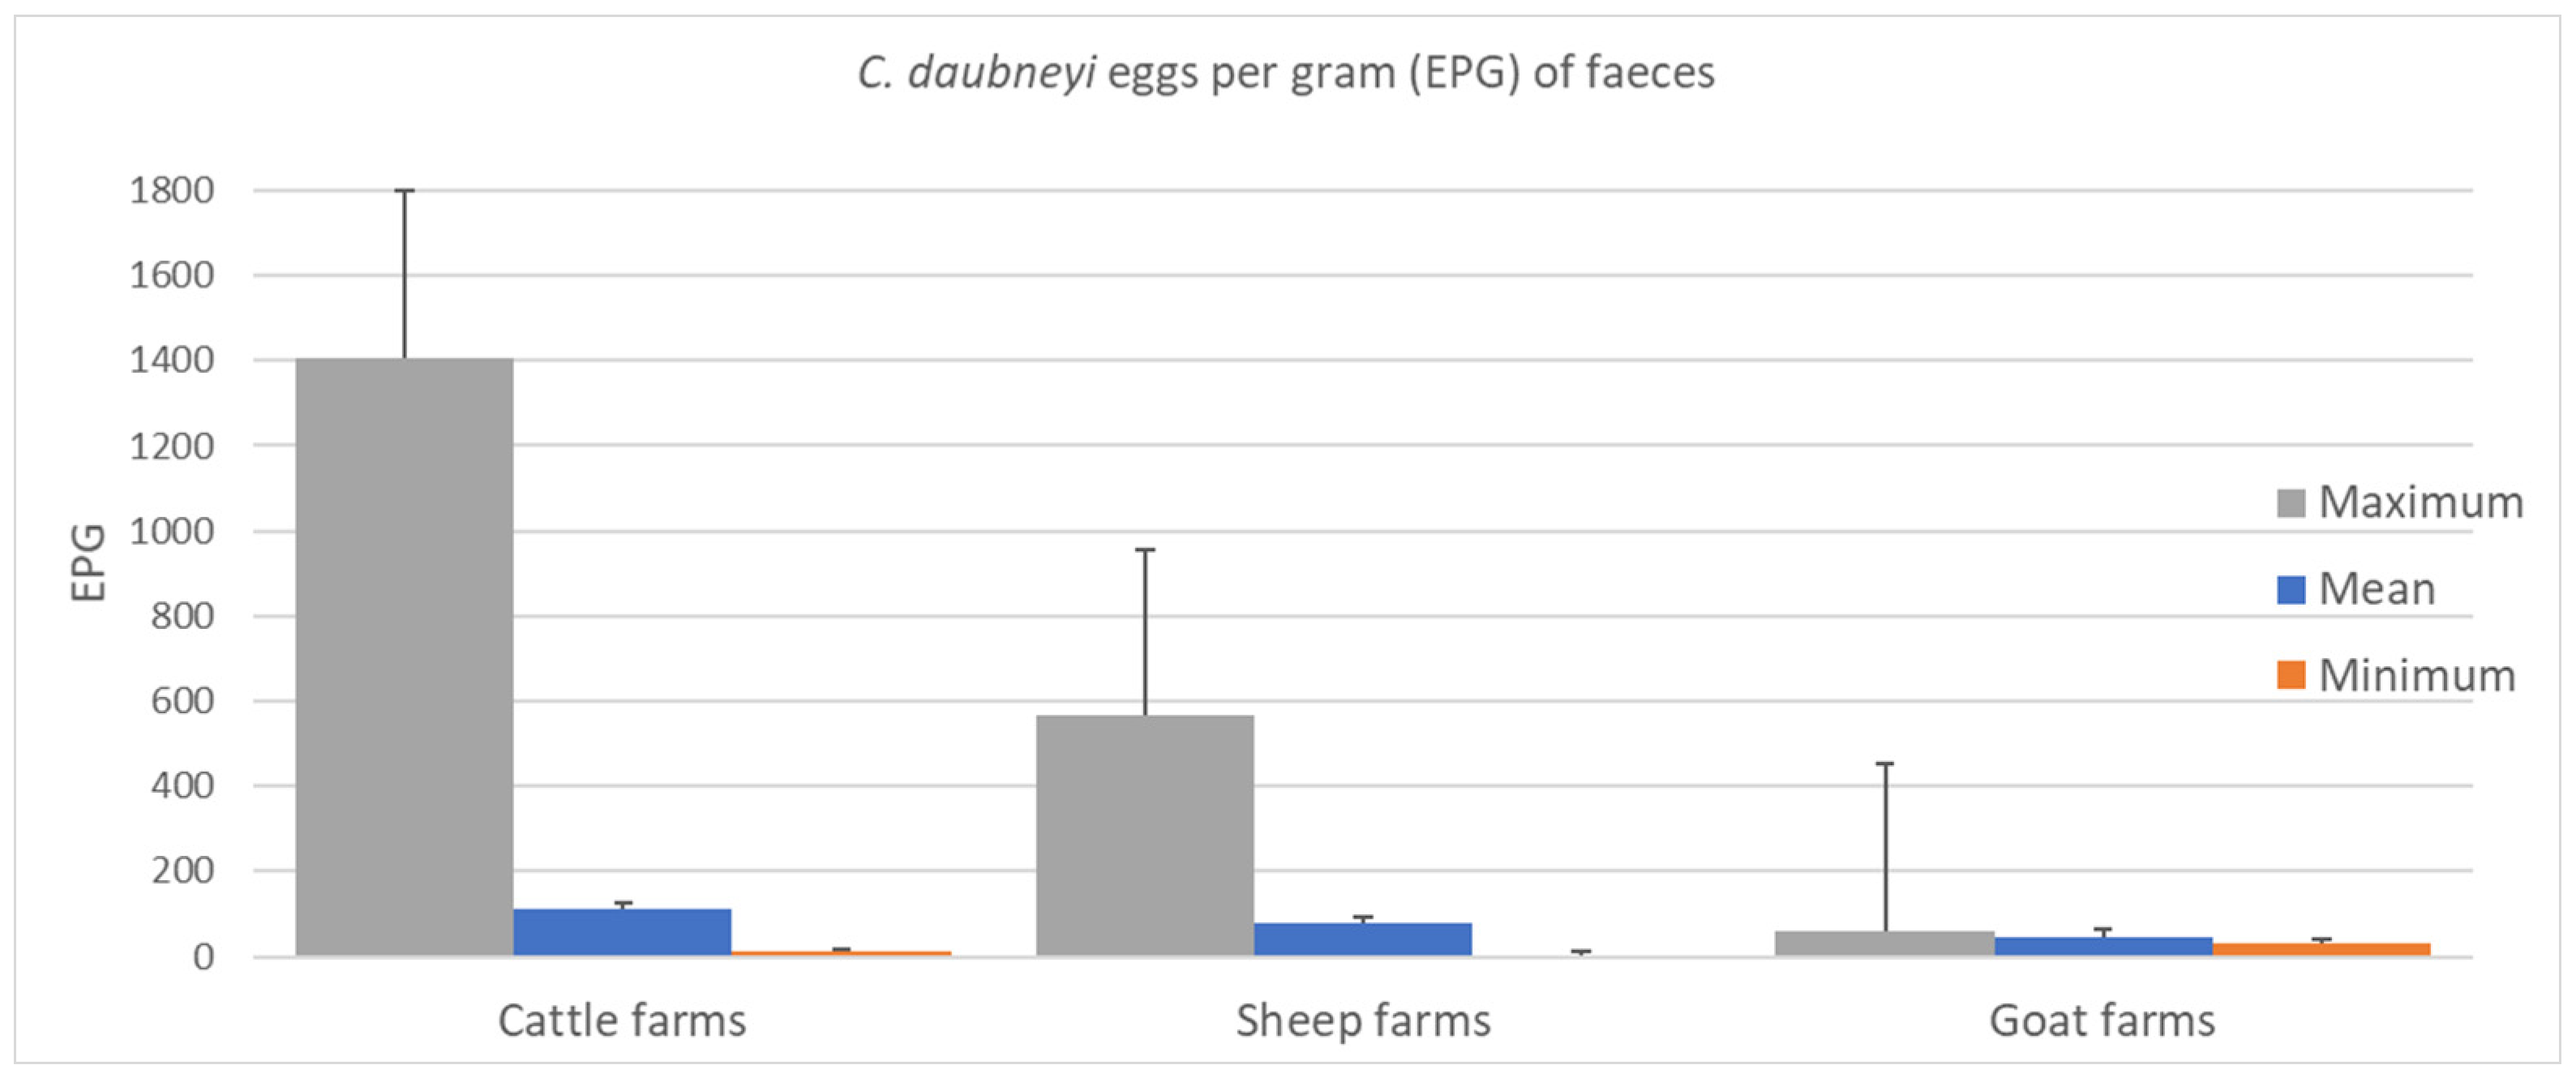
2. Results
3. Discussion
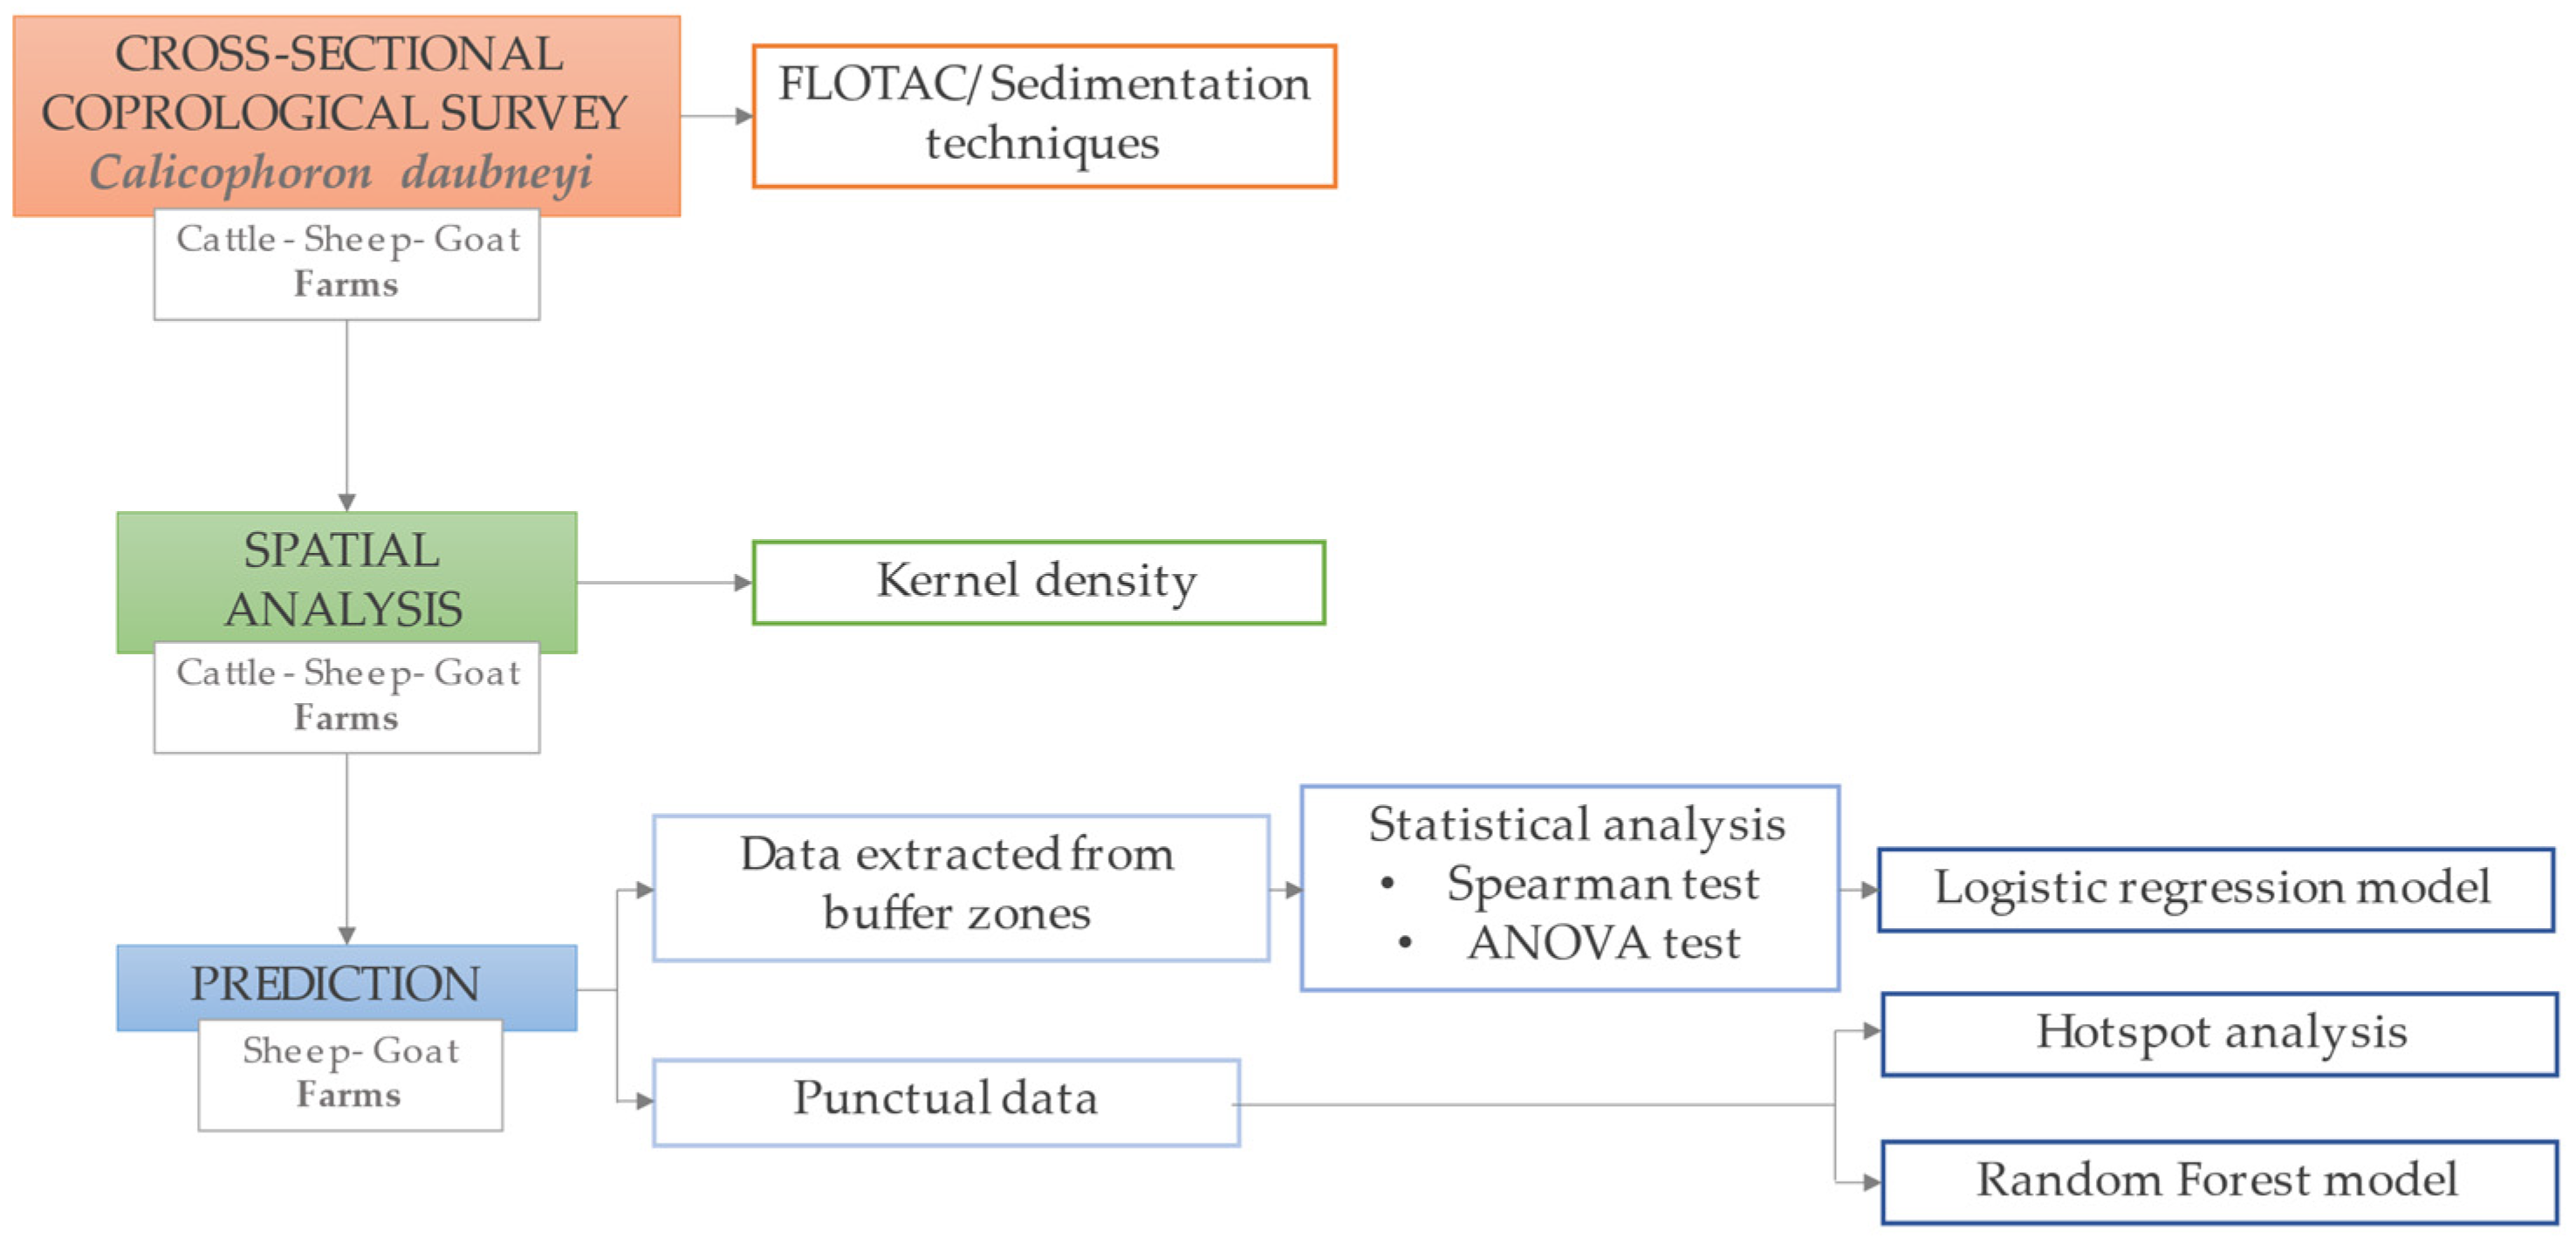
4. Materials and Methods
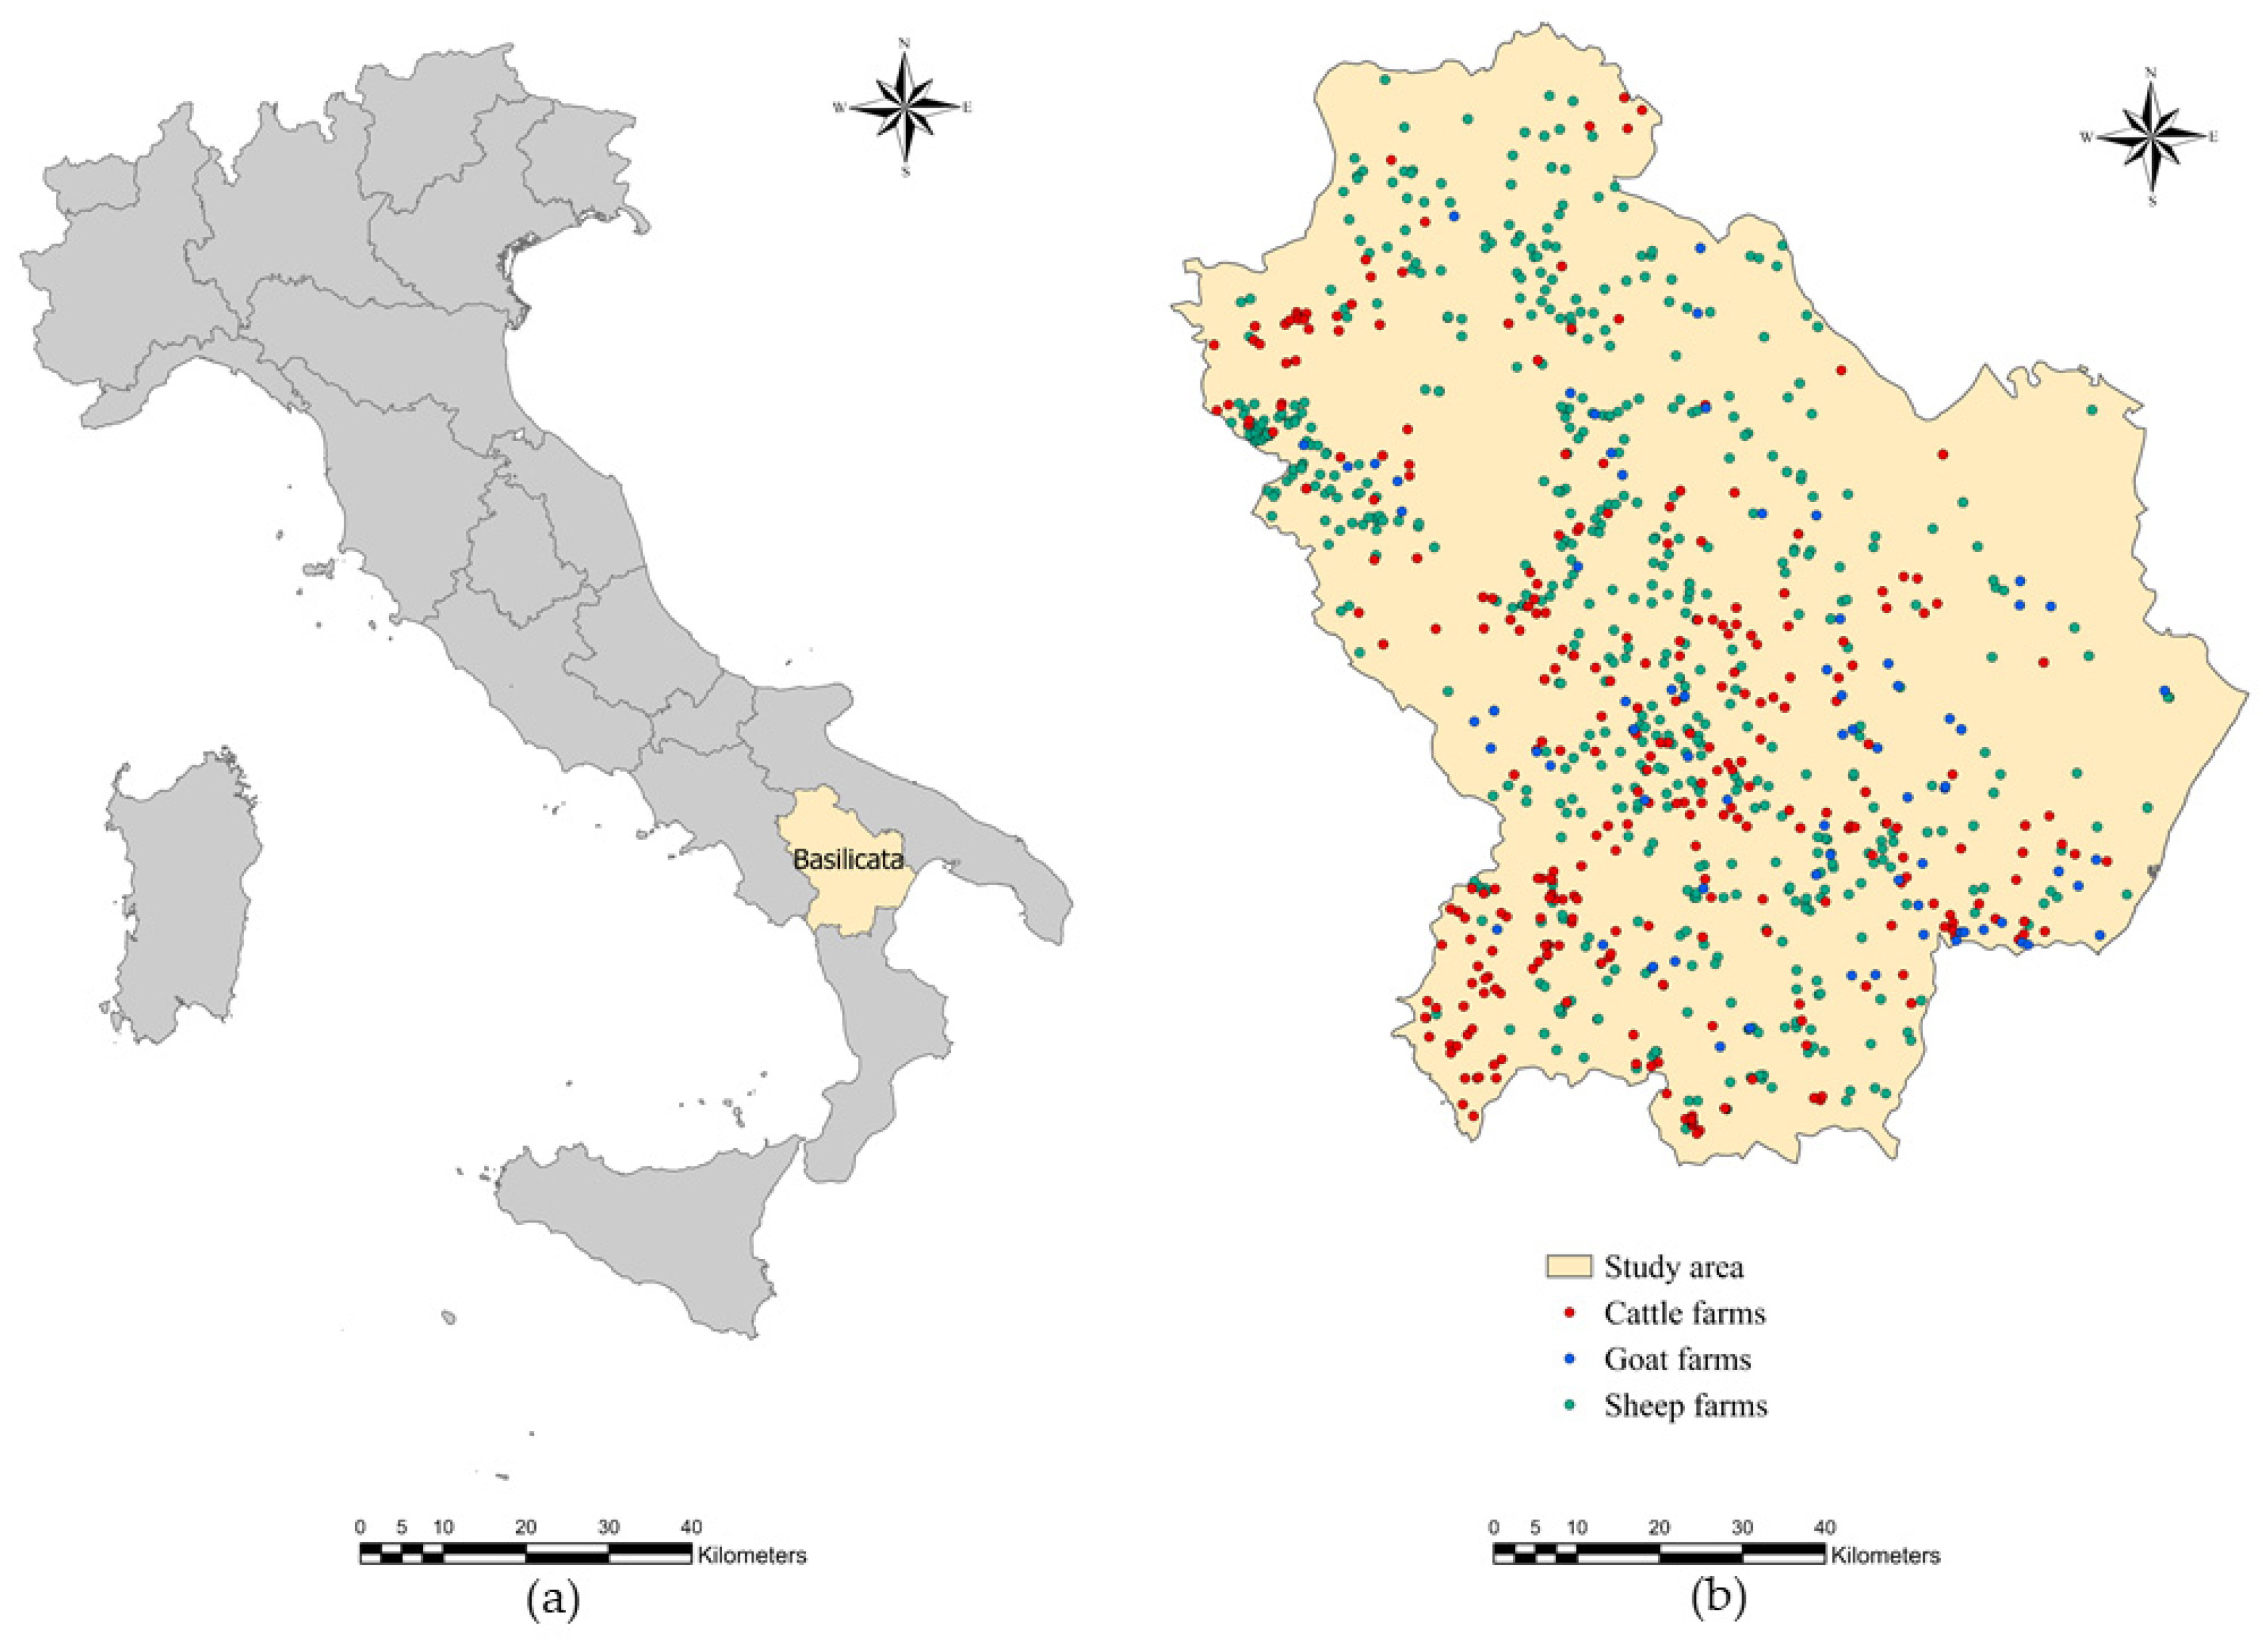
4.1. Study Area and Study Population
4.2. Sample Size and Laboratory Procedures
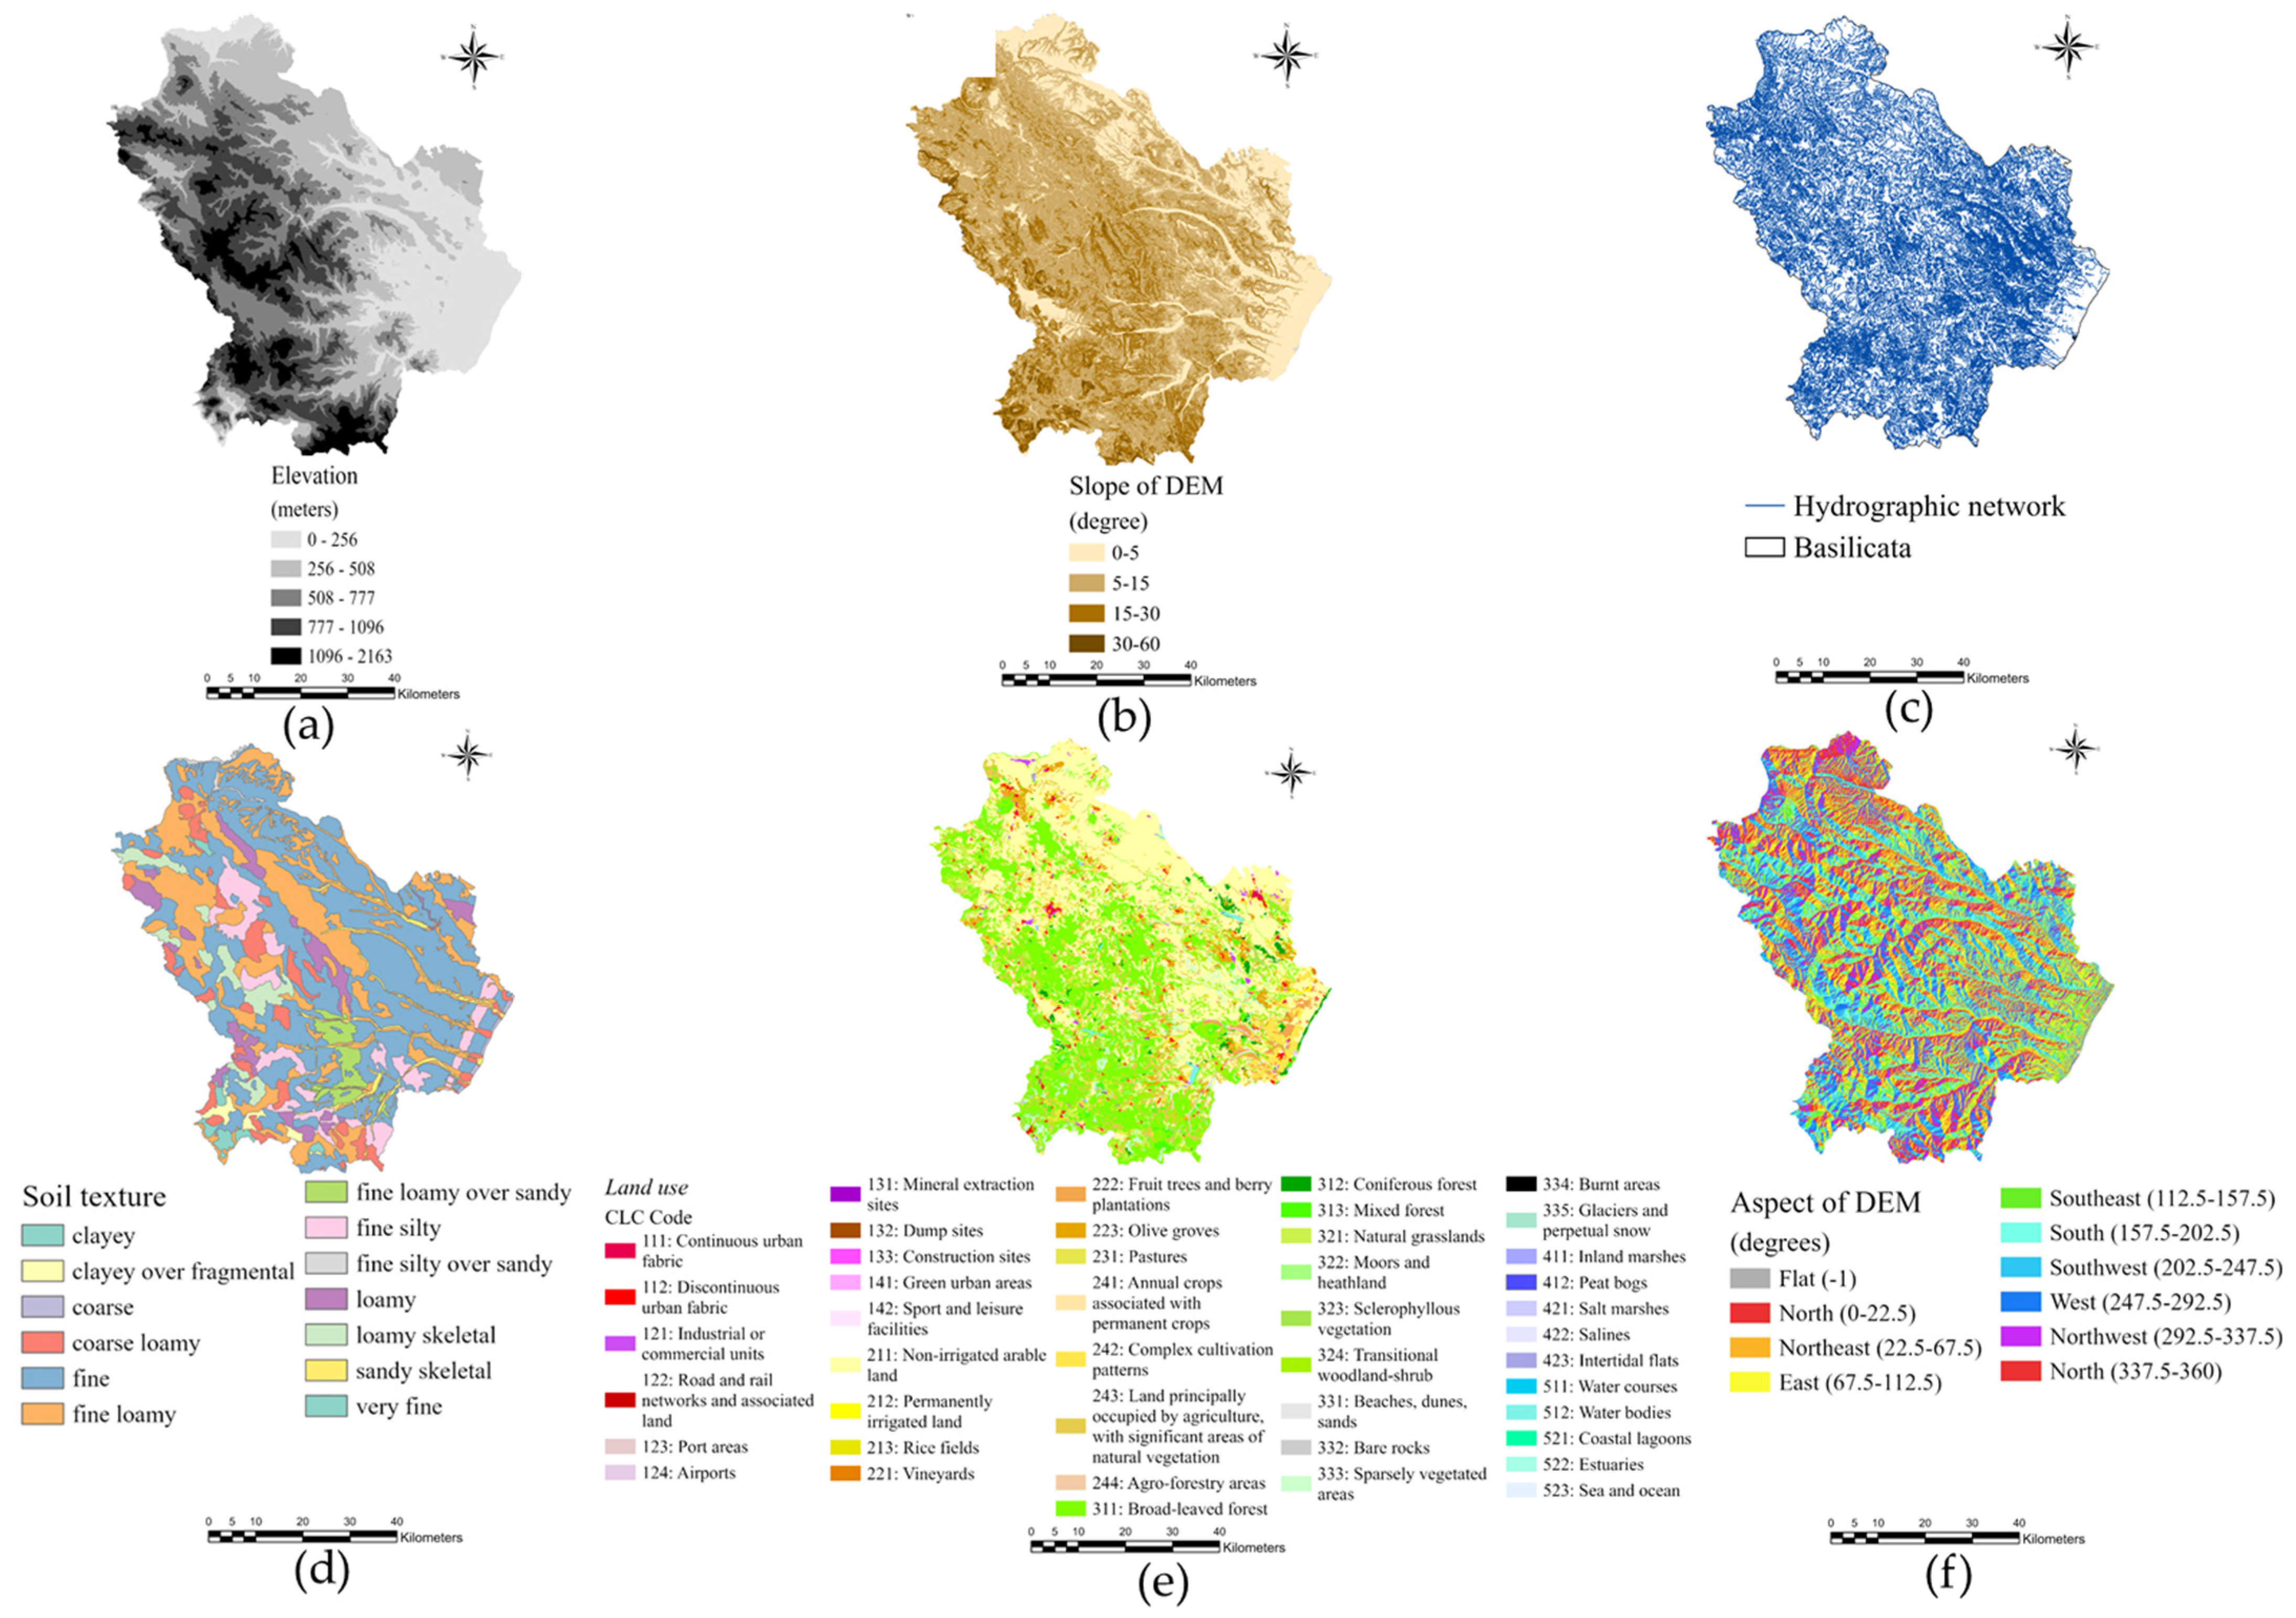
4.3. GIS Construction
4.4. Predicted Distribution of C. daubneyi
4.5. Statistical Analysis
5. Conclusions
Author Contributions
Funding
Institutional Review Board Statement
Informed Consent Statement
Data Availability Statement
Acknowledgments
Conflicts of Interest
References
- Iglesias-Piñeiro, J.; González-Warleta, M.; Castro-Hermida, J.A.; Córdoba, M.; González-Lanza, C.; Manga-González, Y.; Mezo, M. Transmission of Calicophoron daubneyi and Fasciola hepatica in Galicia (Spain): Temporal follow-up in the intermediate and definitive hosts. Parasites Vectors 2016, 9, 610. [Google Scholar] [CrossRef] [PubMed] [Green Version]
- Dorchies, P.; Lacroux, C.; Navetat, H.; Rizet, C.; Guéneau, E.; Bisson, B.; Ferté, H. Trois cas d’une nouvelle entité pathologique: La paramphistomose larvaire chez les bovins. Bulletin-GTV 2002, 13, 17–20. [Google Scholar]
- Huson, K.M.; Oliver, N.A.; Robinson, M.W. Paramphistomosis of ruminants: An emerging parasitic disease in Europe. Trends Parasitol. 2017, 33, 836–844. [Google Scholar] [CrossRef] [PubMed] [Green Version]
- Foster, A.P.; Otter, A.; O’sullivan, T.; Cranwell, M.P.; Twomey, D.F.; Millar, M.F.; Taylor, M.A. Rumen fluke (paramphistomosis) in British cattle. Vet. Rec. 2008, 162, 528. [Google Scholar] [CrossRef]
- Millar, M.; Colloff, A.; Scholes, S. Disease associated with immature paramphistome infection. Vet. Rec. 2012, 171, 509–510. [Google Scholar]
- Fenemore, C.; Floyd, T.; Mitchell, S. Rumen Fluke in Great Britain. J. Comp. Pathol. 2021, 184, 31–36. [Google Scholar] [CrossRef]
- Cringoli, G.; Taddei, R.; Rinaldi, L.; Veneziano, V.; Musella, V.; Cascone, C.; Sibilio, G.; Malone, J.B. Use of remote sensing and geographical information systems to identify environmental features that influence the distribution of paramphistomosis in sheep from the southern Italian Apennines. Vet. Parasitol. 2004, 122, 15–26. [Google Scholar] [CrossRef]
- Musella, V.; Catelan, D.; Rinaldi, L.; Lagazio, C.; Cringoli, G.; Biggeri, A. Covariate selection in multivariate spatial analysis of ovine parasitic infection. Prev. Vet. Med. 2011, 99, 69–77. [Google Scholar] [CrossRef]
- Toolan, D.P.; Mitchell, G.; Searle, K.; Sheehan, M.; Skuce, P.J.; Zadoks, R.N. Bovine and ovine rumen fluke in Ireland—Prevalence, risk factors and species identity based on passive veterinary surveillance and abattoir findings. Vet. Parasitol. 2015, 212, 168–174. [Google Scholar] [CrossRef]
- Sargison, N.; Francis, E.; Davison, C.; Barend, M.; Handel, I.; Mazeri, S. Observations on the biology, epidemiology and economic relevance of rumen flukes (Paramphistomidae) in cattle kept in a temperate environment. Vet. Parasitol. 2016, 219, 7–16. [Google Scholar] [CrossRef] [Green Version]
- Fox, N.J.; White, P.C.; McClean, C.J.; Marion, G.; Evans, A.; Hutchings, M.R. Predicting impacts of climate change on Fasciola hepatica risk. PLoS ONE 2011, 6, e16126. [Google Scholar] [CrossRef] [PubMed]
- Dinnik, J.A. Paramphistomum daubneyi sp. nov. from cattle and its snail host in the Kenya Highlands. Parasitology 1962, 52, 143–151. [Google Scholar] [CrossRef]
- González-Warleta, M.; Lladosa, S.; Antonio Castro-Hermida, J.; Martínez-Ibeas, A.M.; Conesa, D.; Muñoz, F.; López-Quílez, A.; Manga-González, Y.; Mezo, M. Bovine paramphistomosis in Galicia (Spain): Prevalence, intensity, aetiology and geospatial distribution of the infection. Vet. Parasitol. 2013, 191, 252–263. [Google Scholar] [CrossRef] [PubMed] [Green Version]
- Jones, R.A.; Brophy, P.M.; Mitchell, E.S.; Williams, H.W. Rumen fluke (Calicophoron daubneyi) on Welsh farms: Prevalence, risk factors and observations on co-infection with Fasciola hepatica. Parasitology 2017, 144, 237–247. [Google Scholar] [CrossRef] [PubMed] [Green Version]
- Naranjo-Lucena, A.; Corbalán, M.P.M.; Martínez-Ibeas, A.M.; McGrath, G.; Murray, G.; Casey, M.; Good, B.; Sayers, R.; Mulcahy, G.; Zintl, A. Spatial patterns of Fasciola hepatica and Calicophoron daubneyi infections in ruminants in Ireland and modelling of C. daubneyi infection. Parasites Vectors 2018, 11, 531. [Google Scholar] [CrossRef]
- Preethi, M.; Venu, R.; Srilatha, C.; Rao, K.S.; Rao, P.V. Prevalence of paramphistomosis in domestic ruminants in Chittoor District of Andhra Pradesh, India. Agric. Dig. 2020, 40, 61–68. [Google Scholar] [CrossRef]
- Ferreras, M.C.; Gonzalez-Lanza, C.; Perez, V.; Fuertes, M.; Benavides, J.; Mezo, M.; Gonzalez-Warleta, M.; Giraldez, F.J.; Martinez Ibeas, A.; Delgado, L.; et al. Calicophoron daubneyi (Paramphistomidae) in slaughtered cattle in Castilla y Leon (Spain). Vet. Parasitol. 2014, 199, 268–271. [Google Scholar] [CrossRef] [Green Version]
- How Forest-Based Classification and Regression Works. Available online: https://pro.arcgis.com/en/pro-app/latest/tool-reference/spatial-statistics/how-forest-works.htm (accessed on 14 July 2021).
- Strickland, J. Data Analytics Using Open-Source Tools, 1st ed.; Lulu, Inc.: Morrisville, NC, USA, 2015; p. 227. [Google Scholar]
- Rinaldi, L.; Musella, V.; Biggeri, A.; Cringoli, G. New insights into the application of geographical information systems and remote sensing in veterinary parasitology. Geospat. Health 2006, 1, 33–47. [Google Scholar] [CrossRef] [PubMed] [Green Version]
- Cutler, D.R.; Edwards, T.C., Jr.; Beard, K.H.; Cutler, A.; Hess, K.T.; Gibson, J.; Lawler, J.J. Random forests for classification in ecology. Ecology 2007, 88, 2783–2792. [Google Scholar] [CrossRef]
- Peters, J.; De Baets, B.; Calvete, C.; Lucientes, J.; De Clercq, E.M.; Ducheyne, E.; Verhoest, N.E.C. Absence reduction in entomological surveillance data to improve niche-based distribution models for Culicoides imicola. Prev. Vet. Med. 2011, 100, 15–28. [Google Scholar] [CrossRef]
- European Center for Disease Prevention and Control. Development of Aedes albopictus risk maps. In Thecnical Report; European Center for Disease Prevention and Control: Solna kommun, Sweden, 2009; 45p. [Google Scholar]
- Ducheyne, E.; Charlier, J.; Vercruysse, J.; Rinaldi, L.; Biggeri, A.; Demeler, J.; Brandt, C.; de Waal, T.; Selemetas, N.; Hoglund, J. Modelling the spatial distribution of Fasciola hepatica in dairy cattle in Europe. Geospat. Health 2015, 9, 261–270. [Google Scholar] [CrossRef] [Green Version]
- Woodward, A.; Smith, K.R.; Campbell-Lendrum, D.; Chadee, D.D.; Honda, Y.; Liu, Q.; Olwoch, J.; Revich, B.; Sauerborn, R.; Chafe, Z.; et al. Climate change and health: On the latest IPCC report. Lancet 2014, 383, 1185–1189. [Google Scholar] [CrossRef]
- Poulin, R. Global warming and temperature-mediated increases in cercarial emergence in trematode parasites. Parasitology 2006, 132, 143–151. [Google Scholar] [CrossRef]
- Charlier, J.; Bennema, S.C.; Caron, Y.; Counotte, M.; Ducheyne, E.; Hendrickx, G.; Vercruysse, J. Towards assessing fine-scale indicators for the spatial transmission risk of Fasciola hepatica in cattle. Geospat. Health 2011, 5, 239–245. [Google Scholar] [CrossRef] [PubMed]
- Rondelaud, D.; Hourdin, P.; Vignoles, P.; Dreyfuss, G. The contamination of wild watercress with Fasciola hepatica in central France depends on the ability of several lymnaeid snails to migrate upstream towards the beds. Parasitol. Res. 2005, 95, 305–309. [Google Scholar] [CrossRef] [PubMed]
- Mas-Coma, S.; Valero, M.A.; Bargues, M.D. Fasciola, lymnaeids and human fascioliasis, with a global overview on disease transmission, epidemiology, evolutionary genetics, molecular epidemiology and control. Adv. Parasitol. 2009, 69, 41–146. [Google Scholar] [CrossRef]
- Ashrafi, K.; Valero, M.A.; Peixoto, R.V.; Artigas, P.; Panova, M.; Mas-Coma, S. Distribution of Fasciola hepatica and F. gigantica in the endemic area of Guilan, Iran: Relationships between zonal overlap and phenotypic traits. Infect. Genet. Evol. 2015, 31, 95–109. [Google Scholar] [CrossRef]
- Anagrafe Nazionale Zootecnica-Statistiche. Available online: https://www.vetinfo.it/j6_statistiche/#/ (accessed on 30 June 2021).
- Associazione Regionale Allevatori della Basilicata. Available online: https://www.arabasilicata.it/ (accessed on 1 January 2016).
- Rinaldi, L.; Coles, G.C.; Maurelli, M.P.; Musella, V.; Cringoli, G. Calibration and diagnostic accuracy of simple flotation, McMaster and FLOTAC for parasite egg counts in sheep. Vet. Parasitol. 2011, 177, 345–352. [Google Scholar] [CrossRef]
- Rinaldi, L.; Levecke, B.; Bosco, A.; Ianniello, D.; Pepe, P.; Charlier, J.; Cringoli, G.; Vercruysse, J. Comparison of individual and pooled faecal samples in sheep for the assessment of gastrointestinal strongyle infection intensity and anthelmintic drug efficacy using McMaster and Mini-FLOTAC. Vet. Parasitol. 2014, 205, 216–223. [Google Scholar] [CrossRef]
- Rinaldi, L.; Amadesi, A.; Dufourd, E.; Bosco, A.; Gadanho, M.; Lehebel, A.; Maurelli, M.P.; Chuavin, A.; Charlier, J.; Cringoli, G.; et al. Rapid assessment of faecal egg count and faecal egg count reduction through composite sampling in cattle. Parasits Vectors 2019, 12, 1–8. [Google Scholar] [CrossRef]
- Cringoli, G.; Rinaldi, L.; Maurelli, M.P.; Utzinger, J. FLOTAC: New multivalent techniques for qualitative and quantitative copromicroscopic diagnosis of parasites in animals and humans. Nat. Protoc. 2010, 5, 503–515. [Google Scholar] [CrossRef]
- Duthaler, U.; Rinaldi, L.; Maurelli, M.P.; Vargas, M.; Utzinger, J.; Cringoli, G.; Keiser, J. Fasciola hepatica: Comparison of the sedimentation and FLOTAC techniques for the detection and quantification of faecal egg counts in rats. Exp. Parasitol. 2010, 126, 161–166. [Google Scholar] [CrossRef] [PubMed]
- Gordon, D.K.; Roberts, L.C.; Lean, N.; Zadoks, R.N.; Sargison, N.D.; Skuce, P.J. Identification of the rumen fluke, Calicophoron daubneyi, in GB livestock: Possible implications for liver fluke diagnosis. Vet. Parasitol. 2013, 195, 65–71. [Google Scholar] [CrossRef] [PubMed]
- Getis, A.; Ord, J.K. The analysis of spatial association by use of distance statistics. Geogr. Anal. 1992, 24, 127–145. [Google Scholar] [CrossRef]
- Ord, J.K.; Getis, A. Local Spatial Autocorrelation Statistics: Distributional Issues and an Application. Geogr. Anal. 1995, 27, 286–306. [Google Scholar] [CrossRef]
- Hot Spot Analysis (Getis-Ord Gi*) (Spatial Statistics). Available online: https://pro.arcgis.com/en/pro-app/latest/tool-reference/spatial-statistics/what-is-a-z-score-what-is-a-p-value.htm (accessed on 15 July 2021).
- Breiman, L. Random Forests. Mach. Learn 2001, 45, 5–32. [Google Scholar] [CrossRef] [Green Version]


| Variable | Importance | % |
|---|---|---|
| Soil texture | 1.52 | 21 |
| Land use | 1.45 | 20 |
| Hydrographic network | 1.42 | 19 |
| Aspect | 1.41 | 19 |
| Slope | 0.79 | 11 |
| Elevation | 0.79 | 11 |
| Variable | Spearman’s Test | One-Way ANOVA Test | ||
|---|---|---|---|---|
| rs | p Value | F Value | p Value | |
| Pastures | 0.158 | <0.001 | 6.104 | 0.014 |
| Broad-leaved forest | 0.128 | <0.001 | 7.528 | 0.060 |
| Transitional woodland-shrub | 0.096 | <0.001 | 5.739 | 0.017 |
| Medium elevation (500–100 masl) | 0.074 | <0.05 | 7.429 | 0.008 |
| High elevation | 0.132 | <0.001 | 4.683 | 0.034 |
| Average elevation | 0.151 | <0.001 | 19.654 | <0.001 |
| Standard deviation of elevation | 0.097 | <0.001 | 6.315 | 0.012 |
| Low slope (5°–15°) | 0.087 | <0.001 | 13.373 | <0.001 |
| Average slope | 0.083 | <0.05 | 17.680 | <0.001 |
| Coarse loamy | 0.114 | <0.001 | 4.580 | 0.036 |
| Loamy skeletal | 0.137 | <0.001 | 4.788 | 0.033 |
| Clayey over fragmental | 0.081 | <0.05 | 8.597 | 0.003 |
| Presence of streams and brooks | 0.102 | <0.001 | 8.679 | 0.003 |
| Variable | p | Exp (B) | 95% CI |
|---|---|---|---|
| Average elevation | 0.003 | 2.78 | 1.58–4.88 |
| Clayey over fragmental | <0.001 | 1.01 | 1.00–1.01 |
| Presence of streams and brooks | 0.009 | 1.01 | 1.00–1.02 |
| Name | Type and Resolution | Year | Source | Description |
|---|---|---|---|---|
| The Corine Land Cover | Vector layer (100 m) | 2018 | Copernicus | Inventory on land cover of EU (44 classes) |
| Regional boundaries | Vector data | 2011 | ISAT | The regional administrative boundaries |
| Hydrographic network | Vector data (1:5000) | 2015 | Geodatabase of region Basilicata | Representation of natural watercourses |
| Elevation (DTM) | Raster (100 m) | 2016 | Geodatabase of region Basilicata | Digital elevation model of the region |
| Slope | Raster (100 m) | 2016 | Geodatabase of region Basilicata | The rate of change of elevation for each cell |
| Aspect | Raster (100 m) | 2016 | Geodatabase of region Basilicata | The direction of the compass facing a slope |
| Soil texture | Vector (100 m) | 2012 | Geodatabase of region Basilicata | Distribution of the mineral particles of the soil, according to the Soil Taxonomy |
Publisher’s Note: MDPI stays neutral with regard to jurisdictional claims in published maps and institutional affiliations. |
© 2021 by the authors. Licensee MDPI, Basel, Switzerland. This article is an open access article distributed under the terms and conditions of the Creative Commons Attribution (CC BY) license (https://creativecommons.org/licenses/by/4.0/).
Share and Cite
Bosco, A.; Nocerino, M.; Santaniello, M.; Maurelli, M.P.; Cringoli, G.; Rinaldi, L. Mapping the Spatial Distribution of the Rumen Fluke Calicophoron daubneyi in a Mediterranean Area. Pathogens 2021, 10, 1122. https://doi.org/10.3390/pathogens10091122
Bosco A, Nocerino M, Santaniello M, Maurelli MP, Cringoli G, Rinaldi L. Mapping the Spatial Distribution of the Rumen Fluke Calicophoron daubneyi in a Mediterranean Area. Pathogens. 2021; 10(9):1122. https://doi.org/10.3390/pathogens10091122
Chicago/Turabian StyleBosco, Antonio, Martina Nocerino, Mirella Santaniello, Maria Paola Maurelli, Giuseppe Cringoli, and Laura Rinaldi. 2021. "Mapping the Spatial Distribution of the Rumen Fluke Calicophoron daubneyi in a Mediterranean Area" Pathogens 10, no. 9: 1122. https://doi.org/10.3390/pathogens10091122
APA StyleBosco, A., Nocerino, M., Santaniello, M., Maurelli, M. P., Cringoli, G., & Rinaldi, L. (2021). Mapping the Spatial Distribution of the Rumen Fluke Calicophoron daubneyi in a Mediterranean Area. Pathogens, 10(9), 1122. https://doi.org/10.3390/pathogens10091122