Abstract
The relationship between housekeeping and pathogenicity-related genes and virulence or avirulence towards the primary Malus resistance genes (R) has not been previously studied for Venturia inaequalis fungus, the causal agent of apple scab. In this study, the sequences of two housekeeping genes encoding elongation factor alpha (EF-1α) and β-tubulin and two previously unstudied effector genes of V. inaequalis from mannosidase and glucosidase families of 100 strains collected from apple cultivars with Rvi6, Rvi1, and Rvi17 and without known scab resistance genes were submitted to the analyses. Based on the phylogenetic and diversity data, as well as recombination analyses of the sequenced regions, we assessed the phylogenetic relationships and genetic structure of the pathogen within the species and the evolutionary forces that are currently acting upon this microorganism. The topology of the obtained phylograms demonstrates the lack of a relationship between the phylogenetic position of the strain and the host cultivar and the geographical origin or race of the strain. The isolates from different hosts were differentiated but did not form diagnosable, distinct phylogenetic groups. These results suggest that the analyzed genes may be too conserved to reflect the adaptation of pathogens to apple genotypes with different R genes; thus, they do not adequately reflect race discrimination. In contrast, based on variation and gene flow estimation, genetic divergence was observed among strains virulent to apple trees containing Rvi6. The results of this study confirmed a lack of free recombination between strains and demonstrated that the analyzed regions are in linkage disequilibrium and contain non-random polymorphisms associated with the strain.
1. Introduction
Apples are among the most economically important fruit tree crops in temperate zones, including Poland. The ascomycete Venturia inaequalis (Cooke) G. Winter is responsible for the most severe disease affecting apples, as well as many ornamental Malus species in many countries, including Poland: apple scab. Despite the consistent progress in breeding for resistance to apple scab, effective protection against the disease still primarily depends on repeated fungicide application in spring and leaf litter management in autumn [1]. To date, 17 pathogenic V. inaequalis races have been reported on Malus spp. [2], with each overcoming apple tree resistance related to one major gene of resistance (R). In recent decades, molecular population genetics have been widely utilized to demonstrate the patterns of genetic diversity within and between V. inaequalis populations and to trace the histories of divergence and speciation in pathogens by genotyping neutral microsatellite markers [3,4,5]. Several studies have obtained evidence that some races of the fungus possess unique genetic patterns recognized as an effect of strong selection pressure exerted by the host, as has been widely reported for the Rvi6 apple gene [6,7,8,9,10,11]. It has been shown that Rvi6 cultivars divide V. inaequalis populations into two genetically different subgroups, Rvi6-virulent (named race 6) and Rvi6-avirulent, while this structuring effect was not observed for other R genes. It is assumed that two pathogen lines exist: populations able to or not able to affect Rvi6 hosts, respectively. These presumably diverged and were separated by distance long time ago [10]. Currently, secondary contact between these lineages with severely restricted gene flow is observed, thereby maintaining the genetic distance between them. If two separate lineages exist, nucleotide differences are also expected, at least in more variable fragments of genes connected with vital processes or in genes connected with the interaction with host or pathogenicity process. The influence of the apple genotype, including the main resistance genes (in this instance, Rvi6, Rvi17 or Rvi1), on other genomic regions of V. inaequalis, including the core genome with housekeeping genes or genes encoding pathogenesis-related proteins, has not been studied to date.
The new gene combinations produced in the sexual stage are spread via abundantly produced spores of the asexual phase of fungus [1] which generates high genetic diversity within field populations, and is believed to be a factor facilitating pathogen adaptation to specific resistance genes of the host and environmental changes. Although pathogen variants (races) have been well characterized as causing difficulties in control, very little is known regarding genetic variation in regions of the V. inaequalis genome that are not under direct selection pressure from fungicides or from host resistance genes [12]. Aside from widely applied multilocus genotyping based on microsatellite markers, relatively few investigations have been undertaken in V. inaequalis to examine the changes in nucleotide diversity and to reveal intraspecies variations in this taxon. It was demonstrated that introns in the 18S rDNA gene and alleles of ITS1 provided genetic markers for subdividing populations of V inaequalis [12], while sequence analysis of the complete internal transcribed spacer region together with mating tests enabled the consideration of two formae speciales belonging to V. inaequalis that are responsible for scab on Malus and Pyracantha [13]. Analysis of the sequence data of six nuclear loci (actin, EF1α, the gene encoding the GTP-binding protein and the gene encoding a hypothetical protein conserved among fungi) of V. inaequalis strains derived from apple, pyracantha and loquat demonstrated that the strains were differentiated but did not form distinct phylogenetic species [7]. In contrast, no study has been performed to investigate whether the diversity of sequences of genes serving as phylogenetic markers or pathogenicity-related genes supports the separation between Rvi6-virulent and -avirulent V. inaequalis populations to date, as was reported from multilocus microsatellite loci analyses [11]. In parallel studies comparing gene expression profiles of V. inaequalis fungus growing in vitro and in planta [14], the upregulation of some genes coding cell wall-degrading enzymes (CWDEs) during fungal growth in planta was noted. Among these contigs, two regions encoding potentially pathogenicity-related genes were selected for sequence analysis.
Multilocus sequence analysis (MLSA) is a technique that enables the recognition of phylogenetic relationships between taxa based on genic regions. As reported by Hanage et al., 2006, the genes selected for the MLSA approach should be ubiquitous to the studied taxon and present in a single copy within the genome [15]. Several studies have been published describing the application of MLSA in the inferring of phylogeny based on pathogenicity factors [16], in the characterization of natural genetic variation and reproductive mode [17] or taxonomic delimitation [18] of plant and human pathogenic fungi. MLSA was also applied to discrimination between groups within the fungal species, by resolving pathogen population structure [16,18], and by determining genetic distinctness between closely related species within taxa by employing housekeeping or fungal effector genes [16,18,19].
Housekeeping genes, as slowly evolving regions that encode proteins essential for microorganism survival [20], are suitable to investigate the evolutionary pathways of taxa emergence and the relations between them, e.g., for species delimitation, and to investigate genetic relatedness among strains and populations of Eukaryota taxa, including plant or human pathogenic fungi [21,22,23], while, at the same time, conserved gene markers may exhibit insufficient intraspecies genetic variation to differentiate strains [22]. Fungal effector genes are genes coding molecules involved in interactions with host plants, but are not necessary for a pathogen to complete its lifecycle in vitro, such as those encoding infection structures, CWDEs, toxins or components suppressing the plant immune response; their products can act as elicitors or virulence and avirulence factors [24,25,26]. In MLSA of the putative effector genes, it is possible to utilize patterns of nucleotide diversity to infer the molecular base of pathogen coevolution with its host plant [27]. This approach implies that regions connected to pathogenicity specialized to host cultivars are under selective pressure exerted by host resistance genes and are expected to differ between pathogenic races or types [28]. An adaptation to the new ecological niches depends mostly on the genes located on the variable regions of the genome, which can adapt more quickly than the conservative parts of the genome, thereby causing detectable differences between them. To the best of our knowledge, these regions have never been investigated in the context of phylogenetic analyses in V. inaequalis or in terms of their diversity in relation to the virulence abilities of V. inaequalis races.
In this study, two housekeeping genes, elongation factor alpha (EF-1α) and β-tubulin, and two previously unstudied effector genes of V. inaequalis, one from mannosidase and one from the glucosidase family, were investigated to infer phylogenetic relationships and genetic structure within the species and to detect whether there is any relationship between genetic variation and host specialization among the strains of V. inaequalis species.
The aims of the study were to assess (a) the phylogenetic structure of the pathogen within the species to answer the question of whether the populations that are virulent or avirulent to Rvi6 cultivars belong to distinct phylogenetic lineages; (b) the genetic divergence among groups of strains to identify intraspecific populations; (c) the evolutionary forces that are currently acting on this microorganism; and (d) the possible occurrence of recombination events within the species. To investigate these aims, we applied phylogenetic, diversity and recombination analyses to the sequence data of four genetic loci.
2. Results
2.1. Phylogenetic Analyses
As a result of the amplification of gene fragments of 100 strains of V. inaequalis (Table 1), products of the following sizes were obtained: 436 or 487 bp for β-tubulin, 385 bp for EF-1α, 858 bp for mannosidase and 1006 bp for glucosidase, while the length of the sequences after trimming for final alignments was slightly shorter (as listed in Table 2a).

Table 1.
The names and origins of the V. inaequalis populations.
Table 2.
Parameters of sequence polymorphism, nucleotide diversity and neutrality tests for single loci (a), concatenated data (b) and estimated for assumed groups of populations of V. inaequalis: Rvi6-virulent and Rvi6-avirulent (c).
The partition homogeneity test for housekeeping and pathogenicity-related genes demonstrated that combining the data generally improved phylogenetic accuracy (p > 0.01, ref. [29]); thus, the nucleotide sequences of the genes could be concatenated.
Although slightly different relationships between leaves among dendrograms obtained using Maximum Parsimony, Maximum Likelihood and Neighbor-Joining) criteria were observed, the genealogy of each locus was best resolved (visualized) by a single rooted NJ tree. The topologies of the trees representing all the regions and combined datasets were similar in the NJ and Bayesian analyses; therefore, only NJ trees are presented (Figure 1a–f), with bootstrap values being shown for well-supported branches and Bpp values being given for co-occurring nodes. Each tree had a minimal length equal to the number of polymorphic sites in that locus.
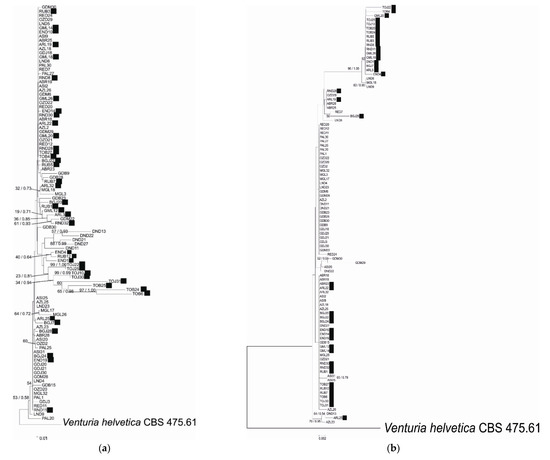
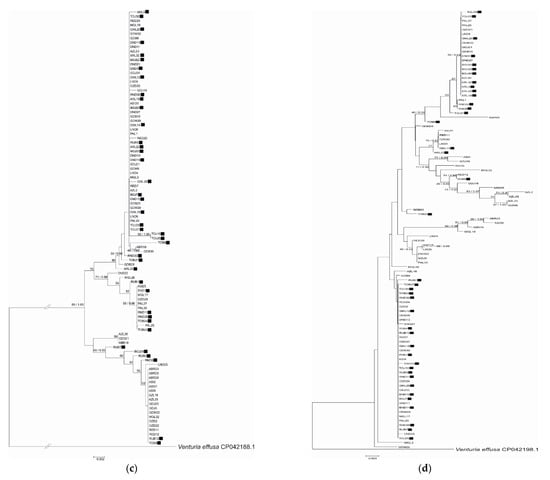
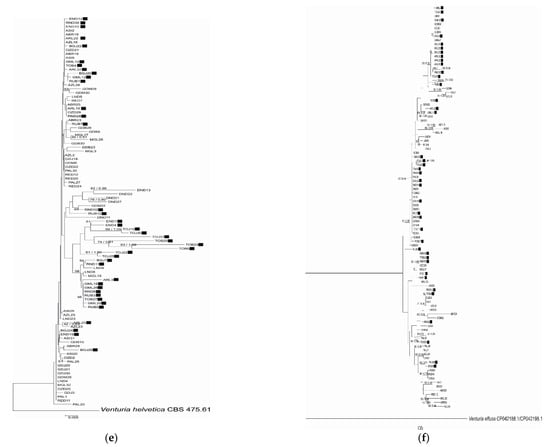
Figure 1.
Phylogenetic relationship of Venturia inaequalis based on Neighbor Joining analysis of (a) EF-1α, (b) β-tubulin, (c) mannosidase and (d) glucosidase sequences and concatenated data: (e) EF-1α and β-tubulin and (f) mannosidase and glucosidase. Bayesian posterior probabilities values (Bpp) are given for common nodes next to NJ bootstrap values (1000 replicates), which are indicated close to the nodes. Bootstrap values above 50% are given. The scale bars represent the number of base substitutions per site. Black squares indicate Rvi6-virulent strains.
The phylogenetic analysis of EF-1α, β-tubulin, mannosidase and glucosidase regions or combined datasets of the housekeeping- or pathogenicity-related genes indicated slightly different topologies between the studied gene fragments. None of the genealogies resolved the isolates from different cultivars as distinct clades according to virulence type towards Rvi6, as was expected from previous studies. Moreover, no relation between strain position and its origin, i.e., plant cultivar or geographic localization, was detected. The visual inspection of well-supported nodes exhibited no particular topological congruence among individual gene trees. The majority of nodes on trees were supported with low bootstrap values (below 50), indicating low variation among strains.
2.2. Intragene Polymorphisms
The lowest average sequence similarity within the analyzed fragment was observed for EF-1α (93.3%), while the highest was observed for mannosidase (98.9%). The G+C content was similar for all analyzed regions and ranged from 0.481 to 0.569, and the lowest G+C content was observed in mannosidase (below 50%). The highest percentage of parsimony informative sites and segregating sites (S), as well as the number of haplotypes per locus, were counted for EF-1α, although this gene fragment was the shortest one analyzed. Similarly, gene diversity (Hd) and Theta-W values were the highest for this region.
Only for EF-1α was the null hypothesis of neutrality rejected in both the Tajima’s D and the Fu and Li’s D tests. A significant negative value of D, but in only one of the tests, Fu and Li’s D test, was also observed for the β-tubulin gene. Positive or negative values of D statistics, although not significant, were observed for mannosidase and glucosidase, indicating that these regions are evolving close to mutation–drift equilibrium, and no evidence of selection can be observed. In concatenated dataset analysis, the number of parsimony informative sites, the percentage of segregating sites (S) sites and haplotypes as well as two parameters of nucleotide diversity (π and Theta W) and gene diversity (Hd) were higher for combined housekeeping genes than for pathogenicity-related genes (Table 2b). Only for concatenated EF-1α and β-tubulin genes were the values of Tajima’s D and Fu and Li’s D significantly negative. When Rvi6-virulent and -avirulent populations were compared for single loci, the percentage of segregating sites (S) and Theta-W values were higher in Rvi6 populations, with the exception of glucosidase (Table 2c). A value of nucleotide diversity (π) was higher in Rvi6-virulent populations for EF-1α and β-tubulin, while it was higher in Rvi6-avirulent populations for mannosidase and glucosidase regions. The percentages of haplotypes and parsimony informative sites were higher in Rvi6-avirulent populations for β-tubulin and glucosidase regions, while these values were higher in Rvi6-virulent populations for EF-1α and mannosidase regions, which corresponded to the distribution of the gene diversity (Hd) values for these regions. For EF-1α, β-tubulin and glucosidase, values of Tajima’s D test were higher for Rvi6 populations, although only for EF-1α were they significant.
The results of the McDonald–Kreitman test, conducted on coding sequences, revealed that in EF-1α and glucosidase gene fragments, there is a twofold increased number of non-neutral polymorphisms compared to the number of neutral polymorphisms (Table 3), while in the β-tubulin region, the same number of neutral and non-neutral polymorphisms was detected. In mannosidase coding regions, the number of synonymous polymorphisms was almost nine times higher than the number of non-synonymous polymorphisms, which was congruent with the topology of the dendrogram constructed based on the protein sequence: on the tree obtained for mannosidase, the smallest number of leaves was observed among all obtained phylograms, both nucleotide and protein based (data not shown). The highest diversity in protein sequence (the largest number of leaves) was observed on the protein dendrogram obtained for the glucosidase coding region.
Table 3.
Neutral and non-neutral polymorphisms within Rvi6-virulent and -avirulent populations of V. inaequalis according to McDonald–Kreitman test.
2.3. DNA Divergence and Differentiation between Strains of Rvi6-Virulent and -Avirulent Populations
Gene flow estimates of Nei [30], represented by Nm values calculated in DnaSP between Rvi6-virulent and -avirulent populations, were highest for EF-1α and lowest for β-tubulin (Table 4). Additionally, the average number of nucleotide substitutions per site between these populations (average pairwise divergence, DXY) was the highest for EF-1α, while the average number of nucleotide differentiations between populations was the highest for glucosidase.
Table 4.
Estimators of gene flow and DNA divergence between Rvi6-virulent and -avirulent populations of V. inaequalis, obtained for single loci (EF-1α, β-tubulin, mannosidase and glucan-1,3-β-glucosidase) and concatenated data and minimal number of recombination events (RM) observed across the data.
Analysis of molecular variance (AMOVA) among the two groups, that is, one containing only Rvi6-virulent populations and the other containing Rvi6-avirulent populations, demonstrated that the largest genetic variation was partitioned between individuals within populations (65.6–91.7%, depending on the gene), while the lowest values were observed among groups (0.6–3.2%) (Table 5). The exception was observed for the β-tubulin gene, for which the observed variation among groups was 31.9%, while the lowest variation was observed among populations within groups (2.5%). When each group of populations was considered separately for each gene (only Rvi6-virulent or Rvi6-avirulent populations in the group), the greatest genetic variation was again partitioned between individuals within populations (from 77.0 to 96.6%), regardless of the gene and group, but the variation among populations was significantly higher in the Rvi6-virulent group than in the Rvi6-avirulent group for the analyzed genes with the exception of the β-tubulin region. In this instance, variation among populations was higher for the Rvi6-avirulent group than for the Rvi6-virulent group.
Table 5.
Estimates of molecular variance (AMOVA) and gene flow (FST) obtained for two assumed populations of V. inaequalis: Rvi6-virulent and -avirulent and for the comparison between these two populations.
Compared between the Rvi6-virulent and -avirulent populations, significant FST values were higher for the two analyzed housekeeping genes, 0.34 and 0.23 for β-tubulin and EF-1α, respectively, than the values obtained for genes related to pathogenicity: 0.16 and 0.08 for mannosidase and glucosidase, respectively (Table 5). This result indicates that genetic distance (restricted gene flow and genetic isolation between the two populations) inferred from housekeeping genes is higher among the two population types, while the higher similarity of genes related to pathogenicity results from possible gene flow between strains within these regions.
When Rvi6-virulent and Rvi6-avirulent population groups were compared for each region, a closer relationship was usually observed among Rvi6-avirulent populations (for EF-1α, mannosidase and glucosidase regions), while Rvi6-virulent populations were more distanced (Table 5). Again, an exception was observed for the β-tubulin region: gene flow related to the FST value was higher among Rvi6-virulent populations than among Rvi6-avirulent populations.
2.4. Recombination and Linkage Disequilibrium Analysis
The extent of linkage disequilibrium and recombination between and within Rvi6-virulent and -avirulent populations was assessed using a) split decomposition and recombination detection analyses, b) index of association (rBARd) and c) the four gametes test for the detection of the minimum number of recombination events (RM).
(a) Split decomposition analyses revealed a lack of reticulation among strains for all studied regions analyzed as separate or concatenated datasets, suggesting a lack of recombination between strains. However, the phi test did find statistically significant evidence for recombination (p < 0.05) in glucosidase and mannosidase genes but not in EF-1α and β-tubulin loci. Additionally, recombination signals were detected using two out of seven algorithms under RDP4 for the glucosidase locus only. Consequently, evidence for recombination in the phi test, as well as recombination signals, were detected in the concatenated mannosidase and glucosidase dataset only (in three of seven used algorithms under RDP4).
(b) The random recombination hypothesis was tested both for all strains without any grouping assumptions, as well as for the strains divided into two assumed populations: Rvi6-virulent and -avirulent. In both analyses, rBARd values were significantly higher than 0 (p < 0.01) for all analyzed regions and combined pathogenicity-related regions (Table 6), showing that the null hypothesis that assumes a lack of association could be rejected for all strains and between the strains and groups of strains for which recombination is restricted. This phenomenon was observed for all regions, which indicates that all analyzed regions showed evidence for linkage disequilibrium. The highest index of multilocus association was observed for mannosidase (0.5005). However, random recombination was possible when concatenated datasets of EF-1α and β-tubulin were analyzed—either among all strains or for the assumed two populations (p > 0.05). Complete panmixia, related to rBARd values near 0, is expected for fully recombining populations, while in linkage disequilibrium, a deviation from panmixia is observed, related to an rBARd value significantly greater than 0.
Table 6.
Estimation of index of association (rBARd) calculated between 100 strains of V. inaequalis and between two assumed groups of populations: Rvi6-virulent and -avirulent.
(c) Data were considered to have failed the simple four gamete test if the minimum number of recombination events (RM) needed to explain the alleles was ≥1 [31]. Estimation of intralocus recombination parameters showed that the minimum number of recombination events ranged from three to 20 across loci; this value was the highest for the EF-1α gene among single loci (Table 4). Interlocus recombination events equaled 23 and 26 for combined datasets of housekeeping- and pathogenicity-related genes, respectively.
3. Discussion
The advantages of DNA sequencing and advances in phylogenetic analysis have provided a powerful means of studying the differentiation and evolution of fungal species. Using multilocus sequence analyses, it is possible to detect evolutionary processes at the strain, population and species levels, leading to differentiation.
3.1. Phylogenetic Relationships between Rvi6-Virulent and Rvi6-Avirulent Strains
The housekeeping genes used in the study, EF-1α and β-tubulin, are frequently used as molecular phylogenetic markers to deduce the evolutionary history and genetic variation of morphologically similar fungal species [32] and also reliably estimate the phylogenetic relationships within Venturia [33]. In our study, although the EF-1α gene showed the highest phylogenetic signal from the analyzed regions (the highest percentage of parsimony informative and segregating sites) and the concatenated dataset based on housekeeping genes had more phylogenetic signals that concatenated pathogenicity-related regions, it was not possible to differentiate the V. inaequalis Rvi6-virulent from -avirulent strains based on these regions in our study, which can be explained by insufficient variation in housekeeping gene sequences. Although multiple gene sequences are evolving with different substitution patterns, concatenating gene sequences into a supergene alignment may provide more accurate trees [33]; however, in our study, concatenated data did not exhibit discrimination between Rvi6-virulent and -avirulent populations. All strains used in this study, representing four pathogenic races (according to Bus et al., 2011 [2]), were examined previously by multilocus microsatellite analysis [11]. These and other reports, comprising V. inaequalis populations from European orchards, demonstrated that pathogen populations, sampled from various apple tree cultivars, are divided into two main groups, where belonging to a group is conditioned by virulence or avirulence towards the Rvi6 host gene [5,9,10,11]. Therefore, our experiment aimed to verify whether this division is also detectable in genic regions, especially those potentially related to pathogenicity. Our results indicated no correlation between the genetic features of the tested strains and their geographical origin, host cultivar or pathological race. Similarly, Zhao et al. [33] reported that intraspecific phylogenetic relationships among strains belonging to different pathological races in V. nashicola were not detected. Additionally, Gladieux et al. [7] observed that none of the single-locus genealogies showed a clear partitioning of isolates from various host plants into separate clusters; however, they observed a substantial level of differentiation among three groups: infecting loquat, pyracantha or apple, indicating that some forces act to counteract free exchanges of genetic material. In this instance, isolates from different hosts were differentiated but did not form diagnosable distinct phylogenetic groups. Moreover, many clades or subclades were resolved with low (below 50%) bootstrap values, indicating that overall sequence diversity is not high. This phenomenon may be observed when very conserved DNA fragments are used and sequences are too similar to each other; thus, the number of informative sites is too small, and variation is too low, and grouping into branches is therefore equivocal.
3.2. Factors Influencing the Genetic Diversity and Divergence among Rvi6-Virulent and Rvi6-Avirulent Strains
Although it was reported that sequences of genes encoding pathogenicity factors, such as endopolygalacturonase and exopolygalacturonase, have been used and proved to be helpful to reveal the relationship of genetic divergence with pathogenicity variation [28], in our study, this relation was undetectable for strains showing different virulence patterns (i.e., virulence to different Rvi6 hosts) based on pathogenicity-related regions. In contrast to microsatellite markers [11], both housekeeping- and pathogenicity-related genes selected in this study were insufficient in separating strains of known virulence patterns in this study. The possible reason for this finding is that analyzed genes are not connected with the genome regions related to pathogen virulence to various cultivars of plant hosts or are located in the conservative regions of the genome; thus, they do not adequately reflect the genetic diversity within the taxon for the purpose of race discrimination. Another possibility is that microsatellites, which are randomly scattered beyond genic regions of the genome, and are highly polymorphic and variable DNA structures, have much higher mutation rates operating at the microsatellite loci than do point mutations in genic regions [34], which leads to greater intrapopulation genetic diversity; thus, any traces of genome rearrangements should be first detected in microsatellite regions at the population level.
To demonstrate the genetic diversity, population divergence and neutrality of mutations, we used Tajima’s D and Fu and Li’s D tests. Values of Tajima’s D test were higher in Rvi6 populations for three of four analyzed loci, while in Rvi6-avirulent populations, they were higher for mannosidase. Tajima’s D may be higher in populations that have experienced a recent bottleneck because of the preferential loss of low-frequency variants [35]. The expected pattern of average Tajima’s D values through time after a bottleneck includes an initial period of positive D values, declining towards a period of negative D values, and finally turning back towards equilibrium [36]. However, the values for only one gene, EF-1α, were significantly negative, which may be related to a recent selective sweep, linkage of the analyzed region to a swept gene or population expansion after a recent bottleneck, while the rest of the regions are under neutral selection. Moreover, the values of gene flow (expressed as Nm, DnaSP) and average pairwise differentiation (Dxy) calculated between virulent and avirulent Rvi6 strains were the highest for the EF-1α gene and the lowest for β-tubulin. This finding may suggest that housekeeping genes may be under selective pressure to retain function, although the pressure can act on some regions only. In addition, the McDonald–Kreitman test conducted between the two groups of strains demonstrated diversifying selection acting on EF-1α and glucosidase gene fragments, while the β-tubulin region was under neutral selection, and the mannosidase protein fragment was the most evolutionarily conserved in the study. More detailed studies are necessary to establish which genes are relevant for the adaptation of V. inaequalis strains to the defined virulence type.
Moreover, in most cases (that is, for three of four loci), higher variation was observed among Rvi6-virulent populations than in Rvi6-avirulent populations, which was congruent with gene flow FST estimates, indicating that populations in the Rvi6-virulent group were more distanced, while those in the Rvi6-avirulent group were closely related. Meanwhile, higher gene diversity was observed for two regions in Rvi6-virulent populations, while for two other regions, it was observed in Rvi6-avirulent populations. Usually, a higher number of segregating sites, nucleotide diversity and Theta-W values were found in Rvi6-virulent populations than in Rvi6-avirulent populations for three loci. Selection might not be the main reason for the severe reduction of diversity in Rvi6-avirulent populations, although the effects of selection cannot be excluded entirely. The reduced level of genetic diversity may reflect the consequence of evolutionary processes, such as a recent speciation event, population bottleneck or selective sweep for a preferred genotypic variant in V. inaequalis [37]. This finding is in contrast to the results obtained in multilocus microsatellite loci, where Rvi6-virulent populations were characterized by low gene diversity, even demonstrating a clonal structure [6,8,11]. It has been proven that Rvi6 populations are the descendants of a few genetically different virulent individuals that migrated relatively recently to Poland from non-agricultural reservoirs, and they are not abundantly represented in our county at present. In contrast, Rvi6-avirulent populations, commonly occurring in our agrosystem for decades and which are evolutionarily older, were characterized by higher allelic and private allelic richness, as well as higher genetic diversity [11]. Our current finding about the level of diversity of the studied strains, based on gene regions, may suggest that the examined Rvi6-avirulent individuals are only a small representation of the whole Rvi6-avirulent population in Poland and that the rate and mechanism of evolution are different for genic and microsatellite regions, and their effects cannot be compared. These genes were studied to assess another level of genetic variation between pathogen populations. However, the examined regions are not sufficient to resolve differentiation among Rvi6-virulent and -avirulent populations, while generally, genetic diversity between populations is supposed to be a factor facilitating adaptation of pathogens to specific resistance genes of the host both by increasing risks of avirulence losses and the spread of new virulences.
3.3. Recombination between Rvi6-Virulent and Rvi6-Avirulent Strains
Depending on the algorithm used, only in glucosidase or in the glucosidase and mannosidase concatenated dataset were recombination signals detected. On the other hand, estimation of the index of association based on four single loci demonstrated that random mating was restricted both among all strains and between assumed groups of strains, that is, Rvi6-virulent and -avirulent, which indicates that some loci can be associated. Theoretically, linkage disequilibrium is affected by various evolutionary and demographic factors, including selection, recombination, population admixture, inbreeding and bottlenecks [38]. The restricted recombination between the strains and between assumed groups is consistent with a model of reproductively isolated populations (i.e., virulent or avirulent towards Rvi6 cultivars). However, this reproductive barrier or significant genetic differentiation between groups cannot be explained by geographic isolation, since strains of different virulence were sampled in the same orchard in half of the cases (strains from Lublin and Nowy Dwor). Based on the data obtained in this study, we did not find evidence of gene flow after secondary contact in the analyzed regions, as was previously observed for virulent and avirulent Rvi6 populations based on microsatellite markers [11]. Moreover, in the absence of recombination, all gene trees should be congruent, and alleles at different gene regions should be associated [17]. In our study, visual comparison of the dendrograms constructed based on four loci and concatenated data showed no compatibility between them; strains from various races were scattered randomly without a clear tendency in grouping and independent of the analyzed region. Moreover, the association of alleles was detected for groups of strains. These data confirm the presence of recombination between strains and enable us to assume that the analyzed regions are in linkage disequilibrium and contain non-random polymorphisms associated with the strain.
4. Materials and Methods
4.1. Collection of Fungal Samples
During the late spring and early summer of 2012–2014, infected leaves with clear scab lesions were randomly collected in six chemically controlled apple tree orchards, two organic fungicide-free orchards and two orchards employing mixed types of control (i.e., containing both non-chemically and chemically protected cultivars) located in the central, southern and northern parts of Poland. In all the orchard trees of Malus x domestica, in addition to one location where leaves of crab apple trees were obtained, F1 seedlings of Malus x zumi var. “Colocarpa” originating from open pollination (OZD, Dąbrowice) were collected. The sampled apple trees represented both mono-R-genic cultivars (Rvi1, Rvi6 or Rvi17) and cultivars without any known sources of apple scab resistance (hereafter designated Rvi0). The scab lesions were sampled and prepared for the analysis as described previously [11]. In total, DNA was obtained from 100 strains of V. inaequalis, which were divided into 20 groups according to cultivar and/or location, each containing five strains, and the DNA was subjected to further analyses (Table 1).
4.2. Designing Primers for PCR and Amplification of Pathogenicity-Related Genes
The genome of V. inaequalis (“Venin1”), provided by Cecilia Deng at the New Zealand Institute for Plant and Food Research Limited, available at https://genome.jgi.doe.gov/Venin1/Venin1.home.html (accessed on 3 February 2021), was searched for CWDE sequences. Among these sequences, two contigs, one complementary to mannosidase and one to glucosidase of Venin1, were selected, and primers were designed for them using PrimerSelect software of the Lasergene v. 8 package (DNASTAR, Madison, WI, USA). The specificity of designed primer sets was tested in conventional PCRs using DNA from 100 isolates of V. inaequalis pure culture (collection of Research Institute of Horticulture, Skierniewice, Poland). After the optimization process was undertaken, two primer sets were selected and used for the amplification of part of mannosidase and glucosidase gene sequences, VinManno1 and VinManno2, and VinGluco1 and VinGluco2 (Table 7), respectively, in PCR with DNA of all strains collected in the study (Table 1). The conditions for each reaction consisted of an initial denaturation at 95 °C for 3 min followed by 35 cycles of denaturation at 95 °C for 30 s, annealing at 61 °C for the primers VinManno1 and VinManno2 or at 60 °C for the primers VinGluco1/VinGluco2 for 30 s, polymerization at 72 °C for 60 s and a final extension step at 72 °C for 5 min. Each reaction was performed in a total volume of 30 µL containing 1–10 ng of DNA, 0.133 mM of each dNTP, 500 nM of each primer, 0.9 U of DreamTaq DNA Polymerase (Thermo Fisher Scientific, Vilnius, Lithuania), 1 × optimized DreamTaq Green Buffer (Thermo Fisher Scientific, Vilnius, Lithuania) and double-distilled water.
Table 7.
Primers used in the study.
4.3. Amplification of Housekeeping Genes
For the sequence analyses of housekeeping genes of all studied strains, two genes were selected, encoding EF-1α and β-tubulin. A fragment of DNA of EF-1α was amplified using the VNEFI-f/VNEFI-r primer set [33], while the fragment of the β-tubulin gene was amplified with primers C/D [39]. For 16 strains, no product was obtained by PCR with the C/D primer set; therefore, new primers were designed. The new primers cont189 and cont675 (Table 3) were complementary to DNA regions of the β-tubulin gene and were located upstream and downstream in relation to the C/D primer annealing sites. Thermal profiles of reactions and reagent concentrations applied for PCR with the primers used for housekeeping genes were the same as those applied for pathogenicity-related genes with the exception of annealing temperatures: 61 °C for VNEFI-f/VNEFI-r and C/D primer sets and 59 °C for cont189/cont675 primer set.
4.4. Polymorphism and Intragene Differences Analyses
The products obtained in all PCRs were separated in a 1.5% agarose gel in Tris-borate-EDTA buffer, stained with ethidium bromide, and visualized under UV illumination; next, the products were purified using a PCR/DNA Clean-Up Purification Kit (EURx, Gdańsk, Poland) and sequenced in both directions with the same primers used for amplification (Genomed SA., Warsaw, Poland). The obtained sequences for each gene fragment were assembled and initially aligned using MEGA v. 6.0 software ([40]; available at www.megasoftware.net/mega.php (accessed on 3 February 2021)). Alignment was then visually refined, and the consensus sequence for each gene was employed as a query in Nucleotide Basic Local Alignment Search Tool (BLAST) to search the global GenBank sequence database, available at https://blast.ncbi.nlm.nih.gov/Blast.cgi (accessed on 3 February 2021), and the V. inaequalis reference genome sequence. Alignments per gene with all sequences trimmed to the same length, as well as concatenated alignments of housekeeping or pathogenicity-related genes, were exported to nexus files. All sequences used in the study were submitted to the GenBank database, and accession numbers were assigned for them (Supplementary File 1).
A partition homogeneity test was performed in Phylogenetic Analysis Using Parsimony (PAUP) version 4.0b10 [41] to ensure that the two housekeeping or two pathogenicity-related genes could be combined to form a single concatenated dataset [29].
The percentage of similarity between sequences was calculated for each gene fragment using MegAlign software from the Lasergene v. 8 package.
For each gene, the number of haplotypes (h), number of polymorphic (segregating) and parsimony informative sites, G/C content and haplotypic diversity (Hd) were calculated, and 2 parameters of nucleotide diversity, polymorphism (π—the expected heterozygosity per nucleotide site [42], or average pairwise divergence between isolates) and Theta-W (dependent on effective population size and mutation rate per nucleotide), were estimated using DnaSP v. 5.10.0.1 [43]. The same parameters were also estimated for sequentially end-to-end concatenated sequences of EF-1α with β-tubulin and mannosidase with glucosidase regions.
When two main groups of populations were assumed, that is, Rvi6-virulent and -avirulent, gene flow estimates between groups (Nm and Gst), the average number of nucleotide differentiations between groups and the average number of nucleotide substitutions per site (average pairwise divergence between populations, Dxy) were calculated.
Tajima’s D genetic diversity and population divergence test [44] and Fu and Li’s D tests for neutrality of mutations [45] were also carried out. For both tests, negative values indicate an excess of low-frequency polymorphisms, e.g., rare substitutions are present at higher frequencies in the region than expected under a standard neutral model [46], while positive values indicate an excess of intermediate polymorphisms. If the value of D is too large or too small, the neutral null hypothesis is rejected, and population bottlenecks or population subdivisions, as well as selective sweeps, are allowed [47]. Both tests were assessed for their statistical significance according to Kimura neutral theory [48]. In addition, the McDonald–Kreitman test of neutrality (at http://bioinf3.uab.cat/mkt/MKT.asp, accessed on 3 February 2021) was applied to coding sequences of the studied gene fragments to provide evidence of selection in the case of non-neutral polymorphism [47]. The test calculated the ratio between synonymous and non-synonymous polymorphisms between Rvi6 and non-Rvi6 populations of V. inaequalis. All nucleotide sequences were converted to amino acid sequences according to an adequate reading frame using the EXPASY translate tool (https://web.expasy.org/translate/, accessed on 3 February 2021) and were subsequently utilized to construct neighbor-joining dendrograms (NJ, MEGA6) to visualize the topologies of amino acid sequence-derived trees with DNA sequence-derived trees.
4.5. Structure Analyses
Gene flow estimates of Nei [30], the average number of nucleotide substitutions per site between these populations (DXY) and the average number of nucleotide differentiations between populations were calculated between assumed populations (Rvi6-virulent vs. Rvi6-avirulent) using the DnaSP program.
The gene flow estimates between Rvi6-virulent and -avirulent populations were also assessed based on the fixation index (FST) measuring the population differentiation among strains, applying 100 permutations using ARLEQUIN 3.5.1.2 [49]. Estimation of gene flow, expressed as FST, can range from 0 (no differentiation between populations due to unrestricted gene flow) to 1 (complete isolation due to the absence of gene flow) [50]. Each of the 4 genes was used independently for analyses. For AMOVA purposes, all strains were divided into 20 populations, with each containing 5 strains according to their origin, and they were subsequently included in two main assumed groups of populations: one containing only Rvi6-virulent populations and the other containing only Rvi6-avirulent populations. The total amount of differentiation among the groups of populations, among populations within the groups and individuals within populations was evaluated by applying global hierarchical analysis of molecular variance (AMOVA) using 1023 permutations and a significance level of p ≤ 1 for single loci.
4.6. Model Selection and Phylogenetic Analysis
The best fit evolutionary model of DNA substitution for four datasets was calculated using jModelTest v. 2.1.1 [51]. The standard Akaike information criterion (AIC) was used to evaluate the model scores. The appropriate evolution model for β-tubulin was indicated as JC+I+G (combined: Jukes–Cantor with a proportion of invariable sites and a gamma-shaped distribution of rates across sites) for EF-1α, JC+I for β-tubulin, K80+I (combined: Kimura two-parameter with a proportion of invariable sites) for mannosidase and HKY+I+G (combined: Hasegawa–Kishino–Yano model with a proportion of invariable sites and a gamma-shaped distribution of rates across sites) for glucosidase; JC+I+G for combined datasets of housekeeping genes and GTR+I+G (general time-reversible model with a proportion of invariable sites and a gamma-shaped distribution of rates across sites) for combined datasets of pathogenicity-related genes. The optimal models of nucleotide substitution, as determined by jModeltest, were used for the distance-based approaches and phylogenetic tree reconstruction.
Phylogenetic analyses were performed by a heuristic search for optimal trees under three optimality criteria: parsimony (MP), likelihood (ML) and distance (NJ) using MEGA6. NJ trees were constructed based on model-based corrected distances, as indicated by jModelTest for each dataset.
The strength of the internal branches of the resulting trees was tested with bootstrap analyses using 1000 replications in MEGA6.
MrBayes v. 3.2.6 [52] was used to calculate the Bayesian posterior probability values (Bpp) for each gene region and the concatenated EF-1α with β-tubulin and mannosidase with glucosidase datasets. Parameters and priors were modified to reflect the evolutionary model that best represented the data according to jModelTest; next, metropolis-coupled Markov chain Monte Carlo (MCMCMC) analysis was performed with 2 independent internal runs for 5 × 10⁶ generations and burn-in of 25% generations with 4 chains. All analyses were performed twice to ensure that they were not trapped at local maxima, and the overall tree topologies were compared to ensure that the analyses converged on a similar phylogeny.
4.7. Detection of Recombination
The split decomposition method [53] was used to visualize incompatibilities generated by recombination using SplitsTree4 software, and the nucleotide substitution model indicated the best fit for the given dataset. Bootstrapping values for the split decomposition network were calculated with 1000 replicates with SplitsTree4 software [54]. For the detection of recombination or genomic reassortment signals in analyzed regions, the phi test for recombination under SplitsTree4 and seven different recombination detection methods implemented in RDP4 software [55] were employed: RDP, Geneconv, Bootscan, MaxChi, Chimaera, SiScan and 3 Seq.
Association among alleles, as expected under clonality, was investigated using a generalized measure of multilocus linkage equilibrium (rBARd) [56,57], which is a modification of the index of association (IA) and is independent from the number of loci included in the analysis. Each gene and two combined datasets were analyzed using MULTILOCUS v. 1.2.2. software [57]. Values were calculated for full datasets, arranged in two variants: (i) when all strains were treated as one population and (ii) when two main populations were assumed, that is, one containing strains derived from Rvi6 cultivars and one containing the rest of the strains. The significance of the test was assessed by comparing the original observed dataset with those in which alleles were resampled without replacement to simulate recombination in 100 randomized datasets.
Finally, the simple four gamete test was performed within each locus and combined dataset using DnaSP to estimate the minimum number of recombination events in the history of each gene sample (RM).
5. Conclusions
The four loci examined in this study are only a small part of the total genome. In our study, the total information obtained from these data did not demonstrate one consensus phylogenetic resolution for the analyzed strains; probably, involvement of several additional regions would be required to obtain more informative phylogenetic trees. On the other hand, these data provided some indications related to evolutionary forces affecting the strains belonging to different pathological races, either virulent or avirulent to Rvi6 host plants, and these results confirm higher genetic distance and variation among Rvi6-virulent populations than among avirulent ones and are in contrast to some results from previous studies based on microsatellites concerning the level of genetic diversity in Rvi6-virulent and -avirulent populations. Discrimination between V. inaequalis populations of different virulence types is achieved primarily by testing their pathogenicity on apple cultivars with defined R genes [2]; nevertheless, it is better achieved by multilocus microsatellite genotyping than by multilocus gene analysis presented in this report, indicating that the latter cannot serve as markers for molecular discrimination among V. inaequalis races.
Supplementary Materials
The following are available online at https://www.mdpi.com/article/10.3390/pathogens10040447/s1, Supplementary File 1: The list of accession numbers assigned to sequences of V. inaequalis analyzed in the study and deposited in GenBank database.
Author Contributions
Conceptualization, data curation, formal analysis, investigation, methodology, writing—original draft, M.M.; Conceptualization, writing—review and editing, J.P. All authors have read and agreed to the published version of the manuscript.
Funding
This research was funded by National Science Centre in Poland, grant number UMO-2013/09/B/NZ9/02343.
Institutional Review Board Statement
Not applicable.
Informed Consent Statement
Not applicable.
Data Availability Statement
All DNA sequences obtained during the study were deposited in the GenBank database at https://www.ncbi.nlm.nih.gov/genbank/.
Conflicts of Interest
The authors declare no conflict of interest. The funders had no role in the design of the study; in the collection, analyses, or interpretation of data; in the writing of the manuscript, or in the decision to publish the results.
References
- MacHardy, W.E. Apple Scab: Biology, Epidemiology, and Management; American Phytopathological Society (APS Press): St Paul., MN, USA, 1996. [Google Scholar]
- Bus, V.G.; Rikkerink, E.H.; Caffier, V.; Durel, C.E.; Plummer, K.M. Revision of the nomenclature of the differential host-pathogen interactions of Venturia inaequalis and Malus. Annu. Rev. Phytopathol. 2011, 49, 391–413. [Google Scholar] [CrossRef] [PubMed]
- Tenzer, I.; degli Ivanissevich, S.; Morgante, M.; Gessler, C. Identification of microsatellite markers and their application to population genetics of Venturia inaequalis. Phytopathology 1999, 89, 748–753. [Google Scholar] [CrossRef]
- Guérin, F.; Franck, P.; Loiseau, A.; Devaux, M.; Le Cam, B. Isolation of 21 new polymorphic microsatellite loci in the phytopathogenic fungus Venturia inaequalis. Mol. Ecol. Notes 2004, 4, 268–270. [Google Scholar] [CrossRef]
- Guérin, F.; Gladieux, P.; Le Cam, B. Origin and colonization history of newly virulent strains of the phytopathogenic fungus Venturia inaequalis. Fungal Genet. Biol. 2007, 44, 284–292. [Google Scholar] [CrossRef]
- Guérin, F.; Le Cam, B. Breakdown of the scab resistance gene Vf in apple leads to a founder effect in populations of the fungal pathogen Venturia inaequalis. Phytopathology 2004, 94, 364–369. [Google Scholar] [CrossRef] [PubMed]
- Gladieux, P.; Zhang, X.G.; Róldan-Ruiz, I.; Caffier, V.; Leroy, T.; Devaux, M.; Van Glabeke, S.; Coart, E.; Le Cam, B. Evolution of the population structure of Venturia inaequalis, the apple scab fungus, associated with the domestication of its host. Mol. Ecol. 2010, 19, 658–674. [Google Scholar] [CrossRef]
- Gladieux, P.; Guérin, F.; Giraud, T.; Caffier, V.; Lemaire, C.; Parisi, L.; Didelot, F.; Le Cam, B. Emergence of novel fungal pathogens by ecological speciation: Importance of the reduced viability of immigrants. Mol. Ecol. 2011, 20, 4521–4532. [Google Scholar] [CrossRef] [PubMed]
- Leroy, T.; Lemaire, C.; Dunemann, F.; Le Cam, B. The genetic structure of a Venturia inaequalis population in a heterogeneous host population composed of different Malus species. BMC Evol. Biol. 2013, 13, 64. [Google Scholar] [CrossRef]
- Lemaire, C.; De Gracia, M.; Leroy, T.; Michalecka, M.; Lindhard-Pedersen, H.; Guerin, F.; Gladieux, P.; Le Cam, B. Emergence of new virulent populations of apple scab from nonagricultural disease reservoirs. New Phytol. 2016, 209, 1220–1229. [Google Scholar] [CrossRef]
- Michalecka, M.; Masny, S.; Leroy, T.; Puławska, J. Population structure of Venturia inaequalis, a causal agent of apple scab, in response to heterogeneous apple tree cultivation. BMC Evol. Biol. 2018, 18, 5. [Google Scholar] [CrossRef]
- Schnabel, G.; Schnabel, E.L.; Jones, A.L. Characterization of ribosomal DNA from Venturia inaequalis and its phylogenetic relationship to rDNA from other tree-fruit Venturia species. Phytopathology 1999, 89, 100–108. [Google Scholar] [CrossRef]
- Le Cam, B.; Parisi, L.; Arene, L. Evidence of two formae speciales in Venturia inaequalis, responsible for apple and pyracantha scab. Phytopathology 2002, 92, 314–320. [Google Scholar] [CrossRef]
- Michalecka, M.; Malinowski, T.; Puławska, J. Analysis of Venturia inaequalis genes expression profiles: Searching for the genes associated with apple-scab-resistance breakdown. In Proceedings of the 12th European Foundation for Plant Pathology & 10th French Society for Plant Pathology, Dunkerque, France, 29 May–2 June 2017. Book of abstracts: 144. [Google Scholar]
- Hanage, W.P.; Fraser, C.; Spratt, B.G. Sequences, sequence clusters and bacterial species. Philos. Trans. R Soc. Lond. B Biol. Sci. 2006, 361, 1917–1927. [Google Scholar] [CrossRef]
- Covey, P.A.; Kuwitzky, B.; Hanson, M.; Webb, K.M. Multilocus analysis using putative fungal effectors to describe a population of Fusarium oxysporum from sugar beet. Phytopathology 2014, 104, 886–896. [Google Scholar] [CrossRef]
- Matute, D.R.; McEwen, J.G.; Puccia, R.; Montes, B.A.; San-Blas, G.; Bagagli, E.; Rauscher, J.T.; Resterpo, A.; Morais, F.; Nino-Vega, G.; et al. Cryptic speciation and recombination in the fungus Paracoccidioides brasiliensis as revealed by gene genealogies. Mol. Biol. Evol. 2006, 23, 65–73. [Google Scholar] [CrossRef]
- Obanor, F.; Erginbas-Orakci, G.; Tunali, B.; Nicol, J.M.; Chakraborty, S. Fusarium culmorum is a single phylogenetic species based on multilocus sequence analysis. Fungal Biol. 2010, 114, 753–765. [Google Scholar] [CrossRef]
- Inuma, T.; Khodaparast, S.A.; Takamatsu, S. Multilocus phylogenetic analyses within Blumeria graminis, a powdery mildew fungus of cereals. Mol. Phylogenetics Evol. 2007, 44, 741–751. [Google Scholar] [CrossRef] [PubMed]
- Marcelletti, S.; Ferrante, P.; Scortichini, M. Multilocus sequence typing reveals relevant genetic variation and different evolutionary dynamics among strains of Xanthomonas arboricola pv. juglandis. Diversity 2010, 2, 1205–1222. [Google Scholar] [CrossRef]
- O’Donnell, K.; Sutton, D.A.; Rinaldi, M.G.; Magnon, K.C.; Cox, P.A.; Revankar, S.G.; Sanche, S.; Geiser, D.M.; Juba, J.H.; van Burik, J.H.; et al. Genetic diversity of human pathogenic members of the Fusarium oxysporum complex inferred from multilocus DNA sequence data and amplified fragment length polymorphism analyses: Evidence for the recent dispersion of a geographically widespread clonal lineage and nosocomial origin. J. Clin. Microbiol. 2004, 42, 5109–5120. [Google Scholar]
- Bain, J.M.; Tavanti, A.; Davidson, A.D.; Jacobsen, M.D.; Shaw, D.; Gow, N.A.R.; Odds, F.C. Multilocus sequence typing of the pathogenic fungus Aspergillus fumigatus. J. Clin. Microbiol. 2007, 45, 1469–1477. [Google Scholar] [CrossRef] [PubMed]
- Brown, E.M.; McTaggart, L.R.; Zhang, S.X.; Low, D.E.; Stevens, D.A.; Richardson, S.E. Phylogenetic Analysis Reveals a Cryptic Species Blastomyces gilchristii, sp. nov. within the Human Pathogenic Fungus Blastomyces dermatitidis. PLoS ONE 2013, 8, e059237. [Google Scholar] [CrossRef]
- Hogenhout, S.A.; van der Hoorn, R.A.L.; Terauchi, R.; Kamoun, S. Emerging concepts in effector biology of plant-associated organisms. Mol. Plant-Microbe Interact. 2009, 22, 115–122. [Google Scholar] [CrossRef]
- Idnurm, A.; Howlett, B.J. Pathogenicity genes of phytopathogenic fungi. Mol. Plant Pathol. 2001, 2, 241–255. [Google Scholar] [CrossRef]
- Jones, J.D.; Dangl, J.L. The plant immune system. Nature 2006, 444, 323–329. [Google Scholar] [CrossRef]
- Stukenbrock, E.H.; McDonald, B.A. Population genetics for fungal and oomycete effectors involved in gene-for-gene interactions. Mol. Plant-Microbe Interact. 2009, 22, 371–380. [Google Scholar] [CrossRef]
- Lievens, B.; van Baarlen, P.; Verreth, C.; van Kerckhove, S.; Rep, M.; Thomma, B.P. Evolutionary relationships between Fusarium oxysporum f. sp. lycopersici and F. oxysporum f. sp. radicis-lycopersici isolates inferred from mating type, elongation factor1-alpha and exopolygalacturonase sequences. Mycol. Res. 2009, 113, 1181–1191. [Google Scholar] [CrossRef] [PubMed]
- Cunningham, C.W. Can three incongruence tests predict when data should be combined? Mol. Biol. Evol. 1997, 14, 733–740. [Google Scholar] [CrossRef]
- Nei, M. Analysis of gene diversity in subdivided populations. Proc. Natl. Acad. Sci. USA 1973, 70, 3321–3323. [Google Scholar] [CrossRef]
- Hudson, R.R.; Kaplan, N.L. Statistical properties of the number of recombination events in the history of a sample of DNA sequences. Genetics 1985, 111, 147–164. [Google Scholar] [CrossRef]
- Barnes, I.; Crous, P.W.; Wingfield, B.D.; Wingfield, M.J. Multigene phylogenies reveal that red band needle blight of Pinus is caused by two distinct species of Dothistroma, D. septosporum and D. pini. Stud. Mycol. 2004, 50, 551–565. [Google Scholar]
- Zhao, P.; Kakishima, M.; Uzuhashi, S.; Ishii, H. Multigene phylogenetic analysis of inter-and intraspecific relationships in Venturia nashicola and V. pirina. Eur. J. Plant Pathol. 2012, 132, 245–258. [Google Scholar] [CrossRef]
- Henderson, S.T.; Petes, T.D. Instability of simple sequence DNA in Saccharomyces cerevisiae. Mol. Cell Biol. 1992, 12, 2749–2757. [Google Scholar] [CrossRef]
- Tenaillon, M.I.; Sawkins, M.C.; Long, A.D.; Gaut, R.L.; Doebley, J.F.; Gaut, B.S. Patterns of DNA sequence polymorphism along chromosome 1 of maize (Zea mays ssp. mays L.). Proc. Natl. Acad. Sci. USA 2001, 98, 9161–9166. [Google Scholar] [CrossRef]
- Maruyama, T.; Fuerst, P.A. Population Bottlenecks and Non-Equilibrium Models in Population Genetics. II. Number of Alleles in a Small Population that was Formed by a Recent Bottleneck. Genetics 1985, 111, 675–689. [Google Scholar] [CrossRef]
- Taylor, J.W.; Fisher, M.C. Fungal multilocus sequence typing—It’s not just for bacteria. Curr. Opin. Microbiol. 2003, 6, 351–356. [Google Scholar] [CrossRef]
- Nordborg, M.; Tavare, S. Linkage disequilibrium: What history has to tell us. Trends Genet. 2002, 18, 83–90. [Google Scholar] [CrossRef]
- Koenraadt, H.; Somerville, S.C.; Jones, A.L. Characterization of mutations in the beta-tubulin gene of benomyl-resistant field strains of Venturia inaequalis and other plant pathogenic fungi. Phytopathology 1992, 82, 1348–1354. [Google Scholar] [CrossRef]
- Tamura, K.; Stecher, G.; Peterson, D.; Filipski, A.; Kumar, S. MEGA6: Molecular evolutionary genetics analysis version 6.0. Mol. Biol. Evol. 2013, 30, 2725–2729. [Google Scholar] [CrossRef]
- Swofford, D.L. PAUP*. Phylogenetic Analysis Using Parsimony (*and Other Methods); Version 4; Sinauer Associates: Sunderland, MA, USA, 1998. [Google Scholar]
- Nei, M. Molecular Evolutionary Genetics; Columbia University Press: New York, NY, USA, 1987. [Google Scholar]
- Librado, P.; Rozas, J. DnaSP v5: A software for comprehensive analysis of DNA polymorphism data. Bioinformatics 2009, 25, 1451–1452. [Google Scholar] [CrossRef]
- Tajima, F. Statistical method for testing the neutral mutation hypothesis by DNA polymorphism. Genetics 1989, 123, 585–595. [Google Scholar] [CrossRef] [PubMed]
- Fu, Y.X.; Li, W.H. Statistical tests of neutrality of mutations. Genetics 1993, 133, 693–709. [Google Scholar] [CrossRef]
- Korneliussen, T.S.; Moltke, I.; Albrechtsen, A.; Nielsen, R. Calculation of Tajima’s D and other neutrality test statistics from low depth next-generation sequencing data. BMC Bioinform. 2013, 14, 289. [Google Scholar] [CrossRef] [PubMed]
- Nielsen, R. Statistical tests of selective neutrality in the age of genomics. Heredity 2001, 86, 641–647. [Google Scholar] [CrossRef]
- Kimura, M. Retrospective of the last quarter century of the neutral theory. Jpn. J. Genet. 1993, 68, 521–528. [Google Scholar]
- Excoffier, L.; Lischer, H.E. Arlequin suite ver 3.5: A new series of programs to perform population genetics analyses under Linux and Windows. Mol. Ecol. Resour. 2010, 10, 564–567. [Google Scholar] [CrossRef]
- LoBuglio, K.F.; Taylor, J.W. Recombination and genetic differentiation in the mycorrhizal fungus Cenococcum geophilum Fr. Mycologia 2002, 94, 772–780. [Google Scholar] [CrossRef]
- Darriba, D.; Taboada, G.L.; Doallo, R.; Posada, D. jModelTest 2: More models, new heuristics and parallel computing. Nat. Methods 2012, 9, 772. [Google Scholar] [CrossRef]
- Huelsenbeck, J.P.; Ronquist, F. MRBAYES: Bayesian inference of phylogenetic trees. Bioinformatics 2001, 17, 754–755. [Google Scholar] [CrossRef] [PubMed]
- Bandelt, H.J.; Dress, A.W. A canonical decomposition theory for metrics on a finite set. Adv. Math. 1992, 92, 47–105. [Google Scholar] [CrossRef]
- Huson, D.H.; Bryant, D. Application of phylogenetic networks in evolutionary studies. Mol. Biol. Evol. 2005, 23, 254–267. [Google Scholar] [CrossRef]
- Martin, D.P.; Lemey, P.; Lott, M.; Moulton, V.; Posada, D.; Lefeuvre, P. RDP3: A flexible and fast computer program for analyzing recombination. Bioinformatics 2010, 26, 2462–2463. [Google Scholar] [CrossRef] [PubMed]
- Brown, A.H.D.; Feldman, M.W.; Nevo, E. Multilocus structure of natural populations of Hordeum spontaneum. Genetics 1980, 96, 523–536. [Google Scholar] [PubMed]
- Agapow, P.M.; Burt, A. Indices of multilocus linkage disequilibrium. Mol. Ecol. Notes 2001, 1, 101–102. [Google Scholar] [CrossRef]


Publisher’s Note: MDPI stays neutral with regard to jurisdictional claims in published maps and institutional affiliations. |
© 2021 by the authors. Licensee MDPI, Basel, Switzerland. This article is an open access article distributed under the terms and conditions of the Creative Commons Attribution (CC BY) license (https://creativecommons.org/licenses/by/4.0/).