Article

Application of Quantitative-PCR to Monitor Netpen Sites in British Columbia (Canada) for Tenacibaculum Species

1
Center of Innovation for Fish Health, Vancouver Island University, Nanaimo, BC V9R 5S5, Canada
2
Department of Pathobiology, University of Guelph, Guelph, ON N1G 2W1, Canada
*
Author to whom correspondence should be addressed.
Pathogens 2021, 10(4), 414; https://doi.org/10.3390/pathogens10040414
Submission received: 10 March 2021 / Revised: 23 March 2021 / Accepted: 30 March 2021 / Published: 1 April 2021

Abstract

:
Tenacibaculum are frequently detected from fish with tenacibaculosis at aquaculture sites; however, information on the ecology of these bacteria is sparse. Quantitative-PCR assays were used to detect T. maritimum and T. dicentrarchi at commercial Atlantic salmon (Salmo salar) netpen sites throughout several tenacibaculosis outbreaks. T. dicentrarchi and T. maritimum were identified in live fish, dead fish, other organisms associated with netpens, water samples and on inanimate substrates, which indicates a ubiquitous distribution around stocked netpen sites. Before an outbreak, T. dicentrarchi was found throughout the environment and from fish, and T. maritimum was infrequently identified. During an outbreak, increases in the bacterial load in were recorded and no differences were recorded after an outbreak supporting the observed recrudescence of mouthrot. More bacteria were recorded in the summer months, with more mortality events and antibiotic treatments, indicating that seasonality may influence tenacibaculosis; however, outbreaks occurred in both seasons. Relationships were identified between fish mortalities and antimicrobial use to water quality parameters (temperature, salinity, dissolved oxygen) (p < 0.05), but with low R2 values (<0.25), other variables are also involved. Furthermore, Tenacibaculum species appear to have a ubiquitous spatial and temporal distribution around stocked netpen sites, and with the potential to induce disease in Atlantic salmon, continued research is needed.

1. Introduction

Within Canada, from 2016 to 2018, approximately a billion dollars is generated annually from salmonid aquaculture [1]. A major salmon health issue in Canada has been attributed to bacteria from the genus Tenacibaculum [2]. These bacteria are typically yellow-pigmented, Gram-negative, filamentous, and several species are putative pathogens of tenacibaculosis in finfish and some bivalves [2]. Tenacibaculosis is typically characterized by changes in fish behaviour, yellow plaques or ulcers on epidermal surfaces and increased mortality [2,3,4,5,6].
Knowledge of Tenacibaculum ecology (e.g., impacts, hosts and distributions) is sparse and has been garnered through understanding disease caused by Tenacibaculum species; finfish and bivalve mortality events are most commonly described [2,3,7,8,9,10,11,12,13]. The bacteria are also found on numerous other metazoans [2], including crustaceans [14,15,16], cnidarians [17,18,19] and on marine mammals (i.e., Orca [Orcinus orca]) [20], all of which may vector or facilitate tenacibaculosis. Tenacibaculum sp. have also been recovered from marine waters [21,22,23] and biofilms [24,25]. The presence of Tenacibaculum sp. in biofilm and planktonic states likely has important implications for disease, as suggested for the related pathogenic freshwater bacteria, F. psychrophilum [26]. The global distribution of Tenacibaculum species is largely unknown, but several species are suspected to be cosmopolitan [2]. The location of Tenacibaculum bacteria around aquaculture netpen sites are also widely unknown. An understanding of the spatial and temporal distributions of Tenacibaculum species may aid in the management of tenacibaculosis. Complete genome sequencing [27,28] and multi-locus sequence analysis [29,30] have been used to identify Tenacibaculum species and strains, and both could be used to help understand bacterial distributions; however, both techniques are expensive and time-consuming. In contrast, quantitative-PCR (qPCR) is economical, quantitative and could be used to identify a baseline that may indicate when an outbreak is about to occur [31,32]. The present study describes the local distribution of T. maritimum and T. dicentrarchi at two commercial netpen sites in British Columbia (BC; Canada) using two separate quantitative-PCR (qPCR) assays before, during and after tenacibaculosis outbreaks.

2. Results

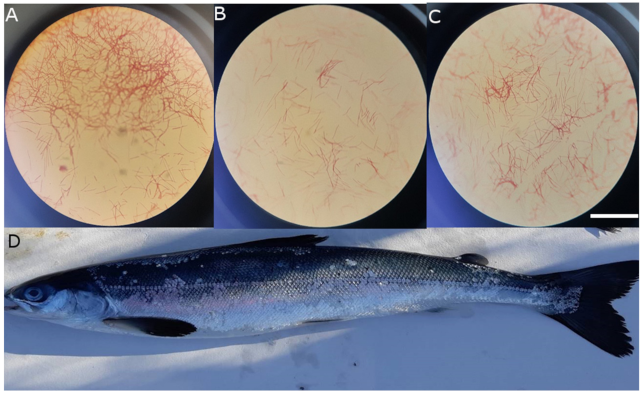
2.1. Bacterial Isolate Collection

Sixty-three isolates were collected from the Midsummer (MS) site (36 isolates from fish tissues and 27 isolates from water samples). Thirty-eight isolates were collected from the Larson Island (LI) site (21 isolates from fish tissues and 17 isolates from water samples and infrastructure swabs). Isolates were elongated bacilli to filamentous, yellow or cream-coloured and Gram-negative (Figure 1). No isolates were identified as T. maritimum (MAR assay [18]), while 25 isolates were identified as T. dicentrarchi (DICEN assay [31,32]); seven of the 25 isolates were sent for 16S rDNA sequencing and were confirmed to be T. dicentrarchi or T. finnmarkense (Table 1).

2.2. qPCR Results

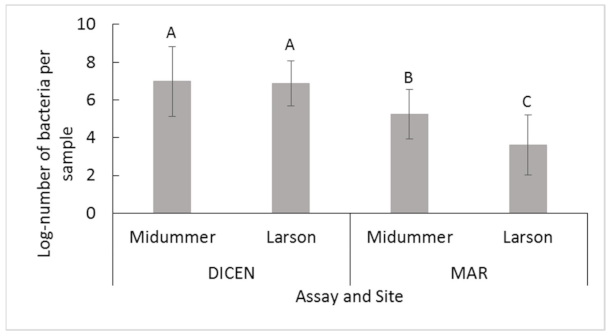
2.2.1. Midsummer and Larson Island

Of the 1166 samples (776 for MS, 387 for LI) and ~2332 quantitative-PCR (qPCR) tests, 308 positive qPCR results were recorded (244 from MS, 64 from LI) (Table 2). The log-number of bacteria (LNOB) detected using both the MAR [18] and DICEN [31,32] assays together was greater at the MS site compared to LI (p = 6.8 × 10⁻³, Table 3). Within each site, the log-number of T. dicentrarchi was greater compared to T. maritimum (p < 2.2 × 10⁻¹⁶, Figure 2; Table 3). Similar numbers of T. dicentrarchi were recorded between sites (p < 2.2 × 10⁻¹⁶, Figure 2, Table 3), while fewer T. maritimum were recorded at LI (p < 2.2 × 10⁻¹⁶, Figure 2, Table 3). For both assays and sites together, approximately a log-unit increase was detected during an outbreak (p = 1.2 × 10⁻⁵, Table 3). A log-unit increase was found in fish samples in comparison to environmental samples (p = 4.9 × 10⁻⁸, Table 3), where fish tissues and other organisms (OO) associated with netpens had greater numbers of bacteria compared to water samples and infrastructure swabs (p = 7.8 × 10⁻¹³, Table 3). Further statistical comparisons were performed separately for each assay and netpen site (Table 3).

2.2.2. Midsummer

There were less log-units of T. dicentrarchi detected before an outbreak compared with during an outbreak (p = 8.2 × 10⁻³, Table 3, Figure 3), but there were no differences for T. maritimum (p = 8.2 × 10⁻¹, Table 3, Figure 3). Notably, however, neither T. dicentrarchi nor T. maritimum were detected before fish were introduced to the site. More T. maritimum and T. dicentrarchi were recorded in fish and from OO compared to water and infrastructure swabs (p ≤ 2.1 × 10⁻³, Table 3). The number of T. dicentrarchi from live fish and infrastructure swabs was not different between outbreak categories, but trends for increased numbers during an infection were recorded (p ≥ 9.7 × 10⁻², Table 3, Figure 4). Dead fish, other organisms and water samples generated significant differences in T. dicentrarchi between outbreak categories (p ≤ 4.7 × 10⁻², Table 3, Figure 4). T. maritimum in three sample types (water, infrastructure and OO) could not be compared using outbreak categories, as there were too few positive samples for statistical comparisons. There were no differences in the amount of T. maritimum based on the outbreak category in dead fish and live fish (p ≥ 9.1 × 10⁻¹, Table 3, Figure 4).

2.2.3. Larson

Differences in the number of T. dicentrarchi between outbreak categories could not be interpreted with only one sample for the pre- and post-outbreak categories (Table 3). A 1.3 log increase in T. maritimum was identified during an outbreak (p = 6.4 × 10⁻⁴, Table 3). Like the MS site, more T. dicentrarchi and T. maritimum were identified in fish and OO than in water samples and infrastructure swabs (p ≤ 6.7 × 10⁻⁴, Table 3). In both assays, comparing the number of bacteria per sample type based on the outbreak category was not possible, as too few samples were positive.

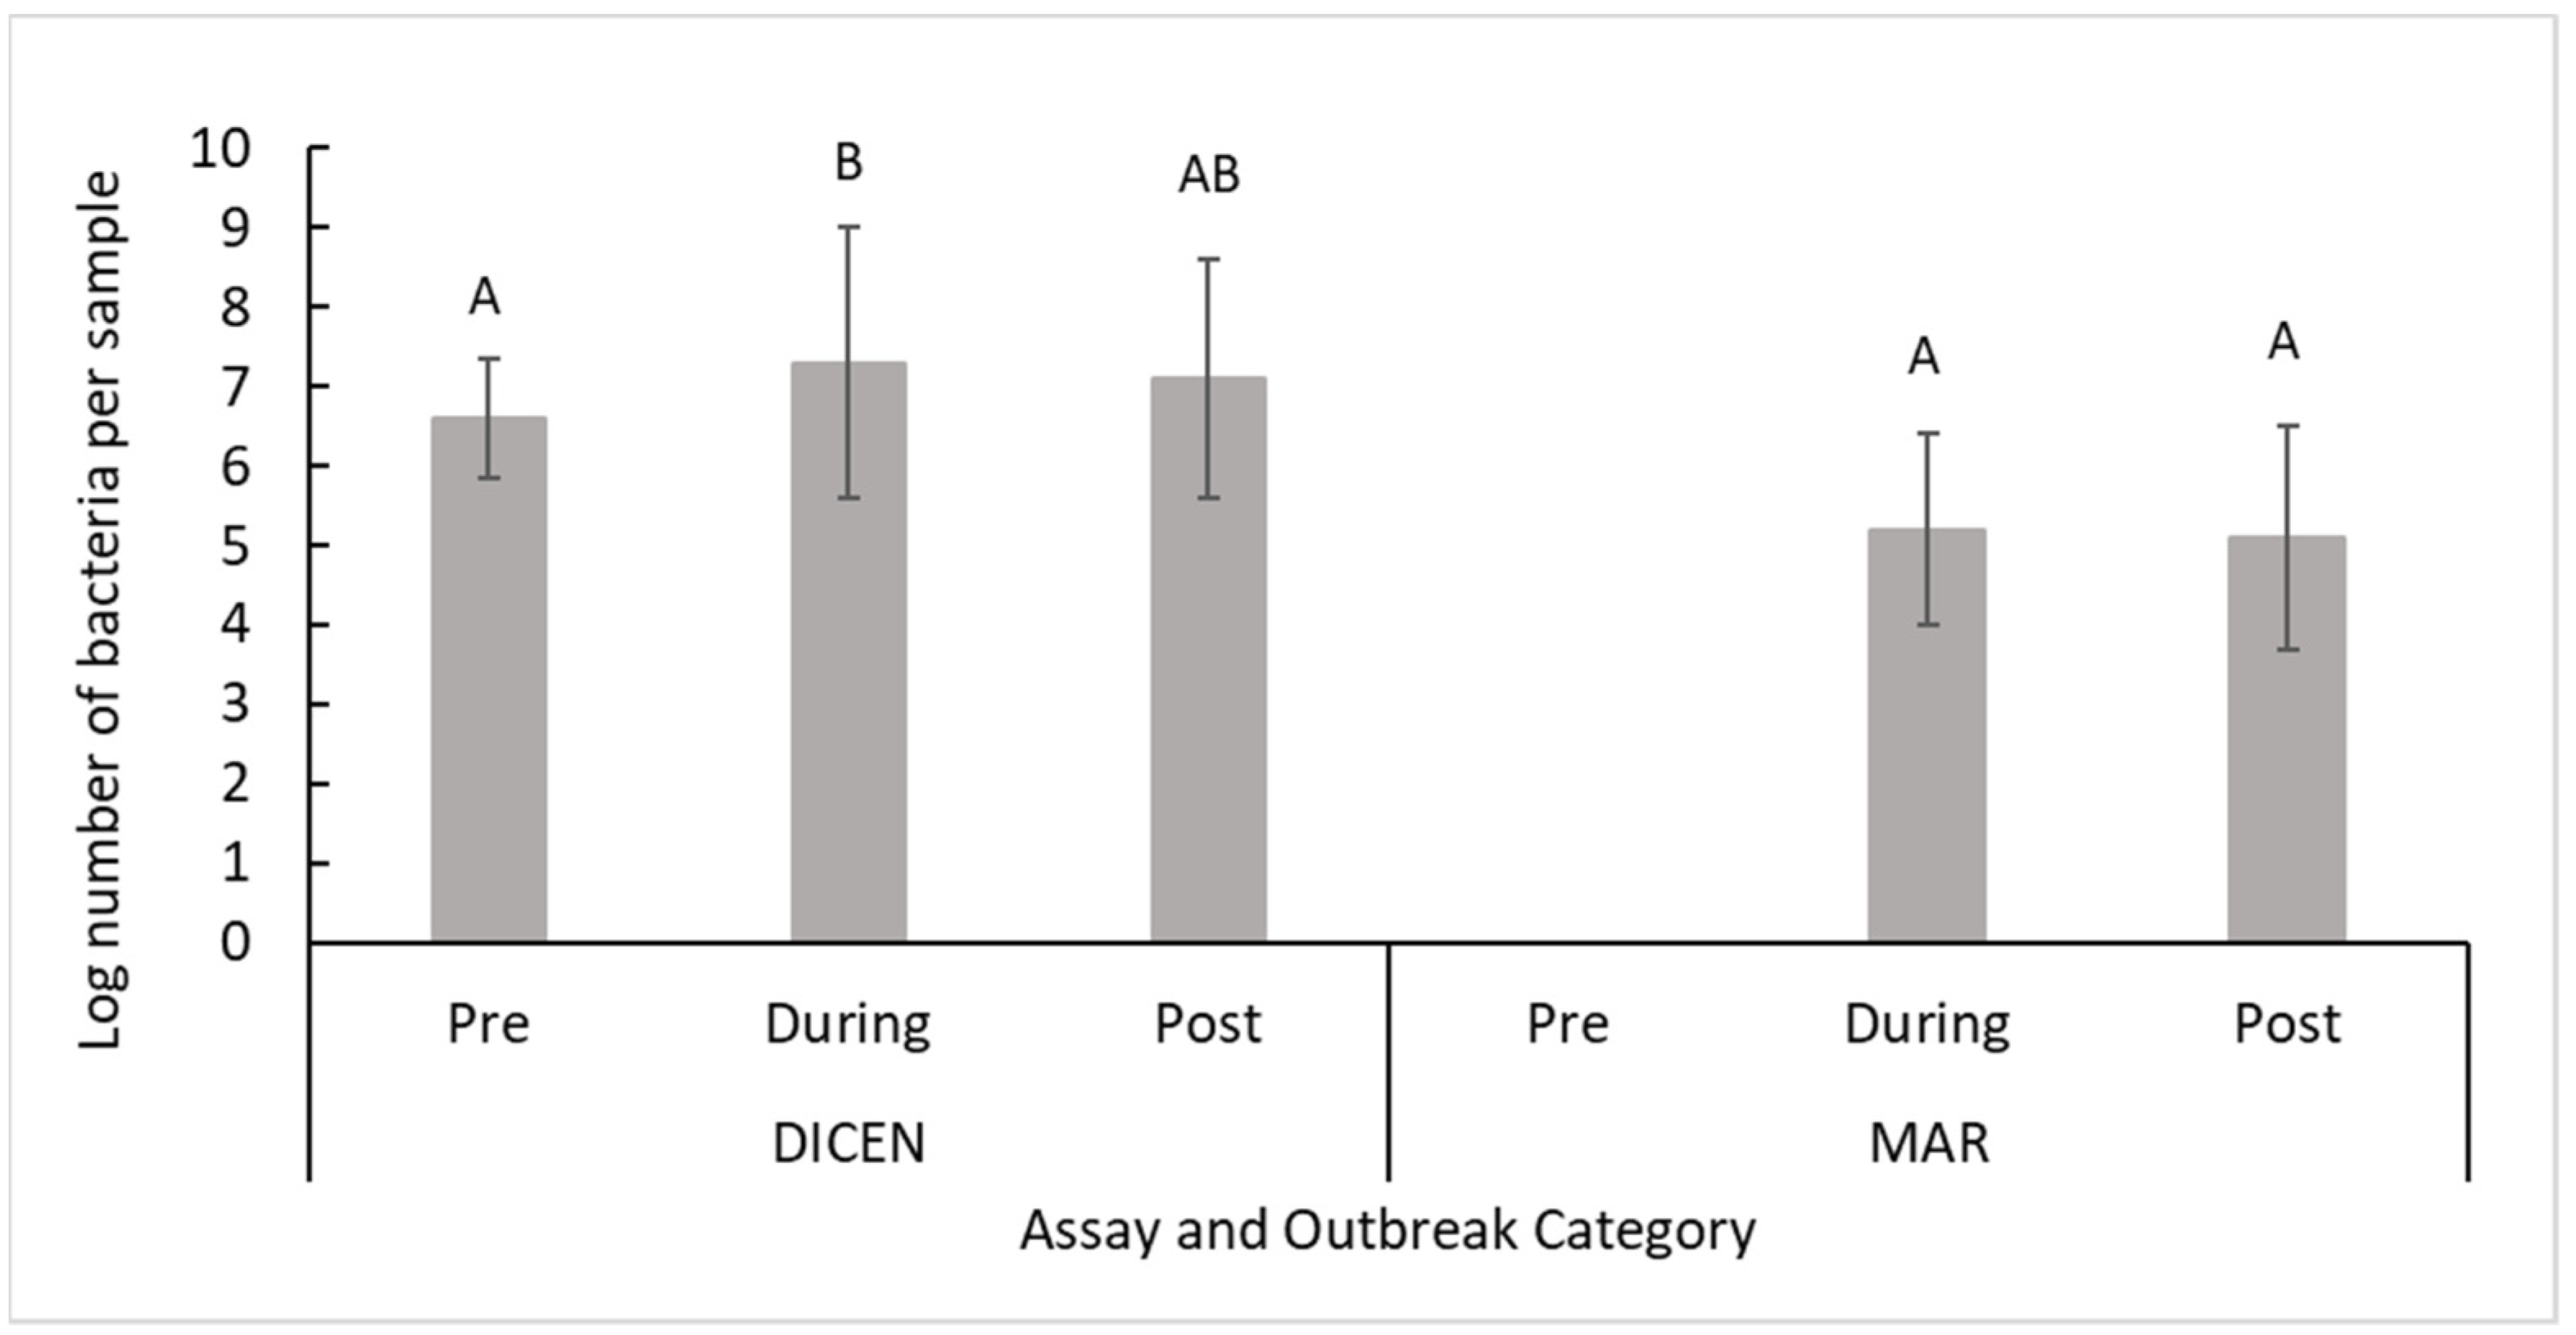
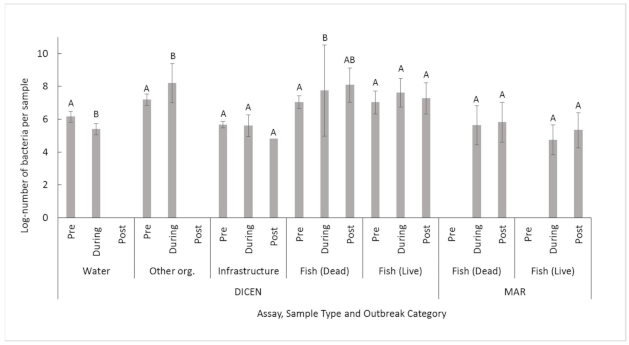
2.3. Supplemental Data Comparisons

At the MS site, there was no difference in the number of mortalities when T. maritimum (p = 7.5 × 10⁻²) or T. dicentrarchi (p = 3.2 × 10⁻¹) were present. At the MS site, there were also more fish mortalities during netpen cleaning (p = 1.6 × 10⁻⁴) and when florfenicol was applied (p = 9.8 × 10⁻⁷). At the LI site, there was no difference comparing mortalities when T. maritimum (p = 6.9 × 10⁻¹) or T. dicentrarchi (p = 1) were present. There was no difference in the number of mortalities during netpen cleaning at LI (p = 7.0 × 10⁻¹) or when florfenicol was applied (p = 5.8 × 10⁻²).
Comparing each environmental parameter independently to the application of florfenicol at MS, there was a significant relationship with dissolved oxygen at 0 m (Z-value = −4.0, p = 5.1 × 10⁻⁵) and 5 m (Z-value = −3.9, p = 1.0 × 10⁻⁴), as well as the temperature at 0 m (Z-value = 3.8, p = 1.4 × 10⁻⁴), 5 m (Z-value = 4.7, p = 2.2 × 10⁻⁶) and 10 m (Z-value = 4.8, p = 2.0 × 10⁻⁶) using binomial logistic regressions. When the environmental parameters were all considered in an additive format, a relation was observed comparing the water temperature at 0 m (Z-value = 2.5, p = 1.2 × 10⁻²) and 5 m (Z-value = 2.0, p = 4.2 × 10⁻²). The same comparison for the LI site indicated that when environmental parameters were compared independently, the only variable that was close to generating a significant relationship was the temperature at 0 m (Z-value = −1.8, p = 7.7 × 10⁻²). In an additive format, the salinity at 0 m (Z-value = 2.0, p = 4.4 × 10⁻²), 5 m (Z-score = 2.0, p = 4.7 × 10⁻²) and 10 m (Z-value = 2.4, p = 1.8 × 10⁻²) and the interaction of all the variables (Z-value = −2.0, p = 4.6 × 10⁻²) also generated a significant relationship.
Comparing the number of dead fish to environmental parameters at the MS site independently, indicated that dissolved oxygen at 0 m (p = 1.6 × 10⁻¹⁰), and 5 m (p = 4.0 × 10⁻¹⁰) and the temperature at 0 m (p = 1.2 × 10⁻³), 5 m (p = 2.3 × 10⁻⁶) and 10 m (p = 5.1 × 10⁻⁷) were significantly related; however, all R2 values were below 0.25. At the LI site, salinity at 10 m (p = 4.2 × 10⁻²), when compared independently, generated a significant relationship; however, the R2 was below 0.1. No relationships were observed at either site when all the environmental parameters were included in an additive format.

3. Discussion

3.1. Isolates

No isolates were identified as T. maritimum using qPCR, even though several samples were positive using the MAR assay. T. maritimum might exhibit a viable but non-culturable (VBNC) state; increases in temperature and micronutrients such as iron have been reported to have roles in resuscitation of a Tenacibaculum isolate [33]. A lack of T. maritimum isolates may also be related to a lack of understanding of the exact requirements for selective growth; as media used for culturing T. maritimum [2,34] contain complex, undefined chemicals such as seawater [35] or yeast extract [36,37]. T. maritimum isolates may also be poorly competitive during isolation and other fast-growing bacteria may inhibit growth, as reported in Flavobacterium sp. [38]. In addition, the VBNC state in Flavobacterium sp. can be induced by increases in temperature [39] and the absence of nutrients [40]. More research is needed to develop a defined media for isolating specific Tenacibaculum species.
All sequenced isolates of T. dicentrarchi and T. finnmarkense had genetic similarities to isolates linked to finfish mortality events in Chile (T. dicentrarchi QCR29 [13], T. dicentrarchi TdChD06 [41] and T. finnmarkense AY7486TD [27,28,30]). The identification of isolates in BC waters, similar to those found in Chile, indicates that the strains and species are likely found along the West coast of the Americas. It is unknown if T. dicentrarchi and T. finnmarkense have always had a broad distribution, or if anthropogenic activities, climate change, animal migrations, and oceanic currents have allowed the range of bacteria to expand. Understanding how Tenacibaculum disperse through larger geographic scales may allow researchers to understand how netpen sites are colonized by new strains. Research also needs to be placed on developing more specific assays, as the DICEN qPCR assay is also specific to T. finnmarkense AY7486TD [31,32].

3.2. Seasonal Comparison

Seasonality likely has an important impact on the occurrence of tenacibaculosis, as greater number of Tenacibaculum sp., increased fish mortality and more outbreaks were recorded during the spring/summer (MS) compared to the fall/winter (LI). In BC waters, the prevalence of T. maritimum in sea lice was the greatest in the summer, which correlated with increases in temperature; however, T. maritimum has also been found during the winter [14]. The current study suggests that mortalities and antimicrobial applications to treat mouthrot in the spring/summer were indirectly correlated to decreases in dissolved oxygen and increases in temperature. In contrast, in the fall/winter, decreases in temperature and increases in salinity were correlated to the application of antimicrobials. Both comparisons had a low correlation coefficient; however, similar to a previously noted correlation between increased water temperatures and the abundance of T. maritimum [42]. Other variables such as nutrient availability and plankton blooms may also influence the occurrence of tenacibaculosis, as both have correlations to seasonality [43,44] and mortality events [43,44]. Furthermore, understanding the roles of seasonality and dissecting the variables associated with seasonality will allow a greater understanding of Tenacibaculum sp. ecology and have downstream implications on managing tenacibaculosis.

3.3. Netpen Cleaning Comparison

Increases in the number of mortalities during netpen cleaning occurred in the spring/summer. Current netpen cleaning practices may be related to tenacibaculosis outbreaks causing direct damage to tissues and facilitating invasion [45]. For example, hydrozoan cnidarians are commonly attached to netpen sites in BC and cleaning practices would expose fish in netpens to the hydrozoan and nematocysts. The stinging nematocysts from D. typicum damaged fish tissues and were proposed to facilitate tenacibaculosis [19]. However, regular netpen cleaning is required as excessive biofouling can negatively influence fish health. Research on the implications of modern netpen cleaning practices on salmonid health needs to occur to confirm if the two are indeed related.

3.4. Outbreak Status Comparison

Investigating the distribution of bacteria on numerous samples before, during and after an outbreak is complicated. The lack of positive qPCR samples is one of the main limitations of this study. For future studies, increased sample sizes and a minimum number of positive samples would be valuable. Another limitation is that the pre-, during and post-outbreak status are based on mortality numbers and florfenicol treatment, and the actual outbreak window has likely not been identified.
Before fish were introduced on the site, T. maritimum and T. dicentrarchi were typically not identified in the environment, with one exception; T. maritimum was found at the Larson netpen site. T. maritimum and T. dicentrarchi were also not identified in newly introduced Atlantic salmon post-smolts; however, a week later at least one of these bacterial species was identified in fish and environmental samples.
Bacteria identified during an outbreak were typically found in greatest abundances on external tissues such as the skin, jaws and gills, while fewer were recorded from internal tissues. It has been proposed that Tenacibaculum sp. may make up a portion of the mucosal microbiome of Atlantic salmon in seawater [46], where the presence before and after an outbreak supports that the bacteria should be considered opportunistic pathogens [47,48], potentially inducing tenacibaculosis through dysbiosis [49,50,51]. Of the environmental samples, OO had the most T. dicentrarchi, supporting the notion that other organisms associated with netpens can concentrate the bacteria relative to the environment [52,53,54,55]. Given that Tenacibaculum can be concentrated in or on OO, they may be useful indicator species for tracking the bacteria and potential tenacibaculosis outbreaks, where indicator species have been widely applied to monitor changes in the environment [56]. More Tenacibaculum bacteria or trends for increased numbers were detected from most sample types at MS during an outbreak, except for water samples. Florfenicol in un-consumed pellets and feces could influence the flora of the surrounding environment; as seen in other studies where the microbial diversity decreases [57], or selection for resistant bacteria can occur [58]. When all LI samples were pooled together, an increase in T. maritimum was recorded during an outbreak. It should be noted, that T. maritimum was not identified in live fish and that more T. dicentrarchi was identified at this site during an outbreak.
After the outbreaks at MS and LI, bacterial numbers decreased or were not detected, except no significant decreases occurred for infrastructure swabs, live fish samples and dead fish samples. Both results support the likelihood for a recrudescence of tenacibaculosis, as has been noted clinically.

3.5. The Primary Agent Responsible for the Larson and Midsummer Outbreaks

From the present study, there is more evidence that T. dicentrarchi (T. finnmarkense) was the cause of tenacibaculosis at netpen sites. This is supported by the findings that similar numbers of T. dicentrarchi were recorded between sites, more T. dicentrarchi were recorded throughout an outbreak at both sites in comparison to T. maritimum, more T. dicentrarchi were recorded during an outbreak and more T. dicentrarchi were detected from dead fish compared to live fish. The increase of T. dicentrarchi bacteria in dead fish (10-fold increase compared to live fish), is similar to research involving Flavobacterium species [59,60]. With numerous studies supporting the role of T. maritimum as a fish pathogen, it was likely involved in the outbreaks observed but possibly not as the most important agent. Describing the microbiomes of fish important to aquaculture is necessary, especially if numerous Tenacibaculum species can co-occur in the same microbiome and if shifts in populations may be related to infections, as seen with Vibrio sp. infections in C. gigas [61].

4. Materials and Methods

The methods described below are from the master′s thesis by Nowlan (2020) [31].

4.1. Sites Used in the Study

Two commercial netpen sites (Midsummer [MS] & Larson Island [LI]) located in the Broughton Archipelago (BC) were selected for sampling. The study was designed to follow groups of post-smolt Atlantic salmon (Salmo salar) from introduction to saltwater up to ~500 g.

4.2. Sample Collection, Processing, and Preservation

Over the five-month period from April 2019–September 2019, 14 sets of samples were collected from the MS netpen site. Over the four-month period from November 2019–February 2020, eight sets of samples were collected from the LI nepten site. Samples were collected before, during and after mouthrot outbreaks. All samples were collected in biological triplicates and samples were grouped within three tiers: Tier 1 (environment and fish); Tier 2 (water, infrastructure swabs, organisms associated with netpens (OO), and euthanized and deceased fish); Tier 3 (water-0 m, water-5 m, water-10 m, wood, metal, concrete, plastic, netpen, rubber, invertebrates, primary producers [macroalgae or marine angiosperms, jaws, skin, gill, muscle, head-kidney and spleen).
At the MS site, samples consisted of infrastructure swabs (netpen surfaces, plastic, metal, wood and concrete) using sterile cotton swabs, 1 L water samples within netpens (0, 5 and 10 m) using a Van-Dorn bottle, OO (primary producers [macroalgae and marine angiosperms] and invertebrates) and fish samples (euthanized and deceased [skin, upper jaw, lower jaw, muscle, spleen, and head-kidney]). Samples collected from the LI site were similar with several exceptions: rubber infrastructures were swabbed instead of wood; primary producers were not collected; only one invertebrate species (likely Obelia geniculata) was collected; and for fish tissues, the skin, jaws, gills, spleen and head-kidney were collected. Collected swabs and tissues were stored in RNAlater™ (SIGMA, R0901-500ML), and water samples were placed in Nalgene bottles. Back at Vancouver Island University, water samples were filtered through 180, 20, and 0.22 µm filters simultaneously and the 0.22 µm filters were placed in RNAlater™. All samples stored in RNAlater™ were frozen at −80 °C until needed. Information on specific collected samples can be found in ‘Supplementary material E and F’ by [31].

4.3. Bacterial Isolate Collection

Sterile inoculating loops were used to swab fish tissues and infrastructure; loops were then streaked onto Flexibacter maritimus medium (FMM) supplemented with kanamycin to a final concentration of 50 μg mL−1. Ten microlitres of pre-filtered water from each depth (0, 5, 10 m) was aliquoted onto FMM agar with kanamycin and was distributed using a curved sterile glass rod. Pure colonies thought to be Tenacibaculum underwent Gram staining and DNA extractions. Collected isolates are found in ‘Supplementary material G’ supplied by [31]. Isolates were stored in FMM with 25% glycerol and frozen at −80 °C. Several isolates, based on qPCR results, were sent for sequencing (Molecular Biology Facility, University of Alberta) using generic 16S rDNA primers (27F, 1492R; [62]).

4.4. DNA Extractions and Normalization

DNA was extracted from all samples using the OMEGA E.Z.N.A Tissue DNA extraction kit (Omega Bio-tek, Inc., USA) and deviations from the manufacturer’s guidelines are described by Nowlan (2020) [31]. Extracted DNA from most samples was diluted to a concentration of ~14.5 ng µL−1 if possible.

4.5. qPCR Application

All the samples underwent T. dicentrarchi (DICEN [31,32]) and T. maritimum (MAR [18,31]) specific qPCR assays, copying the thermal profile, reagents and equipment used for both assays. For reactions in each well using the DICEN and MAR assay, there was: 10 µL of Probes Master (Catalogue number: 04887301001 [Roche, Switzerland]); 1 µL of 10 µM forward primer; 1 µL of 10 µM reverse primer; 1 µL of 1 µM probe; and 7 µL (~100 ng) of template DNA. All samples were run in triplicate and plates used for qPCR had a positive control, a no template control.

4.6. Conversion of Cq to the Number of Bacteria Per Sample

Several standard curves described below were used to calculate the theoretical number of bacteria per amount of DNA (100 ng) added to each well and can be found in [31,32]. The standard curve used in this study for fish tissues used an average of both the spiked muscle and head-kidney tissue standard curves from [31,32].
For the DICEN assay, the number of bacteria in each well from environmental samples was calculated using Equation (1):
x = (10^ ((Mean Cq of the sample −47.62)/−3.68))/10
For the DICEN assay, the number of bacteria in each well from fish samples was calculated using Equation (2):
x = (10^ ((Mean Cq of the sample −44.55)/−3.19))/10
For the MAR assay, the number of bacteria in each well from environmental samples was calculated using Equation (3):
x = (10^ ((Mean Cq of the sample −36.68)/−3.45))/10
For the MAR assay, the number of bacteria in each well from fish samples was calculated using Equation (4):
x = (10^ ((Mean Cq of the sample −35.38)/−3.42))/10
From the resultant calculations (Equations (1)–(4)), ‘x’ is the number of bacteria per well.
From Equations (1)–(4), ‘x’ was converted to the number of bacteria per sample (x1) using Equation (5):
x1 = (x/y * concentration of the DNA extracted from the original sample [ng μL−1] * 100 [μL])
Using Equation (5), ‘y’ is the amount of DNA loaded into the well. For most samples, ‘y’ is 100 [amount of DNA added to each well].
A final calculation based on the type of sample occurred to achieve standardized units. For swabs, ‘x1′ was not transformed because the whole swab was used in the DNA extraction and the units became the number of bacteria per swab. For water samples, the result from ‘x1′ was multiplied by five, as only a fifth of the filter was used for DNA extractions, and the units became the number of bacteria per litre. For fish tissues and tissues from other organisms associated with netpens, ‘x1′ was multiplied by 33.3 (30 mg of tissue were used) to provide the number of bacteria per g of tissue. All qPCR Cq values and conversions can be found in “Supplementary material E and F” supplied by [31].

4.7. Supplementary Data

Additional data sets obtained during the sampling periods were provided by MCW personnel. These included mortality data (number per site per day), florfenicol treatment (dates and feeding rate), netpen cleaning (date and pen) and various environmental parameters. Environmental data included temperatures (°C) at 0, 5 and 10 m, salinity (‰) at 0, 5, and 10 m and dissolved oxygen (mg L−1) at 0 and 5 m.

4.8. Statistical Analysis

Welch′s ANOVA and Games-Howell post hoc test were applied comparing the log-number of bacteria (LNOB) to a single factor (site, assay, outbreak category, sample, sample type, or sample specifics).
A Kruskal–Wallis test was used to determine if there are differences in the average number of mortalities when florfenicol treatment occurred, when qPCR identified either target bacterial species and when netpen cleaning was applied. A non-parametric generalized additive model (GAM) was used to determine if there was a relationship between the number of mortalities and environmental parameters. Finally, binomial logistic regressions were used to interpret if there was a relationship between the application of florfenicol and any environmental parameter. For all comparisons, a p-value ≤ of 0.05 was selected to denote significant differences.

Author Contributions

Conceptualization, J.P.N., J.S.L., S.R.; methodology, J.P.N., S.R.B.; software, J.P.N.; validation, J.P.N., J.S.L., S.R.; formal analysis, J.P.N.; investigation, J.P.N.; resources, J.P.N.; data curation, J.P.N.; writing—original draft preparation, J.P.N.; writing—review and editing, J.P.N., S.R.B., J.S.L., S.R.; visualization, J.P.N., J.S.L., S.R.; supervision, J.S.L., S.R.; project administration, J.S.L., S.R.; funding acquisition, J.S.L., S.R. All authors have read and agreed to the published version of the manuscript.

Funding

This research was funded by NSERC Engage and Engage Plus grants (Grant number: 411309784) in conjunction with Mowi Canada West and a Vancouver Island University VIURAC grant (Grant number: 100863). Nowlan was supported by an Ontario Veterinary College Graduate Scholarship.

Institutional Review Board Statement

Live animals were handled by Mowi Canada West personnel.

Informed Consent Statement

Not applicable.

Data Availability Statement

Data can be found through contacting the corresponding author.

Acknowledgments

Thanks to Mowi Canada West and members within, who collaborated on logistics, transportation and fish handling.

Conflicts of Interest

The authors declare no conflict of interest.

References

  1. Fisheries and Oceans Canada (DFO). Aquaculture Production Quantities and Value. Available online: https://www.dfo-mpo.gc.ca/stats/aqua/aqua-prod-eng.htm (accessed on 7 October 2020).
  2. Nowlan, J.P.; Lumsden, J.S.; Russell, S. Advancements in Characterizing Tenacibaculum Infections in Canada. Pathogens 2020, 9, 1029. [Google Scholar] [CrossRef] [PubMed]
  3. Avendaño-Herrera, R.; Toranzo, A.E.; Magariños, B. Tenacibaculosis infection in marine fish caused by Tenacibaculum maritimum: A review. Dis. Aquat. Org. 2006, 71, 255–266. [Google Scholar] [CrossRef] [PubMed]
  4. Nondahl, T. Where Does the Money Go? [President’s Message]. IEEE Ind. Appl. Mag. 2009, 15, 4. [Google Scholar] [CrossRef]
  5. Frisch, K.; Småge, S.B.; Vallestad, C.; Duesund, H.; Brevik, Ø.J.; Klevan, A.; Olsen, R.H.; Sjaatil, S.T.; Gauthier, D.; Brudeseth, B.; et al. Experimental induction of mouthrot in Atlantic salmon smolts usingTenacibaculum maritimumfrom Western Canada. J. Fish. Dis. 2018, 41, 1247–1258. [Google Scholar] [CrossRef] [Green Version]
  6. Frisch, K.; Småge, S.B.; Johansen, R.; Duesund, H.; Brevik, Ø.J.; Nylund, A. Pathology of experimentally induced mouthrot caused by Tenacibaculum maritimum in Atlantic salmon smolts. PLoS ONE 2018, 13, e0206951. [Google Scholar] [CrossRef]
  7. Piñeiro-Vidal, M.; Carballas, C.G.; Gómez-Barreiro, O.; Riaza, A.; Santos, Y. Tenacibaculum soleae sp. nov., isolated from diseased sole (Solea senegalensis Kaup). Int. J. Syst. Evol. Microbiol. 2008, 58, 881–885. [Google Scholar] [CrossRef]
  8. Piñeiro-Vidal, M.; Centeno-Sestelo, G.; Riaza, A.; Santos, Y. Isolation of pathogenic Tenacibaculum maritimum-related or-ganisms from diseased turbot and sole cultured in the Northwest of Spain. Bull. Eur. Assoc. Fish Pathol. 2007, 27, 29–35. [Google Scholar]
  9. Piñeiro-Vidal, M.; Gijón, D.; Zarza, C.; Santos, Y. Tenacibaculum dicentrarchi sp. nov., a marine bacterium of the family Flavobacteriaceae isolated from European sea bass. Int. J. Syst. Evol. Microbiol. 2012, 62, 425–429. [Google Scholar] [CrossRef] [Green Version]
  10. Piñeiro-Vidal, M.; Riaza, A.; Santos, Y. Tenacibaculum discolor sp. nov. and Tenacibaculum gallaicum sp. nov., isolated from sole (Solea senegalensis) and turbot (Psetta maxima) culture systems. Int. J. Syst. Evol. Microbiol. 2008, 58, 21–25. [Google Scholar] [CrossRef]
  11. Burioli, E.A.V.; Varello, K.; Trancart, S.; Bozzetta, E.; Gorla, A.; Prearo, M.; Houssin, M. First description of a mortality event in adult Pacific oysters in Italy associated with infection by a Tenacibaculum soleae strain. J. Fish Dis. 2017, 41, 215–221. [Google Scholar] [CrossRef]
  12. Sakatoku, A.; Fujimura, T.; Ito, M.; Takashima, S.; Isshiki, T. Newly isolated bacterium Tenacibaculum sp. strain Pbs-1 from diseased pearl oysters is associated with black-spot shell disease. Aquaculture 2018, 493, 61–67. [Google Scholar] [CrossRef]
  13. Irgang, R.; González-Luna, R.; Gutiérrez, J.; Poblete-Morales, M.; Rojas, V.; Tapia-Cammas, D.; Avendaño-Herrera, R. First identification and characterization ofTenacibaculum dicentrarchiisolated from Chilean red conger eel (Genypterus chilensis,Guichenot 1848). J. Fish Dis. 2017, 40, 1915–1920. [Google Scholar] [CrossRef]
  14. Barker, D.E.; Braden, L.M.; Coombs, M.P.; Boyce, B. Preliminary studies on the isolation of bacteria from sea lice, Lepeophtheirus salmonis, infecting farmed salmon in British Columbia, Canada. Parasitol. Res. 2009, 105, 1173–1177. [Google Scholar] [CrossRef]
  15. Chistoserdov, A.Y.; Quinn, R.A.; Gubbala, S.L.; Smolowitz, R. Bacterial communities associated with lesions of shell dis-ease in the American lobster, Homarus americanus Milne-Edwards. J. Shellfish Res. 2012, 31, 449–462. [Google Scholar] [CrossRef]
  16. Sheu, S.Y.; Lin, K.Y.; Chou, J.H.; Chang, P.S.; Arun, A.B.; Young, C.C.; Chen, W.M. Tenacibaculum litopenaei sp. nov., isolat-ed from a shrimp mariculture pond. Int. J. Syst. Evol. Microbiol. 2007, 57, 1148–1153. [Google Scholar] [CrossRef]
  17. Delannoy, C.M.; Houghton, J.D.; Fleming, N.E.; Ferguson, H.W. Mauve Stingers (Pelagia noctiluca) as carriers of the bacterial fish pathogen Tenacibaculum maritimum. Aquaculture 2011, 311, 255–257. [Google Scholar] [CrossRef]
  18. Fringuelli, E.; Savage, P.D.; Gordon, A.; Baxter, E.J.; Rodger, H.D.; Graham, D.A. Development of a quantitative re-al-time PCR for the detection of Tenacibaculum maritimum and its application to field samples. J. Fish Dis. 2012, 35, 579–590. [Google Scholar] [CrossRef]
  19. Småge, S.B.; Brevik, Ø.J.; Frisch, K.; Watanabe, K.; Duesund, H.; Nylund, A. Concurrent jellyfish blooms and tenacibac-ulosis outbreaks in Northern Norwegian Atlantic salmon (Salmo salar) farms. PLoS ONE 2017, 12, e0187476. [Google Scholar]
  20. Hooper, R.; Brealey, J.C.; Van Der Valk, T.; Alberdi, A.; Durban, J.W.; Fearnbach, H.; Robertson, K.M.; Baird, R.W.; Hanson, M.B.; Wade, P.; et al. Host-derived population genomics data provides insights into bacterial and diatom composition of the killer whale skin. Mol. Ecol. 2018, 28, 484–502. [Google Scholar] [CrossRef]
  21. Frette, L.; Jørgensen, N.O.G.; Irming, H.; Kroer, N. Tenacibaculum skagerrakense sp. nov., a marine bacterium isolated from the pelagic zone in Skagerrak, Denmark. Int. J. Syst. Evol. Microbiol. 2004, 54, 519–524. [Google Scholar] [CrossRef]
  22. Teramoto, M.; Zhai, Z.; Komatsu, A.; Shibayama, K.; Suzuki, M. Genome sequence of the psychrophilic bacterium Tenaci-baculum ovolyticum strain da5A-8 isolated from deep seawater. Genome Announc. 2016, 4, e00644-16. [Google Scholar] [CrossRef] [PubMed] [Green Version]
  23. Webb, S. Influence of Eelgrasses on the Microbial Community Structure in San Diego Bay Waters. Master’s Thesis, UC San Diego, San Diego, CA, USA, 2018. [Google Scholar]
  24. Levipan, H.A.; Irgang, R.; Tapia-Cammas, D.; Avendaño-Herrera, R. A high-throughput analysis of biofilm formation by the fish pathogen Tenacibaculum dicentrarchi. J. Fish Dis. 2019, 42, 617–621. [Google Scholar] [CrossRef] [PubMed]
  25. Levipan, H.A.; Tapia-Cammas, D.; Molina, V.; Irgang, R.; Toranzo, A.E.; Magariños, B.; Avendaño-Herrera, R. Biofilm development and cell viability: An undervalued mechanism in the persistence of the fish pathogen Tenacibaculum maritimum. Aquaculture 2019, 511, 734267. [Google Scholar] [CrossRef]
  26. Levipan, H.A.; Avendaño-Herrera, R. Different Phenotypes of Mature Biofilm in Flavobacterium psychrophilum Share a Potential for Virulence That Differs from Planktonic State. Front. Cell. Infect. Microbiol. 2017, 7, 76. [Google Scholar] [CrossRef]
  27. Grothusen, H.; Castillo, A.; Henríquez, P.; Navas, E.; Bohle, H.; Araya, C.; Bustamante, F.; Bustos, P.; Mancilla, M. First Complete Genome Sequence of Tenacibaculum dicentrarchi, an Emerging Bacterial Pathogen of Salmonids. Genome Announc. 2016, 4, 01756-15. [Google Scholar] [CrossRef] [Green Version]
  28. Bridel, S.; Olsen, A.-B.; Nilsen, H.; Bernardet, J.-F.; Achaz, G.; Avendaño-Herrera, R.; Duchaud, E. Comparative Genomics of Tenacibaculum dicentrarchi and “Tenacibaculum finnmarkense” Highlights Intricate Evolution of Fish-Pathogenic Species. Genome Biol. Evol. 2018, 10, 452–457. [Google Scholar] [CrossRef] [Green Version]
  29. Habib, C.; Houel, A.; Lunazzi, A.; Bernardet, J.F.; Olsen, A.B.; Nilsen, H.; Toranzo, A.E.; Castro, N.; Nicolas, P.; Duchaud, E. Multilocus sequence analysis of the marine bacterial genus Tenacibaculum suggests parallel evolution of fish patho-genicity and endemic colonization of aquaculture systems. Appl. Environ. Microbiol. 2014, 80, 5503–5514. [Google Scholar] [CrossRef] [Green Version]
  30. Avendaño-Herrera, R.; Collarte, C.; Saldarriaga-Córdoba, M.; Irgang, R. New salmonid hosts for Tenacibaculum species: Expansion of tenacibaculosis in Chilean aquaculture. J. Fish Dis. 2020, 43, 1077–1085. [Google Scholar] [CrossRef]
  31. Nowlan, J. Quantitative-PCR Detection of Tenacibaculum Maritimum and Tenacibaculum Dicentrarchi at Netpen Sites in British Columbia (Canada). Master’s Thesis, University of Guelph, Guelph, ON, Canada, 2020. [Google Scholar]
  32. Nowlan, J.P.; Lumsden, J.S.; Russell, S. Quantitative PCR for Tenacibaculum dicentrarchi and T. finnmarkense. J. Fish Dis. 2021, 00, 1–5. [Google Scholar] [CrossRef]
  33. Masuda, Y.; Tajima, K.; Ezura, Y. Resuscitation of Tenacibaculum sp., the causative bacterium of spotting disease of sea urchin Strongylocentroutus intermedius, from the viable but non-culturable state. Fish Sci. 2004, 70, 277–284. [Google Scholar] [CrossRef]
  34. Fernández-Álvarez, C.; Santos, Y. Identification and typing of fish pathogenic species of the genus Tenacibaculum. Appl. Microbiol. Biot. 2017, 102, 9973–9989. [Google Scholar] [CrossRef]
  35. Henson, M.W.; Pitre, D.M.; Weckhorst, J.L.; Lanclos, V.C.; Webber, A.T.; Thrash, J.C. Artificial seawater media facili-tate cultivating members of the microbial majority from the Gulf of Mexico. MSphere 2016, 1, e00028-16. [Google Scholar]
  36. Spearman, M.; Chan, S.; Jung, V.; Kowbel, V.; Mendoza, M.; Miranda, V.; Butler, M. Components of yeast (Sacchromyces cervisiae) extract as defined media additives that support the growth and productivity of CHO cells. J. Biotechnol. 2016, 233, 129–142. [Google Scholar] [CrossRef]
  37. Spearman, M.; Lodewyks, C.; Richmond, M.; Butler, M. The bioactivity and fractionation of peptide hydrolysates in cul-tures of CHO cells. Biotechnol. Prog. 2014, 30, 584–593. [Google Scholar] [CrossRef]
  38. Madetoja, J.; Wiklund, T. Detection of the Fish Pathogen Flavobacterium psychrophilum in Water from Fish Farms. Syst. Appl. Microbiol. 2002, 25, 259–266. [Google Scholar] [CrossRef]
  39. Sugahara, K.; Fujiwara-Nagata, E.; Fukuda, A.; Eguchi, M. Viable but Non-culturable State of Bacterial Cold-water Disease Pathogen Flavobacterium psychrophilum at Various Temperatures. Fish Pathol. 2010, 45, 158–163. [Google Scholar] [CrossRef] [Green Version]
  40. Arias, C.R.; LaFrentz, S.; Cai, W.; Olivares-Fuster, O. Adaptive response to starvation in the fish pathogen Flavobacterium columnare: Cell viability and ultrastructural changes. BMC Microbiol. 2012, 12, 266. [Google Scholar] [CrossRef] [Green Version]
  41. Avendaño-Herrera, R.; Irgang, R.; Sandoval, C.; Moreno-Lira, P.; Houel, A.; Duchaud, E.; Poblete-Morales, M.; Nicolas, P.; Ilardi, P. Isolation, Characterization and Virulence Potential of Tenacibaculum dicentrarchi in Salmonid Cultures in Chile. Transbound. Emerg. Dis. 2016, 63, 121–126. [Google Scholar] [CrossRef]
  42. Brosnahan, C.L.; Munday, J.S.; Ha, H.J.; Preece, M.; Jones, J.B. New Zealand rickettsia-like organism (NZ-RLO) and Te-nacibaculum maritimum: Distribution and phylogeny in farmed Chinook salmon (Oncorhynchus tshawytscha). J. Fish Dis. 2019, 42, 85–95. [Google Scholar] [CrossRef]
  43. Anderson, D.M.; Glibert, P.M.; Burkholder, J.M. Harmful algal blooms and eutrophication: Nutrient sources, composition, and consequences. Estuaries 2002, 25, 704–726. [Google Scholar] [CrossRef]
  44. Almeda, R.; Messmer, A.M.; Sampedro, N.; Gosselin, L.A. Feeding rates and abundance of marine invertebrate planktonic larvae under harmful algal bloom conditions off Vancouver Island. Harmful Algae 2011, 10, 194–206. [Google Scholar] [CrossRef]
  45. Floerl, O.; Sunde, L.; Bloecher, N. Potential environmental risks associated with biofouling management in salmon aquaculture. Aquac. Environ. Interact. 2016, 8, 407–417. [Google Scholar] [CrossRef] [Green Version]
  46. Llewellyn, M.S.; Leadbeater, S.; Garcia, C.; Sylvain, F.-E.; Custodio, M.; Ang, K.P.; Powell, F.; Carvalho, G.R.; Creer, S.; Elliot, J.; et al. Parasitism perturbs the mucosal microbiome of Atlantic Salmon. Sci. Rep. 2017, 7, 43465. [Google Scholar] [CrossRef] [Green Version]
  47. Derome, N.; Gauthier, J.; Boutin, S.; Llewellyn, M. Bacterial Opportunistic Pathogens of Fish. Adv. Environ. Microbiol. 2016, 3, 81–108. [Google Scholar] [CrossRef]
  48. Wedekind, C.; Gessner, M.O.; Vazquez, F.; Maerki, M.; Steiner, D. Elevated resource availability sufficient to turn opportunistic into virulent fish pathogens. Ecology 2010, 91, 1251–1256. [Google Scholar] [CrossRef] [PubMed] [Green Version]
  49. Egan, S.; Gardiner, M. Microbial Dysbiosis: Rethinking Disease in Marine Ecosystems. Front. Microbiol. 2016, 7, 991. [Google Scholar] [CrossRef] [PubMed]
  50. Wynne, J.W.; Thakur, K.K.; Slinger, J.; Samsing, F.; Milligan, B.; Powell, J.F.F.; McKinnon, A.; Nekouei, O.; New, D.; Richmond, Z.; et al. Microbiome Profiling Reveals a Microbial Dysbiosis During a Natural Outbreak of Tenacibaculosis (Yellow Mouth) in Atlantic Salmon. Front. Microbiol. 2020, 11, 586387. [Google Scholar] [CrossRef] [PubMed]
  51. Slinger, J.; Adams, M.B.; Wynne, J.W. Bacteriomic profiling of branchial lesions induced by Neoparamoeba perurans chal-lenge reveals commensal dysbiosis and an association with Tenacibaculum dicentrarchi in AGD-affected Atlantic salmon (Salmo salar L.). Microorganisms 2020, 8, 1189. [Google Scholar] [CrossRef]
  52. Huq, A.; Huq, S.A.; Grimes, D.J.; O’Brien, M.; Chu, K.H.; Capuzzo, J.M.; Colwell, R.R. Colonization of the gut of the blue crab (Callinectes sapidus) by Vibrio cholerae. Appl. Environ. Microbiol. 1986, 52, 586–588. [Google Scholar] [CrossRef] [Green Version]
  53. Kueh, C.S.; Chan, K.-Y. Bacteria in bivalve shellfish with special reference to the oyster. J. Appl. Bacteriol. 1985, 59, 41–47. [Google Scholar] [CrossRef]
  54. Cavallo, R.A.; Acquaviva, M.I.; Stabili, L. Culturable heterotrophic bacteria in seawater and Mytilus galloprovincialis from a Mediterranean area (Northern Ionian Sea—Italy). Environ. Monit. Assess. 2008, 149, 465–475. [Google Scholar] [CrossRef]
  55. McEdward, L. Ecology of Marine Invertebrate Larvae; CRC Press: Boca Raton, FL, USA, 1995. [Google Scholar]
  56. Siddig, A.A.; Ellison, A.M.; Ochs, A.; Villar-Leeman, C.; Lau, M.K. How do ecologists select and use indicator species to monitor ecological change? Insights from 14 years of publication in Ecological Indicators. Ecol. Indic. 2016, 60, 223–230. [Google Scholar] [CrossRef] [Green Version]
  57. Zong, H.; Ma, D.; Wang, J.; Hu, J. Research on florfenicol residue in coastal area of Dalian (northern China) and analy-sis of functional diversity of the microbial community in marine sediment. Bull. Environ. Contam. Toxicol. 2010, 84, 245–249. [Google Scholar] [CrossRef]
  58. Miranda, C.D.; Rojas, R. Occurrence of florfenicol resistance in bacteria associated with two Chilean salmon farms with different history of antibacterial usage. Aquaculture 2007, 266, 39–46. [Google Scholar] [CrossRef]
  59. Madetoja, J.; Nyman, P.; Wiklund, T. Flavobacterium psychrophilum, invasion into and shedding by rainbow trout Oncorhynchus mykiss. Dis. Aquat. Org. 2000, 43, 27–38. [Google Scholar] [CrossRef] [Green Version]
  60. Kunttu, H.M.T.; Valtonen, E.T.; Jokinen, E.I.; Suomalainen, L.R. Saprophytism of a fish pathogen as a transmission strat-egy. Epidemics 2009, 1, 96–100. [Google Scholar] [CrossRef]
  61. King, W.L.; Siboni, N.; Kahlke, T.; Green, T.J.; Labbate, M.; Seymour, J.R. A New High Throughput Sequencing Assay for Characterizing the Diversity of Natural Vibrio Communities and Its Application to a Pacific Oyster Mortality Event. Front. Microbiol. 2019, 10, 2907. [Google Scholar] [CrossRef] [Green Version]
  62. Suzuki, K.I.; Sasaki, J.; Uramoto, M.; Nakase, T.; Komagata, K. Agromyces mediolanus sp. nov., nom. rev., comb. nov., a species for “Corynebacterium mediolanum” Mamoli 1939 and for some aniline-assimilating bacteria which contain 2, 4-diaminobutyric acid in the cell wall peptidoglycan. Int. J. Syst. Evol. Microbiol. 1996, 46, 88–93. [Google Scholar] [CrossRef] [Green Version]
Figure 1. Gram stains of Tenacibaculum finnmarkense AY7486TD isolates (LI C6 FM3-M [A, LI C6 FM3-G [B, and LI C6 FM3-F [C]) collected from an Atlantic salmon (D, fork length = 32 cm) at the Larson Island netpen site on 1/28/2020 during a tenacibaculosis outbreak. Isolates were identified based on morphology, qPCR results and the 16S rDNA sequence of LI C6 FM3-F. Numerous dislodged scales on the body, areas of discolouration and yellow plaques on the jaws were present. Gram-negative and filamentous bacteria were grown on FMM agar with kanamycin and viewed at ×1000 magnification. The white scale bar (32 µm) applies to (AC).
Pathogens 10 00414 g001
Figure 2. Mean +/− SD. Log-number of bacteria for positive samples for the T. dicentrarchi (DICEN) and T. martimum (MAR) specific qPCR assays at the Midsummer and Larson Island netpen sites. Different letters indicate significant differences (p ≤ 0.05).
Pathogens 10 00414 g002
Figure 3. Mean +/− SD. Log-number of bacteria for positive samples from the Midsummer site based on outbreak category using the T.dicentrarchi (DICEN) or T. maritimum (MAR) specific qPCR assays. Significant differences (p ≤ 0.05) are identified using different letters, uppercase and lowercase letters indicate separate Welch′s ANOVAs.
Pathogens 10 00414 g003
Figure 4. Mean +/− SD. Log-number of bacteria for positive samples from the Midsummer site using the T. dicentrarchi (DICEN) or T. maritimum (MAR) specific qPCR assay compared against outbreak category for each sample type. Significant differences (p ≤ 0.05) are identified using different letters and coloured columns, separate Welch′s ANOVAs occurred for individual sample types.
Pathogens 10 00414 g004
Table 1. Most similar BLAST * comparisons for 16S rDNA sequence of Tenacibaculum isolates cultured from Atlantic salmon (Salmo salar) including alignment length (bp), query cover, E-value and percent identity.
Isolate NameMost Similar BLAST MatchAlignment Length (bp)Query Cover (%)E-ValuePercent Identity (%)
MS C7 M2T. dicentrarchi QCR291326100099.4
MS C9 F1T. dicentrarchi TdChD061335100099.63
MS C10 M2T. finnmarkense AY7486TD13351000100
LI C6 FM1-GT. finnmarkense AY7486TD10181000100
LI C6 FM1-FT. finnmarkense AY7486TD1330100099.92
LI C6 FM2-GT. finnmarkense AY7486TD13351000100
LI C6 FM3-FT. finnmarkense AY7486TD1335100099.85
* Basic Local Alignment Search Tool (BLAST; https://blast.ncbi.nlm.nih.gov/Blast.cgi (accessed on 21 February 2020)).
Table 2. Number of positive qPCR samples at the Midsummer and Larson Island netpen sites using the T. dicentrarchi, T. maritimum or both specific quantitative-PCR assays. Numbers in brackets represent percentages. Percentages are calculated by dividing the number of positive qPCR samples against the number of samples in total, for fish tissues or for the environment (Env.).
SiteT. dicentrarchiT. maritimumBoth
MidsummerTotal: 131 (16.9)Total: 82 (10.6)Total: 31 (3.99)
Fish: 71 (17.9)Fish: 76 (19.2)Fish: 30 (7.59)
Env.: 60 (15.7)Env.: 6 (1.57)Env.: 1 (0.262)
Larson IslandTotal: 34 (8.79)Total: 24 (6.20)Total: 6 (1.55)
Fish: 23 (13.8)Fish: 9 (5.39)Fish: 6 (3.59)
Env.: 11 (5.09)Env.: 15 (6.94)Env.: 0
Table 3. Statistical comparisons (Welch′s ANOVA) using the Midsummer (MS) and Larson Island (LI) netpen sites and using the T. dicentrarchi (DICEN), T. maritimum (MAR) or both specific qPCR assays. For each level of a comparison there is the mean log-number of bacteria (LNOB) and SD *, for each comparison there is also an attributed F-value and corresponding p-value (p).
LNOB ComparisonMean LNOB ± SD *F Valuep
1. Between sites using both assaysMS: 6.3 ± 1.7 A
LI: 5.6 ± 2.0 B
F1,95.18 = 7.70.0068
2. Within/between sites comparing DICEN and MAR assaysMS DICEN: 7.1 ± 1.5 A
MS MAR: 5.2 ± 1.3 B
LI DICEN: 6.8 ± 1.2 A
LI MAR: 3.9 ± 1.7 C
F3,91.88 = 63<2.2 × 10⁻¹⁶
3. Throughout an outbreak using both sites and assaysPre: 5.7 ± 1.9 A
During: 6.5 ± 1.8 B
Post: 5.4 ± 1.4 A
F2,110.44 = 131.2 × 10⁻⁵
4. Between fish and the env. using both sites and assaysFish: 6.5 ± 1.7 A
Env.: 5.3 ± 1.7 B
F1,164.11 = 334.9 × 10⁻⁸
5. Between sample types using both sites and assaysFish-Live: 6.0 ± 1.5 A
Fish-Dead: 6.8 ± 1.8 B
OO: 7.0 ± 1.7 A,B
Water: 4.5 ± 1.5 C
Infrastructure: 5.0 ± 1.3 C
F4,80.43 = 237.8 × 10⁻¹³
6. Throughout an outbreak at MS using the DICEN assayPre: 6.6 ± 0.74 A
During: 7.3 ± 1.7 B
Post: 7.1 ± 1.5 AB
F2,13.481 = 7.00.0082
7. Throughout an outbreak at MS using the MAR assayPre: NA
During: 5.2 ± 1.2 A
Post: 5.1 ± 1.4 A
F1,77.501 = 0.0530.82
8. Between sample types at MS using the DICEN assayFish-Live: 7.3 ± 0.81 A
Fish-Dead: 7.9 ± 1.6 A
OO: 7.8 ± 0.50 A
Water: 5.6 ± 1.5 B
Infrastructure: 5.6 ± 0.49 B
F4,49.523 = 60<2.2 × 10⁻¹⁶
9. Between sample types at MS using the MAR assayFish-Live: 4.9 ± 1.1 A
Fish-Dead: 5.7 ± 1.2 B
OO: 3.8 ± 0.65 A,B,C
Water: 2.8 ± 0.91 C
F3,6.73 = 150.0021
10. In live fish throughout an outbreak at MS using the DICEN assayPre: 7.1 ± 0.78 A
During: 7.5 ± 0.81 A
Post: 6.7 ± 0.30 A
F2,4.5048 = 4.080.097
11. In infrastructure swabs throughout an outbreak at MS using the DICEN assayPre: 5.6 ± 0.15 A
During: 5.6 ± 0.61 A
Post: 4.8
F1,25.651 = 0.290.59
12. In dead fish throughout an outbreak at MS using the DICEN assayPre: 6.9 + 0.270 A
During: 8.2 + 1.75 B
Post: 8.1 + 1.04 A,B
F2,5.27 = 120.011
13. In OO throughout an outbreak at MS using the DICEN assayPre: 7.1 ± 0.316 A
During: 8.2 ± 1.18 B
Post: NA
F1,8.76 = 5.30.047
14. In water throughout an outbreak at MS using the DICEN assayPre: 6.1 ± 0.316 A
During: 5.3 ± 0.361 B
Post: NA
F1,11.50 = 190.0011
15. In dead fish throughout an outbreak at MS using the MAR assayPre: NA
During: 5.7 ± 1.22 A
Post: 5.7 ± 1.14 A
F1,48.76 = 0.000770.98
16. In live fish throughout an outbreak at MS using the MAR assayPre: NA
During: 4.9 ± 1.14 A
Post: 4.9 ± 0.837 A
F1,27.155 = 0.0110.91
17. Throughout an outbreak at LI using the DICEN assayPre: 9.4
During: 6.8 ± 1.14
Post: 6.1
NANA
18. Throughout an outbreak at LI using the MAR assayPre: 2.7 ± 0.831
During: 5.0 ± 1.65
Post: 5.3 ± 1.10
F2,9.6835 = 176.4 × 10⁻⁴
19. Between sample types at LI using the DICEN assayFish-Live: 6.5 ± 0.469 A
Fish-Dead: 7.7 ± 1.21 B
OO: 7.1 ± 0.678 A,B
Water: NA
Infrastructure: 5.2 ± 0.469 C
F3,12.80 = 204.6 × 10⁻⁵
20. Between sample types at LI using the MAR assayFish-Live: NA
Fish-Dead: 5.1 ± 1.41 A
OO: NA
Water: 3.0 ± 0.71 B
Infrastructure: 2.3 ± 0.77 B
F2,16.597 = 194.7 × 10⁻⁵
* Different superscript letters after the SD represent differences between levels using the Games-Howell post hoc test. No SD after a reported mean indicates the value for a single positive sample. NA= Not available, env. = Environment, OO = other organisms associated with netpens.
Publisher’s Note: MDPI stays neutral with regard to jurisdictional claims in published maps and institutional affiliations.

