Article

Discrepancies in Serology-Based and Nucleic Acid-Based Detection and Quantitation of Tomato Spotted Wilt Orthotospovirus in Leaf and Root Tissues from Symptomatic and Asymptomatic Peanut Plants

1
Department of Entomology, University of Georgia, Griffin, GA 30223, USA
2
Department of Entomology, University of Georgia, Tifton, GA 31793, USA
3
Department of Plant Pathology, University of Georgia, Tifton, GA 31793, USA
*
Author to whom correspondence should be addressed.
Pathogens 2021, 10(11), 1476; https://doi.org/10.3390/pathogens10111476
Submission received: 31 August 2021 / Revised: 29 October 2021 / Accepted: 10 November 2021 / Published: 12 November 2021
(This article belongs to the Special Issue Tomato Spotted Wilt Virus)

Abstract

:
Thrips-transmitted tomato spotted wilt orthotospovirus (TSWV) causes spotted wilt disease in peanuts. A serological test (DAS-ELISA) is often used to detect TSWV in peanut leaf samples. However, in a few studies, DAS-ELISA detected more TSWV infection in root than leaf samples. It was not clear if the increased detection was due to increased TSWV accumulation in root tissue or merely an overestimation. Additionally, it was unclear if TSWV detection in asymptomatic plants would be affected by the detection technique. TSWV infection in leaf and root tissue from symptomatic and asymptomatic plants was compared via DAS-ELISA, RT-PCR, and RT-qPCR. TSWV incidence did not vary by DAS-ELISA, RT-PCR, and RT-qPCR in leaf and root samples of symptomatic plants or in leaf samples of asymptomatic plants. In contrast, significantly more TSWV infection and virus load were detected in root samples of asymptomatic plants via DAS-ELISA than other techniques suggesting that DAS-ELISA overestimated TSWV incidence and load. TSWV loads from symptomatic plants via RT-qPCR were higher in leaf than root samples, while TSWV loads in leaf and root samples from asymptomatic plants were not different but were lower than those in symptomatic plants. These findings suggested that peanut tissue type and detection technique could affect accurate TSWV detection and/or quantitation.

1. Introduction

Spotted wilt disease of peanut (Arachis hypogaea L.) is caused by the tomato spotted wilt orthotospovirus (TSWV), and TSWV is exclusively transmitted by nine thrips species in the order Thysanoptera and family Thripidae [1,2,3]. Tomato spotted wilt orthotospovirus is the type species in the genus Orthotospovirus, family Tospoviridae, and order Bunyavirales [3]. Besides peanut, the host range of TSWV includes over a thousand plants species in 15 monocot families and 69 dicot families [4]. TSWV is the most impactful virus affecting peanuts in the southeastern U.S. [1].
TSWV is an important yield-limiting factor and is ubiquitous across major peanut-producing states in the Southeast since the first report of spotted wilt in peanut in 1971 in the U.S. [5,6,7,8,9,10]. In Georgia, the top U.S. peanut-producing state, the annual peanut yield loss to TSWV was estimated at over USD 20 million from 2015 to 2018 [11,12,13,14,15].
The most prominent symptoms of spotted wilt disease are concentric ring spots and chlorosis on peanut foliage. In severe cases of TSWV infection, peanut plants are stunted or even dead. Other symptoms such as small or misshaped pegs, pods, kernels, and reddish discoloration of the seed coats can also be found on below-ground plant parts [1,9,16,17]. Visual assessment of symptoms is commonly used to evaluate TSWV incidence and severity [18,19,20]. However, biotic or abiotic factors, including temperature/water stress, nutrient deficiency, pest infestation, and other pathogen infections, can make symptoms induced by TSWV infection difficult to recognize. Different detection techniques are used to confirm the presence of TSWV. Among the available techniques, serology-based double antibody sandwich enzyme-linked immunosorbent assay (DAS-ELISA) is most commonly used to detect TSWV in peanut tissues in the laboratory, while ImmunoStrip® (Agdia, Elkhart, IN, USA) test is largely used for on-farm testing. Another less frequently used laboratory technique is nucleic acid-based reverse-transcription polymerase chain reaction (RT-PCR) [21,22,23,24,25,26,27,28]. Reverse-transcription quantitative polymerase chain reaction (RT-qPCR) is an additional technique that is available to detect TSWV and/or to quantitate TSWV loads in peanut tissue samples [29,30,31].
TSWV incidence is often evaluated to assess TSWV susceptibility of cultivars/genotypes in breeding trials and the efficacy of TSWV management practices, and such evaluations are facilitated by laboratory detection methods [25,28,32,33,34]. DAS-ELISA utilizes TSWV-specific monoclonal/polyclonal antibodies to capture TSWV, which is then conjugated with an enzyme that induces a colorimetric response in the presence of a substrate [35,36]. DAS-ELISA has become the standard plant virus detection method due to its relatively low cost and scalability for larger sample sizes [37,38,39]. RT-PCR involves reverse-transcription to synthesize complementary DNA (cDNA) from total RNA and uses TSWV-specific primers to amplify the targeted TSWV gene from cDNA [23,40]. RT-PCR is more specific and sensitive than DAS-ELISA but is less frequently used, as it requires total RNA extraction from peanut tissue samples, specialized equipment, advanced operational skills, and is more expensive than DAS-ELISA [37,41]. RT-qPCR differs from RT-PCR in that the PCR product is detected in real-time during amplification. This is commonly achieved using non-specific fluorescent dyes that intercalate with double-stranded DNA or complementary fluorescent probes that bind to the amplicon by base-pairing [42]. The amount of the amplicon (i.e., TSWV capsid protein gene) can be determined by absolute/relative quantitation [43,44].
TSWV infection in peanuts is systemic, and TSWV has been detected in multiple peanut plant tissues, including leaves, pegs, pods, and roots [26,27]. Peanut leaf tissue is typically used for TSWV detection via DAS-ELISA; however, one study indicated that the distribution of TSWV in peanut leaves was not uniform [24]. In a few other studies, TSWV was detected at a higher percentage in root than leaf tissue samples [16,22,25,27]. This led to the presumption that root tissue could serve as a better reservoir for TSWV than leaf tissue. Nevertheless, in planta movement and accumulation of TSWV in peanuts is not completely understood. It is not clear if the difference in TSWV detection between root and leaf tissue samples via DAS-ELISA is due to higher virus loads in root versus leaf tissue or if the difference is the result of the DAS-ELISA producing false positives when root tissue samples are tested. Alternatively, it is also not clear if RT-PCR testing is resulting in the detection of false negatives with root tissue samples due to the presence of PCR inhibitors. A more recent study compared TSWV detection by DAS-ELISA and RT-PCR using root samples but not leaf samples from randomly collected field-grown peanut plants and found good congruence between the two methods [22]. However, no study has compared DAS-ELISA detection of TSWV in symptomatic leaf and root tissue samples with RT-PCR detection. TSWV infection is also detected in asymptomatic plants, especially often in diploid peanut species [21,25,45,46]. DAS-ELISA-based virus detection in leaf and root tissue samples could be affected by numerous extraneous factors and warrants comparison with other detection methods to assess whether DAS-ELISA-based TSWV testing in asymptomatic plant tissue samples produces accurate results or overestimates due to the detection of false positives [47,48,49,50]. Thus far, no such comparison has been performed with asymptomatic peanut tissue samples.
This study compared TSWV detection efficiency and/or accuracy in peanut leaf and root tissue samples from symptomatic and asymptomatic plants via DAS-ELISA, RT-PCR, and RT-qPCR. In addition, this study also used DAS-ELISA and RT-qPCR to quantitate TSWV loads in both tissue types from symptomatic and asymptomatic plants to assess if root tissue is a better TSWV reservoir than leaf tissue.

2. Results

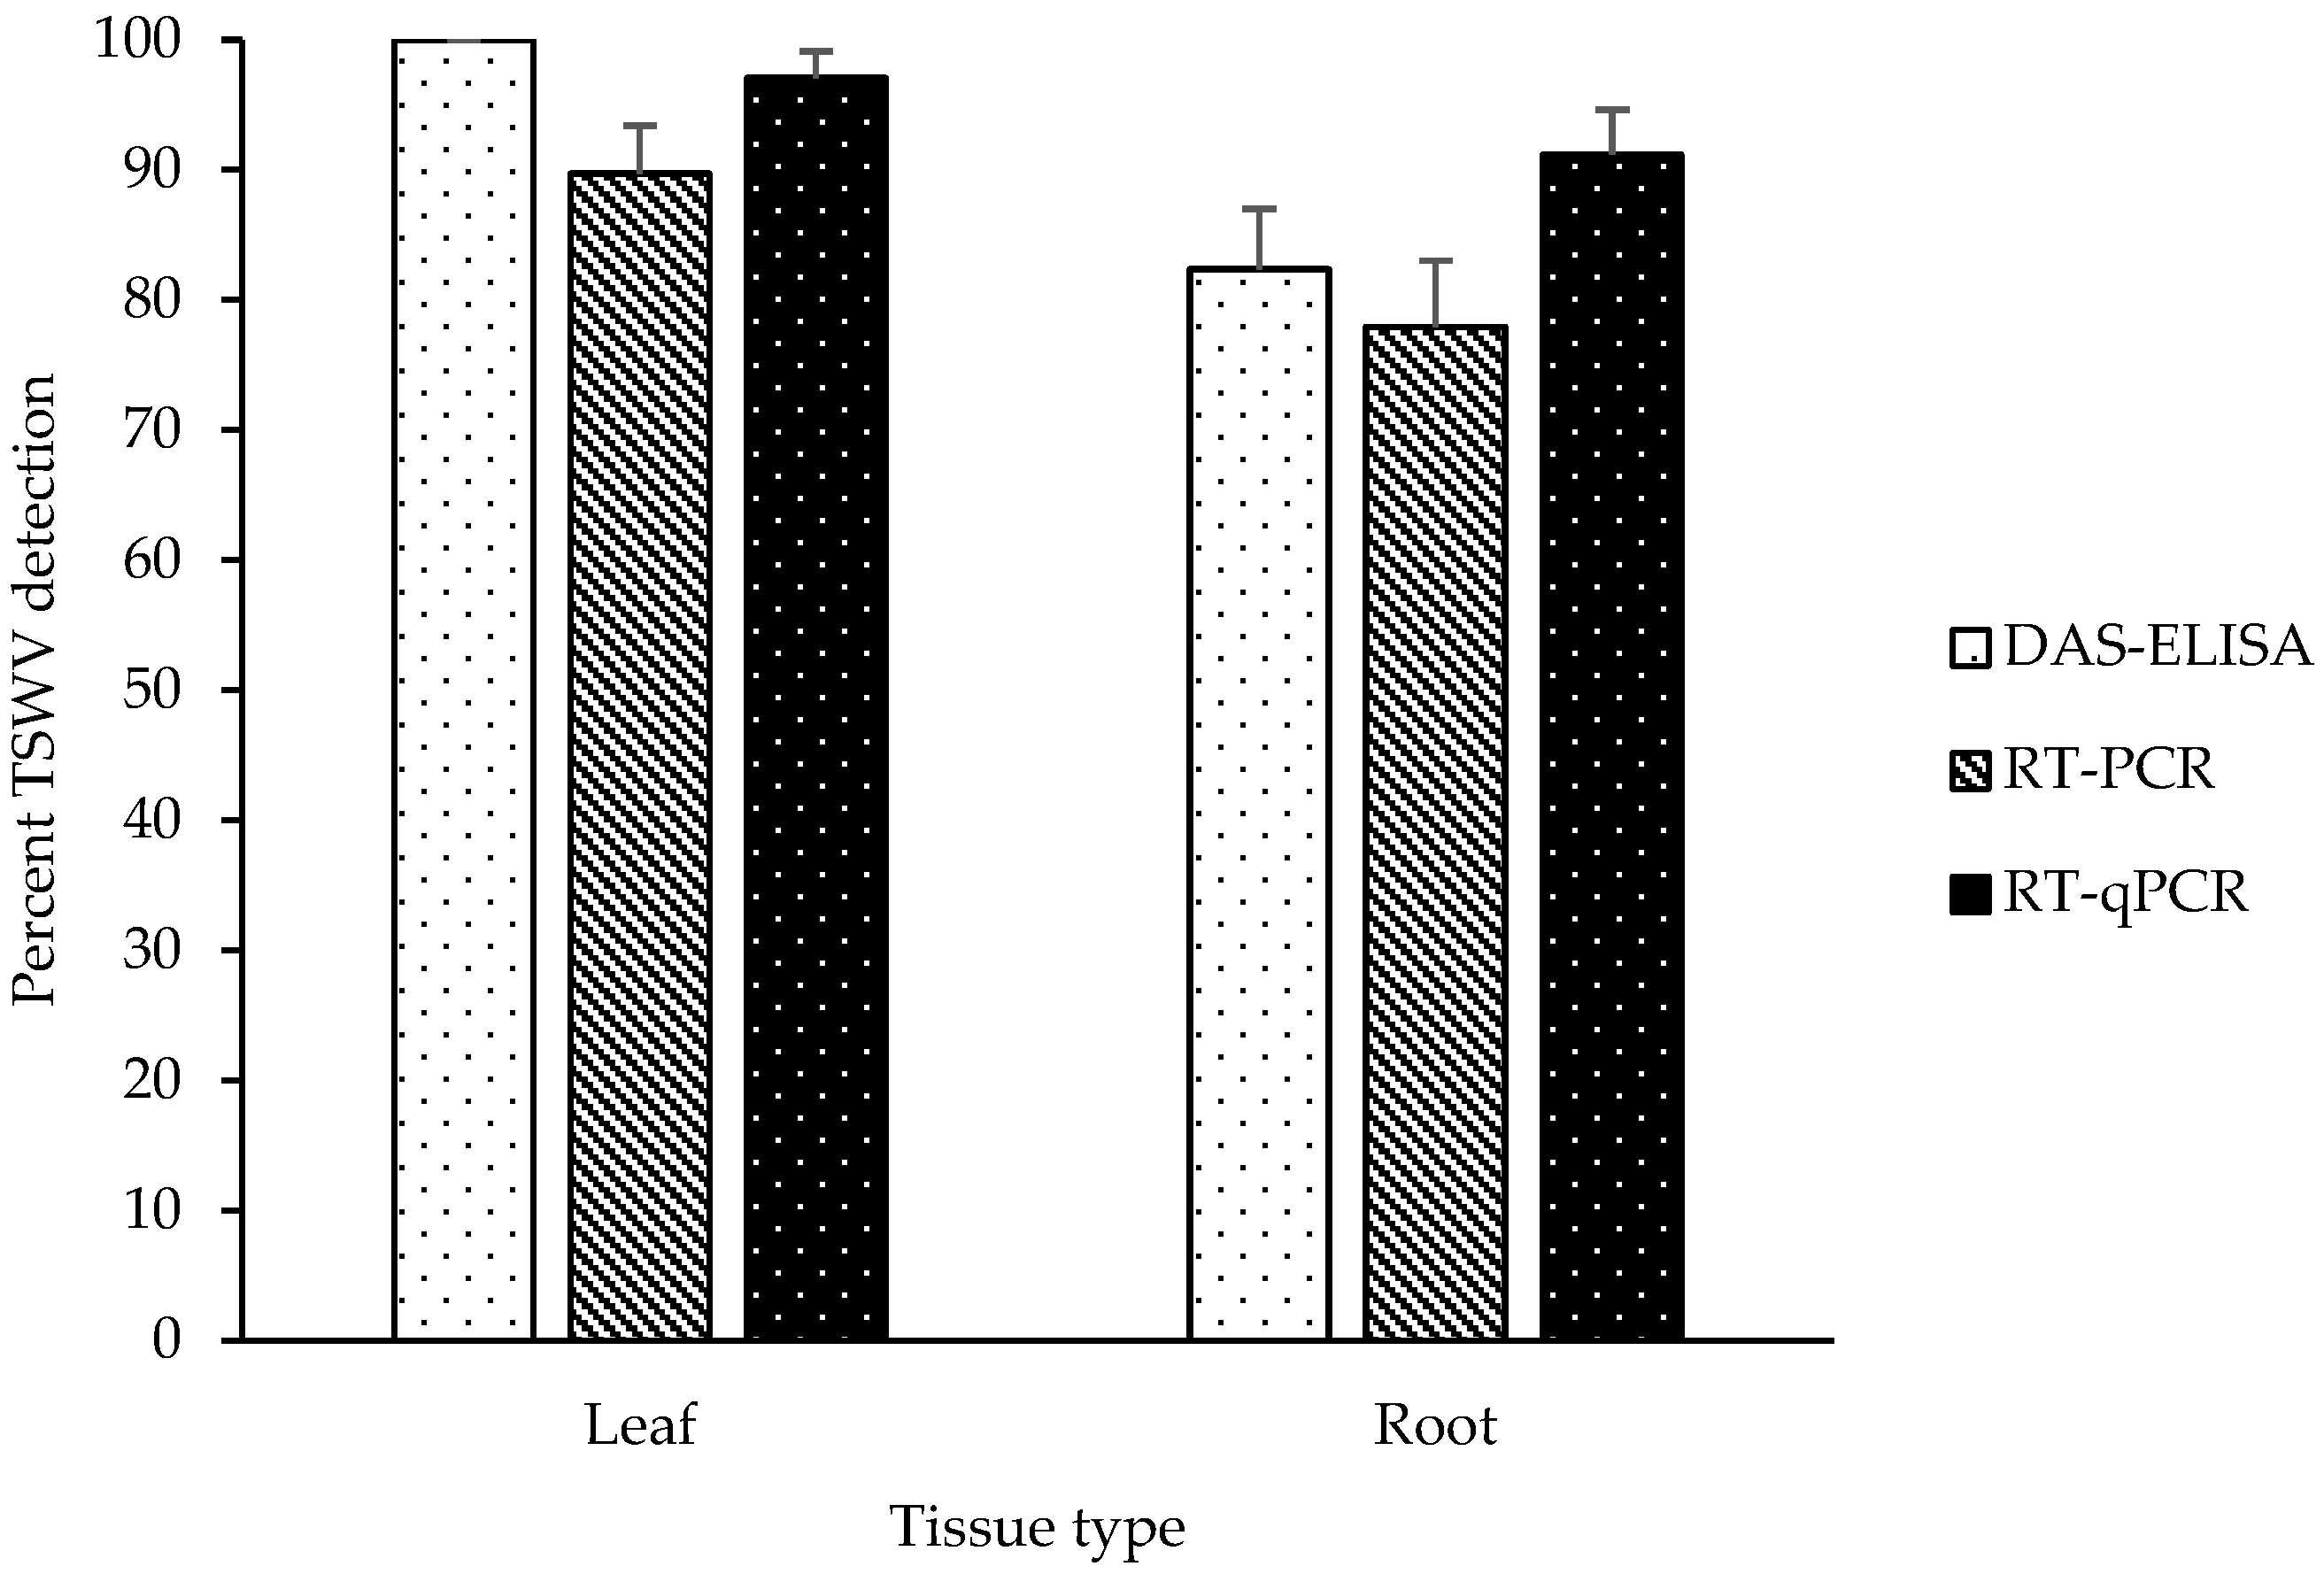
2.1. Detection of TSWV in Leaf and Root Tissues of Symptomatic Plants

TSWV detection in symptomatic leaf tissue samples was 100.00%, 89.71%, and 97.06% via DAS-ELISA, RT-PCR, and RT-qPCR, respectively (Figure 1). TSWV detection in root tissue samples from symptomatic plants by DAS-ELISA, RT-PCR, and RT-qPCR was 82.35%, 77.94%, and 91.18%, respectively (Figure 1). TSWV detection was significantly affected by detection method (F2,401 = 3.17, p = 0.0432) but did not vary by tissue type (F1,401 = 0, p = 0.9888), and the interaction (tissue type × detection method) effect was not significant (F2,401 = 0.03, p = 0.9701). The detection of TSWV in symptomatic plants was high for all three methods across tissue types.

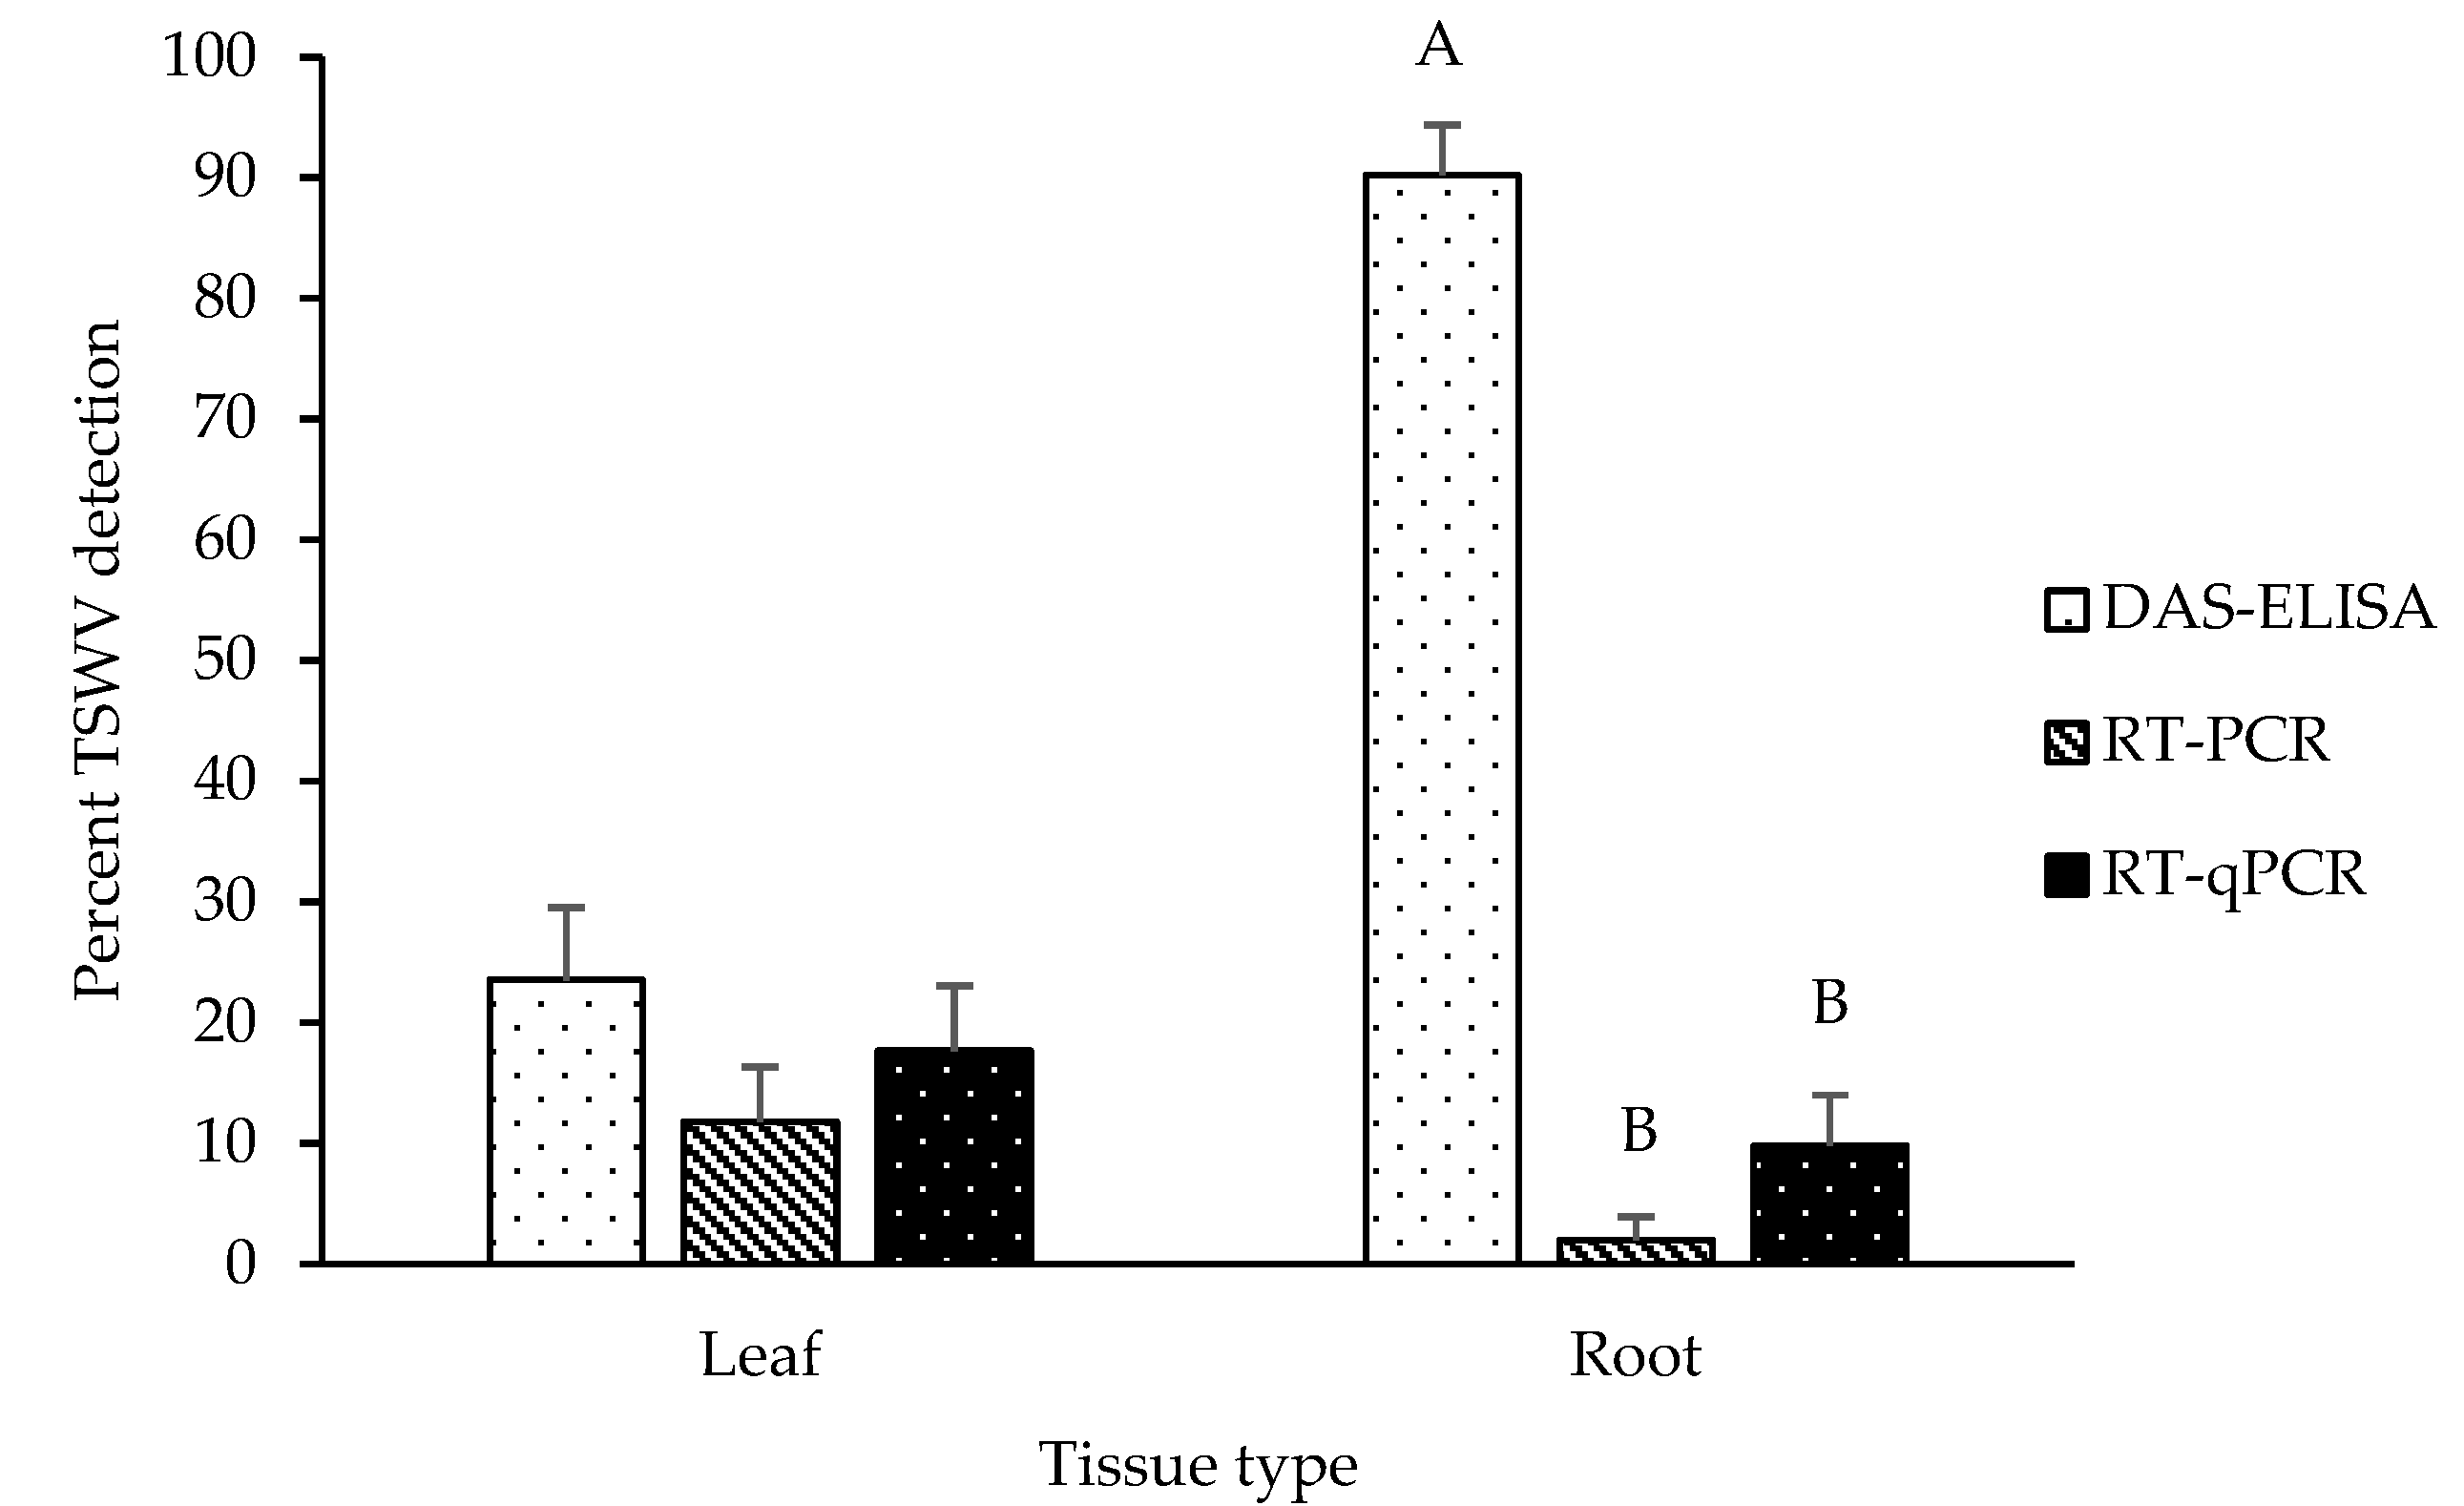
2.2. Detection of TSWV in Leaf and Root Tissues of Asymptomatic Plants

TSWV detection in leaf tissue samples from asymptomatic plants was 23.53%, 11.76%, and 17.65% by DAS-ELISA, RT-PCR, and RT-qPCR, respectively (Figure 2). Detection of TSWV in root tissue samples from asymptomatic plants was 90.20%, 1.96%, and 9.80% for DAS-ELISA, RT-PCR, and RT-qPCR, respectively (Figure 2). A significant interaction effect between detection method and tissue type on TSWV detection was found (F2,299 = 16.63, p < 0.0001). TSWV detection percentages for the three detection methods were compared within each tissue type. TSWV detection in leaf tissue from asymptomatic plants was not different among the three detection methods (F2,299 = 1.25, p = 0.2877) (Figure 2). However, percent detection of TSWV significantly varied by detection method in root tissue from asymptomatic plants (F2,299 = 24.64, p < 0.0001). TSWV detection by DAS-ELISA was significantly higher than RT-PCR and RT-qPCR (Figure 2). The mean percentage of TSWV detection via DAS-ELISA was 46 times higher than RT-PCR and nine times higher than RT-qPCR.

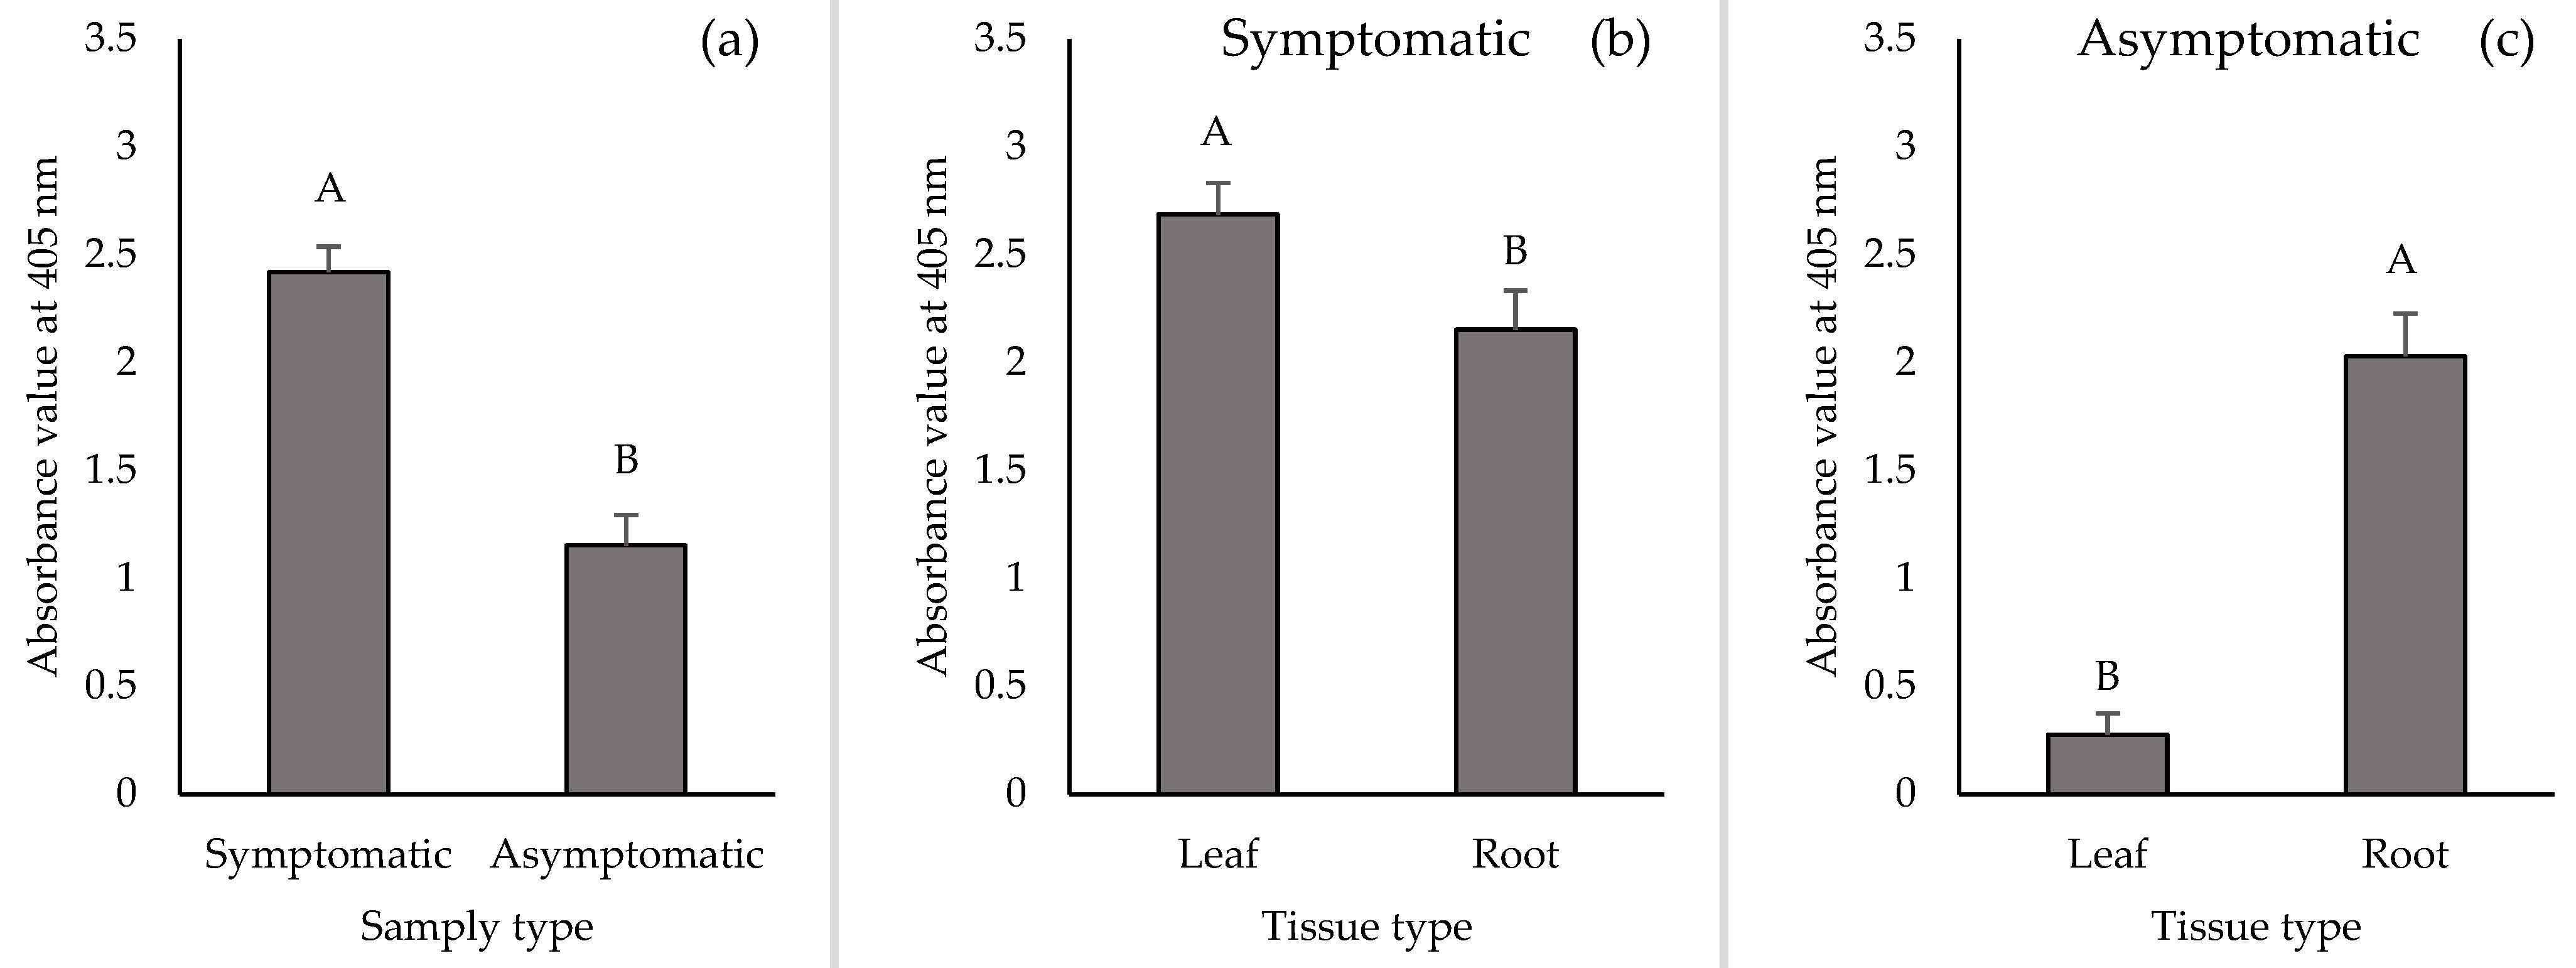
2.3. TSWV Accumulation in Leaf and Root Tissues of Symptomatic and Asymptomatic Plants by DAS-ELISA and RT-qPCR

TSWV loads in leaf and root tissue samples from symptomatic and asymptomatic plants were compared by DAS-ELISA and RT-qPCR. Overall, TSWV loads were higher in symptomatic than asymptomatic plant samples irrespective of tissue type based on absorbance values from DAS-ELISA (F1,233 = 58.78, p < 0.0001) (Figure 3a) and TSWV N-gene copies from RT-qPCR (F1,137 = 11.05, p = 0.0011) (Figure 3d). TSWV loads were significantly higher in leaf tissue samples than root tissue samples from symptomatic plants via DAS-ELISA (based on absorbance values) (F1,133 = 5.25, p = 0.0235) and numerically higher via RT-qPCR (Figure 3b, 3e). For asymptomatic plants, TSWV loads were more than seven times higher in root than leaf tissue samples based on absorbance values via DAS-ELISA (F1,99 = 62.48, p < 0.0001) (Figure 3c). However, TSWV N-gene copies in leaf and root tissue samples from asymptomatic plants were not different (Figure 3f).

3. Discussion

The evaluation of TSWV incidence in peanuts is commonly accomplished by visual assessments of typical TSWV-induced spotted wilt disease symptoms, such as yellowing, concentric ring spots, and stunting [1,9]. Foliar symptom-based screening can be confounded by biotic factors such as infection by other pathogens, arthropod infestation, TSWV resistance status, and timing of infection. For example, the infection of impatiens necrotic spot virus or peanut mottle virus can produce foliar symptoms akin to TSWV infection in peanuts [51,52,53]. Abiotic factors such as environmental conditions and chemical injury can also lead to foliar symptoms that resemble TSWV infection [54,55,56]. In such instances, it is useful to confirm TSWV infection with either a serology-based detection technique, such as DAS-ELISA, or a nucleic acid-based detection technique, such as RT-PCR. A few previous studies found that TSWV was more often detected by DAS-ELISA in peanut root samples than leaf tissue samples [16,21,25,27]. However, DAS-ELISA is prone to producing false positives when unstandardized tissue types are used, and it is unclear whether the high frequency of TSWV detection in root tissue samples reflected true TSWV incidence or was an overestimation due to false positives.
In this study, TSWV infection in leaf and root tissue samples from symptomatic and asymptomatic peanut plants was assessed by DAS-ELISA, RT-PCR, and RT-qPCR. TSWV accumulation in leaf and root tissue samples was also quantitated using RT-qPCR. The results from this study show that TSWV detection did not vary between leaf and root tissue samples or among the three detection methods in each tissue type from symptomatic plants. In addition, symptomatic leaf tissue samples had higher TSWV loads than root tissue samples from symptomatic plants. Dang et al. (2009) [22] also found congruency in TSWV detection between DAS-ELISA and RT-PCR while using peanut root tissue samples. However, it was not clear if the root tissue samples used for detection were collected from symptomatic and/or asymptomatic plants. Additionally, that study did not compare TSWV detection between root and leaf tissue samples.
In general, TSWV detection in asymptomatic leaf and/or root tissue samples was significantly lower than in symptomatic tissue samples. For asymptomatic plants, this study found similar percentages of detection between DAS-ELISA, RT-PCR, and RT-qPCR in leaf tissue samples, but the percentage of detection varied by method in root tissue samples. TSWV detection via DAS-ELISA was significantly higher than detection by RT-PCR and RT-qPCR in root tissue samples of asymptomatic plants. The inconsistency in TSWV detection between detection methods using root tissue samples from asymptomatic plants could, in part, be explained by two possible scenarios: either DAS-ELISA overestimated TSWV infection (false positives), or RT-PCR and RT-qPCR underestimated TSWV infection (false negatives). Low detection sensitivity of a detection assay could cause underestimation of TSWV infection. Sensitivity can be defined as the capability of the method/assay to reliably detect the lowest number of pathogen copies per test sample [57]. Generally, the sensitivity of nucleic acid-based detection assays with the use of gene-specific primers is higher than serology-based assays [39,57,58]. While the sensitivity of DAS-ELISA and RT-PCR has not been evaluated and compared specifically for TSWV detection in peanuts, such comparisons have been documented in other crops and pathosystems. The results from multiple studies indicate that the sensitivity of PCR can range from 2 to 625-fold higher than ELISA [59,60,61,62,63,64].
The reliability of ELISA can be affected by factors that lead to inaccurate detection results, even though ELISA is generally sensitive and specific with the use of monoclonal antibodies [37]. Well-recognized causes of inaccurate detection results include non-homogenous virus distribution in plants, interference of plant extracts, failure to detect certain virus serotypes, and cross-reactivity with other closely related viruses [50]. In addition, physiological and biochemical characteristics of the host plant and tissue type chosen for virus detection are important factors that are known to interfere with serological reactions in ELISA [47,48,49,65]. Non-specific antigen-antibody interaction due to the presence of plant proteins could lead to false positives in ELISA [62,66]. Detection of potato leafroll virus (PLRV) in potato tubers via DAS-ELISA resulted in a 70% overestimation of PLRV infection due to false positives [65]. Gunn and Pares (1988) [65] speculated that the false positives could have been caused by non-specific antibodies originating from co-purification of non-virus antigens (i.e., plant proteins) along with PLRV in the PLRV-specific antibody production process. While blocking reagents, such as ovalbumin, bovine serum albumin (BSA), and polyvinylpyrrolidone (PVP) are typically included in the commercial DAS-ELISA kits to reduce non-specific reactions, false positives could still arise from non-virus antigen-antibody interactions. Plant proteins such as pathogenesis-related proteins, lectins, and sesquiterpenoids are often present in virus-infected plants, and these plant-originated proteins could induce non-specific binding in ELISA [65,67,68]. For example, non-specific reactions in DAS-ELISA for cucumber mosaic virus detection in ornamental plants and wild weed species resulted in false positives [48,49]. Those studies demonstrated that components in plant extracts bound to microtiter plates and interacted with antibodies even under conditions that were unsuitable for antigen binding (i.e., the neutral pH and the presence of Tween) [48,49]. Plant roots are known to secrete chemical compounds, such as phenolics, terpenoids, and associated secondary metabolites, for defense against pathogenic microorganisms in soil [69]. In peanut root tissue, lectins are commonly present serving as defense proteins and are important for rhizobia agglutination in legume roots [70,71]. While such proteins could play a role in overestimating TSWV infection in peanuts, no empirical studies have been conducted to implicate their interference in DAS-ELISA-based detection.
Over- or underestimation of TSWV infection by DAS-ELISA could also be affected by the test threshold used. Threshold absorbance values to determine virus infection via DAS-ELISA have varied across studies ranging from two or three times the average absorbance value of negative controls (i.e., non-infected plant tissue) to the average absorbance value of negative controls plus three or four times the standard deviation [72]. It has been demonstrated that setting a more stringent detection threshold reduces false positives and increases false negatives. In one study where a range of threshold absorbance values was calculated using different methods, the lowest threshold value (0.040) resulted in 0.00% false negatives and 9.09% false positives, whereas the highest threshold values (0.131) resulted in 11.11% and 2.04% false negatives and false positives, respectively [72]. In this study, a high threshold value was selected using either a value of 0.1 or the mean of negative controls plus four standard deviations that were higher than 0.1. This stringent threshold value was used to help avoid false positives. In addition, both inarguably high and low absorbance values were obtained from root samples, with none of the values being ambiguous or close to the baseline threshold used in this study. If indeed DAS-ELISA was overestimating the TSWV infection in root tissue samples, it was likely due to non-specific antigen–antibody interactions rather than false positives related to threshold values.
Over- or underestimation of virus infection could also occur with nucleic acid-based detection assays. False-negative results commonly occur due to inhibitors interfering with the reaction by binding to DNA templates, interacting or competing with cofactor ions, and denaturing or degrading DNA polymerase [73]. Inhibitors are substances that are unintentionally extracted along with the nucleic acids of test samples; examples include phenolic compounds and heavy metals from the environment, cell debris, and residual reagents from the extraction procedure (e.g., phenol, EDTA, ethanol, and isopropanol) [47,74]. The housekeeping gene (alcohol dehydrogenase Class III) expression levels, assessed in terms of cycle threshold values, were lower with leaf tissue samples than root tissue samples suggesting that PCR inhibitors could be associated with root tissue samples (Table S1). Nevertheless, RT-PCR and RT-qPCR efficiently detected TSWV in root tissue samples from symptomatic plants using the same extraction method. Using column-based extraction can improve the purity of nucleic acid extracts; however, it can also increase the risk of losing nucleic acid extracts, which may lead to false negatives [47,75]. Loss of nucleic acids of the pathogen of interest can be especially problematic when the original quantity is relatively low, such as in asymptomatic plants. Asymptomatic plants generally accumulated less virus when compared with symptomatic plants [76,77]. This phenomenon was also observed in the current study, as TSWV loads were three times higher in symptomatic than asymptomatic tissue samples across tissue types.
According to the RT-qPCR results, TSWV loads were higher in leaf tissue samples than in root tissue samples of symptomatic plants, while TSWV loads were not significantly different between leaf and root tissue samples of asymptomatic plants. The results indicate that it should be easier to detect TSWV in leaf tissue samples than root tissue samples of symptomatic plants due to higher TSWV accumulation in leaf tissue. When detecting TSWV in asymptomatic plants, leaf tissue samples are a better choice than root tissue samples, especially when DAS-ELISA is used, due to the possibility of false positives with root tissue samples.
This study demonstrated that DAS-ELISA might not be suitable for TSWV detection in peanut root tissue samples and could potentially lead to overestimation of TSWV infection. Nevertheless, DAS-ELISA is a reliable TSWV detection assay for peanut leaf tissue samples and good for large-scale screening in symptomatic/asymptomatic plants if an appropriate tissue type is used. In fact, it is possible to overestimate TSWV incidence in root tissue samples on some occasions if DAS-ELISA is used, possibly due to non-specific plant antigen-TSWV antibody interactions. Conversely, there is potential for underestimating TSWV in root tissue samples using RT-qPCR if PCR inhibitors are present.

4. Materials and Methods

4.1. Sample Collection

Samples of leaf and root tissue from TSWV symptomatic and asymptomatic peanut plants were used for TSWV detection. Samples were collected from four peanut fields established at the University of Georgia research farms in Tifton and Attapulgus, GA, in 2018 and 2019. From symptomatic plants, peanut leaves with distinct spotted wilt symptoms at growing points (top 10–15 cm) were collected. Leaf tissue samples from asymptomatic plants were randomly collected at growing points. Sections (~10 cm) of the primary root (i.e., taproot) cut immediately below the crown of the plants from which leaf samples were collected were used for TSWV detection. Samples of leaf and root tissue were placed in resealable bags and transported to the laboratory with ice packs. Field-collected samples were stored at 4 °C for up to five days before being processed and tested by DAS-ELISA. Afterwards, field samples were stored at −80 °C and later tested by RT-PCR and RT-qPCR.
In 2018 and 2019, samples of leaf and root tissue from TSWV symptomatic plants and asymptomatic plants of cultivars Georgia-06G Georgia Green, Georgia-16HO, and TUFRunner 511 [78,79,80,81] were collected. Leaf and root tissue samples from symptomatic plants were collected from 35 to 91 days post-planting (DAP). Conversely, leaf and root tissue samples from asymptomatic plants were collected at ~140 DAP. Samples were collected from peanut fields at the Ponder Farm in Tifton, GA and from the UGA Research Station at Attapulgus, GA. All other sampling details are elaborated in Table S2.

4.2. Detection and Quantitation of TSWV in Leaf and Root Tissue Samples by DAS-ELISA

Samples of leaf and root tissue from symptomatic and asymptomatic plants were tested for the presence of TSWV using DAS-ELISA. TSWV loads in leaf and root tissue samples were quantitated by DAS-ELISA.
DAS-ELISA was performed in 96-well microtiter plates. A positive control (frozen, symptomatic leaf tissue of field-grown tobacco plants) and a negative control (leaf tissue of greenhouse-grown, non-infected peanut plants) with two replications each were included in each plate along with test samples. For both leaf and root tissue samples, approximately 0.03 g of tissue samples were ground in 300 µL of sample extraction buffer. Primary (anti-TSWV IgG) and secondary (anti-TSWV IgG conjugated with alkaline phosphatase) antibodies were used at a 1:200 dilution ratio (Agdia, Elkhart, IN, USA). The assay steps, including enzyme coating, incubation, and washing, were followed as per the manufacturer’s instructions. An hour after adding the substrate, final absorbance values were measured by a photometer at 405 nm (model Elx 800, Bio-Tek, Kocherwaldstr, Germany). Samples were considered positive when the final absorbance value was greater than the threshold value of the average absorbance value of negative control samples plus four standard deviations. To be more stringent, a value of 0.1 was adopted to define positive samples when the calculated threshold value was less than 0.1.

4.3. Detection and Quantitation of TSWV in Leaf and Root Tissue Samples by RT-PCR and RT-qPCR

Samples of leaf and root tissue from symptomatic and asymptomatic plants were tested for the presence of TSWV using RT-PCR and RT-qPCR. TSWV loads in leaf and root tissue samples were quantitated by RT-qPCR.
For RT-PCR and RT-qPCR, total RNA from leaf and root tissue samples was extracted using an RNeasy plant mini kit (Qiagen, Valencia, CA, USA) according to the protocol provided by the manufacturer. Approximately 0.1 g of leaf or root tissue samples was used for RNA extraction. The concentration and the purity of the total RNA extracts were measured using NanoDropTM 2000 spectrophotometer (Thermo Fisher Scientific, Waltham, MA, USA). Complementary DNA was synthesized using the total RNA extracts (normalized to 50 ng/µL) with a Go-Script reverse transcription system (Promega Corporation, Madison, WI, USA) following the manufacturer’s instructions. Oligo dT primers were used for cDNA synthesis, and cDNA from each sample was used as a template for RT-PCR and RT-qPCR. A TSWV positive leaf tissue sample collected from an infected peanut plant in Tifton, GA, USA, was used as a positive control, and a leaf tissue sample collected from a non-infected, greenhouse-grown peanut plant was used as a negative control.
PCR was performed in a DNA engine thermocycler (Bio-Rad Laboratories, Hercules, CA, USA). The reaction mix included 5 µL of GoTaq Green Master Mix (Promega, Madison, WI, USA), 0.5 µL (0.5 mM) of each forward and reverse primer specific to the TSWV-N gene (forward: 5′-ATGTCTAAGGTTAAGCTC-3′; reverse: 5′-TTAAGCAAGTTCTGTGAG-3′) [22], 1 µL of synthesized cDNA, and the total reaction volume was adjusted to 10 µL by adding nuclease-free water. The PCR program started with an initial activation step at 95 °C for 15 min, followed by 35 cycles of 94 °C for 1 min, 52 °C for 45 s, and 72 °C for 1 min with a final extension step at 72 °C for 10 min. The presence of the targeted amplicons (~800 bp) was visualized by agarose gel (1%) electrophoresis.
The cDNA from leaf and root tissue samples was used for TSWV quantitation. Quantitative PCR was performed in a Realplex Mastercycler (Eppendorf, Enfield, CT, USA). The reaction mixture consisted of 2 µL of synthesized cDNA, 12.5 µL of GoTaq qPCR 2X MasterMix (Promega, USA), 0.5 µL of each forward and reverse primers (0.2 mM), and the final volume was brought to 25 µL by adding nuclease-free water. A pair of TSWV-N gene-specific primers were used (forward: 5′-GCTTCCCACCCTTTGATTC-3′; reverse: 5′-ATAGCCAAGACAACACTGATC-3′) [44]. Each sample had two technical replicates, including test samples and positive and negative controls. The reaction program started with an initial step of 95 °C for 2 min, followed by 40 cycles of 95 °C for 15 s, 55 °C for 60 s, and 72 °C for 20 s. The reaction program was extended with a melting curve analysis, which involved incubating the reaction mix at 95 °C for 15 s, 60 °C for 15 s followed by increasing the temperature by 0.5 °C per min for 20 min with a final step of 95 °C for 15 s. Melting curve analysis was used to rule out the non-specific binding of primers. TSWV loads in the samples were quantitated using the standard curve protocol with plasmids carrying TSWV-N gene inserts described by Shrestha et al. (2013) [30].

4.4. Statistical Analyses

Whether TSWV detection varied by tissue type and/or detection method was determined for samples from both symptomatic and asymptomatic plants. Data from symptomatic and asymptomatic plants were analyzed separately. The experiment was a two-way factorial design. Data were subjected to generalized linear mixed model analysis using PROC GLIMMIX procedure with a binomial distribution and the logit link function in SAS (SAS Enterprise 9.4, SAS Institute, Cary, NC, USA). Tissue type and detection method were fixed effects, while year and replication were random effects. The least-square means were used to identify differences in TSWV detection at α = 0.05 significance level with Tukey–Kramer adjustment.
TSWV loads were compared between symptomatic and asymptomatic plants using absorbance values from DAS-ELISA and TSWV N-gene copies from RT-qPCR. Data were pooled across years and tissue types for comparison between symptomatic and asymptomatic plants and subjected to generalized linear mixed model analysis using PROC GLIMMIX procedure in SAS. The tissue type served as a fixed effect, while year and replication served as random effects. A normal distribution with the identity link function was used for absorbance values, while a negative binomial distribution with the log link function was used for TSWV N-gene copies. The least-square means were used to identify differences in TSWV loads between treatments at α = 0.05 significance level with Tukey–Kramer adjustment.

Supplementary Materials

The following are available online at https://www.mdpi.com/article/10.3390/pathogens10111476/s1, Table S1: Housekeeping gene (alcohol dehydrogenase class III) expression levels in root and leaf tissue samples from asymptomatic plants, Table S2: Summary of samples tested by DAS-ELISA, RT-PCR, and RT-qPCR for TSWV.

Author Contributions

Conceptualization, R.S. and M.R.A.; methodology, R.S.; validation, R.S.; formal analysis, P.-C.L.; investigation, P.-C.L. and Y.-J.C.; resources, R.S.; data curation, P.-C.L.; writing—original draft preparation, P.-C.L.; writing—review and editing, R.S., M.R.A., S.B., and P.-C.L.; supervision, R.S.; project administration, R.S.; funding acquisition, R.S. and M.R.A. All authors have read and agreed to the published version of the manuscript.

Funding

This research was funded by the Georgia Peanut Commission, The National Peanut Board, USDA Hatch Project GEO 00671, and USDA National Institute of Food and Agriculture, Crop Protection and Pest Management, grant no. 11683809/project accession no. 1004356.

Institutional Review Board Statement

Not applicable.

Informed Consent Statement

Not applicable.

Data Availability Statement

Not applicable.

Acknowledgments

The authors thank Simmy McKeown, Kent Hill, Sasha Kay, and Gabrielle LaTora for their technical assistance.

Conflicts of Interest

The authors declare no conflict of interest.

References

  1. Culbreath, A.K.; Todd, J.W.; Brown, S.L. Epidemiology and Management of Tomato Spotted Wilt in Peanut. Annu. Rev. Phytopathol. 2003, 41, 53–75. [Google Scholar] [CrossRef] [PubMed] [Green Version]
  2. Riley, D.G.; Joseph, S.V.; Srinivasan, R.; Diffie, S. Thrips Vectors of Tospoviruses. J. Integr. Pest Manag. 2011, 1, 1–10. [Google Scholar] [CrossRef]
  3. Rotenberg, D.; Jacobson, A.L.; Schneweis, D.J.; Whitfield, A.E. Thrips Transmission of Tospoviruses. Curr. Opin. Virol. 2015, 15, 80–89. [Google Scholar] [CrossRef]
  4. Parrella, G.; Gognalons, P.; Gebre-Selassiè, K.; Vovlas, C.; Marchoux, G. An update of the host range of tomato spotted wilt virus. J. Plant Pathol. 2003, 85, 227–264. Available online: http://www.jstor.org/stable/41998156 (accessed on 28 October 2021).
  5. Black, M.C.; Lummus, P.F.; Smith, D.H.; Demski, J.W. An Epidemic of Spotted Wilt Disease in South Texas Peanuts in 1985. Proc. Am. Peanut Res. Ed. Soc. 1986, 18, 66. [Google Scholar]
  6. Culbreath, A.K.; Todd, J.W.; Demski, J.W.; Chamberlin, J.R. Disease Progress of Spotted Wilt in Peanut Cultivars Florunner and Southern Runner. Phytopathology 1992, 82, 766–771. [Google Scholar] [CrossRef]
  7. Garcia, L.E.; Brandenburg, R.L.; Bailey, J.E. Incidence of Tomato Spotted Wilt Virus (Bunyaviridae) and Tobacco Thrips in Virginia-Type Peanuts in North Carolina. Plant Dis. 2000, 84, 459–464. [Google Scholar] [CrossRef] [PubMed]
  8. Hagan, A.K.; Weeks, J.R.; French, J.C.; Gudauskas, R.T.; Mullen, J.M.; Gazaway, W.S.; Shelby, R. Tomato Spotted Wilt Virus in Peanut in Alabama. Plant Dis. 1990, 74, 615. [Google Scholar] [CrossRef]
  9. Halliwell, R.S.; Philley, G. Spotted Wilt of Peanut in Texas. Plant Dis. Rep. 1974, 58, 23–25. [Google Scholar]
  10. Reed, J.T.; Sukamto, S. Thrips and Tomato Spotted Wilt Virus in a Mississippi Peanut Field. In Thrips Biology and Management; Parker, B.L., Skinner, M., Lewis, T., Eds.; Springer: Boston, MA, USA, 1995; pp. 171–173. [Google Scholar] [CrossRef]
  11. Little, E.L. 2018 Georgia Plant Disease Loss Estimates. 2020. Available online: https://extension.uga.edu/publications/detail.html?number=AP102-11 (accessed on 13 August 2021).
  12. Little, E.L. 2017 Georgia Plant Disease Loss Estimates. 2019. Available online: https://extension.uga.edu/publications/detail.html?number=AP102-10 (accessed on 13 August 2021).
  13. Little, E.L. 2016 Georgia Plant Disease Loss Estimates. 2019. Available online: https://extension.uga.edu/publications/detail.html?number=AP102-9 (accessed on 13 August 2021).
  14. Little, E.L. 2015 Georgia Plant Disease Loss Estimates. Athens, GA. 2017. Available online: https://extension.uga.edu/publications/detail.html?number=AP102-8 (accessed on 13 August 2021).
  15. USDA-NASS Crop Production 2019 Summary. 2020. Available online: https://www.nass.usda.gov/Publications/Todays_Reports/reports/cropan20.pdf (accessed on 13 August 2021).
  16. Culbreath, A.K.; Todd, J.W.; Demski, J.W. Comparison of Hidden and Apparent Spotted Wilt Epidemics in Peanut. Proc. Am. Peanut Res. Ed. Soc. 1992, 24, 39. [Google Scholar]
  17. Culbreath, A.K.; Todd, J.W.; Demski, J.W. Productivity of Florunner Peanut Infected with Tomato Spotted Wilt Virus. Peanut Sci. 1992, 19, 11–14. [Google Scholar] [CrossRef]
  18. Cantonwine, E.G.; Culbreath, A.K.; Stevenson, K.L.; Kemerait, R.C.; Brenneman, T.B.; Smith, N.B.; Mullinix, B.G., Jr. Integrated Disease Management of Leaf Spot and Spotted Wilt of Peanut. Plant Dis. 2006, 90, 493–500. [Google Scholar] [CrossRef] [Green Version]
  19. Culbreath, A.K.; Tillman, B.L.; Tubbs, R.S.; Beasley, J.P.; Kemerait, R.C.; Brenneman, T.B. Interactive Effects of Planting Date and Cultivar on Tomato Spotted Wilt of Peanut. Plant Dis. 2010, 94, 898–904. [Google Scholar] [CrossRef]
  20. Wells, M.L.; Culbreath, A.K.; Todd, J.W.; Brown, S.L.; Gorbet, D.W. A Regression Approach for Comparing Field Resistance of Peanut Cultivars to Tomato Spotted Wilt Tospovirus. Crop Prot. 2002, 21, 467–474. [Google Scholar] [CrossRef]
  21. Culbreath, A.K.; Csinos, A.S.; Brenneman, T.B.; Demski, J.W.; Todd, J.W. Association of Tomato Spotted Wilt Virus with Foliar Chlorosis of Peanut in Georgia. Plant Dis. 1991, 75, 863C. [Google Scholar] [CrossRef]
  22. Dang, P.M.; Rowland, D.L.; Faircloth, W.H. Comparison of ELISA and RT-PCR Assays for the Detection of Tomato Spotted Wilt Virus in Peanut. Peanut Sci. 2009, 36, 133–137. [Google Scholar] [CrossRef] [Green Version]
  23. Jain, R.K.; Pappu, S.S.; Pappu, H.R.; Culbreath, A.K.; Todd, J.W. Molecular Diagnosis of Tomato Spotted Wilt Tospovirus Infection of Peanut and Other Field and Greenhouse Crops. Plant Dis. 1998, 82, 900–904. [Google Scholar] [CrossRef]
  24. Kresta, K.K.; Mitchell, F.L.; Smith, J.W. Survey by ELISA of Thrips (Thysanoptera: Thripidae) Vectored Tomato Spotted Wilt Virus Distribution in Foliage and Flowers of Field-Infected Peanut. Peanut Sci. 1995, 22, 141–149. [Google Scholar] [CrossRef]
  25. Murakami, M.; Gallo-Meagher, M.; Gorbet, D.W.; Meagher, R.L. Utilizing Immunoassays to Determine Systemic Tomato Spotted Wilt Virus Infection for Elucidating Field Resistance in Peanut. Crop Prot. 2006, 25, 235–243. [Google Scholar] [CrossRef]
  26. Pappu, S.S.; Pappu, H.R.; Culbreath, A.K.; Todd, J.W. Localization of Tomato Spotted Wilt Virus (Genus Tospovirus, Family Bunyaviridae) in Peanut Pods. Peanut Sci. 1999, 26, 98–100. [Google Scholar] [CrossRef]
  27. Rowland, D.; Dorner, J.; Sorensen, R.; Beasley, J.P.; Todd, J. Tomato Spotted Wilt Virus in Peanut Tissue Types and Physiological Effects Related to Disease Incidence and Severity. Plant Pathol. 2005, 54, 431–440. [Google Scholar] [CrossRef]
  28. Wang, M.L.; Pinnow, D.L.; Pittman, R.N. Preliminary Screening of Peanut Germplasm in the US Collection for TSWV Resistance and High Flavonoid Content. Plant Pathol. J. 2007, 6, 219–226. [Google Scholar] [CrossRef]
  29. Shrestha, A.; Sundaraj, S.; Culbreath, A.K.; Riley, D.G.; Abney, M.R.; Srinivasan, R. Effects of Thrips Density, Mode of Inoculation, and Plant Age on Tomato Spotted Wilt Virus Transmission in Peanut Plants. Environ. Entomol. 2015, 44, 136–143. [Google Scholar] [CrossRef] [PubMed]
  30. Shrestha, A.; Srinivasan, R.; Sundaraj, S.; Culbreath, A.K.; Riley, D.G. Second Generation Peanut Genotypes Resistant to Thrips-Transmitted Tomato Spotted Wilt Virus Exhibit Tolerance Rather than True Resistance and Differentially Affect Thrips Fitness. J. Econ. Entomol. 2013, 106, 587–596. [Google Scholar] [CrossRef] [PubMed] [Green Version]
  31. Sundaraj, S.; Srinivasan, R.; Culbreath, A.K.; Riley, D.G.; Pappu, H.R. Host Plant Resistance against Tomato Spotted Wilt Virus in Peanut (Arachis hypogaea) and Its Impact on Susceptibility to the Virus, Virus Population Genetics, and Vector Feeding Behavior and Survival. Phytopathology 2014, 104, 202–210. [Google Scholar] [CrossRef] [PubMed] [Green Version]
  32. Culbreath, A.K.; Tubbs, R.S.; Tillman, B.L.; Beasley, J.P.; Branch, W.D.; Holbrook, C.C.; Smith, A.R.; Smith, N.B. Effects of Seeding Rate and Cultivar on Tomato Spotted Wilt of Peanut. Crop Prot. 2013, 53, 118–124. [Google Scholar] [CrossRef]
  33. Culbreath, A.K.; Tillman, B.L.; Gorbet, D.W.; Holbrook, C.C.; Nischwitz, C. Response of New Field-Resistant Peanut Cultivars to Twin-Row Pattern or in-Furrow Applications of Phorate for Management of Spotted Wilt. Plant Dis. 2008, 92, 1307–1312. [Google Scholar] [CrossRef] [Green Version]
  34. Culbreath, A.K.; Todd, J.W.; Gorbet, D.W.; Brown, S.L.; Baldwin, J.; Pappu, H.R.; Shokes, F.M. Reaction of Peanut Cultivars to Spotted Wilt. Peanut Sci. 2000, 27, 35–39. [Google Scholar] [CrossRef]
  35. Clark, M.F.; Adams, A.N. Characteristics of the Microplate Method of Enzyme-linked Immunosorbent Assay for the Detection of Plant Viruses. J. Gen. Virol. 1977, 34, 475–483. [Google Scholar] [CrossRef]
  36. Sherwood, J.L.; Sanborn, M.R.; Keyser, G.C.; Myers, L.D. Use of Monoclonal Antibodies in Detection of Tomato Spotted Wilt Virus. Phytopathology 1989, 79, 61–64. [Google Scholar] [CrossRef]
  37. Boonham, N.; Kreuze, J.; Winter, S.; van der Vlugt, R.; Bergervoet, J.; Tomlinson, J.; Mumford, R. Methods in Virus Diagnostics: From ELISA to Next Generation Sequencing. Virus Res. 2014, 186, 20–31. [Google Scholar] [CrossRef] [PubMed]
  38. Torrance, L.; Jones, R.A.C. Recent Developments in Serological Methods Suited for Use in Routine Testing for Plant Viruses. Plant Pathol. 1981, 30, 1–24. [Google Scholar] [CrossRef]
  39. Ward, E.; Foster, S.J.; Fraaije, B.A.; McCartney, H.A. Plant Pathogen Diagnostics: Immunological and Nucleic Acid-Based Approaches. Ann. Appl. Biol. 2004, 145, 1–16. [Google Scholar] [CrossRef]
  40. Schochetman, G.; Ou, C.-Y.; Jones, W.K. Polymerase Chain Reaction. J. Infect. Dis. 1988, 158, 1154–1157. Available online: https://www.jstor.org/stable/30137034 (accessed on 13 August 2021). [CrossRef] [Green Version]
  41. Putnam, M.L. Evaluation of Selected Methods of Plant Disease Diagnosis. Crop Prot. 1995, 14, 517–525. [Google Scholar] [CrossRef]
  42. Mackay, I.M.; Arden, K.E.; Nitsche, A. Real-Time PCR in Virology. Nucleic Acids Res. 2002, 30, 1292–1305. [Google Scholar] [CrossRef] [Green Version]
  43. Boonham, N.; Smith, P.; Walsh, K.; Tame, J.; Morris, J.; Spence, N.; Bennison, J.; Barker, I. The Detection of Tomato Spotted Wilt Virus (TSWV) in Individual Thrips Using Real Time Fluorescent RT-PCR (TaqMan). J. Virol. Methods 2002, 101, 37–48. [Google Scholar] [CrossRef]
  44. Rotenberg, D.; Kumar, N.K.K.; Ullman, D.E.; Montero-Astúa, M.; Willis, D.K.; German, T.L.; Whitfield, A.E. Variation in Tomato Spotted Wilt Virus Titer in Frankliniella occidentalis and Its Association with Frequency of Transmission. Phytopathology 2009, 99, 404–410. [Google Scholar] [CrossRef] [Green Version]
  45. Culbreath, A.K.; Srinivasan, R. Epidemiology of Spotted Wilt Disease of Peanut Caused by Tomato Spotted Wilt Virus in the Southeastern U.S. Virus Res. 2011, 159, 101–109. [Google Scholar] [CrossRef] [PubMed]
  46. Lyerly, J.H.; Stalker, H.T.; Moyer, J.W.; Hoffman, K. Evaluation of Arachis Species for Resistance to Tomato Spotted Wilt Virus. Peanut Sci. 2002, 29, 79–84. [Google Scholar] [CrossRef]
  47. Lacroix, C.; Renner, K.; Cole, E.; Seabloom, E.W.; Borer, E.T.; Malmstrom, C.M. Methodological Guidelines for Accurate Detection of Viruses in Wild Plant Species. Appl. Environ. Microbiol. 2016, 82, 1966–1975. [Google Scholar] [CrossRef] [PubMed] [Green Version]
  48. Mahmoud, S.Y.M. Detection of Cucumber Mosaic Virus in Some Ornamental Plants and Elimination of Nonspecific ELISA Reactions. Arch. Phytopathol. Plant Prot. 2011, 44, 1410–1424. [Google Scholar] [CrossRef]
  49. Sikora, E.J.; Andrianifahanana, M.; Murphy, J.F. Detection of Cucumber Mosaic Cucumovirus in Weed Species: A Cautionary Report on Nonspecific Reactions in ELISA. Can. J. Plant Pathol. 1999, 21, 338–344. [Google Scholar] [CrossRef]
  50. Van Schadewijk, A.R.; Meekes, E.T.M.; Verbeek, M.; Verhoeven, J.T.J. Validation of Plant Virus Detection. Acta Hortic. 2011, 901, 81–86. [Google Scholar] [CrossRef] [Green Version]
  51. Hoffmann, K.; Geske, S.M.; Moyer, J.W. Pathogenesis of Tomato Spotted Wilt Virus in Peanut Plants Dually Infected with Peanut Mottle Virus. Plant Dis. 1998, 82, 610–614. [Google Scholar] [CrossRef]
  52. Pappu, S.S.; Black, M.C.; Pappu, H.R.; Brenneman, T.B.; Culbreath, A.K.; Todd, J.W. First Report of Natural Infection of Peanut (Groundnut) by Impatiens Necrotic Spot Tospovirus (Family Bunyaviridae). Plant Dis. 1999, 83, 966. [Google Scholar] [CrossRef]
  53. Sreenivasulu, P.; Demski, J.W.; Reddy, D.V.R.; Misari, S.M.; Olorunju, P.E.; Kuhn, C.W. Tomato Spotted Wilt Virus (TSWV) and Strains of Peanut Mottle Virus That Mimic TSWV Symptoms in Peanut in Georgia. Plant Dis. 1988, 72, 546. [Google Scholar] [CrossRef]
  54. Brecke, B.J.; Funderburk, J.E.; Teare, I.D.; Gorbet, D.W. Interaction of Early-Season Herbicide Injury, Tobacco Thrips Injury, and Cultivar on Peanut. Agron. J. 1996, 88, 14–18. [Google Scholar] [CrossRef]
  55. Mandal, B.; Pappu, H.R.; Culbreath, A.K.; Holbrook, C.C.; Gorbet, D.W.; Todd, J.W. Differential Response of Selected Peanut (Arachis hypogaea) Genotypes to Mechanical Inoculation by Tomato Spotted Wilt Virus. Plant Dis. 2002, 86, 939–944. [Google Scholar] [CrossRef] [Green Version]
  56. Morichetti, S.; Ferrell, J.; Devotka, P. Diagnosing Herbicide Injury in Peanut. EDIS 2010, 4. Available online: https://journals.flvc.org/edis/article/view/118669 (accessed on 13 August 2021).
  57. López, M.M.; Bertolini, E.; Olmos, A.; Caruso, P.; Gorris, M.T.; Llop, P.; Penyalver, R.; Cambra, M. Innovative Tools for Detection of Plant Pathogenic Viruses and Bacteria. Int. Microbiol. 2003, 6, 233–243. [Google Scholar] [CrossRef]
  58. Schaad, N.W.; Frederick, R.D.; Shaw, J.; Schneider, W.L.; Hickson, R.; Petrillo, M.D.; Luster, D.G. Advances in Molecular-Based Diagnostics in Meeting Crop Biosecurity and Phytosanitary Issues. Annu. Rev. Phytopathol. 2003, 41, 305–324. [Google Scholar] [CrossRef] [Green Version]
  59. Adams, A.N.; Guise, C.M.; Crossley, S.J. Plum Pox Virus Detection in Dormant Plum Trees by PCR and ELISA. Plant Pathol. 1999, 48, 240–244. [Google Scholar] [CrossRef]
  60. Hu, J.S.; Li, H.P.; Barry, K.; Wang, M.; Jordan, R. Comparison of Dot Blot, ELISA, and RT-PCR Assays for Detection of Two Cucumber Mosaic Virus Isolates Infecting Banana in Hawaii. Plant Dis. 1995, 79, 902–906. [Google Scholar] [CrossRef]
  61. Mekuria, G.; Ramesh, S.A.; Alberts, E.; Bertozzi, T.; Wirthensohn, M.; Collins, G.; Sedgley, M. Comparison of ELISA and RT-PCR for the Detection of Prunus Necrotic Ring Spot Virus and Prune Dwarf Virus in Almond (Prunus dulcis). J. Virol. Methods 2003, 114, 65–69. [Google Scholar] [CrossRef]
  62. Mumford, R.A.; Barker, I.; Wood, K.R. The Detection of Tomato Spotted Wilt Virus Using the Polymerase Chain Reaction. J. Virol. Methods 1994, 46, 303–311. [Google Scholar] [CrossRef]
  63. Sanchez-Navarro, J.A.; Aparicio, F.; Rowhani, A.; Pallás, V. Comparative Analysis of ELISA, Nonradioactive Molecular Hybridization and PCR for the Detection of Prunus Necrotic Ringspot Virus in Herbaceous and Prunus Hosts. Plant Pathol. 1998, 47, 780–786. [Google Scholar] [CrossRef]
  64. Webster, C.G.; Turechek, W.W.; Li, W.; Kousik, C.S.; Adkins, S. Development and Evaluation of ELISA and QRT-PCR for Identification of Squash Vein Yellowing Virus in Cucurbits. Plant Dis. 2017, 101, 178–185. [Google Scholar] [CrossRef] [PubMed]
  65. Gunn, L.V.; Pares, R.D. Effect of Potato Physiology on the Interpretation of ELISA Results for Potato Leafroll Virus. Plant Pathol. 1988, 37, 516–521. [Google Scholar] [CrossRef]
  66. Naidu, R.A.; Hughes, J.D.A. Methods for the Detection of Plant Virus Diseases. In Proceedings of the Plant Virology in sub-Saharan Africa: Proceedings of a Conference Organized by IITA, Ibadan, Nigeria, 4–8 June 2001; pp. 233–260. [Google Scholar]
  67. Etzler, M.E. Plant Lectins: Molecular and Biological Aspects. Ann. Rev. Plant Physiol. 1985, 36, 209–234. [Google Scholar] [CrossRef]
  68. Redolfi, P. Occurrence of Pathogenesis-Related (b) and Similar Proteins in Different Plant Species. Neth. J. Plant Pathol. 1983, 89, 245–254. [Google Scholar] [CrossRef]
  69. Baetz, U.; Martinoia, E. Root Exudates: The Hidden Part of Plant Defense. Trends Plant Sci. 2014, 19, 90–98. [Google Scholar] [CrossRef] [PubMed] [Green Version]
  70. Kijne, J.W.; Bauchrowitz, M.A.; Diaz, C.L. Root Lectins and Rhizobia. Plant Physiol. 1997, 115, 869–873. [Google Scholar] [CrossRef] [Green Version]
  71. Peumans, W.J.; Van Damme, E.J.M. Lectins as Plant Defense Proteins. Plant Physiol. 1995, 109, 347–352. [Google Scholar] [CrossRef] [PubMed]
  72. Sutula, C.L.; Gillett, J.M.; Morrissey, S.M.; Ramsdell, D.C. Interpreting ELISA Data and Establishing the Positive-Negative Threshold. Plant Dis. 1986, 70, 722. [Google Scholar] [CrossRef]
  73. Rådström, P.; Löfström, C.; Lövenklev, M.; Knutsson, R.; Wolffs, P. Strategies for Overcoming PCR Inhibition. Cold Spring Harb. Protoc. 2008, 3, 1–10. [Google Scholar] [CrossRef]
  74. Wilson, I.G. Inhibition and Facilitation of Nucleic Acid Amplification. Appl. Environ. Microbiol. 1997, 63, 3741–3751. [Google Scholar] [CrossRef] [Green Version]
  75. Rådström, P.; Knutsson, R.; Wolffs, P.; Lövenklev, M.; Löfström, C. Pre-PCR Processing: Strategies to Generate PCR-Compatible Samples. Mol. Biotechnol. 2004, 26, 133–146. [Google Scholar] [CrossRef]
  76. Schaad, N.W.; Frederick, R.D. Real-Time PCR and Its Application for Rapid Plant Disease Diagnostics. Can. J. Plant Pathol. 2002, 24, 250–258. [Google Scholar] [CrossRef]
  77. Zhu, Y.J.; Lim, S.T.S.; Schenck, S.; Arcinas, A.; Komor, E. RT-PCR and Quantitative Real-Time RT-PCR Detection of Sugarcane Yellow Leaf Virus (SCYLV) in Symptomatic and Asymptomatic Plants of Hawaiian Sugarcane Cultivars and the Correlation of SCYLV Titre to Yield. Eur. J. Plant Pathol. 2010, 127, 263–273. [Google Scholar] [CrossRef]
  78. Branch, W.D. Registration of ‘Georgia-16HO’ Peanut. J. Plant Regist. 2017, 11, 231–234. [Google Scholar] [CrossRef]
  79. Branch, W.D. Registration of ‘Georgia-06G’ Peanut. J. Plant Regist. 2007, 1, 120. [Google Scholar] [CrossRef]
  80. Branch, W.D. Registration of ‘Georgia Green’ Peanut. Crop Sci. 1996, 36, 806. [Google Scholar] [CrossRef]
  81. Tillman, B.L.; Gorbet, D.W. Registration of ‘TUFRunner “511”’ Peanut. J. Plant Regist. 2017, 11, 235–239. [Google Scholar] [CrossRef]
Figure 1. Mean percentage (±SE) of TSWV infection ascertained via DAS-ELISA, RT-PCR, and RT-qPCR in leaf and root tissue samples (n = 68 for each tissue type). Data were pooled across 2018 and 2019. TSWV symptomatic leaves at the growing points and the primary root of the same plants were sampled for TSWV detection.
Pathogens 10 01476 g001
Figure 2. Mean percentages (±SE) of TSWV infection ascertained via DAS-ELISA, RT-PCR, and RT-qPCR in leaf and root tissue of asymptomatic peanut plants (n = 51 for each tissue type). Data were pooled across 2018 and 2019. Leaf at the growing points and the primary root of the same plants were sampled for TSWV detection.
Pathogens 10 01476 g002
Figure 3. TSWV accumulation indicated by mean absorbance values at 405 nm from DAS-ELISA in (a) symptomatic (n = 136) and asymptomatic plants (n = 102) across tissue types and in leaf and root tissue samples from (b) symptomatic plants (n = 68 for each tissue type) and (c) asymptomatic plants (n = 51 for each tissue type). TSWV accumulation was also measured by RT-qPCR obtaining TSWV N-gene copies in (d) symptomatic (n = 128) and asymptomatic plants (n = 14) across tissue types and in leaf and root tissue samples from (e) symptomatic plants (n = 66, 62 for leaf and root samples, respectively) and (f) asymptomatic plants (n = 9, 5 for leaf and root samples, respectively). Data were pooled across 2018 and 2019.
Pathogens 10 01476 g003aPathogens 10 01476 g003b
Publisher’s Note: MDPI stays neutral with regard to jurisdictional claims in published maps and institutional affiliations.

