Article

Re-Examining the Public–Catholic School Gap in STEM Opportunity to Learn: New Evidence from HSLS

Department of Educational Foundations, Organizations, and Policy, School of Education, University of Pittsburgh, Pittsburgh, PA 15260, USA
*
Author to whom correspondence should be addressed.
Soc. Sci. 2020, 9(8), 137; https://doi.org/10.3390/socsci9080137
Submission received: 10 June 2020 / Revised: 22 July 2020 / Accepted: 28 July 2020 / Published: 30 July 2020
(This article belongs to the Special Issue Social Stratification and Schooling)

Abstract

:
This paper examines public–Catholic gap in STEM opportunity to learn in the US using Mahalanobis-distance matching and adjacent categories models. Consistent with prior studies, there are significant public–Catholic differences in math and science course sequence level and total credits earned. However, we find that these gaps are largely accounted for by selection processes among students of differing family background. Moreover, we find that the Catholic school advantage in STEM opportunity to learn differs by subject; Catholic school students are more likely to enroll in advanced math courses relative to middle-level courses, while their advantage in science is concentrated in the middle of the course-taking hierarchy.

1. Introduction

Examining differences in course taking across school sectors (i.e., public schools vs. Catholic schools) in the US provides insight into how differential access to selective schools affects opportunity to learn and may contribute to educational inequality. Bryk, Lee, and Holland’s classic book on Catholic schooling provided evidence that US Catholic school students took more numerous and more rigorous academic courses, compared with peers in public schools (Bryk et al. 1993; see also the 1985 special issue of Sociology of Education on this topic). Motivated in part by this sector disparity, beginning in the early 1990s, with a wave of standards-based reform policies, public schools started to develop and adopt new standards for high school course taking. Several studies examined the effectiveness of this series of policies on reducing the long-lasting school sector gap (e.g., Carbonaro and Covay 2010) and on improving students’ overall course-taking outcomes (e.g., Domina and Saldana 2012). Carbonaro and Covay (2010), for instance, argued that the private school advantage in course taking still existed in the 2000s, albeit at very small levels after accounting for student achievement differences across sector. Admission to private schools has become increasingly constrained in recent decades, with fewer students from poor or near-poor households, as well as one-parent households or households with only nonparental guardians, and those whose parents’ highest education level is equal to or less than a high school diploma enrolling in private schools (Cahalan and National Center for Education Statistics 2006; Wang et al. 2019). Thus, family background continues to interact with school-to-school differences in opportunity to learn to create educational inequality. The release of the High School Longitudinal Study (HSLS): 09 Transcript data in 2015 offers a new opportunity to re-examine the public–private gap in students’ STEM learning opportunities. With the help of HSLS:09, we, herein, investigate recent sector differences in STEM opportunity to learn using rigorous, fine-grained measures of course taking.
Standards-based school reforms aim to increasingly improve academic standards, enforce accountability, and pose higher graduation requirements for public school students. Evidence from the National Science Foundation (NSF) documents the effects of this set of policy initiatives. As of 2012, over 25 states have adopted “completing algebra II” as a high school graduation requirement for mathematics and “two years of science courses” for science (National Science Board (US) 2016). Considering higher level courses, the number of students who took at least one AP course approximately doubled from 2006 to 2016 (National Science Board (US) 2008, 2018; see also Chaney et al. (1997) for discussion of graduation requirements). This evidence highlights two important dimensions of students’ course taking, the number of academic courses taken, and the overall difficulty of coursework. Incorporating this dual emphasis, in this study, we analyze sector differences in the number of math and science courses taken in high school as well as course difficulty, measured by constructing a scale of math and science course sequence levels from 9th to 12th grade (Kelly 2004, 2009; Riegle-Crumb 2006; Stevenson et al. 1994).
To more clearly identify the effect of differences in academic press (Shouse 1996) across the school sector, as opposed to responsiveness to the achievement level of the student body and other selection mechanisms, we employ Mahalanobis-distance matching to examine sector differences in course taking among similar students in the HSLS:09. Similar students are identified by selection factors affecting the likelihood of attending Catholic school including family background variables, student demographic information, home learning environments, and prior learning experiences. Furthermore, we investigate the school sector gap at different levels of STEM course taking. Several studies argue that the school sector gap in math achievement gains are not equivalent across the spectrum of math skills (Carbonaro and Covay 2010; Hyde et al. 2008), with the Catholic school advantage concentrated in advanced math skills. This suggests that the standards-based reform movement may have different effects on the sector gap in higher-level courses than on overall course taking. Therefore, we examine the effect of Catholic school attendance on course-taking across different levels of the STEM course-taking hierarchy using adjacent categories models (Carbonaro and Covay 2010; Fullerton 2009).
Consequently, our research questions are as follow: (1) Are there public–Catholic differences in STEM course sequence level and/or the total amount of coursework taken? (2) Does family background and other non-school factors account for observed school sector differences in STEM course-taking outcomes? (3) Do sector differences in STEM course-taking outcomes differ across the course-taking hierarchy?
By exploring sector differences in STEM opportunity to learn using several specifications, our work not only provides insights on the specific dimensions of persisting school sector differences, but also points out the continuing need and potential to improve the rigor of course taking in public schools.

2. Background Literatures

2.1. High School STEM Learning: An Opportunity to Learn Perspective

Research on STEM education provides empirical evidence in understanding students’ pathway from early STEM experiences through the STEM workforce. High school math and science learning is critical in the development of students’ interests in STEM disciplines and entrance into STEM majors (Wang 2013), as high school learning experiences may enable students to create perceptions of themselves as STEM learners and to prepare themselves for post-secondary STEM learning (Mickelson et al. 2016; Riegle-Crumb and King 2010). One way to examine high school STEM learning is through the lens of math and science achievement (e.g., Crisp et al. 2009). However, in understanding the disparity in STEM learning outcomes between advantaged populations and underserved populations, achievement outcomes alone do not fully capture differences in schooling (e.g., Flores 2007; Martin 2009; Vanneman et al. 2009). Flores (2007), for instance, argued that studies solely focusing on achievement have rarely identified the root causes of achievement gaps. An alternative approach to examining disparities in learning outcomes is to focus on opportunity gaps, which highlight how structural and institutional inequalities may lead to achievement disparities (Martin 2009).
In general, the opportunity to learn perspective emphasizes the opportunity that students have been provided through schooling (Wilhelm et al. 2017). As one of the earliest studies on this topic, Sørenson and Hallinan (1977) conceptualized opportunity to learn (OTL) as an interactive mechanism, where characteristics of schooling and teaching moderate the role of ability and effort. In theory, this could mean that greater OTL exacerbates inequality, but explicitly compensatory processes are also in place in contemporary schools (Northrop 2017; Rowan et al. 2009), and the intensity of school relative to learning out-of-school is an important determinant of inequality (Downey and Condron 2016). More basically, the concept of opportunity to learn helps explain school-to-school differences in achievement growth (Montt 2011; Martin 2009). Within this framework, dimensions of schooling that affect learning include teacher characteristics and instructional quality (e.g., Kelly 2010; Kelly and Majerus 2011; Northrop and Kelly 2018; Minor et al. 2015); the degree of exposure to rigorous educational content (e.g., Hansen and Strietholt 2018; Northrop et al. 2019); and even basic physical resources and availability of learning materials and technology (e.g., Krashen et al. 2012).
Although there have been efforts to construct integrative measures of OTL (e.g., Bottia et al. 2018; Montt 2011), much research focuses on discrete educational processes and constructs that might be readily manipulated (Bottia et al. 2018). In this paper, we limit our instantiation of STEM opportunity to learn (OTL) to students’ exposure to rigorous math and science courses in high school. We also acknowledge that there are inherent differences between the degree of actual exposure to STEM courses and the underlying accessibility of STEM courses, as the selection and completion of high school math and science courses can be affected by both course availability (Tytler et al. 2008) and selection and placement mechanisms. Overall, the goal of this paper is to understand how entering a given school sector enables/constrains students’ richer experiences in STEM course taking.

2.2. Curricular Differentiation, and OTL across Countries

Curricular differentiation is a rational approach to tailoring instruction to better match students’ learning needs but may ultimately generate greater educational inequality especially at the secondary level (Gamoran and Mare 1989; Kelly 2019). Historically, the US school system stratified students into different levels of curriculum content based on their learning capacities and types of occupational preparation, which resulted in highly differentiated learning opportunities (Sørenson 1970; Spring 1976). Internationally, grouping students within a school based on level of ability and preparation is not the only means of exposing students to different course-taking experiences. Curricular differentiation can also occur across school type or geographic location (Montt 2011). For instance, Van Houtte and her colleagues studied within-school tracking (multilateral schools) and between-school tracking (categorial schools) in the Flemish (Belgium) school system and found that greater differences were associated with within-school tracking, in terms of students’ study involvement (Van Houtte and Stevens 2009) and self-esteem (Van Houtte et al. 2012). Hanushek and Wößmann (2006) also reported that sorting students based on test scores in the early years of schooling increased inequality with little effect on overall national scores.

2.3. Course-Taking, School Sector Gaps, and Standards-Based Reform

Since the 1980s, the debate over sector effects on students’ opportunity to learn have been informed by multiple large-scale longitudinal data collections in the US. Early studies reported that, compared to their public-school peers, Catholic school students took more academic courses, experienced higher achievement gains, and reported receiving higher quality instruction (Bryk et al. 1993; Coleman et al. 1982; Gamoran 1996; Hoffer 1997). For instance, in 1982, Catholic school students, on average, took approximately one additional year of academic math courses than public school students (Bryk et al. 1993). Catholic schools encourage students to take more academic courses by (1) assigning students into the academic track, (2) providing more academic and fewer elective courses, and (3) posing high graduation requirements (Bryk et al. 1993). In contrast, course enrollment in public schools of that era was described as akin to a “shopping mall” experience where students enrolled in courses based on their own inclinations with little oversight (Powell et al. 1985).
McDill et al. (1986) refer to this institutional-level emphasis on academic climate as academic press, meaning “a normative emphasis on academic excellence and conformity to specified academic standards.” Lee and Smith (1999) identified both internal and external factors that motivated a school to improve its academic press, including teachers’ expectations for student performance within schools, as well as externally imposed standards. As McDill et al. (1986) noted, the underlying rationale for higher standards included the argument that nationwide standards were not competitive when compared to educational systems internationally. Beginning in the 1990s, with a wave of standards-based school reform policies, policy groups started to develop higher curricular standards for instruction and learning (Department of Education (US) and Standards National Council on Education, and Testing 1992). As conceptualized in the opportunity to learn literature, improving instructional quality and exposing students to rigorous learning content are core tenants of standards-based reform (e.g., Minor et al. 2015; Montt 2011). Further, much of the standards-based reform movement adopted an explicit focus on reducing school-to-school differences in opportunity to learn (Minor et al. 2015).
In the wake of substantial standards-based school reform efforts, there is no doubt that public school students experience greater opportunity to learn, especially in terms of basic course-taking patterns and achievement growth (Domina and Saldana 2012; National Science Board (US) 2008, 2016, 2018). Domina and Saldana (2012) found that, over a two-decade period of change, the average high school graduate took approximately five more academic credits. Furthermore, US high school graduates took more advanced math credits from 1982 to 2004 as well. By 2004, approximately 43% of high school graduates earned credits in trigonometry or higher math courses whereas only 19% of high school graduates in the class of 1982 completed trigonometry or higher math courses (changes for public school students only are similar). However, improvements in the absolute mean level of course taking (i.e., a “rising tide” of course taking) do not necessarily mean that a decline in relative inequality between specific student groups will occur, even if all groups have experienced some improvement. For example, Domina et al. (2016) argue that during this period, socially advantaged groups created more advanced academic pathways, such as taking both Algebra and Geometry during eighth grade, to maintain their academic advantage.
Yet, given the generally widespread improvements in opportunity to learn for public school students occurring as a result of increased course-taking standards, we might expect to find a decline in the traditional Catholic school achievement advantage. Carbonaro (2003, 2006) reported that by the 1990s, public school students enjoyed similar achievement gains compared to their counterparts in private schools at the kindergarten and elementary level. However, in their more recent research using the Education Longitudinal Study (ELS), Carbonaro and Covay (2010) found that, at the high school level, private school students still took more academic math courses and thus enjoyed greater math achievement gains. Indeed, in the ELS data, the sector gaps in achievement growth that remain after accounting for selection processes are largely accounted for by differences in course-taking (Carbonaro and Covay 2010).

3. Methodology

3.1. Data

In this study, we use the High School Longitudinal Study of 2009 (HSLS:09) data from the US National Center of Educational Statistics (NCES). HSLS: 09 is a nationally representative longitudinal study of over 20,000 9th grade students from over 900 schools across the country beginning in 2009, with two waves of follow-up study in 2012 and 2016 (and a few minor updates in-between major follow-ups). The survey instruments include information from a student questionnaire, parent questionnaire, teacher questionnaire, and a school administrator questionnaire, with a specific focus on students’ STEM learning. HSLS:09 also features transcript data, which allow for full exploration of students’ course taking. Transcript data were collected in 2013–2014 and include course-taking records for each course that every student took during their high school study—there are over 1 million raw transcript records in HSLS. Approximately 70% of the transcript records are valid, containing course name, year/semester, credits and grade earned, and other identification information.

3.2. Dependent Variables

Two sets of dependent variables were developed to provide an overall picture of students’ course taking: Math and science course sequence levels, and the total credits earned. To capture students’ cumulative mathematics course taking, we assigned each student a unique Mathematic Course Sequence (MCS) code indicating the difficulty level of the combination of courses taken by the end of 12th grade. The MCS codes start with 1–less than algebra I and end with 9–calculus or higher, often based on identification of joint courses (e.g., Level 3 is Algebra I and Geometry). Students with higher MCS values have deeper and richer mathematic learning experiences than students with lower values. The full cumulative Mathematics Course Taking codes are shown in Table 1 (see also Appendix A for a full description of the coding process).
Different in some respects from math courses, science courses vary in their disciplinary content (e.g., biology, chemistry, and physics, often referred to as the “big-three” in the popular press). Therefore, in addition to codes for sequential course difficulty/level (e.g., Biology I vs. Biology II), the Science Course Sequence (SCS) coding includes simple counts of disciplinary categories taken. The full cumulative Science Course Taking codes are shown in Table 2 (see also Appendix B for a full description of the coding process).
Finally, the total number of mathematics and science course credits taken are also calculated. We investigate total credits earned rather than number of courses taken, because some courses are divided across multiple semesters/years, and not all courses are credit bearing.

3.3. Analytic Strategy

As a result of increased course-taking standards, we may expect to observe a decline in the advantage of Catholic school attendance in terms of OTL. In this article, we employ two analytical methods to examine the effect of Catholic school attendance on course taking in the era of standard-based reform. First, we use Mahalanobis-distance kernel matching to study sector effects on course taking in the context of selection bias (we use kmatch in Stata, see Jann (2017) for technical details and King and Nielsen (2019) for further discussion). Mahalanobis-distance matching is a general form of multivariate distance matching with the idea of creating a multivariate space of covariates X and matching based on the distance metric between observations (Diamond and Sekhon 2013). The multivariate distance between two observations, i and j has the form,
M D ( X i ,   X j ) = ( X i X j ) T S 1 ( X i X j )
where S is the scaling matrix of X and XT is the transpose matrix of X. As King and Nielsen (2019) argued, multivariate distance matching is more efficient, has less model dependence, and can improve balance relative to traditional covariate adjustment or propensity score matching. To find potential matches based on multivariate distance and determine the matching weights, we use a Kernel matching algorithm, which provides a non-parametric estimation of outcomes using Kernel weights. The Kernel weight is defined as (Frölich 2004),
W ( i , j ) = K ( ) K ( )
where K() is the Kernel function, and is the matching quality function, given by:
= M D j M D i h n
where h n is the bandwidth of matching. Bandwidth selection was informed by checking the quality of covariate balance and was set to 1.2 after comparing different matching results. Selection factors affecting the likelihood of attending Catholic school include family background variables, student demographic information, home learning environments, and prior learning experiences. Description of all student-level covariates is provided in Table 3. It is worthwhile to note that, as Altonji et al. (2005) suggest, we include middle school sector (private or public) as an important factor to address selection bias. Middle school sector is not directly measured in HSLS:09. Fortunately, the NCES School ID for 8th grade school attended is available and can be matched to School IDs in either the Common Core Data (CCD, a national database for all public elementary and secondary schools) or the Private School Universe Survey (PSS, a national representative survey on private elementary and secondary schools).
Then, using the extracted matched sample, we further control for school-level covariates (e.g., geographic regions, instructional resources, and racial composition) using regression methods (Stuart 2010). We use ordered logit regression models to estimate the effect of Catholic school attendance on student course-taking outcomes after controlling for school-level mediating effects. The logistic regressions take the form of:
l o g i t [ P ( Y i t ) ] = β 0 + β 1 ( C a t h o l i c ) + γ X i + ε  
where t = 1 , 2 , ,   M , and M is maximum value of the corresponding course sequence, β 1 is the effect of Catholic schools, X i is the vector of school level covariates, and standard errors are clustered by school ID. Table 4 provides a description of all school-level covariates.
As an alternative to the main matching-based modeling strategy, we also employ more traditional covariate adjustment in a series of ordered logistic multilevel models. These models share a similar functional form,
L e v e l   1 :   l o g i t [ P ( Y i j t ) ] = β 0 j + k = 1 16 β k j X i j + γ i j   γ i j ~ N ( 0 ,   σ 2 ) L e v e l   2 :   β 0 j = γ 00 + γ 01 C a t h o l i c j + m = 2 14 γ 0 m S j + μ 0 j   μ 0 j ~ N ( 0 , τ 00 ) β 1 j = γ 10   ,   ,   β m j = γ m 0   , ,   β 16 j = γ 160
where t = 1 , 2 , ,   M , and M is maximum value of the corresponding course sequence, X i j are student-level covariates for student i in school j, γ 01 is the effect of Catholic schools, and S j are school-level covariates for school j. To compare ordered logistic regression coefficients across models, we explored both the KHB method (Kohler et al. 2011; see also Karlson et al. 2012) and linear probability model calculations to address the issues of confounding and re-scaling that arises in logistic model specifications. In the present data, when estimating the percentage reduction in the key sector effect due to mediation (i.e., the total effect of student background and other compositional variables in this study), calculations using the KHB and linear probability specification produce similar results. However, the KHB method was not developed specifically to address the scaling issue when comparing coefficients between matched and covariate adjusted models with different samples. Therefore, in the results section, we report results from linear probability model calculations.
As an extension of those models, we use adjacent categories models (see e.g., Fullerton 2009) to examine the effect of Catholic school attendance on course taking across the STEM course-taking hierarchy. We collapse the MCS and SCS course sequence codes into three tracking levels capturing major differences in course taking. Details on constructing an ordinal measure of course taking using information from the cumulative course sequence measure are shown in Table 5.
Adjacent categories models share a similar functional form as the ordered logistic models but estimate the effect of Catholic school attendance more narrowly within pairs of adjacent categories.

4. Results

4.1. Descriptive Statistics

To examine the public–Catholic difference in terms of students’ cumulative Mathematic Course Sequence, Table 6 presents a basic contingency table showing differences in course taking across school sectors both by cell frequency and cumulative frequency of a given level of course taking or higher.
The Chi-square (χ2) statistic provides a summary measure of association between sector and course taking using the raw cell frequency counts. As shown in Table 6, students from Catholic schools are more likely to take higher level math courses, χ2(0.99, 8) = 508.26, p < 0.001. For example, 74.2% of Catholic school students had attained an MCS level of 7 or above (algebra III or higher), compared to only 49.2% of public-school students. Likewise, students from Catholic schools are more likely to avoid low-level course combinations (e.g., equal or less than algebra II) than students from public schools (24.7% vs. 43.0% for category 5 or lower).
Table 7 presents analogous information for Science Course Sequences. As shown in Table 7, students from Catholic schools are more likely to take higher level science courses, χ2(0.99, 4) = 418.31, p < 0.001. For example, Catholic school students are more likely to experience all three important science disciplines (i.e., Biology, Chemistry, and Physics) than students from public schools (69.7% vs. 45.7% for category 4 or lower).
Overall, descriptive statistics for the dependent variables show a substantial baseline difference in course taking across school sectors. Catholic school students, in general, experience a higher difficulty level/rigor of course sequences in math and science. Public school students, on the other hand, experience reduced opportunity to learn, especially in terms of basic course-taking patterns, even with substantial standards-based school reform efforts.

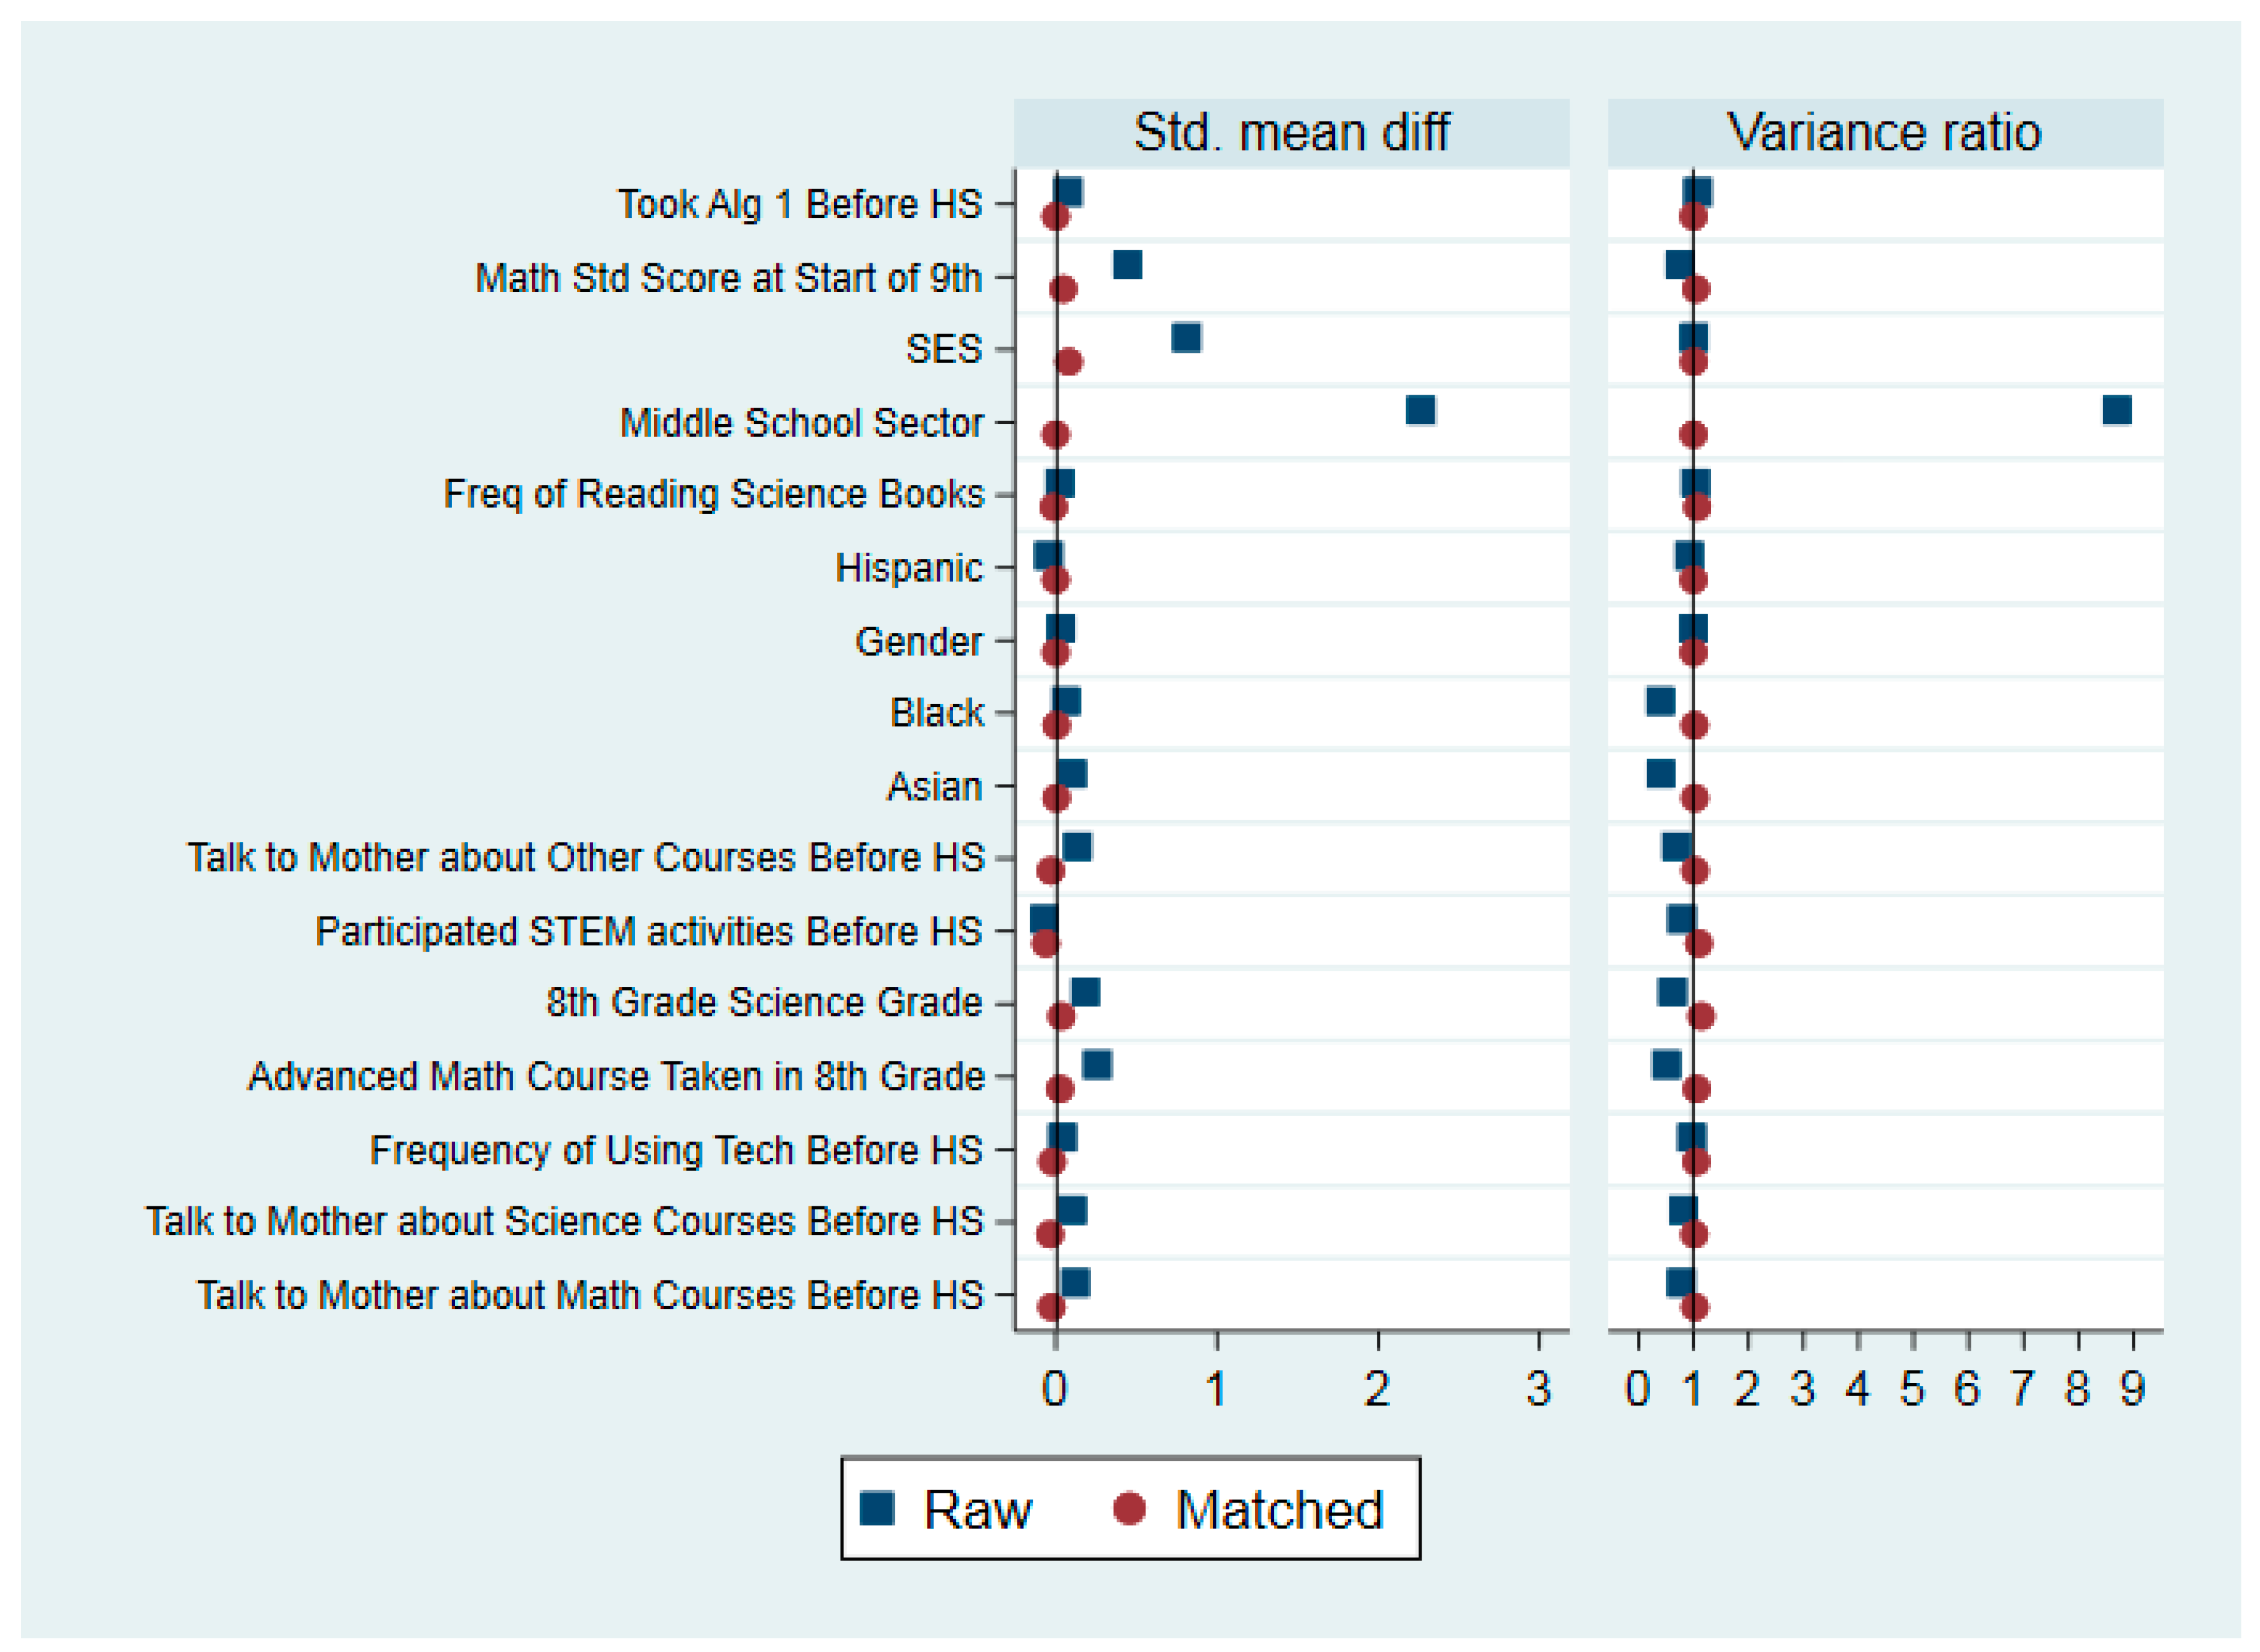
4.2. Using Matching to Address Selection into Public and Catholic Schools

A total of 16 student-level covariates were used for matching to reduce selection bias. Selection factors affecting the likelihood of attending Catholic school include demographic information, prior achievement, features of the learning environment, and family SES. To evaluate the quality of matching, we compared covariates for the raw sample and matched sample in terms of their standardized mean difference and variance ratio. As shown in Table 8, all covariates used for matching are well balanced. Figure 1 provides a visual summary of matching quality.

4.3. Effect of Catholic School Attendance on Course-Taking Outcomes

Table 9 reports estimates of the Catholic school effect on course taking using both traditional covariate adjustment methods, followed by matching estimators. The first row of Table 9 reports the raw logistic difference in course taking; this represents the simple observed differences from Table 1. In Row 2 we adjust for student- and school-level covariates. The third row of Table 9 reports the average treatment effects (ATE) in the logistic metric after matching. The last row of Table 9 is the estimated effect from an ordered logistic regression on the matched sample to further control school-level covariates.
As shown in the first row of Table 9, on average, for Catholic school students, the baseline odds of attaining a higher-level course sequence are approximately twice that of public school students ( e 0.73 = 2.08 for math and e 0.71 = 2.03 for science, Table 9, Row 1). For total credits, there is approximately a one-quarter credit gap (0.24 from Table 9, Row 1) for math and a half credit gap (0.49 from Table 9, Row 1) for science.
Turning to the main results in Table 9, in the regression-adjusted matched sample (Table 9, Row 4), the Catholic school effect for math and science course taking using the course sequence level is much lower than the size of the baseline difference in Row 1. The odds of attaining a higher-level course sequence for Catholic school students are now estimated as 1.12 times and 1.19 times that of public school students for math and science course sequence, respectively, net of family background, other student-level non-school factors, and school-level covariates ( e 0.12 = 1.12 for math and e 0.17 = 1.19 for science, Table 9, Row 4). To show the extent to which the sector course-taking differences remains unexplained, instead of comparing the coefficients from Table 9, Row 4 with Table 9, Row 1, we apply linear probability model calculations, which are more appropriate for assessing mediation (Table 9, Row 5 and Row 7). Linear probability model calculations shows that 73% of the sector effect on math course sequence and 76% of the sector effect on science course sequences is explained by family background, other student-level non-school factors, and school-level covariates, respectively, indicating that roughly one-quarter of the observed school sector difference still remains unexplained. The results from Rows 2–4 collectively indicate that, although we observe some discrepancy across models, some small sector differences in math and science course sequence level still remains, net of selection bias and school-level covariates. However, the effect on total math credits and science credits is near zero and not statistically significant (0.016 and −0.0025, respectively, Table 9, Row 4).
To further interrogate Research Question Two, we might also compare the average treatment effect (Table 9, Row 3) with the unadjusted difference (Table 9, Row 1). School-level covariates remain unadjusted in Row 3, so this comparison captures the extent to which family background and other non-school factors, operating only as individual-level effects and not compositionally, explains the sector course-taking difference. This may be useful as it is possible that the estimates in Row 4 over-adjust; that the adjustment for compositional effects inadvertently captures other school effects more intrinsically associated with school organizational functioning. In the unadjusted matched sample (Table 9, Row 3), the odds of attaining a higher-level course sequence for Catholic school students are 1.42 times and 1.14 times that of public school students for math and science course sequence, respectively, net of family background and other non-school factors ( e 0.35 = 1.42 for math and e 0.13 = 1.14 for science, Table 9, Row 3). Linear probability model calculations (Table 9, Row 5 and Row 6) show that 68% of the sector effect on math course sequences and 47% of the sector effect on science course sequences is explained by family background and other non-school factors, respectively, indicating that roughly one-third to one-half of the observed Catholic school effect may be due to differences in academic press across sector. Turning to total credits taken, the estimated effect of Catholic school attendance on total science credits is approximately one-third of the raw difference ( 0.17 ÷ 0.49 = 34.7 % , Table 9, Row 3 and Row 1), while the effect on total math credits is near zero and not statistically significant (0.024, Table 9, Row 3).
Collectively, these results converge further in subsequent adjacent categories models where we are able to locate specific Catholic school course-taking advantages.

4.4. Adjacent Categories Model for Tracking

Table 10 reports estimates of the Catholic school effect in pairs of adjacent categories using model specifications from Table 10, Row 2 and 4.
As shown in Table 10, Catholic school attendance appears to have somewhat different effects on students’ math and science course taking. Catholic school attendance shows no significant advantage at the lower end of the math course-taking hierarchy. In contrast, at the upper end of the course-taking spectrum (i.e., Algebra II and above), Catholic school students have higher odds of attaining an advanced math sequence level. Considering the findings on science course taking in Table 10, Catholic school students have a statistically significant advantage at the lower-end of the course-taking spectrum but not at the upper-end. For example, Catholic school students have higher odds of taking at least two of the big three courses (e.g., biology and chemistry) vs. only one, but do not have a statistically significant advantage of taking a higher-level course beyond the big three (e.g., AP Chemistry).

5. Discussion

The central contribution of this paper is to re-examine classic insights from empirical studies (e.g., Bryk et al. 1993; Hallinan 1988) in the sociology of education that examine the social organization of schools. Schools provide access to curriculum and knowledge, ultimately shaping students’ educational attainment. Using recent nationally representative data and fine-grained measurement of student course taking, we examined differential access to rigorous STEM course taking in public and Catholic schools. Building on Bryk et al. (1993), Carbonaro and Covay (2010), Domina and Saldana (2012), Kelly (2009), and others, we identify significant sector differences in math and science course sequence level and total credits earned and conclude that these gaps are largely accounted for by selection processes among students of differing family background. Moreover, we find that the remaining Catholic school advantage in STEM opportunity to learn differs by subject.
Consistent with prior studies, we observe significant raw sector differences in course sequence level and total credits earned in unadjusted models (Table 6 and Table 7, and Table 9, Row 1). Although standards-based school reform has provided public school students with greater access to STEM courses (Domina and Saldana 2012), public students, on average, have not reached the overall difficulty level/rigor of the course sequences or even number of courses taken by Catholic school students.
Table 9, Row 4 reports the most completely adjusted models using Mahalanobis-distance kernel matching approach as well as adjustment for school composition covariates. We observe small sector differences in math and science course sequence net of family background and other non-school factors (0.11 and 0.17 from Table 9, Row 4) with roughly one-quarter of the observed difference remaining in linear probability model calculations, but essentially zero difference in total credits earned (0.016 and −0.0025, Table 9, Row 4). As an upper-bound alternative, Table 9, Row 3 reports that the analysis of the average treatment effect based on matching alone indicates that family background and other non-school factors account for approximately two-thirds of the observed differences in math course sequences (Table 9, Row 1 vs. Row 3 in the linear probability specification) and most of the observed differences in total math credits earned (Table 9, 0.24 from Row 1 and 0.024 from Row 3). For science courses, family background and other non-school factors account for roughly half of the observed differences in course sequences (Table 9, 0.71 from Row 1 and 0.13 from Row 3, with 47% as result of linear probability model calculations) and total credits earned (Table 9, 0.49 form Row 1 and 0.17 from Row 3), respectively. Any remaining Catholic school attendance advantage net of family background and other non-school effects is roughly one-third to one-half of the original Catholic school effect in these data. Overall, results from Mahalanobis-distance kernel matching approach indicates that family background and other non-school factors continue to play critical roles in exposing students to different opportunity to learn, but thereafter sector differences in course taking provide only a modest cumulative advantage to enrolled students.
More precise adjacent categories model specifications are able to locate specific Catholic school course-taking advantages. Catholic schools appear to have an advantage in lifting students to advanced math sequences who otherwise might enroll in mid-level courses, and to middle science sequence levels as opposed to low level science course-taking sequences (Table 10). Note that the mid-level math sequence in Table 5 represents Algebra II or equally rigorous electives. Our finding is consistent with the evidence that over 25 states have adopted “completing algebra II or equivalent courses” as a high school graduating requirement for mathematics (National Science Board (US) 2016), as public schools are not at any disadvantage in lifting students to mid-level sequence. This finding is also consistent with the fact that that standards-based reform targets students with course-taking experiences that do not support college enrollment. However, more recently, Minor et al. (2015) found that in responding to Algebra-for-All policy efforts (see e.g., Domina et al. 2015), some private schools implemented “double early access” to enable eighth grade students to complete both Algebra I and Geometry before the beginning of high school. This adjustment of curriculum structure by private schools increased inequality in learning opportunities across sector. It is also important to reiterate that Catholic school students have advantages in taking advanced math courses. Therefore, we believe that public schools should make efforts to bolster early exposure to some critical “gateway” math courses before 10th grade. Doing so will also benefit students with motivation and ability to have enough time to finish advanced math courses and potentially reduce the inequality in learning opportunities across sectors in the higher end of the course-taking hierarchy. Domina et al. (2019) also suggest that disadvantaged students should be provided with better access to high-achieving peers and more opportunities for skill building (see also Nomi and Raudenbush 2016).
For science course sequence levels, the Catholic school course-taking advantage is most obvious in exposing students to courses in multiple science disciplines. However, unlike the findings on math course sequence levels, Catholic schools do not appear to have any advantage in enrolling students in high-level science courses. Perhaps more so than prior research, this study highlights that both Catholic and public schools could better support students in taking high-level science courses. As described in Appendix B, we define higher-level science courses as comprehensive study of a specific disciplinary field with the pre- or co-requisite requirement of higher-level interdisciplinary knowledge (in most cases, a Calculus-level math course). A basic finding from Table 7 is that only approximately 10% of all students had experience with at least one higher-level science course. This is consistent with Teitelbaum’s (2003) finding that increasing basic course-taking requirements (e.g., requiring three years of science) does not necessarily “trickle up” into higher rates of advanced course taking. Therefore, our findings also suggest that additional supports, regardless of the type of school, are needed for students to pursue the rigorous STEM experiences.
Opportunity to learn continues to serve as a useful overall lens for examining private school advantages. Referencing the remaining advantage (Table 9, Row 4), Catholic schools do appear to provide students with greater exposure to rigorous academic courses, net of enrollment factors, and school-level covariates. Although here we have focused on curriculum structure, it is important to consider that variation in curriculum may itself be contingent not only on policy and the normative climate and ethos of the school (here, academic press), but also basic resources. As some early studies argued (e.g., Bryk et al. 1993), flexibility of budget and resource allocation may allow private schools to alter curriculum structures more easily, and even in that era there was a growing mandate for better STEM preparation.
This paper has several major limitations. First, consider the different patterns of Catholic course-taking advantage in math and science course taking. In these data, we are unable to uncover why the Catholic advantages are inherently different across disciplines. On the other hand, it is important to keep in mind that math and science achievement are interrelated, such that course taking in one-subject supports the other (Wang 2013). Thus, although located in different parts of the course-taking hierarchy, both gaps constitute a generalized gap in STEM opportunity to learn. Second, the present analysis contains only basic consideration of the timing of enrollment in critical courses. For example, Algebra is referred to as a “gateway” or “gatekeeper” to later academic performance and further enrollment in academic science courses, and we do include an indicator of enrollment in Algebra in middle school (Gamoran and Hannigan 2000; Nomi 2012). Yet, future research should more fully explore indicators of early exposure to critical math and science content. Third, our use of statistical matching methods is most robust if observed variables fully account for the difference in treatment and control individuals (Vandenberghe and Robin 2004). Here though, variables used in matching as controls for prior learning experiences are all measured at a single time point, the beginning of ninth grade, which suggests many of these are measured with some error or do not fully account for prior school experiences that might affect readiness for advanced course taking. Finally, course quality was not measured in this paper. The way we constructed course sequences uses only information from the standard course codes, leaving the concern that, for example, the quality of calculus instruction may vary across schools. Future studies may have direct observational measures of instruction (e.g., Hill et al. 2008), measures of assignment quality (Joyce et al. 2018), or other measures of instruction available.
Overall, it is encouraging to find that, consistent with prior research, sector differences in STEM course taking have narrowed in recent decades, and primarily reflect differences in the achievement composition of students enrolling in public and Catholic schools. However, non-trivial differences in STEM opportunity to learn remain across sector, and thus will continue to contribute to educational inequality.

Author Contributions

Conceptualization, S.K. and S.X.; methodology, S.X. and S.K.; software, S.X.; validation, S.X. and S.K.; formal analysis, S.X.; resources, S.K.; writing—original draft preparation, S.X.; writing—review and editing, S.K.; supervision, S.K. All authors have read and agreed to the published version of the manuscript.

Funding

This research received no external funding.

Conflicts of Interest

The authors declare no conflict of interest.

Appendix A. Coding Process for Mathematic Course Sequence (MCS) Codes

The coding of Mathematic Course Sequence (MCS) codes starts with assigning 10-level individual math course code to each course. As shown in Table A1, 1 represents math courses whose difficulty or requirement were lower than algebra I. These could be some informal math course or introductory courses for math in general. 2 represents algebra I or other courses with equal difficulty or requirement. Any algebra I sequence course is coded as 2 as well (i.e., algebra I part 1 and part 2 are both coded with 2). 3 represents geometry or other equal courses. 4 represents courses that are harder than Algebra 1 or equal courses but are not at the same level as Algebra 2. This code also includes courses that apply knowledge from Algebra 1 or other equal courses but not knowledge from Algebra II or higher-level courses. Courses coded with 4 are courses that transit from 1–3 to 5 or higher. 5 represents Algebra II or other equal courses. 6 represents applied math elective courses that include any course that may apply theories or knowledge from algebra II and/or geometry courses. Although these courses are based on prior courses, courses that are only based on pre-algebra or algebra I are not included. The intention for adding applied math elective code is to distinguish those students who finish algebra II and geometry and turn to other courses that apply knowledge they have learned from students who stop after finishing algebra II and geometry. 7 represents Algebra III and other higher-level algebra courses like number theory. 8 represents trigonometry and mathematic analysis courses. 9 represents Calculus and other equal courses that are based on pre-calculus, trigonometry, or algebra III. Finally, 10 represents courses that are harder than calculus. These may include higher level calculus courses, applied calculus courses that are based on calculus. There are 87 individual math courses, and 21 of them have no observation in HSLS transcript file. See Table A2 for complete individual mathematic course codes. The Mathematic Course Sequence (MCS) codes capture cumulative course-taking experiences and start with 1–less than algebra I and end with 9–calculus or higher. Students with higher MCS values have deeper and richer mathematic learning experiences than students with lower values. The full cumulative Mathematics Course Taking codes are shown in Table 1 from main text.
Table A1. Ten-level individual math course code.
Individual Math CodeDescription
1less than Algebra 1
2Algebra 1
3Geometry
4Transition
5Algebra 2
6Applied math elective
7Algebra 3 and equal
8Trigonometry and equal
9Calculus and equal
10Higher than “Calculus”
Table A2. Complete individual mathematic course codes (Frequency out of 21,860 students in transcript data).
Course NameSCED CodeCodeFreqCourse NameSCED CodeCodeFreq
Informal Mathematics 020011292Mathematic Analysis/Analytic Geometry 102108887
General Mathematics020021576Elementary Functions 2021098341
Particular Topics in Foundation Mathematics02003197Pre-Calculus 0211087062
Mathematics (early childhood education)02028no obs 30Linear Algebra 402111941
Mathematics (pre-kindergarten)02029no obs0Linear Programming 502112940
Mathematics (kindergarten)02030no obs0Abstract Algebra 602113987
Mathematics (grade 1)02031no obs0Calculus 0212191250
Mathematics (grade 2)02032no obs0Multivariate Calculus 7021221039
Mathematics (grade 3)02033no obs0Differential Calculus 8021231028
Mathematics (grade 4)02034no obs0AP Calculus AB 90212492070
Mathematics (grade 5)02035no obs0AP Calculus BC 100212510673
Mathematics (grade 6)02036no obs0Particular Topics in Calculus 1102126997
Mathematics (grade 7)02037no obs0IB Mathematical Studies1202131895
Mathematics (grade 8)02038no obs0IB Mathematics 1302132879
Mathematics—General 02039no obs0IB Further Mathematics—HL 14021348122
Foundation Mathematics—Independent Study 0204715IB Mathematics, Middle Years Program 1502135740
Foundation Mathematics—Other 020491187Finite Mathematics02136no obs0
Pre-Algebra 0205111143Mathematical Modeling02137no obs0
Algebra I02052215022College Mathematics Preparation02138no obs0
Algebra I—Part 1 0205321641Particular Topics in Analytic Mathematics 02141779
Algebra I—Part 2 0205421472Analytic Mathematics—Other 021497284
Transition Algebra 16020554615General Applied Mathematics 17021514544
Algebra II 02056513570Occupationally Applied Mathematics 1802152491
Algebra III 020577818Technical Mathematics 19021536278
Particular Topics in Algebra 20020584348Business Mathematics 21021546407
Integrated Mathematics I02062no obs0Business Mathematics with Algebra 22021556151
Integrated Mathematics II02063no obs0Computer Mathematics with Algebra 2302156434
Integrated Mathematics III02064no obs0Consumer Mathematics 24021571577
Integrated Mathematics IV02065no obs0Probability and Statistics 0220171425
Algebra—Other 2502069Dep.1193Inferential Probability and Statistics 022027175
Informal Geometry 020711594AP Statistics 0220391197
Geometry 02072316903Particular Topics in Probability and Statistics 2602204658
Analytic Geometry 2702073696Statistics02205no obs0
Principles of Algebra and Geometry 28020746704Probability and Statistics—Independent Study 02207no obs0
Particular Topics in Geometry 29020753340Probability and Statistics—Other 3002209Dep.62
Geometry—Other 31020793231History of Mathematics 02991132
Number Theory 320210174Mathematics—Test Preparation 33029936549
Discrete Mathematics 34021029413Mathematics Proficiency Development 3502994Dep.514
Trigonometry0210381043Mathematics—Aide 3602995Dep.20
Mathematic Analysis 021048513Mathematics—Supplemental 3702996Dep.454
Trigonometry/Mathematic Analysis 021058278Mathematics—Independent Study 3802997664
Trigonometry/Algebra 0210682577Mathematics—Workplace Experience 3902998512
Trigonometry/Analytic Geometry 021077203Mathematics—Other 02999Dep.2308
Undefined 02061Dep.1828
Foot Note: 1 Mathematic Analysis/Analytic Geometry prepares students eventually qualified in Calculus courses. 2 Elementary Functions prepares students eventually qualified in Calculus courses. 3 There is no observation on HSLS Transcript Students Course File. 4,5 Linear algebra and linear programming require students to finish pre-calculus or equal courses. 6 Abstract Algebra requires students to finish pre-calculus or equal courses. 7,8 Multivariate Calculus and Differential Calculus include topics that are based on calculus. In the meanwhile, to justify this coding level, I examined typical trajectories of students who took these two courses and found that students usually took Calculus and/or AP Calculus AB before these two courses if Multivariate Calculus or Differential Calculus was not the only calculus course they had ever taken. 9 Students usually took AP Calculus AB after Calculus if AP Calculus AB was not the only calculus course they had ever taken. However, according to course descriptions, AP Calculus AB shared the similar topics as Calculus including derivatives, differentiation, integration, the definite and indefinite integral, and applications of calculus. 10 Students usually took AP Calculus BC after Calculus and/or AP Calculus AB. In the meanwhile, in addition to topics covered by AP Calculus AB, AP Calculus BC covers parametric, polar, and vector functions; applications of integrals; and polynomial approximations and series, including series of constants and Taylor series. 11 To identify this coding level, I examined typical trajectory of students who took this course and found that students usually took Particular Topics in Calculus independently (i.e., Particular Topics in Calculus was usually the only calculus course students took if they chose to take Particular Topics in Calculus). I coded this course as equal as Calculus because, in some scenarios, Particular Topics in Calculus is the replacement course for Calculus. 12,13 These two IB courses prepare students to take IB math studies at standard level. Courses includes topics from algebra III, number theories, and trigonometry, but only introductory level calculus. 14 This IB course prepare students to take IB math studies at higher level. Course topics include Calculus and other high-level topics. 15 Instead of preparing student to take IB exam, IB Mathematics, Middle Years Program is built on a framework of five branches of mathematics: number, algebra, geometry and trigonometry, statistics and probability, and discrete mathematics. The program encourages students to develop an understanding of mathematical reasoning and processes, the ability to apply mathematics. Students usually took this course on 9th grade and 10th grade (84.7% of students took Middle Year Program on 9th grade and/or 10th grade). As a contrast, students usually took IB Mathematics or IB Mathematics studies on 11th or 12th grade (78.4% and 89.3% of students took these two IB courses on 11th and/or 12th grade, respectively). Therefore, I coded Middle Year Program one level lower than IB Mathematics or IB Mathematics. 16 Transition Algebra courses review and extend algebra and geometry concepts for students who have already taken Algebra I and Geometry. Although, similar to Algebra II where students usually took it on 10th and/or 11th grade (77.8%), students usually took Transition Algebra after 9th grade (88.5%), Transition Algebra did not sufficiently apply knowledge harder than Algebra I series or Geometry. Therefore, I coded Transition Algebra as “4- transition”. 17,18 General Applied Mathematics and Occupationally Applied Mathematics applied knowledge from Algebra I and used these skills in specific fields. However, similar to Transition Algebra, these two courses did not apply knowledge and skills from Algebra II or equal courses. Therefore, these two courses should belong to 4. 19,21,22 Technical Mathematics, Business Mathematics, and Business Mathematics with Algebra sufficiently applied basic principles from Algebra I, Algebra II and Geometry. I code these three courses as “applied math elective” because, although they combine principles of Algebra and geometry, they do not adequately provide solid theoretical background as pre-calculus does. 20 Particular Topics in Algebra built upon topics from pre-Algebra and Algebra I and examine specific topics such as linear equations or rational numbers. More than half of students usually took this course before 10th grade (56.8%). Compare to Algebra II where only less than 10% of students took Algebra II before 10th grade (7.8%), I coded Particular Topics in Algebra as “4-between Algebra I and Algebra II”. 23 Intended for students who have attained the objectives of Algebra I, Computer Mathematics with Algebra courses include a study of computer systems and programming and use the computer to solve mathematics problems. However, this course did not applied knowledge higher than Algebra I. 24 Consumer Mathematics only applied knowledge from pre-Algebra such as arithmetic using rational numbers, measurement, ratio and proportion, and basic statistics to consumer problems and situations. Therefore, I coded this course as pre-Algebra.d. 25 The level of Algebra-other depended on individual courses that students had taken. For example, Algebra Lab for ninth graders, or College Algebra and Intermediate Algebra for 12th graders both belonged to Algebra-Other. 26 Particular Topics in P&S usually covered topics such as elementary statistic and general statistic topics. Therefore, I coded this course one level lower than Statistic. 27,28 These courses apply basic principles from algebra I, and algebra II into studying of geometry. I code these two courses as “applied math elective” because, although they combine principles of Algebra and geometry, they do not adequately provide solid theoretical background as pre-calculus does. 29 Out of 678 students who took Particular Topics in Geometry, 490 students (72.2%) took this course as the only geometry course along four-year high school as the replacement of general Geometry and/or advanced level geometry courses. Therefore, I coded this course as a transition level course (4). 30 The category of P&S-Other contained courses for different levels of students. For example, there were introductory statistic courses for 10th grade, and advanced statistic, college statistic, and advanced mathematical decision making for 12th grade. 31 Unlike Algebra-Other with diversified content for students in different grades, student usually took Geometry-Other before 11th grade (70.3%). As a contrast, 80.2% of students took Geometry before 11th grade. Out of 374 students who took Geometry-Other, 246 students (65.8%) took this course as the only geometry course along their four-year high school as the replacement of general Geometry and/or advanced level geometry courses. Therefore, I coded this course as a transition level course (4). 32 This course reviews the properties and uses of integers and prime numbers which prepare students with higher level course, Discrete Mathematics. Part of theories in this course may be covered in Algebra III. 33 This course prepares students with test skills in PSAT, SAT and ACT. Topics include knowledge in algebra I and II and geometry. 34 Discrete Mathematics is built upon Algebra III and Number theory which is a higher-level course. 35–37 The level of these three courses are hard to be decided because the content of these courses depends on grade level. 38 Students usually took this independent study (70.1%) after 10th grade. The goal of this course was to expand their expertise in a particular application, to explore a topic in greater detail, or to develop more advanced skills based on courses they had taken on first two years. However, this independent study was not necessarily the subsequent course of Algebra III and other higher-level courses. Therefore, I coded this course as an elective math course. 39 Mathematics—Workplace Experience was not usually part of math sequence (i.e., students might take calculus at 11th grade and then take Mathematics—Workplace Experience at 12th grade for other reasons). Therefore, although more than 60% of students took Mathematics—Workplace Experience after 10th grade, it is hard to decide the level of Mathematics—Workplace Experience based on trajectories. According to course description, there was not a solid math inquiry associated with this course, Mathematics—Workplace Experience set cooperatively by the student, teacher, and employer. Therefore, I coded this course as a transition level course.

Appendix B. Coding Process for Science Course Sequence (SCS) Codes

Different from individual math course codes, there are inherent categories associated with science courses, i.e., biology, chemistry, physics, or other science course. Therefore, compared to the difficulties of courses, it is equally important to count how many different types of science courses students have taken. For instance, students who has taken both physics and chemistry courses have more science learning experience than students who only take chemistry courses. Therefore, we added another individual code, apart from codes for difficulty level (code 2), to indicate the category of science courses (code 1). The description of two individual science courses code is shown in Table A3. Similar with individual math course code, I manually assign the two individual science course code to each science course filed from School Courses for the Exchange of Data 5.0 (SCED 5.0). See Table A4 for complete individual science codes.
To capture students’ cumulative science course-taking pattern, we assign each student with a code according to their course-taking file. To consider the importance of both how many different types of science courses and how deep students have taken during their high school, we combine the two codes by counting how may “big-threes” (i.e., Biology, Chemistry, and Physics) the student has taken and attaching “higher-level courses (higher than 3 on set 2 code) or not”. The final five-level cumulative science course taking codes are shown in Table 2 in the main text.
Table A3. Individual science course codes.
Code 1
Science course category codeDescription
1Biology Category
2Chemistry Category
3Physics Category
4Other Category, any combination course
Code 2
Science course difficulty level codeDescription
1Course provides basic concepts on specific field
2Course is based on level 1 course, providing a more detailed understanding on specific field, or introduction to a sub-field
3Course provides an in-depth study on a specific sub-filed
4Course provides a higher-level comprehensive study of specific field
5In addition to level 4, course requires higher-level interdisciplinary knowledge to finish
Table A4. Complete individual science course codes (Frequency out of 21,777 students in transcript data).
Course NameSCED CodeCode 1Code 2Freq.
Earth Science 03001414012
Geology 10300242209
Environmental Science 03003412778
Astronomy 0300441559
Marine Science 0300541933
Meteorology 030064180
Physical Geography 2030074269
Earth and Space Science 03008411024
Particular Topics in Earth Science030094172
Earth/Space Science (prior-to-secondary)03010410
Physical Science (prior-to-secondary)03011410
Energy and the Environment03012410
Earth Science—Independent Study030474125
Earth Science—Workplace Experience 03048412
Earth Science—Other 0304941316
Biology 030511119,332
Biology—Advanced Studies 30305212969
Anatomy and Physiology 403053123507
Anatomy 50305413301
Physiology 0305513184
AP Biology 603056141551
IB Biology 70305714157
Botany 80305812170
Genetics 90305912163
Microbiology 10030601286
Zoology 110306112468
Conceptual Biology 0306211484
Particular Topics in Biology 0306311509
Regional Biology03064110
IB Sports, Exercise, and Health Science 1203065120
PLTW Principles of Biomedical Science 1303066130
PLTW Human Body Systems 1403067130
PLTW Medical Interventions 1503068130
Nutrition Science03069120
PLTW Biomedical Innovation03070130
Biology—Independent Study03097112
Biology—Workplace Experience 03098111
Biology—Other 0309911330
Chemistry 031012114,276
Chemistry—Advanced Studies 160310222652
Organic Chemistry 17031032387
Physical Chemistry 18031042550
Conceptual Chemistry 0310521266
AP Chemistry 1903106241039
IB Chemistry 20031072495
Particular Topics in Chemistry 031082187
Chemistry—Independent Study 031472110
Chemistry—Workplace Experience 03148215
Chemistry—Other 0314921153
Physics 03151316813
Physics—Advanced Studies 0315232249
Principles of Technology0315332155
AP Physics C 210315635149
IB Physics 22031573581
Life Science03158111
Physical Science 03159317107
Conceptual Physics 0316131477
Particular Topics in Physics 031623183
AP Physics C: Electricity and Magnetism 23031633558
AP Physics C: Mechanics 24031643589
AP Physics 1 25031653437
AP Physics 2 2603166343
Physics—Independent Study 03197317
Physics—Workplace Experience 03198310
Physics—Other 031993194
Integrated Science 03201412894
Unified Science 0320241574
Applied Biology/Chemistry 0320341103
Technological Inquiry 03204414
Origins of Science 032054124
IB Design Technology 2703206431
AP Environmental Science 280320743816
IB Environmental Systems and Societies 29032084335
Aerospace 032094246
Science, Technology and Society 032104151
Technical Science 032114158
Scientific Research and Design 0321241154
IB Sciences, Middle Years Program032134142
Forensic Laboratory Science03214no obs 0
Science (early childhood education)03228no obs 0
Science (pre-kindergarten)03229no obs 0
Science (kindergarten)03230no obs 0
Science (grade 1)03231no obs 0
Science (grade 2)03232no obs 0
Science (grade 3)03233no obs 0
Science (grade 4)03234no obs 0
Science (grade 5)03235no obs 0
Science (grade 6)03236no obs 0
Science (grade 7)03237no obs 0
Science (grade 8)03238no obs 0
Science—General03239no obs 0
Life and Physical Sciences—Proficiency Development 039944133
Life and Physical Sciences—Aide 039954129
Life and Physical Sciences—Supplemental039964113
Life and Physical Sciences—Independent Study 039974133
Life and Physical Sciences—Workplace Experience 039984110
Life and Physical Sciences—Other 03999411006
Foot Note: 1 Geology courses provide an in-depth study of the forces that formed and continue to affect the earth’s surface. 2 Knowledge for Physical Geography is based on Earth science and Marine science that examine the physical environment place on human development. 3 This course usually taken after a comprehensive initial study of biology, Biology—Advanced Studies courses cover biological systems in more detail. 4 This course usually taken after a comprehensive initial study of biology, Anatomy and Physiology courses present the human body and biological systems in more detail. 5 Anatomy courses present an in-depth study of the human body and biological system. Students usually took this course after anatomy and physiology. 6 Adhering to the curricula recommended by the College Board and designed to parallel college-level introductory biology courses, AP Biology courses emphasize four general concepts: evolution; cellular processes (energy and communication); genetics and information transfer; and interactions of biological systems. 7 IB Biology courses prepare students to take the International Baccalaureate Biology exams at either the standard or higher level. 8,9,10,11 These four courses provide students with a understanding of general concepts of specific sub-field. 12 Although this is an IB course, this course provides students with standard level of understanding of this sub-field. 13,14,15 These three PLTW courses provide students with in-depth understanding of specific sub-field based on the knowledge from physiology and genetics. 16 This course usually taken after a comprehensive initial study of chemistry, Chemistry—Advanced Studies courses cover chemical properties and interactions in more detail. 17 Organic Chemistry courses involve the study of organic molecules and functional groups. Usually taken after advanced studies. 18 This is an interdisciplinary course. Usually taken after completing a calculus course, Physical Chemistry courses cover chemical kinetics, quantum mechanics, molecular structure, molecular spectroscopy, and statistical mechanics. 19 This AP course requires high school chemistry and algebra II. 20 This IB course provides students with higher level of understanding in Chemistry. 21 AP Physics C in a combination course of Physics C: Electricity and Magnetism and Physics C: Mechanics and requires calculus to resolve problems. 22 IB Physics requires calculus. 23.24. See note 21. 25,26 Unlike AP C, these two AP courses are algebra-based physics, can’t be coded as higher-level interdisciplinary course. 27,28,29 Although these three AP/IB courses provide comprehensive study of specific field, they don’t provide a higher-level understanding of sub-field as AP chemistry or physics does.

References

  1. Altonji, Joseph G., Todd E. Elder, and Christopher R. Taber. 2005. Selection on Observed and Unobserved Variables: Assessing the Effectiveness of Catholic Schools. Journal of Political Economy 113: 151–84. [Google Scholar] [CrossRef] [Green Version]
  2. Bottia, Martha Cecilia, Roslyn Arlin Mickelson, Jason Giersch, Elizabeth Stearns, and Stephanie Moller. 2018. The Role of High School Racial Composition and Opportunities to Learn in Students’ STEM College Participation. Journal of Research in Science Teaching 55: 446–76. [Google Scholar] [CrossRef]
  3. Bryk, Anthony S., Valerie E. Lee, and Peter Blakely Holland. 1993. Catholic Schools and the Common Good, new ed. Cambridge: Harvard University Press. [Google Scholar]
  4. Cahalan, Margaret W., and National Center for Education Statistics. 2006. United States High School Sophomores: A Twenty-two Year Comparison, 1980–2002; eBook. Washington, DC: National Center for Education Statistics, Institute of Education Sciences, U.S. Dept. of Education.
  5. Carbonaro, William. 2003. Sector Differences in Student Learning: Differences in Achievement Gains across School Years and During the Summer. Catholic Education: A Journal of Inquiry and Practice 7: 219. [Google Scholar] [CrossRef]
  6. Carbonaro, William. 2006. Public-Private Differences in Achievement among Kindergarten Students: Differences in Learning Opportunities and Student Outcomes. American Journal of Education 113: 31–65. [Google Scholar] [CrossRef]
  7. Carbonaro, William, and Elizabeth Covay. 2010. School Sector and Student Achievement in the Era of Standards Based Reforms. Sociology of Education 83: 160–82. [Google Scholar] [CrossRef]
  8. Chaney, Bradford, Kenneth Burgdorf, and Nadir Atash. 1997. Influencing Achievement through High School Graduation Requirements. Educational Evaluation and Policy Analysis 19: 229–44. [Google Scholar] [CrossRef]
  9. Coleman, James, Thomas Hoffer, and Sally Kilgore. 1982. Cognitive Outcomes in Public and Private Schools. Sociology of Education 55: 65–76. [Google Scholar] [CrossRef]
  10. Crisp, Gloria, Amaury Nora, and Amanda Taggart. 2009. Student Characteristics, Pre-College, College, and Environmental Factors as Predictors of Majoring in and Earning a STEM Degree: An Analysis of Students Attending a Hispanic Serving Institution. American Educational Research Journal 46: 924–42. [Google Scholar] [CrossRef]
  11. Department of Education (US) and Standards National Council on Education, and Testing. 1992. Raising Standards for American Education: A Report to Congress, the Secretary of Education, the National Education Goals Panel, and the American People; Washington, DC: US Government Printing Office, ISBN1 0160360978. ISBN2 9780160360978.
  12. Diamond, Alexis, and Jasjeet S. Sekhon. 2013. Genetic Matching for Estimating Causal Effects: A General Multivariate Matching Method for Achieving Balance in Observational Studies. The Review of Economics and Statistics 95: 932–45. [Google Scholar] [CrossRef] [Green Version]
  13. Domina, Thurston, and Joshua Saldana. 2012. Does Raising the Bar Level the Playing Field? Mathematics Curricular Intensification and Inequality in American High Schools, 1982–2004. American Educational Research Journal 49: 685–708. [Google Scholar] [CrossRef]
  14. Domina, Thurston, Andrew McEachin, Andrew Penner, and Emily Penner. 2015. Aiming High and Falling Short: California’s Eighth-Grade Algebra-for-All Effort. Educational Evaluation and Policy Analysis 37: 275–95. [Google Scholar] [CrossRef] [Green Version]
  15. Domina, Thurston, Paul Hanselman, NaYoung Hwang, and Andrew McEachin. 2016. Detracking and Tracking Up: Mathematics Course Placements in California Middle Schools, 2003–2013. American Educational Research Journal 53: 1229–66. [Google Scholar] [CrossRef] [Green Version]
  16. Domina, Thurston, Andrew McEachin, Paul Hanselman, Priyanka Agarwal, NaYoung Hwang, and Ryan W. Lewis. 2019. Beyond tracking and Detracking: The Dimensions of Organizational Differentiation in Schools. Sociology of Education 92: 293–322. [Google Scholar] [CrossRef]
  17. Downey, Douglas B., and Dennis J. Condron. 2016. Fifty Years since the Coleman Report: Rethinking the Relationship between Schools and Inequality. Sociology of Education 89: 207–20. [Google Scholar] [CrossRef]
  18. Flores, Alfinio. 2007. Examining Disparities in Mathematics Education: Achievement Gap or Opportunity Gap? The High School Journal 91: 29–42. [Google Scholar] [CrossRef]
  19. Frölich, Markus. 2004. Finite-Sample Properties of Propensity-Score Matching and Weighting Estimators. The Review of Economics and Statistics 86: 77–90. [Google Scholar] [CrossRef]
  20. Fullerton, Andrew S. 2009. A Conceptual Framework for Ordered Logistic Regression Models. Sociological Methods & Research 38: 306–47. [Google Scholar] [CrossRef]
  21. Gamoran, Adam. 1996. Student Achievement in Public Magnet, Public Comprehensive, and Private City High Schools. Educational Evaluation and Policy Analysis 18: 1–18. [Google Scholar] [CrossRef]
  22. Gamoran, Adam, and Eileen C. Hannigan. 2000. Algebra for Everyone? Benefits of College-Preparatory Mathematics for Students with Diverse Abilities in Early Secondary School. Educational Evaluation and Policy Analysis 22: 241–54. [Google Scholar] [CrossRef]
  23. Gamoran, Adam, and Robert D. Mare. 1989. Secondary School Tracking and Educational Inequality: Compensation, Reinforcement, or Neutrality? American Journal of Sociology 94: 1146–83. [Google Scholar] [CrossRef]
  24. Hallinan, Maureen T. 1988. Equality of Educational Opportunity. Annual Review of Sociology 14: 249–68. [Google Scholar] [CrossRef]
  25. Hansen, Kajsa Y., and Rolf Strietholt. 2018. Does schooling actually perpetuate educational inequality in mathematics performance? A validity question on the measures of opportunity to learn in PISA. ZDM Mathematics Education 50: 643–58. [Google Scholar] [CrossRef] [Green Version]
  26. Hanushek, Eric A., and Ludger Wößmann. 2006. Does Educational Tracking Affect Performance and Inequality? Differences-in-Differences Evidence across Countries. The Economic Journal 116: C63–76. [Google Scholar] [CrossRef] [Green Version]
  27. Hill, Heather C., Merrie L. Blunk, Charalambos Y. Charalambous, Jennifer M. Lewis, Geoffrey C. Phelps, Laurie Sleep, and Deborah Loewenberg Ball. 2008. Mathematical Knowledge for Teaching and the Mathematical Quality of Instruction: An Exploratory Study. Cognition and Instruction 26: 430–511. [Google Scholar] [CrossRef] [Green Version]
  28. Hoffer, Thomas B. 1997. Social Background and Achievement in Public and Catholic High Schools. Social Psychology of Education 2: 7–23. [Google Scholar] [CrossRef]
  29. Hyde, Janet S., Sara M. Lindberg, Marcia C. Linn, Amy B. Ellis, and Caroline C. Williams. 2008. Diversity. Gender similarities characterize math performance. Science (New York, N. Y.) Journal Article 321: 494. [Google Scholar] [CrossRef]
  30. Jann, Ben. 2017. KMATCH: Stata Module for Multivariate-Distance and Propensity-Score Matching. Statistical Software Components S458346. Chestnut Hill: Boston College Department of Economics, Revised June 16. [Google Scholar]
  31. Joyce, Jeanette, Drew H. Gitomer, and Charles J. Iaconangelo. 2018. Classroom Assignments as Measures of Teaching Quality. Learning and Instruction 54: 48–61. [Google Scholar] [CrossRef]
  32. Karlson, Kristian Bernt, Anders Holm, and Richard Breen. 2012. Comparing Regression Coefficients between Same-sample Nested Models Using Logit and Probit: A New Method. Sociological Methodology 42: 286–313. [Google Scholar] [CrossRef]
  33. Kelly, Sean. 2004. Do Increased Levels of Parental Involvement Account for Social Class Differences in Track Placement? Social Science Research 33: 626–59. [Google Scholar] [CrossRef]
  34. Kelly, Sean. 2009. The Black-White Gap in Mathematics Course Taking. Sociology of Education 82: 47–69. [Google Scholar] [CrossRef] [Green Version]
  35. Kelly, Sean. 2010. The Prevalence of Developmental Instruction in Public and Catholic Schools. Teachers College Record 112: 2405–40. [Google Scholar]
  36. Kelly, Sean. 2019. Sorting Students for Learning: Eight Questions about Secondary School Tracking. In Education & Society: An Introduction to Key Issues in the Sociology of Education. Edited by Domina Thurston, Benjamin G. Gibbs, Lisa Nunn and Andrew Penner. Berkeley: University of California Press, pp. 178–91. [Google Scholar]
  37. Kelly, Sean, and Richard Majerus. 2011. School-to-School Variation in Disciplined Inquiry. Urban Education 46: 1553–83. [Google Scholar] [CrossRef]
  38. King, Gary, and Richard Nielsen. 2019. Why Propensity Scores Should Not Be Used for Matching. Political Analysis 27: 435–54. [Google Scholar] [CrossRef] [Green Version]
  39. Kohler, Ulrich, Kristian Bernt Karlson, and Anders Holm. 2011. Comparing Coefficients of Nested Nonlinear Probability Models. The Stata Journal: Promoting Communications on Statistics and Stata 11: 420–38. [Google Scholar] [CrossRef] [Green Version]
  40. Krashen, Stephen, Syying Lee, and Jeff McQuillan. 2012. Is the Library Important? Multivariate Studies at the National and International Level. Journal of Language and Literacy Education 8: 26–36. [Google Scholar]
  41. Lee, Valerie E., and Julia B. Smith. 1999. Social Support and Achievement for Young Adolescents in Chicago: The Role of School Academic Press. American Educational Research Journal 36: 907–45. [Google Scholar] [CrossRef]
  42. Martin, Danny Bernard. 2009. Liberating the Production of Knowledge about African American Children and Mathematics. In Mathematics Teaching, Learning, and Liberation in the Lives of Black Children. Edited by Danny Bernard Martin. New York: Routledge, pp. 3–38. [Google Scholar]
  43. McDill, Edward L., Gary Natriello, and Aaron M. Pallas. 1986. A Population at Risk: Potential Consequences of Tougher School Standards for Student Dropouts. American Journal of Education 94: 135–81. [Google Scholar] [CrossRef]
  44. Mickelson, Mickelson R., Savannah Larimore Bottia, and Richard Lambert. 2016. The Effects of School Composition on K-12 Reading and Math Achievement. School Integration Matters: Research-Based Strategies to Advance Equity, 56–72. [Google Scholar]
  45. Minor, Elizabeth Covay, Laura M. Desimone, Kailey Spencer, and J. R. Phillips Kristie. 2015. A New Look at the Opportunity-to-Learn Gap across Race and Income. American Journal of Education 121: 241–69. [Google Scholar] [CrossRef]
  46. Montt, Guillermo. 2011. Cross-national Differences in Educational Achievement Inequality. Sociology of Education 84: 49–68. [Google Scholar] [CrossRef]
  47. National Science Board (US). 2008. Science and Engineering Indicators 2008. Arlington, VA: National Science Foundation. Available online: https://wayback.archive-it.org/5902/20150818072529/http://www.nsf.gov/statistics/seind08/pdf/volume1.pdf (accessed on 29 July 2020).
  48. National Science Board (US). 2016. Science and Engineering Indicators 2016. Arlington, VA: National Science Foundation. Available online: https://www.nsf.gov/statistics/2016/nsb20161/ (accessed on 29 July 2020).
  49. National Science Board (US). 2018. Science and Engineering Indicators 2018. Arlington, VA: National Science Foundation. Available online: https://www.nsf.gov/statistics/2018/nsb20181/ (accessed on 29 July 2020).
  50. Nomi, Takako. 2012. The Unintended Consequences of an Algebra-for-All Policy on High-Skill Students: Effects on Instructional Organization and Students’ Academic Outcomes. Educational Evaluation and Policy Analysis 34: 489–505. [Google Scholar] [CrossRef]
  51. Nomi, Takako, and Stephen W. Raudenbush. 2016. Making a success of “Algebra for all” the impact of extended instructional time and classroom peer skill in chicago. Educational Evaluation and Policy Analysis 38: 431–51. [Google Scholar] [CrossRef] [Green Version]
  52. Northrop, Laura. 2017. Breaking the Cycle: Cumulative Disadvantage in Literacy. Reading Research Quarterly 52: 391–96. [Google Scholar] [CrossRef] [Green Version]
  53. Northrop, Laura, and Sean Kelly. 2018. AYP Status, Urbanicity, and Sector: School-to-School Variation in Instruction. Urban Education 53: 591–620. [Google Scholar] [CrossRef]
  54. Northrop, Laura, Carlin Borsheim-Black, and Sean Kelly. 2019. Matching Students to Books: The Cultural Content of Eighth-Grade Literature Assignments. The Elementary School Journal 120: 243–71. [Google Scholar] [CrossRef]
  55. Powell, Arthur G., Eleanor Farrar, David K. Cohen, Principals National Association of Secondary School, Issues National Association of Independent Schools, and Commission on Educational. 1985. The Shopping Mall High School: Winners and Losers in the Educational Marketplace. Boston: Houghton Mifflin. [Google Scholar]
  56. Riegle-Crumb, Catherine. 2006. The Path through Math: Course Sequences and Academic Performance at the Intersection of Race-Ethnicity and Gender. American Journal of Education 113: 101–22. [Google Scholar] [CrossRef] [Green Version]
  57. Riegle-Crumb, Catherine, and Barbara King. 2010. Questioning a White Male Advantage in STEM: Examining Disparities in College Major by Gender and Race/Ethnicity. Educational Researcher 39: 656–64. [Google Scholar] [CrossRef]
  58. Rowan, Brain P., Richard J. Correnti, Robert J. Miller, and Eric M. Camburn. 2009. School improvement by design: Lessons from a study of comprehensive school reform programs. In Handbook of Education Policy Research. Edited by Skyes Gary, Barbara Schneider and David N. Plank. New York: Routledge, pp. 637–51. [Google Scholar]
  59. Shouse, Roger C. 1996. Academic Press and Sense of Community: Conflict, Congruence, and Implications for Student Achievement. Social Psychology of Education 1: 47–68. [Google Scholar] [CrossRef]
  60. Sørenson, Aage B. 1970. Organizational differentiation of students and educational opportunity. Sociology of Education 43: 355–76. [Google Scholar] [CrossRef]
  61. Sørenson, Aage B., and Maureen T. Hallinan. 1977. A Reconceptualization of School Effects. Sociology of Education 50: 273–89. [Google Scholar] [CrossRef] [Green Version]
  62. Spring, Joel H. 1976. The Sorting Machine: National Educational Policy Since 1945. New York: McKay. [Google Scholar]
  63. Stevenson, David Lee, Kathryn S. Schiller, and Barbara Schneider. 1994. Sequences of Opportunities for Learning. Sociology of Education 67: 184–98. [Google Scholar] [CrossRef]
  64. Stuart, Elizabeth A. 2010. Matching Methods for Causal Inference: A Review and a Look Forward. Statistical Science 25: 1–21. [Google Scholar] [CrossRef] [PubMed] [Green Version]
  65. Teitelbaum, Peter. 2003. The Influence of High School Graduation Requirement Policies in Mathematics and Science on Student Course-Taking Patterns and Achievement. Educational Evaluation and Policy Analysis 25: 31–57. [Google Scholar] [CrossRef]
  66. Tytler, Russell, Jonathan Osborne, Gaye Williams, Kristin Tytler, and John C. Cripps. 2008. Opening up Pathways: Engagement in STEM across the Primary-Secondary School Transition; Canberra: Australian Department of Education, Employment and Workplace Relations.
  67. Van Houtte, Mieke, and A. J. Peter Stevens. 2009. Study Involvement of Academic and Vocational Students: Does Between-School Tracking Sharpen the Difference? American Educational Research Journal 46: 943–73. [Google Scholar] [CrossRef]
  68. Van Houtte, Mieke, Jannick Demanet, and Peter A. J. Stevens. 2012. Self-esteem of Academic and Vocational Students: Does Within-school Tracking Sharpen the Difference? Acta Sociologica 55: 73–89. [Google Scholar] [CrossRef]
  69. Vandenberghe, Vincent, and Stephane Robin. 2004. Evaluating the Effectiveness of Private Education across Countries: A Comparison of Methods. Labour Economics 11: 487–506. [Google Scholar] [CrossRef]
  70. Vanneman, Alan, Statistics National Center for Education, and Sciences Institute of Education. 2009. Achievement Gaps: How Black and White Students in Public Schools Perform in Mathematics and Reading on the National Assessment of Educational Progress; eBook. Washington, DC: National Center for Education Statistics, Institute of Education Sciences, U.S. Dept. of Education.
  71. Wang, Xueli. 2013. Why Students Choose STEM Majors: Motivation, High School Learning, and Postsecondary Context of Support. American Educational Research Journal 50: 1081–121. [Google Scholar] [CrossRef]
  72. Wang, Ke, Amy Rathburn, and Lauren Musu. 2019. School Choice in the United States: 2019. NCES 2019–106. In U.S. Department of Education; Washington, DC: National Center for Education Statistics. Available online: https://nces.ed.gov/pubsearch (accessed on 29 July 2020).
  73. Wilhelm, Anne Garrison, Charles Munter, and Kara Jackson. 2017. Examining Relations between Teachers’ Explanations of Sources of Students’ Difficulty in Mathematics and Students’ Opportunities to Learn. The Elementary School Journal 117: 345–70. [Google Scholar] [CrossRef] [Green Version]
Figure 1. Balancing check of matched sample.
Socsci 09 00137 g001
Table 1. Cumulative Mathematic Course Sequence (MCS) Codes.
Mathematic Course Sequence (MCS)Content
1Less than Algebra I
2Algebra I or Geometry, but not both
3Algebra I and Geometry
4Algebra I or Geometry, with at least one transition course
5Algebra II
6Algebra II with at least one math elective course
7Algebra III or Trigonometry, but not both
8Algebra III and Trigonometry
9Calculus or higher
Table 2. Cumulative Science Course Sequence (SCS) Codes.
Science Course Sequence (SCS)Content
1No big-three course (Physics, Chemistry, Biology)
2One big-three course
3Two big-threes without higher-level course
4Three big-three without higher-level course
5Two or three big-threes with at least one higher-level course
Table 3. Descriptive statistics for student-level covariates.
Sector Means (SE)
Student-Level Covariates Catholic (n = 1851)Public (n = 12,671)Raw Difference
Took Algebra I before 9th grade (1 for yes)0.30 (0.011)0.27 (0.0038)0.033 (0.011) **
Math Std. score at the start of 9th grade54.71 (0.20)50.67 (0.087)4.04 (0.24) ***
Family SES0.55 (0.017)−0.045 (0.0064)0.60 (0.018) ***
Middle school sector (1 for Private)0.75 (0.0010)0.022 (0.0012)0.073 (0.005) ***
Frequency of reading science book before HS 2.22 (0.036)2.19 (0.013)0.030 (0.038)
Hispanic0.15 (0.0083)0.17 (0.0032)−016 (0.009) ~
Gender (1 for male)0.50 (0.012)0.49 (0.0043)0.016 (0.012)
Black0.11 (0.014)0.058 (0.0085)0.053 (0.023) *
Asian0.095 (0.014)0.016 (0.0083)0.079 (0.23) ***
Frequency of taking other courses with mother before HS0.42 (0.036)0.19 (0.016)0.23 (0.046) ***
Frequency of participating math/science activity before HS0.64 (0.026)0.72 (0.011)−0.082 (0.031) **
8th grade most advanced science course 2.35 (0.030)2.07 (0.015)0.28 (0.040) ***
8th grade most advanced math course3.34 (0.032)2.91 (0.017)0.43 (0.046) ***
Frequency of using computer for learning before HS2.23 (0.038)2.16 (0.015)0.069 (0.042) ~
Frequency of taking math courses with mother before HS0.21 (0.041)0.031 (0.017)0.18 (0.048) ***
Frequency of taking science courses with mother before HS0.43 (0.035)0.24 (0.015)0.19 (0.041) ***
~p < 0.10. * p < 0.05. ** p < 0.01. *** p < 0.001.
Table 4. Descriptive statistics for school-level covariates.
Sector Means (SE)
Public (n = 12,671) aCatholic (n = 1851)Raw Difference
Require high-level Science courses b0.091 (0.0025)0.47 (0.012)0.38 (0.0079) ***
Full-time teacher ratio0.96 (0.00058)0.88 (0.0032)−0.081 (0.0020) ***
Mean math achievement50.56 (0.040)54.75 (0.096)4.19 (0.11) ***
Mean SES−0.050 (0.0031)0.55 (0.067)0.60 (0.0087) ***
Require high-level Math courses b0.11 (0.0027)0.51 (0.012)0.40 (0.0084) ***
Offer advanced Physics courses b0.44 (0.0043)0.53 (0.012)0.090 (0.012) ***
Offer advanced Chemistry courses b0.59 (0.0043)0.66 (0.011)0.065 (0.012) ***
% of Hispanic students 13.90 (0.18)9.69 (0.33)−4.20 (0.49) ***
Offer Calculus courses b0.74 (0.0038)0.85 (0.0082)0.11 (0.011) ***
Offer advanced Biology courses b0.65 (0.0041)0.70 (0.011)0.043 (0.012) ***
% of Black students13.23 (0.16)8.92 (0.30)−4.31 (0.43) ***
% of Asian students3.23 (0.061)4.93 (0.25)1.70 (0.19) ***
% free lunch students38.15 (0.20)5.29 (0.34)−32.86 (0.55) ***
Urbanicity
Suburb0.36 (0.0042)30 (0.011)−0.57 (0.012) ***
Town0.13 (0.0029)0.14 (0.0081)0.014 (0.0083) ~
Rural0.28 (0.0039)0.019 (0.0031)−0.26 (0.010) ***
Block schedule0.45 (0.0043)0.19 (0.0091)−0.26 (0.012) ***
Region
Midwest0.24 (0.0037)0.31 (0.011)0.068 (0.011) ***
South0.41 (0.0043)0.33 (0.011)−0.082 (0.012) ***
West0.20 (0.0034)0.091 (0.0066)0.10 (0.0095) ***
a Stand errors are in parenthesis. b 1 for offering or requiring corresponding courses. ~ p < 0.10. * p < 0.05. ** p < 0.01. *** p < 0.001.
Table 5. Constructing measures of course taking using information from the cumulative sequence of courses taken.
Math Course Sequence LevelCollapsed Level of Course Sequence bScience Course Sequence LevelCollapsed Level of Course Sequence
1Less than Algebra ILow1No big-three a courseLow
2Algebra I or Geometry, but not both2One big-three course
3Algebra I and Geometry3Two big-threes without higher-level courseMiddle
4Algebra I or Geometry, with at least one transition course4Three big-three without higher-level course
5Algebra IIMiddle5Two or three big-threes with at least one higher-level courseHigh
6Algebra II with at least one math elective course
7Algebra III or Trigonometry, but not bothHigh
8Algebra III and Trigonometry
9Calculus or higher
a Big-three includes biology, chemistry, and physics. b Collapsed qualitative categories are used in adjacent categories models.
Table 6. Baseline difference in mathematic course sequence (MCS) between different school sectors and Chi square test (n = 14,522).
Mathematic Course Sequence (MCS)Public SchoolCatholic School
Frequency (Expected Frequency) aCumulative Frequency of a Given Level or AboveFrequencyCumulative Frequency of a Given Level or Above
1 Less than Algebra I181 (164.0)12671 (100%)7 (24.0)1851 (100%
2 Algebra I or Geometry, but not both1216 (1220.7)12490 (98.6%)183 (178.3)1844 (99.6%)
3 Algebra I and Geometry966 (876.9)11274 (89.0%)39 (128.1)1661 (89.7%)
4 Algebra I or Geometry, with at least one transition course460 (418.8)10308 (81.4%)20 (61.2)1622 (87.6%)
5 Algebra II2627 (2474.5)9848 (77.7%)209 (361.5)1602 (86.5%)
6 Algebra II with at least one math elective course990 (881.3)7221 (57.0%)20 (128.7)1393 (75.3%)
7 Algebra III or Trigonometry, but not both812 (821.1)6231 (49.2%)129 (119.9)1373 (74.2%)
8 Algebra III and Trigonometry2835 (3023.3)5419 (42.8%)630 (441.7)1244 (67.2%)
9 Calculus or higher2854 (2790.4)2584 (20.4%)614 (407.6)614 (33.2%)
Total12,671 1851
χ2(0.99, 8) = 508.26, p < 0.001. a Expected frequency under mathematical model of independence (part of the Chi-Square calculation).
Table 7. Baseline difference in Science Course Sequence (SCS) between different school sectors and Chi square test (n = 14,522).
Mathematic Course Sequence (MCS)Public SchoolCatholic School
Frequency (Expected Frequency) aCumulative Frequency of a Given Level or AboveFrequencyCumulative Frequency of a Given Level or Above
1 No big-three course333 (306.9)12,671 (100%)18 (44.9)1851 (100%)
2 One big-three course1954 (1782.0)12,338 (97.4%)82 (260.3)1833 (99.0%)
3 Two big-threes without higher-level course4600 (4421.9)10,384 (82.0%)462 (645.9)1751 (94.6%)
4 Three big-three without higher-level course4697 (5021.4)5784 (45.7%)1069 (733.6)1290 (69.7%)
5 Two or three big-threes with at least one higher-level course1087 (1138.9)1087 (8.6%)220 (166.4)220 (11.9%)
Total12,671 1851
χ2(0.99, 4) = 418.31, p < 0.001. a Expected frequency under mathematical model of independence (part of the Chi-Square calculation).
Table 8. Balance check for matching (standard difference and variance ratio).
Balance Check for Standardized Mean Difference
Matching Covariates Raw Sample (n = 14,522)Matched Sample (n = 8199)
Treated UntreatedStd. DIffTreatedUntreatedStd. Diff
Took Algebra I before 9th grade (1 for yes)0.300.270.0650.250.250.00
Math Std. score at the start of 9th grade54.7150.670.4353.5752.730.089
Family SES0.55−0.0450.800.230.160.091
Middle school sector (1 for Private)0.750.0222.270.120.120.00
Frequency of reading science book before HS 2.222.190.0232.252.27−0.081
Hispanic0.150.17−0.0570.0970.0970.00
Gender (1 for male)1.501.490.0261.501.500.00
Black0.110.0580.0660.0910.0910.00
Asian0.0950.0160.0990.0540.0540.00
Frequency of taking other courses with mother before HS0.420.190.130.620.600.012
Frequency of participating math/science activity before HS0.640.72−0.0700.890.870.012
8th grade most advanced science course 2.352.070.192.232.24−0.0096
8th grade most advanced math course3.342.910.263.073.040.016
Frequency of using computer for learning before HS2.232.160.0382.362.330.021
Frequency of taking math courses with mother before HS0.210.0310.0980.520.490.017
Frequency of taking science courses with mother before HS0.430.240.120.600.580.015
Balance Check for Variance Ratio
Matching CovariatesRaw Sample (n = 14,522)Matched Sample (n = 8199)
TreatedUntreatedVar. RatioTreatedUntreatedVar. Ratio
Took Algebra I before 9th grade (1 for yes)0.210.201.060.190.191.00
Math Std. score at the start of 9th grade76.36101.520.7563.5168.860.92
Family SES0.550.551.010.410.440.93
Middle school sector (1 for Private)0.190.0228.55
Frequency of reading science book before HS 2.462.311.060.850.870.97
Hispanic0.130.140.900.0870.0871.00
Gender (1 for male)0.250.251.000.250.251.00
Black0.390.960.410.110.101.00
Asian0.380.920.410.0730.0731.01
Frequency of taking other courses with mother before HS2.433.500.690.390.390.99
Frequency of participating math/science activity before HS1.301.610.810.230.240.95
8th grade most advanced science course 1.752.780.630.420.430.98
8th grade most advanced math course1.813.540.511.191.280.93
Frequency of using computer for learning before HS2.782.800.991.031.050.98
Frequency of taking math courses with mother before HS3.133.790.830.380.381.00
Frequency of taking science courses with mother before HS2.192.780.790.350.360.99
Table 9. Summary of the effect of Catholic schools on STEM course-taking outcomes.
Math Course SequenceScience Course SequenceTotal Math CreditsTotal Science Credits
1 Unadjusted difference0.73 (0.11) ***0.71 (0.12) ***0.24 (0.035) ***0.49 (0.034) ***
2 Regression adjusted difference−0.20 (0.16)−0.11 (0.21)−0.0041 (0.092)0.020 (0.083)
Matched Sample
3 Unadjusted difference (ATE)0.35 (0.081) ***0.13 (0.034) **0.024 (0.076)0.17 (0.059) **
4 Regression adjusted: Matched sample0.11 (0.078)0.17 (0.08) *0.016 (0.057)−0.0025 (0.054)
Linear Model Calculation
5 Unadjusted difference0.97 (0.059) ***0.42 (0.022) ***
6 Regression adjusted for family background0.31 (0.078) ***0.22 (0.032) ***
7 Regression adjusted for family background and school-level covariates0.26 (0.089) **0.098 (0.036) **
~p < 0.10. * p < 0.05. ** p < 0.01. *** p < 0.001.
Table 10. Summary of the effect of Catholic schools on STEM course-taking outcomes within Adjacent track levels.
Adjusted Difference with Logit Multilevel ModelAdjusted Difference with Logit Regression on Matched Sample
Math Course Sequence (Low vs. Middle)−0.04 (0.028)0.14 (0.32)
Math (Middle vs. High)0.77 (0.23) ***0.31 (0.14) *
Science (Low vs. Middle)0.47 (0.26) ~0.56 (0.24) *
Science (Middle vs. High)0.036 (0.026)0.027 (0.15)
~p < 0.10. * p < 0.05. ** p < 0.01. *** p < 0.001.

