Abstract
Research on the motives behind a university professor’s decision to retire is scarce. In the present work, we have tried to define and delimit the aspects of the university professor’s satisfaction that have an influence on their motivation to retire. Nine hundred and one Spanish university professors answered the Inventory “Questionnaire for Active, Retired and Emeritus University Professors.” In the analysis, three structural equations were estimated. The overall sample, as well as the professional status subsamples—active or not active—were taken into account. Significant differences were found according to the work status. Three dimensions explained the satisfaction: economic, professional, and relational. The satisfaction of the professors in each of them had an influence on their decision to retire. Work conditions created by the European Higher Education Area (EHEA) and work conditions due to the educational and/or university laws determined the economic satisfaction to a greater degree. The possibilities of being part of professional networks or teams, and of publishing and disseminating knowledge, have a considerable impact on professional satisfaction. Relational satisfaction was notable for predicting the motivation to retire. Relationships with colleagues had an effect on the relational satisfaction. Policies for improving the satisfaction of the university professors could help delay the exit of talented professors, who are part of the human capital of the universities.
1. Introduction
The increase in the retirement rate of professors in Spanish universities has been noticeable in recent years. Even with the expectation that the economic recession would postpone the retirement plans of many scholars (Arano and Parker 2016), in many institutions in Spain, retirement increased more than 100%, reaching more than 300% in some cases. Due to this, Andradas and González (2012) called attention to the increase of early retirements that were occurring in higher education. According to the report “The Spanish university in numbers,” in regards to academic year 2014–2015 (Hernández Armenteros and Pérez García 2016), the decrease of the professorships at Spanish universities was more than 4%. Despite the institutions themselves promoting early retirement with the Voluntary Retirement Plans, there are different inherent factors in the specific decisions that warrant analysis (Conley 2005). However, research on this topic has been scarce.
The “talent loss,” understood as the departure of professionals who have renowned prestige, extensive abilities, and great experience, causes major losses for university organizations. These losses not only negatively affect the quality of service provided, but also have a detrimental effect on the visibility and reputation of the institution itself. Thus, if these professors can be convinced to continue working under the figure of the emeritus professor, this will not only emotionally favor the professors themselves, as they will better adjust to their new life, but the university itself as well (Chase et al. 2003).
The current situation of the Spanish university concerning the emeritus professors is not flattering. These professors begin to feel dissatisfied with the manner of promoting professorship and the selection policy, with the uncertainty about the current study plans, worry about the quality of the teaching, and also the scarcity of funds or the politicization of the organization (Lacambra and González 2018). The students are perceived as “immature” (intellectually as well as emotionally), lacking intrinsic motivation, curiosity, or interest for performing tasks that lack immediate benefits, lacking awareness about their role as university students (Alonso et al. 2015). In these conditions, the professors’ feelings of emotional depletion and the lack of satisfaction with work increase, decisively influencing their decision to retire (Van Droogenbroeck and Spruyt 2014).
The feelings of burnout and being worn out and exhausted at work are commonly found in service-related occupations, where there is frequent and direct contact with people who are being served (Guerrero Barona and Rubio Jiménez 2005). Thus, burnout is well represented among university professors. In fact, in higher education, not only are the pressures of time or the decrease of collegiality shown to be some of the causes of burnout in professors, but the great numbers of students is also a decisive variable (Watts and Robertson 2011).
Aspects such as ambiguity and role conflicts, the demotivation of the students, the lack of support materials for the work, time pressures, the excessive administrative work, the decrease of the social value of the teaching profession, the loss of control and autonomy at work, and the lack of support from colleagues, shape the basis of the professor’s discomfort (Cornejo Chávez and Quiñónez 2007). Related to this, Korunka et al. (2010) stated that the lack of good organization at work is the basis for this problem.
The main characteristics of burnout, derived from chronic emotional stress, are physical and/or psychological tiredness. These, together with the feeling of not being able to do more (emotional exhaustion), result in a cold and impersonal attitude towards others (depersonalization) and a feeling of inadequacy related to their post at work and the tasks that the person affected performs, with a low personal and professional achievement (Guerrero Barona and Rubio Jiménez 2005, p. 28). As a consequence, symptoms of anxiety, depression, demotivation, or aggressiveness are found (Latorre 2005), and, by extension, the work stress of university professors negatively affects their efficient work performance and their commitment with the University as well as the interpersonal relationships and levels of collegiality (Gillespie et al. 2001).
Based on the reasons above, it could be thought that this situation requires proposals that minimize problems so that the quality of education is not damaged. Guerrero Barona (2001) pointed out that, in the university sphere, proposals of organizational interventions to improve the conditions and the work environment are more convenient, as long as these are accompanied by stress control programs and initial and permanent training of the professors. In a posterior study, Guerrero Barona and Rubio Jiménez (2005) specified intervention proposals at the individual and the personal levels, as well as at the social and organizational ones.
Burnout in scholars is favored by the demands and resources at work and their personal characteristics, and is related to different indicators of occupational well-being such as work satisfaction (Sabagh et al. 2018), with this last being strongly correlated with burnout (Faragher et al. 2005). Professors have identified different reasons for retiring (Dorfman 2002), and their reasons behind their intent to retire, as well as their burnout, have been correlated with other factors that are not work-related, such as the quality of the marriage: when the marriage is strong, the intention to retire is strongest (Henkens and Leenders 2010).
Taking into account these various factors, it can be stated that making the decision to retire from academics is a complex process, so that its examination could be difficult (Baldwin et al. 2018). In this work, we will focus on the analysis of the topics and subject matters related to satisfaction, which seems to motivate university professors to retire.
When professors feel competent enough to practice their profession, when they feel that good results are obtained, and also believe that the institution does, in fact, recognize their achievements and supports them by improving the work conditions, they feel satisfied (Marchesi 2012). The guidelines of the organization and the university policy, as well as the institutional culture, among others, have an effect and condition the satisfaction of the professors (Palomares 2009). The organization’s system plays an important role in job satisfaction for teachers and other educators (Guo and Wang 2017).
While work stress has a negative impact on satisfaction at work, the following factors are also positively associated to it (Pan et al. 2015): the perceived organizational support, psychological capital and higher monthly income. The higher education employees focus on high salaries and fair promotion systems (Chen et al. 2006). For this, Bozeman and Gaughan (2011) classified the determinant factors of work satisfaction of university professors into three categories: demographic characteristics, colleague interactions, and extrinsic pay motivation.
The results showed that, on the one hand, the professors tended to be satisfied if their salary reflected their market value and if they maintained good relationships with their colleagues and perceived that they were respected. On the other hand, on the levels of satisfaction, there were differences according to gender (Bataineh 2014; Rahman and Parveen 2006), age (Guo and Wang 2017; Pan et al. 2015), the professional category (Qayyum Ch 2013), or the area of knowledge (Sabharwal and Corley 2009).
Satisfaction is shaped and defined by relationships with other people, colleagues, or students (Ernst and Ozeki 1998; González 2013), or by the teaching work itself, and has been linked to research framed within the professional sphere (Geyskens and Steenkamp 2000; Herranz Bellido et al. 2006). Satisfaction has also been linked to the economics of work performance, mainly represented by the salary earned (Nieto and Riveiro 2007; Wertz et al. 1988).
In Spain, retirement is automatically declared when the worker is 65 years old, as long as the worker has accumulated at least 15 years of service. After this age, it is possible to solicit an extension for retirement until the age of 70. Also, after the age of 60, it is possible to solicit a voluntary retirement if the necessary conditions are met (Royal Decree-Law 670/87).
The main objective of the study was to explain the motivations behind retirement of Spanish university professors as related to their satisfaction. The research questions that guided the present work were: What factors determine the professional satisfaction of university professors? What differences are found within the factors that affect the satisfaction according to the professional situation? Does satisfaction have an effect on the motivation for retirement?
2. Results
2.1. Descriptive Analysis of the Results
A descriptive summary of the main variables studied is displayed in Table 1. This will, in itself, act as a tool for principal component analysis (PCA) in order to simplify the number of variables that are used in self-organizing map analysis and constituting the professors’ groups according to their satisfaction and their motivation for retirement. It may also help to obtain a predictive analysis of the structural equations (SEM).

Table 1.
Descriptive analysis of the main variables studied in the sample (minimum 1; maximum 4).
The average for most of the variables is higher than 2.5 and the standard deviation is lower than 1. However, it has not been the same with teaching and work conditions due to the education and/or university laws, workload, the economic conditions, the characteristics and/or behaviors of the students, the relationships with their superiors or university administrators, the professor’s family/personal situation and their state of health.
2.2. Principal Component Analysis
To simplify the number of variables of this analysis, a principal component analysis has been made and the following results were obtained. For the satisfaction variable, 68.18% of the explained variability was found, with a value of 0.75 for the Kaiser–Myer–Olkin test (KMO), and a p-value that confirmed the significance of the analysis. The following five types of principal components were found (see Table 2):

Table 2.
Component matrix of the satisfaction.
- 1st component (F1): High satisfaction with practically all the factors.
- 2nd component (F2): Low satisfaction, except for the factors related to the students and teaching.
- 3rd component (F3): Very high satisfaction with the economic conditions and professional stability. Low with the rest, except for the possibility of shaping the relationships with their superiors.
- 4th component (F4): High satisfaction with the economic conditions and professional stability, although low due to the changes resulting from the EHEA and laws.
- 5th component (F5): Medium levels, except for the relationship-related factors (colleagues and superiors), which are low.
For the variable motivation for retirement, an explained variability value of 55.12% was obtained with two components. The KMO index was 0.806 with a p-value associated below 0.001, that is a measure of adequacy of the correlation matrix to perform the factor analysis. From the component matrix, the following groups were found (see Table 3):

Table 3.
Component matrix of the motivation for retirement.
- 1st component (MOT1): The motivations that were lightly underlined were health and family.
- 2nd component (MOT2): The motivations that were underlined were the others with negative weights found for health and family.
Based on this principal component analysis, the theoretical model proposed is shown in the scheme observed in Figure 1. In it, besides the three dimensions identified with the variable satisfaction, other variables are also indicated, which affect the motivation for retiring, such as workload or economic conditions, among others. Thus, the present research work takes into account the findings from previous studies. The relationships of causality will be confirmed through the SEM model. For this, a self-organizing map (SOM), which will be used to detect the association between the different dimensions of satisfaction and motivation, will be created.
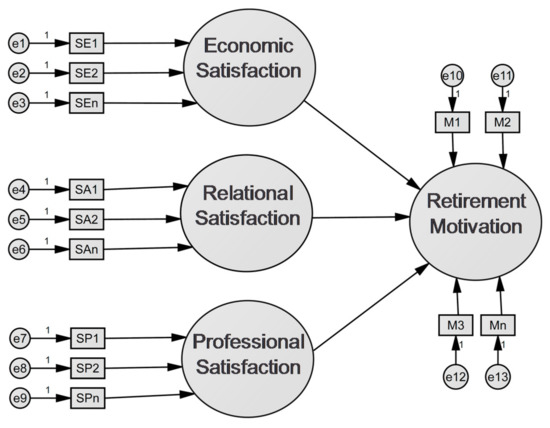
Figure 1.
General scheme of the model.
2.3. Self-Organizing Map Analysis (SOM)
Thanks to the principal component analysis, we have simplified the number of variables to seven components. These are the input variables of the SOM, which will help us to constitute the professor groups according to their satisfaction and their motivation for retirement. Figure 2 shows the groups obtained by the SOM. Seven groups have been constituted, where it can be observed, on the one hand, the existing relationship of professional satisfaction with the motivation to retire as related to economic and work aspects (the workload, the economic, or the relationship with their superiors). On the other hand, it was observed that there was a relationship between the satisfaction related to relationships with colleagues and students and the motivation linked to family and health aspects. Therefore, three models will be established: a general, overall one where the importance of the type of satisfaction is observed with the overall satisfaction (model 1), another model where the intent to retire is examined with respect to the satisfaction for the active professors (model 2) and another model for the nonactive professors (model 3).
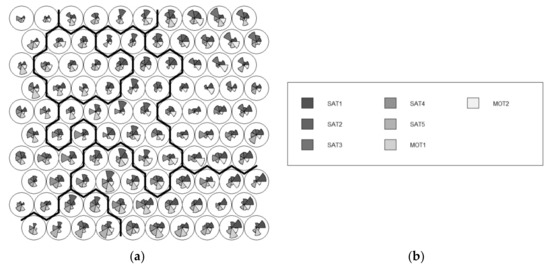
Figure 2.
Code Map. Self-organizing map (SOM) results; (a) Code map showing the intensity/importance in each of the groups of each of the factors (Sat1, Sat2, Sat4, Sat5, Mot1 and Mot2); (b) legend where the color of each of them appears.
With these results, it can be noted that:
- The motivations linked to the professional aspects are considered most by the active and nonactive professors for their decision to retire.
- The motivations related to health and family refer to the group of already-retired professors.
Then a comprehensive (global) structural equations model and two other differentiated models, one for the active professors and another for the nonactive ones, will be created. To obtain the final models, we have taken into account the scores of each of the variables obtained in the principal components analysis and the significant differences of the groups constituted in the SOM analysis for each of the variables as related to the satisfaction and the motivation for retirement. The process followed in order to obtain each of the three final models presented next, were:
- The elimination of the variables and relationships that did not comply with the individual criteria of reliability through iterative cleaning processes.
- Respecification of the model to improve the global adjustment indicators, taking into account estimated co-variances, residuals, and variances.
2.4. Predictive Analysis of the Results
The model intends to estimate the effects of the dimensions economic satisfaction, professional satisfaction, and relational satisfaction on the motivation to retire. The model is composed by three latent variables and one exogenous one named Overall satisfaction. The model assumes that the three dimensions cited explain satisfaction, which are related, and predict the motivation to retire. Next, the factors that affected the relational and professional satisfaction, which had the greatest weight in model 1, will be examined, as related to the intention of the active professors for retiring (model 2), as well as the motivation possessed by the nonactive professors (model 3).
In global model 1 (see Figure 3), it was observed that the work conditions created by the EHEA and the work conditions due to the educational and/or university laws determined the economic satisfaction to a greater degree. Relational satisfaction, defined by the behavior and the attitudes of the students and the relationships with other colleagues, had the most influence on global satisfaction. Professional satisfaction was mainly defined by the possibility of being part of professional networks or teams, to travel and attend professional meetings, scientific congresses, etc., and the easiness for continuous learning.
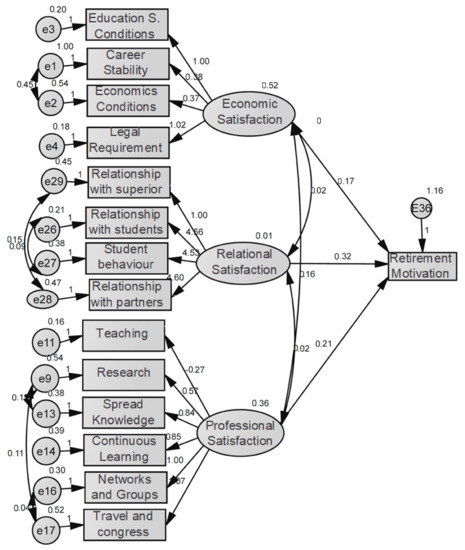
Figure 3.
Model 1 path diagram: Influence of economic, relational, and professional satisfaction in the overall satisfaction.
Model 2 (see Figure 4), based only on the sample of active professors, considered the results obtained from the Kohonen networks, and the results obtained in model 1, where it was observed that, after relational satisfaction, professional satisfaction had the most weight in the case of the active professors. In this sense, in this model, the motivations linked to health and family conditions were discarded, as well as the factors linked to the relational and economic satisfaction, as they were not significant for the fit of the global model. It could be observed that the greater the motivation with respect to the professional satisfaction, the greater the intention will be linked to economic matters, relationships with their superiors and workload aspects, as far as the motivation to retire of the active professors.
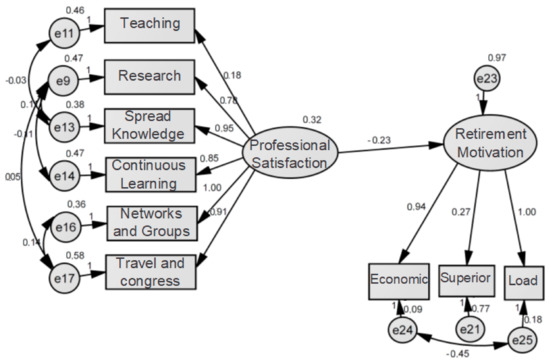
Figure 4.
Model 2 path diagram: Influence of professional satisfaction on the motivation to retire of active and emeritus professors.
If the direct and indirect impacts are analyzed, it is observed that the importance of each of the factors is conserved. In professional satisfaction, the possibility of being part of professional networks or teams is underlined, followed by the possibility of publishing and disseminating knowledge. The low weight of the teaching duties was also notable. As for the motivation to retire, the main motives that were alluded to, according to the model, were the economic conditions, followed by the workload. See Table 4.

Table 4.
Standardized total effects of model 2.
Lastly, in the model created based only on the sample of nonactive professors (model 3, see Figure 5), the relational satisfaction was notable for predicting the motivation to retire, fundamentally based on the factors related to family and health conditions. Thus, if the satisfaction with the relationships of the students, colleagues, and superiors was high, it signified that the motivation they had for making the decision to retire was not professional, but external to this sphere, thus related to the factors that appeared in the model (family- or health-related conditions).
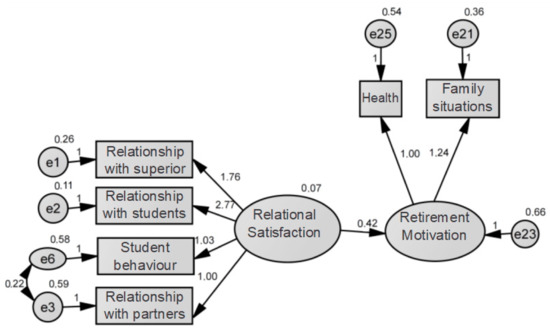
Figure 5.
Path diagram of model 3: influence on the relational satisfaction on the motivation to retire of nonactive professors.
Table 5 shows the standardized total effects of model 3. It was observed that the behavior and attitudes of the students exerted the greatest influence, followed by the relationships with students, and lastly, the relationships with colleagues and the relationships with their superiors. As for their motivation, the family conditions were fundamentally highlighted as the main motive.

Table 5.
Standardized total effects of model 3.
Lastly, the summary data of the different models are presented, where it is observed that the reliability of the different models is adjusted to estimated values, although the most-favorable data are those observed for models 2 and 3, which explain the motivation of the active and nonactive professors in more detail. See Table 6.

Table 6.
Summary of the “model data fitness”.
3. Discussion
The decision that university professors have to make once they reach retirement age, of staying active or not, is conditioned by situational and personal factors, although the main motivation seems to come from the interest and commitment that affect the making of this decision (Boulton-Lewis and Buys 2014). Also, it should be highlighted that despite the scholars being motivated by the work itself, the work conditions aroused less motivation (Castillo and Cano 2004). The satisfaction related to the organizational factors is very much divided among aspects that raise sympathies such as the relationships among colleagues, as opposed to others that do not, such as the opportunities for promotions (Zaman et al. 2014). Among the factors that cause dissatisfaction (Munyengabe et al. 2017; Schulze 2006), we found the workload and level of stress, research-related aspects such as the lack of time to conduct research, time spent on administrative work or working conditions, and opportunity for advancement. Machado Taylor et al. (2016) found that the scholars felt less satisfaction with the research climate and conditions of employment, while they expressed more satisfaction with the teaching climate and colleagues. In summary, this work confirms the effect of satisfaction of the university professors on their motivation to retire. As for the satisfaction itself, there were three factors that could explain it: economic, professional, and relational dimensions. Addressing this triple perspective of satisfaction is a sine qua non condition for the understanding of the causal model defined with respect to motivation.
The teaching work satisfaction—and its motivation—not only depends on salary conditions (Machado et al. 2011). The work environment has an equal impact on it (Hanaysha 2016), with everything related to the students being the main source of motivation and demotivation, as Kızıltepe (2008) defines as the vocational factor of teaching. In fact, the lack of social relationships with the students is one of the reasons why the professors wish to return to the teaching activity (Souto Santos et al. 2016).
As significant differences have been observed as a function of the professional status, meaning, between the active and nonactive professors, it was necessary to create three models. In the overall (global) model, the weight of the work conditions provoked by the EHEA and the education laws on the economic satisfaction were underlined. Also, the importance of the behavior and the attitudes of the students and the relationships with the colleagues had an effect on the relational satisfaction. Lastly, the relevance of the possibility of being part of professional networks or teams, or to travel to attend professional conferences or meetings and the easiness for continuous learning, on the professional satisfaction, were deemed important.
In the second model, only the active professors were considered. The importance of the professional satisfaction on the motivation to retire was observed on aspects such as the workload, the relationship with their superiors, or the economic retribution. Lastly, on the third model, which exclusively considered already-retired (nonactive) professors, attention was drawn to the importance of the relational satisfaction for predicting the motivation to retire. If the satisfaction with the relationships with students, colleagues, and professors was high, the reason that was alluded to for retirement was mainly due to family or health conditions; therefore, factors that were external to the professional sphere.
Landon and Ritz (2016) called attention to the fact that most retirement models focused too much on financial resources, such as income, when other factors also existed that conditioned the decision to retire, apart from the finances and the benefits for health. These authors sustained the urge to broaden the focus of research to address what truly has an effect on making this decision. In this sense, the current work presents a broad approach to the factors associated to the satisfaction of scholars that determine the motivation to retire.
4. Materials and Methods
4.1. Design and Procedure
This research is part of a broader study that follows the mixed method named by Creswell and Garrett (2008), as explanatory sequential design, according to which, some qualitative results are utilized to explain other quantitative ones. Thus, a first stage of quantitative research was conducted followed by a second stage where a qualitative methodology was utilized.
In the extensive phase, a questionnaire was written and validated, and it served for the gathering of data. It was directly distributed among university professors, as well as among academic administrators, so that they could support the task of distribution. During the 2017–2018 academic year, data was collected. The data collected was analyzed after receiving the completed questionnaires. During the intensive phase, an interview script was prepared, and a reduced sample was chosen from the group of professors who had answered the questionnaire. These professors were interviewed, and the information provided by them was analyzed. The analysis of the objectives in this work was conducted based on the previous analysis of the data obtained in the first phase of the research study.
4.2. Participants
The sample for this research work was composed of 901 Spanish university professors who had agreed to answer the data collection inventory. Thus, the convenience, nonprobabilistic sampling was utilized.
Men composed 59% of the sample, and 41% were women; 89% of the participants were aged 60 or less (see Figure 6). The professors belonged to the eight universities in Andalusia, as well as to the University of Las Palmas de Gran Canaria, University of Deusto, and the National Distance Education University (UNED). Only one of these universities was private. The university professors from these eleven Spanish universities comprised the study population.
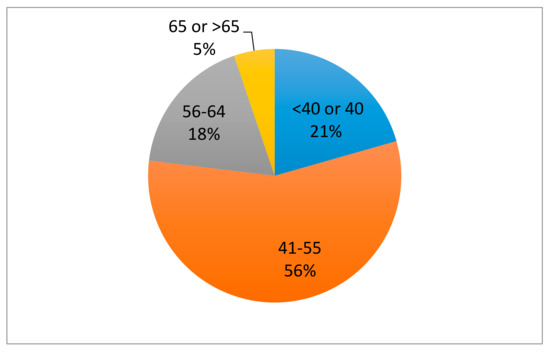
Figure 6.
Age of sample.
The professors in the sample taught within every area of knowledge. Of note, 39.6% were Social and Legal Sciences professors (see Figure 7). The professional category of 41% of them was Full Professor. Also, 28.6% had between 21 and 30 years of experience (see Figure 8), 97% were active, and 3% retired.
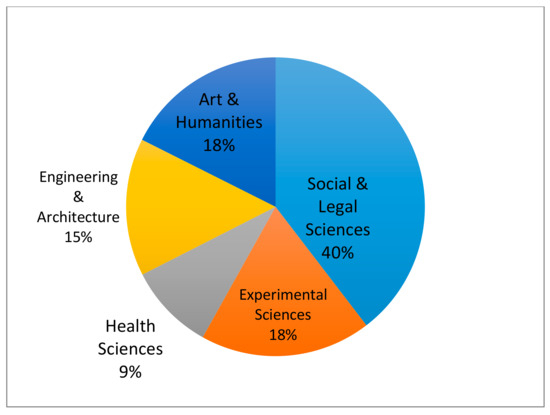
Figure 7.
Area of knowledge.
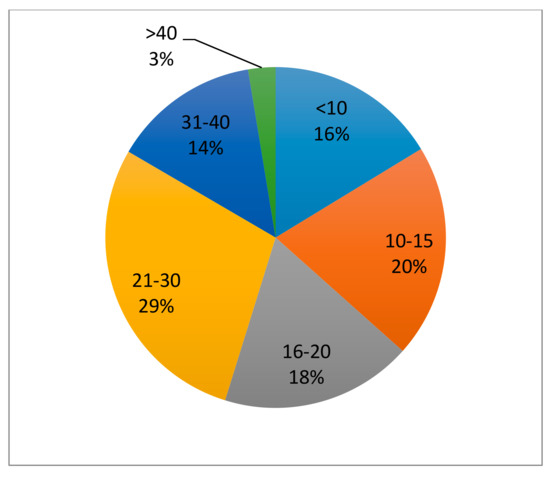
Figure 8.
Years of experience.
4.3. Survey
The data collection instrument was designed ad hoc. The “Questionnaire of active and nonactive university professors” was composed by a total of 86 close-ended questions that were organized into two blocks. The questions that all the professors had to answer regardless were placed in the first block. The first series of questions allowed for learning about the samples’ sociodemographic variables and professional status. These were: gender, age, current post, and years of teaching experience. The following set of questions was focused on their background. These alluded to the conditions of access to the university, as well as others that referred to their professional trajectory within the institution. Among these we find: access route to the university, vital moment of incorporation to the university, reasons why the professor opted for the university profession, to take stock of their passage through the university, management positions, reasons for general professional satisfaction, and influence of the work conditions on family relationships. Lastly, the degree of satisfaction with the new functions and obligations derived from the European Higher Education Area (EHEA) was inquired about, as well as what improvements could be done.
The second block contained the questions that directly referred to their professional satisfaction. This was differentiated according to their professional status: active, emeritus, or retired. The active professors were asked to provide the reasons for their professional satisfaction/dissatisfaction, the motives behind their thinking about retirement, the possible future relationship with the university after retirement that they would like to have, and life projects after retirement. As for the retired professors, we were interested in knowing about the retirement conditions, such as the reasons behind their decision to retire, the feelings they experienced around their retired status, and the university activity conducted on their first year of retirement. The questions for the emeritus professors revolved around the feelings of their complete retirement from the university activity, the possible reasons that could lead them to resign from their status, or the life projects they had after their complete retirement.
From the questionnaire, although the inclusion of other variables was verified, the following variables observed (those that measured the subjects) served to contrast the model:
- Overall satisfaction. The subjects were asked to take “stock of their passage through the University.” The possible answers were: very positive, positive, negative, and with ups and downs.
- Satisfaction. The subjects were asked to “score to what degree the following circumstances and/or motives contributed to their professional satisfaction.” The response options were: none, little, a lot, and much. The aspects to be scored were: (1) Professional stability, (2) Economic conditions, (3) Research as a professional activity, (4) Conditions for conducting research, (5) Teaching, as a professional activity, (6) Conditions for teaching, (7) Relationships with students, (8) Student’s behavior and attitudes, (9) Relationships with colleagues, (10) Relationships with their superiors or university administrators, (11) The possibility of publishing and disseminating knowledge, (12) The easiness for continuous learning, (13) The professional conditions (rhythm at work, flexible working hours …), (14) The possibility of being part of professional networks or teams, (15) The possibilities of traveling and attending meetings, professional conferences, etc., (16) The teaching conditions as a result of the EHEA, and (17) Work conditions as a result of educational and/or university laws.
- Motivation. The subjects were asked about “to what degree the following reasons pushed (would push) you to make the decision to retire?” The response options were: none, little, a lot, and much. The reasons to evaluate were: (1) The workload, (2) The economic conditions, (3) The characteristics and/or behavior of the students, (4) The relationship with the colleagues, (5) The relationships with their superiors and/or university administration, (6) The implementation of the European Higher Education Area, (7) The appearance of new tasks to be done, (8) Family conditions, and (9) My own state of health.
4.4. Analysis
To reach the objectives, the structural equation model (SEM) for multiple groups was used. The SEM allows for investigating the relationships between theoretical concepts (latent variables constructed through factorial analysis), at the same time that the error of the observed variables is simultaneously monitored. For this, we start with the observed variables that serve to measure the theoretical concepts of the model, from which an appropriate Cronbach’s Alpha must have been obtained for a previous factorial analysis. For this study, it was also important to verify how this model worked for the different groups studied: active and nonactive professors.
A complete structural equation model consists of two fundamental parts: the measurement model and the structural relations model. The measurement model contains the manner in which each latent construct is measured through their observable indicators, the errors that affect the measurements, and the relationships that are expected to be found between the constructs when these are related to each other. In a complete model, there are two measurement models, one for the predictive variables, and another for the dependent variables. The model of structural relations is the one that should truly be estimated. Based on this model, the overall significance is studied, with indicators such as the Comparative Fit Index (CFI), as well as the weights of the relationships between the different variables through the table of standardized total effects.
The classification of the data was initialized according to the main latent and control variables. Afterwards, the SEM analysis was performed with the data collected in all the questionnaires with the SPSS software program. Also, with the SPSS AMOS program, the multivariate data corresponding to the verification of the possible theoretical construct were analyzed.
In a first approach, a principal component analysis was performed in order to reduce the dimensions of the variables linked to satisfaction and motivation. Thanks to this analysis, it was possible to explain the relationship of the rest of the variables with respect to the satisfaction of the professors. All of these variables, therefore, provide information on the circumstances that contribute to the satisfaction of an individual. To detect the association between the different types of satisfaction and motivation among the professional groups, the methodology used to establish the analysis of structural equations was Self-Organizing Maps (SOM). The objective of constructing a SOM model was to categorize the data according to groups and to classify similar values in the same category, in order to better understand the variables that were related with satisfaction and the motivation for retirement. Based on evidence discovered at the cerebral level in 1982, Kohonen presented a model named self-organizing maps. These consisted of networks composed of two layers, where there was a competition of neurons from the output layer, as shown in Figure 9. It was classified within the unsupervised networks, as there is no external master that indicated if the neural network was operating correctly or incorrectly, as there was no exit objective that the neuronal network has to tend to. Due to this, according to Recknagel (2006), not only were the weights of the winning neuron updated, but also the weights of the neighboring neurons, with a neighbor function defined, f(I,i*), where i* is the winner neuron.
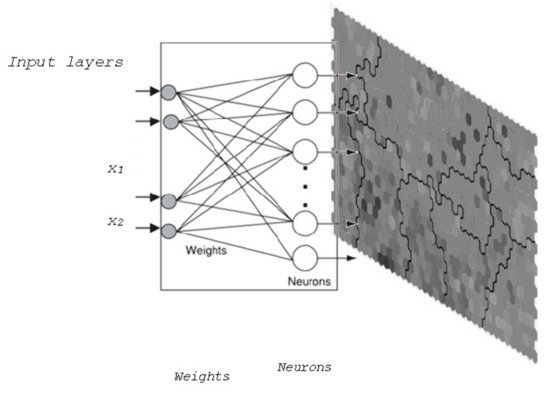
Figure 9.
SOM representation. Source: Recknagel (2006) and author created.
Due to the final bidimensional exit, the SOM could be understood as a projection from a high dimensional data space to a bidimensional map of neurons. The special characteristic of the neurons in the output layer resides in the lateral connections of excitation and inhibition, even though they are not connected between themselves. The formula for updating the growth with a weight vector Wv(s) is:
The other technique used was the structural equation model. This is framed within the family of multivariate statistical models, and allows for the estimation of the effect and relationships between multiple variables. The origin of the structural equation models was provoked by the need to equip regression models with greater flexibility, as these were too restrictive. As opposed to these, as according to Lee (1990), the structural equation models allow for the inclusion of measurement errors in the criteria variables (dependent), as well as the predictive ones (independent). A way of thinking about these models is as various models of factorial analysis with the advantage of being able to observe the direct and indirect effects among the factors.
If some fundamental aspect of these types of models has to be underlined, it is that they allow for proposing the type and direction of the relationships that are hoped to be found among the diverse variables contained within it, and in this way, posteriorly move on to the estimation of the parameters, which are specified by the relationships proposed at the theoretical level. Due to this fundamental characteristic of “confirming” the relationships proposed at the theoretical level through the analysis of the sample, they are also called confirmatory models.
Measurement model (where s are the weights of the latent factors in x and y, respectively, see Appendix A):
Structural model ( are the weights of the exogenous and endogenous latent factors in ):
The main indicators that are used to verify if the structural equation model is optimal, are, on the one hand, the “relative chi-square” . The lower this value, the better the fit, although authors indicate that there is an important fit if it is below 5 (Marsh and Hocevar 1985). As these types of indicators are very sensitive when dealing with large samples, as in the present case, the CFI will also be used. Values above 0.9 and near 1 means that we are dealing with a good fit (Bentler 1990). Lastly, the Root-Mean-Square Error of Approximation or RMSEA will also be utilized, which will be considered acceptable if values are close to 0.05 and lower than 0.08 (Browne and Cudeck 1992).
Summarizing, the steps followed to perform the SEM analysis were the following:
- Descriptive summary of the main variables studied.
- Main components analysis to simplify the number of variables.
- SOM to constitute the professor groups according to their satisfaction and their motivation for retirement.
- Predictive analysis of the structural equations (SEM).
5. Conclusions
University professors’ satisfaction has an effect on their motivation to retire. Three factors explain the satisfaction: economic, professional, and relational. Work conditions created by the EHEA and due to the educational and/or university laws determined the economic satisfaction to a greater degree. The possibility of being part of professional networks or teams, and of publishing and disseminating knowledge, have a considerable impact on professional satisfaction. Relationships with colleagues had an effect on the relational satisfaction. If the satisfaction with the relationships of the students, colleagues and superiors were high, it would signify that the reason connected to deciding to retire was not professional, but external to this sphere, thus related to family- or health-related conditions.
For university leaders and politicians, the results could serve to promote strategies and measures for retirement or permanence of the older scholars, but could also serve to seek ways to improve satisfaction at and with work, in regards to delaying the exit of talented professors.
Author Contributions
Conceptualization, R.R.T. and C.M.R.; Formal analysis, M.C.M.; Funding acquisition, C.M.R.; Investigation, R.R.T., C.M.R., and C.Y.D.; Supervision, C.Y.D.; Writing—original draft, R.R.T., C.M.R., C.Y.D., and M.C.M. All authors have read and agreed to the published version of the manuscript.
Funding
This research was funded by the Ministry of Economics and Competitiveness, grant number EDU2012-37068.
Conflicts of Interest
The authors declare no conflict of interest.
Research Ethics
The authors confirm that the participants in the sample were correctly informed about the aim of the study. In the data collection inventory, confidential and anonymous nature of the data was described.
Abbreviations
| s | step index |
| t | input vector in the set of input data D |
| D(t) | input vector of index t of the set of input data D |
| v | index of a neuron in the map |
| Wv | weight vector of neuron v |
| v | index of the Unit of Better Correspondence on the map |
| neighborhood function | |
| learning restrain due to the iteration progress |
Appendix A
m = endogenous latent variables, η = (η1,…,ηm)
n = exogenous latent variables, ε = (ε1,…,εn)
p = indicators of all the endogenous latent variables y = (y1,…,yp)
q = indicators of all the exogenous latent variables x = (x1,…,xq)
References
- Alonso, J. Felipe Trillo, María Ainoa Zabalza Cerdeiriña, and Ana Parada Gañete. 2015. La visión del profesorado emérito sobre los estudiantes: Aprendiendo de los mayores. REDU. Revista de Docencia Universitaria 13: 143–69. [Google Scholar] [CrossRef]
- Andradas, Carlos, and Julio González. 2012. Cuestiones prospectivas del profesorado universitario. Revista Catalana de Dret Públic 44: 191–224. [Google Scholar]
- Arano, Kathleen G., and Carl Parker. 2016. The great recession and changes in faculty expected retirement age. Journal of Economics and Finance 40: 127–36. [Google Scholar] [CrossRef]
- Baldwin, Roger, Angie Belin, and Bert Say. 2018. Why Reinvent Academic Retirement? New Directions for Higher Education 182: 9–16. [Google Scholar] [CrossRef]
- Bataineh, Omar T. 2014. The Level of Job Satisfaction among the Faculty Members of Colleges of Education at Jordanian Universities. Canadian Social Science 10: 1–8. [Google Scholar] [CrossRef]
- Bentler, Peter M. 1990. Comparative fit indexes in structural models. Psychological Bulletin 107: 238–46. [Google Scholar] [CrossRef]
- Boulton-Lewis, Guilliam M., and Laurice Buys. 2014. Older Academics: Motivation to Keep Working. World Journal of Education 4: 66–77. [Google Scholar] [CrossRef]
- Bozeman, Barry, and Mónica Gaughan. 2011. Job Satisfaction among University Faculty: Individual, Work, and Institutional Determinants. The Journal of Higher Education 82: 154–86. [Google Scholar] [CrossRef]
- Browne, Michael W., and Robert Cudeck. 1992. Alternative ways of assessing model fit. Sociological Methods & Research 21: 230–58. [Google Scholar] [CrossRef]
- Castillo, Jaime X., and Jamie Cano. 2004. Factors explaining job satisfaction among faculty. Journal of Agricultural Education 45: 65–74. [Google Scholar] [CrossRef]
- Chase, Clinton I., Susan J. Eklund, and Linda M. Pearson. 2003. Affective responses of faculty emeriti to retirement. Educational Gerontology 29: 521–34. [Google Scholar] [CrossRef]
- Chen, Shun-Hsing, Ching-Chow Yang, un-Yan San Shiau, and Hui-Hua Wang. 2006. The development of an employee satisfaction model for higher education. The TQM Magazine 18: 484–500. [Google Scholar] [CrossRef]
- Conley, Valerie. M. 2005. Demographics and Motives Affecting Faculty Retirement. New Directions for Higher Education 132: 9–30. [Google Scholar] [CrossRef]
- Cornejo Chávez, Rodrigo, and Marcela Quiñónez. 2007. Factores asociados al malestar/bienestar docente. Una investigación actual. Reice. Revista Electrónica Iberoamericana Sobre Calidad, Eficacia y Cambio en Educación 5: 75–80. [Google Scholar]
- Creswell, John W., and Amanda L. Garrett. 2008. The “movement” of mixed methods research and the role of educators. South African Journal of Education 28: 321–33. [Google Scholar] [CrossRef]
- Dorfman, Lorraine T. 2002. Stayers and Leavers: Professors in an Era of No Mandatory Retirement. Educational Gerontology 28: 15–33. [Google Scholar] [CrossRef]
- Ernst, Ellen, and Cynthia Ozeki. 1998. Work–family conflict, policies, and the job–life satisfaction relationship: A review and directions for organizational behavior–human resources research. Journal of Applied Psychology 83: 139–49. [Google Scholar] [CrossRef]
- Faragher, Brian, Mónica Cass, and Carrie L. Cooper. 2005. The relationship between job satisfaction and health: A meta-analysis. Occupational and Environmental Medicine 62: 105–12. [Google Scholar] [CrossRef]
- Geyskens, Inge, and Jan-Benedict Steenkamp. 2000. Economic and social satisfaction: Measurement and relevance to marketing channel relationships. Journal of Retailing 76: 11–32. [Google Scholar] [CrossRef]
- Gillespie, Nicole A., M. Walsh, Anthony H. Winefield, Jagdish Dua, and Con Stough. 2001. Occupational stress in universities: Staff perceptions of the causes, consequences and moderators of stress. Work & Stress 15: 53–72. [Google Scholar] [CrossRef]
- González, José Antonio Torres. 2013. Análisis del grado de satisfacción del profesorado de educación secundaria en el desarrollo de su labor docente. Contextos Educativos. Revista de Educación 13: 27–42. [Google Scholar]
- Guerrero Barona, Eloisa. 2001. Una investigación con docentes universitarios sobre el afrontamiento del estrés laboral y el síndrome del quemado. Revista Iberoamericana de Educación 25: 1–22. [Google Scholar]
- Guerrero Barona, Eloisa, and Jesús C. Rubio Jiménez. 2005. Estrategias de prevención e intervención del “burnout” en el ámbito educativo. Salud Mental 28: 27–33. [Google Scholar]
- Guo, Lingling, and Bei Wang. 2017. What Determines Job Satisfaction of Teachers in Universities? EURASIA Journal of Mathematics Science and Technology Education 13: 5893–903. [Google Scholar] [CrossRef]
- Hanaysha, Jalal. 2016. Determinants of Job Satisfaction in Higher Education Sector: Empirical Insights from Malaysia. International Journal of Human Resource Studies 6: 129–46. [Google Scholar] [CrossRef]
- Henkens, Kene, and Monique Leenders. 2010. Burnout and older workers’ intentions to retire. International Journal of Manpower 31: 306–21. [Google Scholar] [CrossRef]
- Hernández Armenteros, Juan, and José A. Pérez García. 2016. La Universidad Española en cifras, 2014/2015. Madrid: CRUE. Available online: http://www.crue.org/Documentos%20compartidos/Publicaciones/Universidad%20Española%20en%20cifras/UEC_14-15.pdf (accessed on 21 April 2020).
- Herranz Bellido, Jesús, Abilio Reig-Ferrer, and Julio Cabrero-García. 2006. La prevalencia del estrés laboral asistencial entre los profesores universitarios. Análisis y Modificación de Conducta 32: 743–66. [Google Scholar]
- Kızıltepe, Zeynep. 2008. Motivation and demotivation of university teachers. Teachers and Teaching: Theory and Practice 14: 515–30. [Google Scholar] [CrossRef]
- Korunka, Kristian, Sara Tement, Cristina Zdrehus, and Adriana Borza. 2010. Burnout: Definition, Recognition and Prevention Approaches. BOIT: Burnout Intervention Training for Managers and Team Leaders Manual. [Google Scholar]
- Lacambra, Ana M. Mendioroz, and Fermin M. González. 2018. La universidad española en el marco del EEES. La perspectiva del profesorado emérito. Profesorado. Revista de Currículum y Formación del Profesorado 22: 365–84. [Google Scholar]
- Landon, Mary G., and John M. Ritz. 2016. Motivational factors that influence retirement contentment. Research & Reviews: Journal of Social Sciences 2: 12–22. [Google Scholar]
- Latorre, Isabel. 2005. Burnout en la Enseñanza. Estudio Comparativo de un Grupo de Profesores de la Enseñanza Pública y Privada de la Región de Murcia. Ph.D. thesis, Universidad de Murcia, Murcia, Spain. [Google Scholar]
- Lee, Sik-Yum. 1990. Multilevel analysis of structural equation models. Biometrika 77: 763–72. [Google Scholar] [CrossRef]
- Machado, María L., Virgilio M. Soares, José B. Ferreira, and Odilia M. R. Gouveia. 2011. A look to academics job satisfaction and motivation in Portuguese higher education institutions. Procedia. Social and Behavioral Sciences 29: 1715–24. [Google Scholar] [CrossRef]
- Machado Taylor, Maria L., Virgilo M. Soares, Rui Brites, José B. Ferreira, Minoo Farhangmehr, Odilia M. R. Gouveia, and Marvin Peterson. 2016. Academic job satisfaction and motivation: Findings from a nationwide study in Portuguese higher education. Studies in Higher Education 41: 541–59. [Google Scholar] [CrossRef]
- Marchesi, Álvaro. 2012. El bienestar de los docentes en tiempos de crisis. Revista Fuentes 12: 29–40. [Google Scholar]
- Marsh, Herber W., and Dennis Hocevar. 1985. Application of confirmatory factor analysis to the study of self-concept: First-and higher order factor models and their invariance across groups. Psychological Bulletin 97: 562–82. [Google Scholar] [CrossRef]
- Munyengabe, Silvestre, Haiyan He, Yiyi Zhao, and Jiefei Shan. 2017. Factors and Levels Associated with Lecturers’ Motivation and Job Satisfaction in a Chinese University. EURASIA Journal of Mathematics Science and Technology Education 13: 6415–30. [Google Scholar] [CrossRef]
- Nieto, Daniel A, and José M. S. Riveiro. 2007. Satisfacción laboral de los profesores de Educación Infantil, Primaria y Secundaria. Un estudio de ámbito nacional. Revista de Educación 344: 217–43. [Google Scholar]
- Palomares, Ascensión. 2009. El nuevo modelo docente en el paradigma formativo centrado en el alumnado. Enseñanza & Teaching 27: 45–75. [Google Scholar]
- Pan, Bochen, Xue Shen, Li Liu, Yilong Yang, and Li Wang. 2015. Factors Associated with Job Satisfaction among University Teachers in Northeastern Region of China: A Cross-Sectional Study. International Journal of Environmental Research and Public Health 12: 12761–75. [Google Scholar] [CrossRef]
- Qayyum Ch, Abdul. 2013. Job Satisfaction of University Teachers across the Demographics. A Case of Pakistani Universities. Bulletin of Education and Research 35: 1–15. [Google Scholar]
- Rahman, Masud I., and Rumana Parveen. 2006. Job Satisfaction: A study among Public and Private University Teachers of Bangladesh. Journal of ICMAB 34: 73–90. [Google Scholar] [CrossRef]
- Recknagel, Fiedrich. 2006. Ecological Informatics: Scope, Techniques and Applications. Berlin: Springer. [Google Scholar]
- Sabagh, Zaynab, Nathan C. Hall, and Alenoush Saroyan. 2018. Antecedents, correlates and consequences of faculty burnout. Educational Research 60: 131–56. [Google Scholar] [CrossRef]
- Sabharwal, Meghna, and Elizabeth A. Corley. 2009. Faculty job satisfaction across gender and discipline. The Social Science Journal 46: 539–56. [Google Scholar] [CrossRef]
- Schulze, Salome. 2006. Factors influencing the job satisfaction of academics in higher education. Journal of Higher Education 20: 318–35. [Google Scholar] [CrossRef]
- Souto Santos, Ana C., Benedita Gonçalves de Assis Ribeiro, Julia Trevisan Martins, María J. Quina Galdino, Maria L. Cruz Robazzi, and Renata Perfeito Ribeiro. 2016. Motivations of retired professors to return to work activities at a public university. Revista da Rede de Enfermagem do Nordeste 17: 561–68. [Google Scholar] [CrossRef]
- Van Droogenbroeck, Filip, and Bram Spruyt. 2014. To Stop or Not to Stop: An Empirical Assessment of the Determinants of Early Retirement Among Active and Retired Senior Teachers. Research on Aging 36: 753–77. [Google Scholar] [CrossRef]
- Watts, Jessica, and Noelle Robertson. 2011. Burnout in university teaching staff: A systematic literature review. Educational Research 53: 33–50. [Google Scholar] [CrossRef]
- Wertz, Dorothy C., James R. Sorenson, and Timothy C. Heeren. 1988. Can’t Get No (Dis) Satisfaction. Professional Satisfaction with Professional-Client Encounters. Work and Occupations 15: 36–54. [Google Scholar] [CrossRef]
- Zaman, Sonia, Afrin Jahan, and Abdul L. Mahmud. 2014. Job Satisfaction of University Teacher’s: A Study on Private University in Bangladesh. European Journal of Business and Management 6: 138–47. [Google Scholar] [CrossRef]
© 2020 by the authors. Licensee MDPI, Basel, Switzerland. This article is an open access article distributed under the terms and conditions of the Creative Commons Attribution (CC BY) license (http://creativecommons.org/licenses/by/4.0/).