Article

Analysis of Risk Factors and Symptoms of Burnout Syndrome in Colombian School Teachers under Statutes 2277 and 1278 Using Machine Learning Interpretation

by
Hugo F. Posada-Quintero
1,*,
Paula N. Molano-Vergara
2,3,
Ronald M. Parra-Hernández
4 and
Jorge I. Posada-Quintero
2,5
1
Department of Biomedical Engineering, University of Connecticut, Storrs, CT 06269, USA
2
Institución Educativa Técnica María Auxiliadora, Fresno, Tolima 731560, Colombia
3
Facultad de Ciencias Humanas y Sociales, Departamento de Psicología, Corporación Universitaria Minuto de Dios, Bogotá 111021, Colombia
4
Institución Educativa Normal Superior Fabio Lozano Torrijos, Falan, Tolima 732001, Colombia
5
Facultad de Ciencias de la Educación y la Comunicación, Universidad Autónoma de Asunción, Asunción 001013, Paraguay
*
Author to whom correspondence should be addressed.
Soc. Sci. 2020, 9(3), 30; https://doi.org/10.3390/socsci9030030
Submission received: 5 February 2020 / Revised: 14 March 2020 / Accepted: 18 March 2020 / Published: 20 March 2020

Abstract

:
In 2002, the Colombian ministry of education released statute 1278, for teaching professionalization, superseding statute 2277 of 1977. Although statute 1278 was intended to increase the quality of the education service and teachers’ remuneration, there is evidence that the abundant evaluations and hindered promotion system introduced by statute 1278 resulted in an impairment of the quality of life of the teachers, and a higher incidence of burnout syndrome. We used two techniques for machine learning interpretability, SHapley Additive exPlanation summary plots and predictor importance, to interpret support vector machine and decision tree machine learning models, respectively, to better understand the differences on risk factors and symptoms of burnout syndrome in school teachers under statutes 2277 and 1278. We have surveyed 54 school teachers between August and October 2018, 17 under statute 2277, and 37 under statute 1278. Among the risk factors and symptoms of burnout syndrome considered in this study, we found that the satisfaction with earnt income was the most relevant risk factor, followed by the overtime work and the perceived severity of the sanctions on lower performance. The most relevant symptoms of burnout were fatigue at the end of the day, and frequent headaches. This methodology can be potentially used in other contexts and social groups, allowing institutional authorities and policy makers to allocate resources to specific issues affecting a particular group of workers.

1. Introduction

Stressful working environments affect the mental health of teachers, and produce disorders like burnout syndrome (Delgado 1995; Extremera et al. 2003; Redó 2009; León et al. 2008). Contract conditions contribute to teachers’ working environment, as they set the rules for remuneration, incentives, promotion, and training. In Colombia, two statutes coexist to rule public schools’ teacher contracts, statute 2277 of 1977, and statute 1278 of 2002. Several studies have evaluated the elevated incidence of burnout caused by statute 1278 (Bautista Macia 2009), and a recent study evaluated exactly which risk factors and symptoms of burnout have higher prevalence for teachers under statute 1278, compared to teachers under statute 2277 (Posada Quintero et al. 2018). However, the study was limited to the differences between groups and could not draw conclusions on the importance of risk factors and symptoms. The limited resources of the public institutions and the educational system overall call for the analysis of the importance of risk factors and symptoms of burnout between teachers of the two statutes. Identifying importance can enable institutional authorities and policy makers to allocate resources to the most relevant issues. Using artificial intelligence, specifically machine learning tools, we propose a methodology of analysis to establish the most important risk factors and symptoms of burnout that differentiate teachers under statutes 2277 and 1278.
Currently, several syndromes linked to work-related activities are known, such as: Technostress; Chronos; Anat, Noobing; Ganymede’s; and burnout, among others (Aragüez Valenzuela 2017; Rodríguez 2015). However, this article only focuses on burnout; a clearer understanding of the causes of burnout can contribute to the development of appropriate interventions to correct it, either at an individual or at social/organizational levels, emphasizing psychological action and influencing work conditions (Pérez 2010). In addition, there is a basic consensus on the importance of diagnosing burnout syndrome and promoting programs that assist patients with this syndrome.
The profound physiological consequences of stress were first demonstrated empirically, being described as a syndrome produced by various harmful agents (Aceves et al. 2006). Subsequent research found a wide range of adverse physiological effects of stress in both animals and humans. Likewise, stages of stress have been described as alarm or reaction; adaptation; and exhaustion or decompensation. In this last stage, there is a loss of adaptive resources, that is accompanied by a group of typical anxiety symptoms (Palmer et al. 2005). However, burnout syndrome was not fully described until 1974 by psychiatrist Herbert J. Freudenberger, who worked in a clinic for drug addicts in New York. He observed that most of the volunteers who treated drug addicts after one year suffered progressive loss of energy, that led them to exhaustion and caused symptoms of anxiety and depression, as well as demotivation at work and aggressiveness with patients. Following these findings, he explained that burnout is to fail, wear out or feel exhausted due to excessive demands for energy, spiritual strength or resources (Aceves et al. 2006; López-Elizalde 2004).
The psychosocial factors associated with work have been widely studied by the academic community (Sauter et al. 2001; Saquero et al. 2018; Aragüez Valenzuela 2017; Araujo Lugo and Solís Marín 2017). Every person, in the exercise of their professional work, experiences psychological, social, locative and environmental stressors related to these psychosocial factors. From the perspective of occupational health, such problems can affect not only the workers in their professional performance, but also their family and the organizations in which they work. In the last 20 years, these factors have become more frequently recognized and diagnosed, gaining importance to such an extent that the World Health Organization (WHO) has cataloged them as occupational risk (Aceves et al. 2006; Protecting Workers’ Health 2017). The European Agency for Safety and Health has highlighted the need to establish and investigate these new health risks (León et al. 2008). Research reports looking into occupational safety and health found a direct causal relationship between work stress and chronic health issues (Velásquez 2017).
Cabrera and Elvira (2004) determine that worldwide descriptive studies with correlational designs that analyze the relationship between stress and burnout with other fundamentally sociodemographic variables, are repeated in almost all countries (Cabrera and Elvira 2004). In Germany, Knight-Wegenstein (1973) conducted one of the pioneering studies in the field of education, finding that 87.6% of 9129 teachers seemed to be affected by a high grade of pressure in their work (Knight-Wegenstein 1973). Likewise, Cabrera and Elvira (2004) postulated that “in this line, this same type of research is repeated in countries around the world, pointing out high scores in various measures of stress and burnout” (Cabrera and Elvira 2004).
In Colombia, statutes 1278 and 2277 regulate the teaching profession in terms of functions and requirements, such as the selection, permanence and promotion processes. In the case of the new statute (1278), appointments are based on merit and a competitive selection, which requires reaching certain threshold scores in the selection exam, and competing with other applicants for admission to the teaching staff. In contrast, statute 2277 allowed the direct assignation of teaching appointments. Overall, it is said that statute 1278 has “established new rules for training, entry, evaluation, promotion and permanence in the teaching profession, which seek to influence students’ results through the improvement of teaching quality” (Bautista Macia 2009).
With regard to permanence, statute 2277 established it as an acquired right. In statute 1278, permanence needs to be determined by assessing teachers’ suitability, and evaluating functions and tasks related to teaching performance. Those conditions were not considered in the previous statute (2277). With respect to remuneration, incentives, promotion, and training, the functions assigned specifically to teachers under statute 1278 are used in the process to evaluate teaching performance and skills (Cifuentes Cubillos 2013). It has been observed in many cases that teachers of statute 1278 externalize demotivation, because they cannot get promotions and improve their salary, despite the multiple evaluations that they undergo.
Although statute 1278 has been found to positively affect the quality of education, it does not guarantee an improvement of the quality of life or working conditions of teachers (Bautista Macia 2009). A recent analysis of differences on risk factors and symptoms of burnout between teachers under statutes 2277 and 1278 have evidenced a higher prevalence for teachers under statute 1278 (Posada Quintero et al. 2018). However, traditional statistical analysis is limited to determine which risk factors and symptoms are different between the groups and cannot draw conclusions on how important those differences are. Identifying the relative importance of risk factors and symptoms could enable a more effective prevention of burnout in teachers under statute 1278.
Artificial intelligence can help one to understand more clearly the impact of statute 1278 on teachers’ working conditions. Artificial intelligence is defined as “a branch of computer science dealing with the simulation of intelligent behavior in computers”, or “the capability of a machine to imitate intelligent human behavior” (Definition of ARTIFICIAL INTELLIGENCE 2020). In other words, artificial intelligence is a field determined with reproducing human intelligence in machines, especially computer systems through learning, reasoning and self-correction (Egbuna 2019). Artificial intelligence is a vast topic, and machine learning is just a subset of artificial intelligence. The machine learning concept comes from the learning aspect of the definition of artificial intelligence provided above. Simply put, machine learning is a set of statistical tools to learn from a given dataset. The purpose of machine learning is to teach computers how to learn and make predictions from data, without explicit instructions to do so.
In this paper, we advocate for the use of machine learning to provide policy makers and institutions with tools to prevent burnout in teachers. We are proposing a novel methodology based on machine learning interpretation for the analysis of the importance of risk factors and symptoms of burnout in two different populations that coexist in the same working place (different statues govern their contracts), known to have different levels of prevalence of burnout. First, we collected data from both populations regarding the risk factors and symptoms of burnout. Second, we performed a statistical analysis to identify differences in risk factors and symptoms, as a preliminary way to assess relevancy. Then, we trained machine learning algorithms for classifying the two groups, using risk factors and symptoms separately, to identify the most sensitive features and the model. From that, we trained a model with the identified risk factors and symptoms and performed a machine learning interpretation technique, in order to rank the factors and symptoms by their importance.

2. Materials and Methods

In this study, we analyzed the risk factors and symptoms of burnout syndrome in teachers under two different statutes, 2277 and 1278. The sample was made up of teachers from the San José Technical Educational Institution (Fresno, Tolima, Colombia), who voluntarily consented to participate in the study. The information was obtained from a survey applied to all teachers (N = 54), with ages between 22 and 63 years (mean = 43 years, standard deviation = 12). The highest percentage of respondents corresponded to women (76%). For the purposes of the analysis, the sample was divided into two groups: teachers under statute 2277 (N = 17; 31.5%, mean = 55 years) and under statute 1278 (N = 37; 68.5%; mean = 37 years). Note that all teachers belonged to the same school, and this constitutes a single case study (Stake 1994; 1995; 2005). This is a widely used methodology in education research (Tight 2010; 2012).
For the purpose of the analysis, sociodemographic characteristics were initially collected (statute of employment, age and sex). Then, 26 items corresponding to 13 risk factors and 13 symptoms of burnout syndrome were established from previous studies (Minprotección Publica Instrumentos Para Evaluar Factores de Riesgo Psicosocial 2011). The risk factors studied were communication with supervisors; sufficient salary; working overtime; social recognition; absences and penalties; support from supervisors; breaks during the day; valuation of work; tasks according to the teaching profession; relationship with peers; working hours; union membership; and training opportunities. The symptoms analyzed through the instrument were loss of appetite; difficulty in communication; headache; gastric problems; feeling of depression; medical consultation for injuries; despair; feeling of fatigue; consultation for mental health; irregular sleep; feeling of sadness; irritability and consultation for voice injuries. The risk factors and symptoms considered in this study have been previously associated to burnout syndrome, and were taken from the specifications of the Battery of instruments for the Evaluation of psychosocial risk factors of the Colombian Ministry of Social Protection (Minprotección Publica Instrumentos Para Evaluar Factores de Riesgo Psicosocial 2011). The questionnaire was applied in Spanish, and a translation is included in Table 1. The coding for the responses was: 0, Never; 1, Almost never; 2: Sometimes; 3: Always.

2.1. Statistical Analysis

Normality of the indices was tested using the one-sample Kolmogorov–Smirnov test (Massey 1951; Miller 1956; Wang et al. 2003). Given that data of all the risk factors and symptoms were found non-normally distributed, we used the two-sided Wilcoxon rank sum test (Gibbons and Chakraborti 2011), a non-parametric statistical technique, for the comparison of risk factors and symptoms between the two groups. A p value < 0.05 was considered significant. A statistical analysis was conducted in MATLAB (Mathworks, Inc., Natick, MA 01760–2098, USA).

2.2. Machine Learning Classification Analysis

We aimed to determine the risk factors and symptoms of burnout that truly differentiate teachers under statutes 1278 and 2277. We hypothesize that a more detailed analysis beyond the traditional statistically-significant differences analysis can provide useful information, to prevent the consequences of burnout. For this purpose, we used machine learning analysis with risk factors and symptoms of burnout as “features” (each one of the risk factors and symptoms) to classify teachers under statutes 1278 and 2277.
In machine learning, classification is comprised of two steps, “learning” and “predicting”, also referred to as training and testing. The machine learning model is developed (trained) based on given training data in the learning step. The prediction step is where the machine learning model is used to predict the response for the given testing data (Roman 2019). We have tested several machine learning models for the classification of teachers under statutes 1278 and 2277, using risk factors of burnout only, and symptoms of burnout. To compensate for the imbalance of the classes (37 teachers of statute 1278 vs. 17 teachers of statute 2277), the prior probabilities of the classes were set uniform in the training process.
In this study, we used decision trees (DT) (Friedman et al. 1976) and support vector machines (SVM) (Shawe-Taylor and Cristianini 2000) for the classification of teachers under statutes 2277 and 1278 using risk factors and symptoms of burnout. DT is one of the easiest and popular classification algorithms to understand and interpret (Breiman 2017). For its part, SVM is one of the most widely used classification techniques, because it aims to minimize the number of misclassification errors directly. This is especially useful when the data is not linearly separable. A machine-learning classification analysis was performed in MATLAB (Mathworks, Inc., Natick, MA 01760–2098, USA) and Python.

2.2.1. Decision Trees (DT)

DT builds the classification (or regression, for other applications) models using a tree structure. The goal of using a DT is to create a model to predict to which class a given sample belongs to, approximating a sine curve by learning conditional decision rules inferred from previously known data, called training data. The deeper branches of the tree create more complex decision rules. Each branch splits the training data into smaller subsets (the deeper the tree, the smaller the subset). The resulting model is a tree with decision nodes and leaf nodes (outputs). A decision node can have two or more branches. A leaf node represents the point where the decision of the classification is made.
A DT requires several steps to be built. The first step is called splitting. In this step, the DT partitions the data into subsets, based on the values of a particular variable that the DT is trying to predict. The second step is called pruning, where the branches of the tree are shortened by turning some branch nodes into leaf nodes. This pruning process is important for the DT, because an unpruned DT tends to be very successful on the training dataset but performs poorly on classifying new values not included in training. This is called over-fitting, and a simpler and pruned tree usually avoids it better than a more complex one (Sehra 2018; Chauhan 2020).
In this study, we evaluated three DT configurations. The first model, named Single DT, was designed with a maximum number of 20 splits. The latter two are ensembles of classification DTs, one using bootstrap aggregation, termed Bag DT (30 learning cycles) (Breiman 1996), and the other using random undersampling boosting (30 learning cycles), termed RUSBoost DT (Seiffert et al. 2008). An ensemble essentially trains many “weak” models (low performance), in which the classification is conducted by getting votes from the ensemble models.

2.2.2. Support Vector Machines

The objective of the SVM algorithm is to find a hyperplane in an N-dimensional space (N is the number of features) that distinctly separates the classes. In a two-classes problem, there are many possible hyperplanes that can be selected to separate the two classes. SVM specifically aims to determine which plane has the maximum distance between the two classes. The idea behind SVM is that maximizing the margin distance allows future samples to be classified with more confidence. The support vectors are the samples closest to the hyperplane, and they influence the position and orientation of the selected separation hyperplane. Adding and removing a given support vector changes the hyperplane, and such a process is used to maximize the margin of the classifier. Once the margin is maximized, the included support vectors are used to build the SVM model.
SVM uses Kernel functions that have the capability of measuring similarity in higher dimensions. In many cases, there is no linear decision boundary that could perfectly separate the samples of the different classes. A nonlinear boundary (circular or quadratic, for instance) might be able to provide an optimal decision boundary that a linear classifier is unable to provide. Furthermore, the Kernel functions do not increase the computational costs significantly. In this study, we have tested linear (Linear SVM) and Gaussian Kernel (Gaussian SVM) SVM models.

2.3. Performance Evaluation of Machine Learning Models

Overfitting occurs when the machine learning model fits the data too well, even capturing the noise of the data. Overfitting a model can result in good training accuracy (accuracy in the training dataset), however it typically results in poor accuracy on new data sets (data not used for training). Such a model is not able to predict outcomes for new cases, and for this reason it is not usable in the real world (Shaikh 2018). A key challenge with machine learning is that we cannot know how well our model will perform on new data, or how overfitted it is, until we actually test it. To address this, the dataset is split into separate training and test subsets. This can be done once, or several times for a given dataset. This process is called cross validation (James et al. 2017). A common cross validation procedure is to split the data into k subsets. For each fold, one group is used as a test dataset and the remaining groups are used as training datasets. A model is fitted on the training set and evaluated in the test set. The evaluation score (e.g., accuracy) for each fold is retained and the model is discarded. At the end of the process, the performance of the model is summarized using the average of the evaluation scores. The parameter k provides the name of the process (for k = 10 the process is called 10-fold cross-validation).
In clinical applications of machine learning, when more than one sample is obtained from the same subject, it is important to perform a cross-validation subject wise (k is a division of the number of subjects, instead of the number of samples) to evaluate the performance of the machine learning model (Saeb et al. 2017). In this study, we have used leave-one-subject-out cross-validation (Saeb et al. 2017) for the evaluation of the models. We chose the best machine learning models using cross-validation accuracy.

2.4. Machine Learning Interpretability

The need for interpretability arises from an incompleteness in problem formalization (Doshi-Velez and Kim 2017). In other words, for certain tasks it was not enough to get the prediction (the what), but the model could also explain how it made the prediction (the why), because the original problem is only partially solved with a correct prediction. The need for scientific understanding of the phenomena, safety, ethics, between other reasons, called for machine learning interpretability techniques. In this study, once the modes that achieved the best performance (i.e., highest cross-validation accuracy) were identified, we used all the dataset to train a general machine learning model. The resulting models were analyzed using machine learning interpretability to learn about the importance of the risk factors and symptoms of burnout in the prediction. In this study, we used two techniques for machine learning interpretability: SHapley Additive exPlanation (SHAP) summary plots (Lundberg and Lee 2017), and predictor importance (PI).

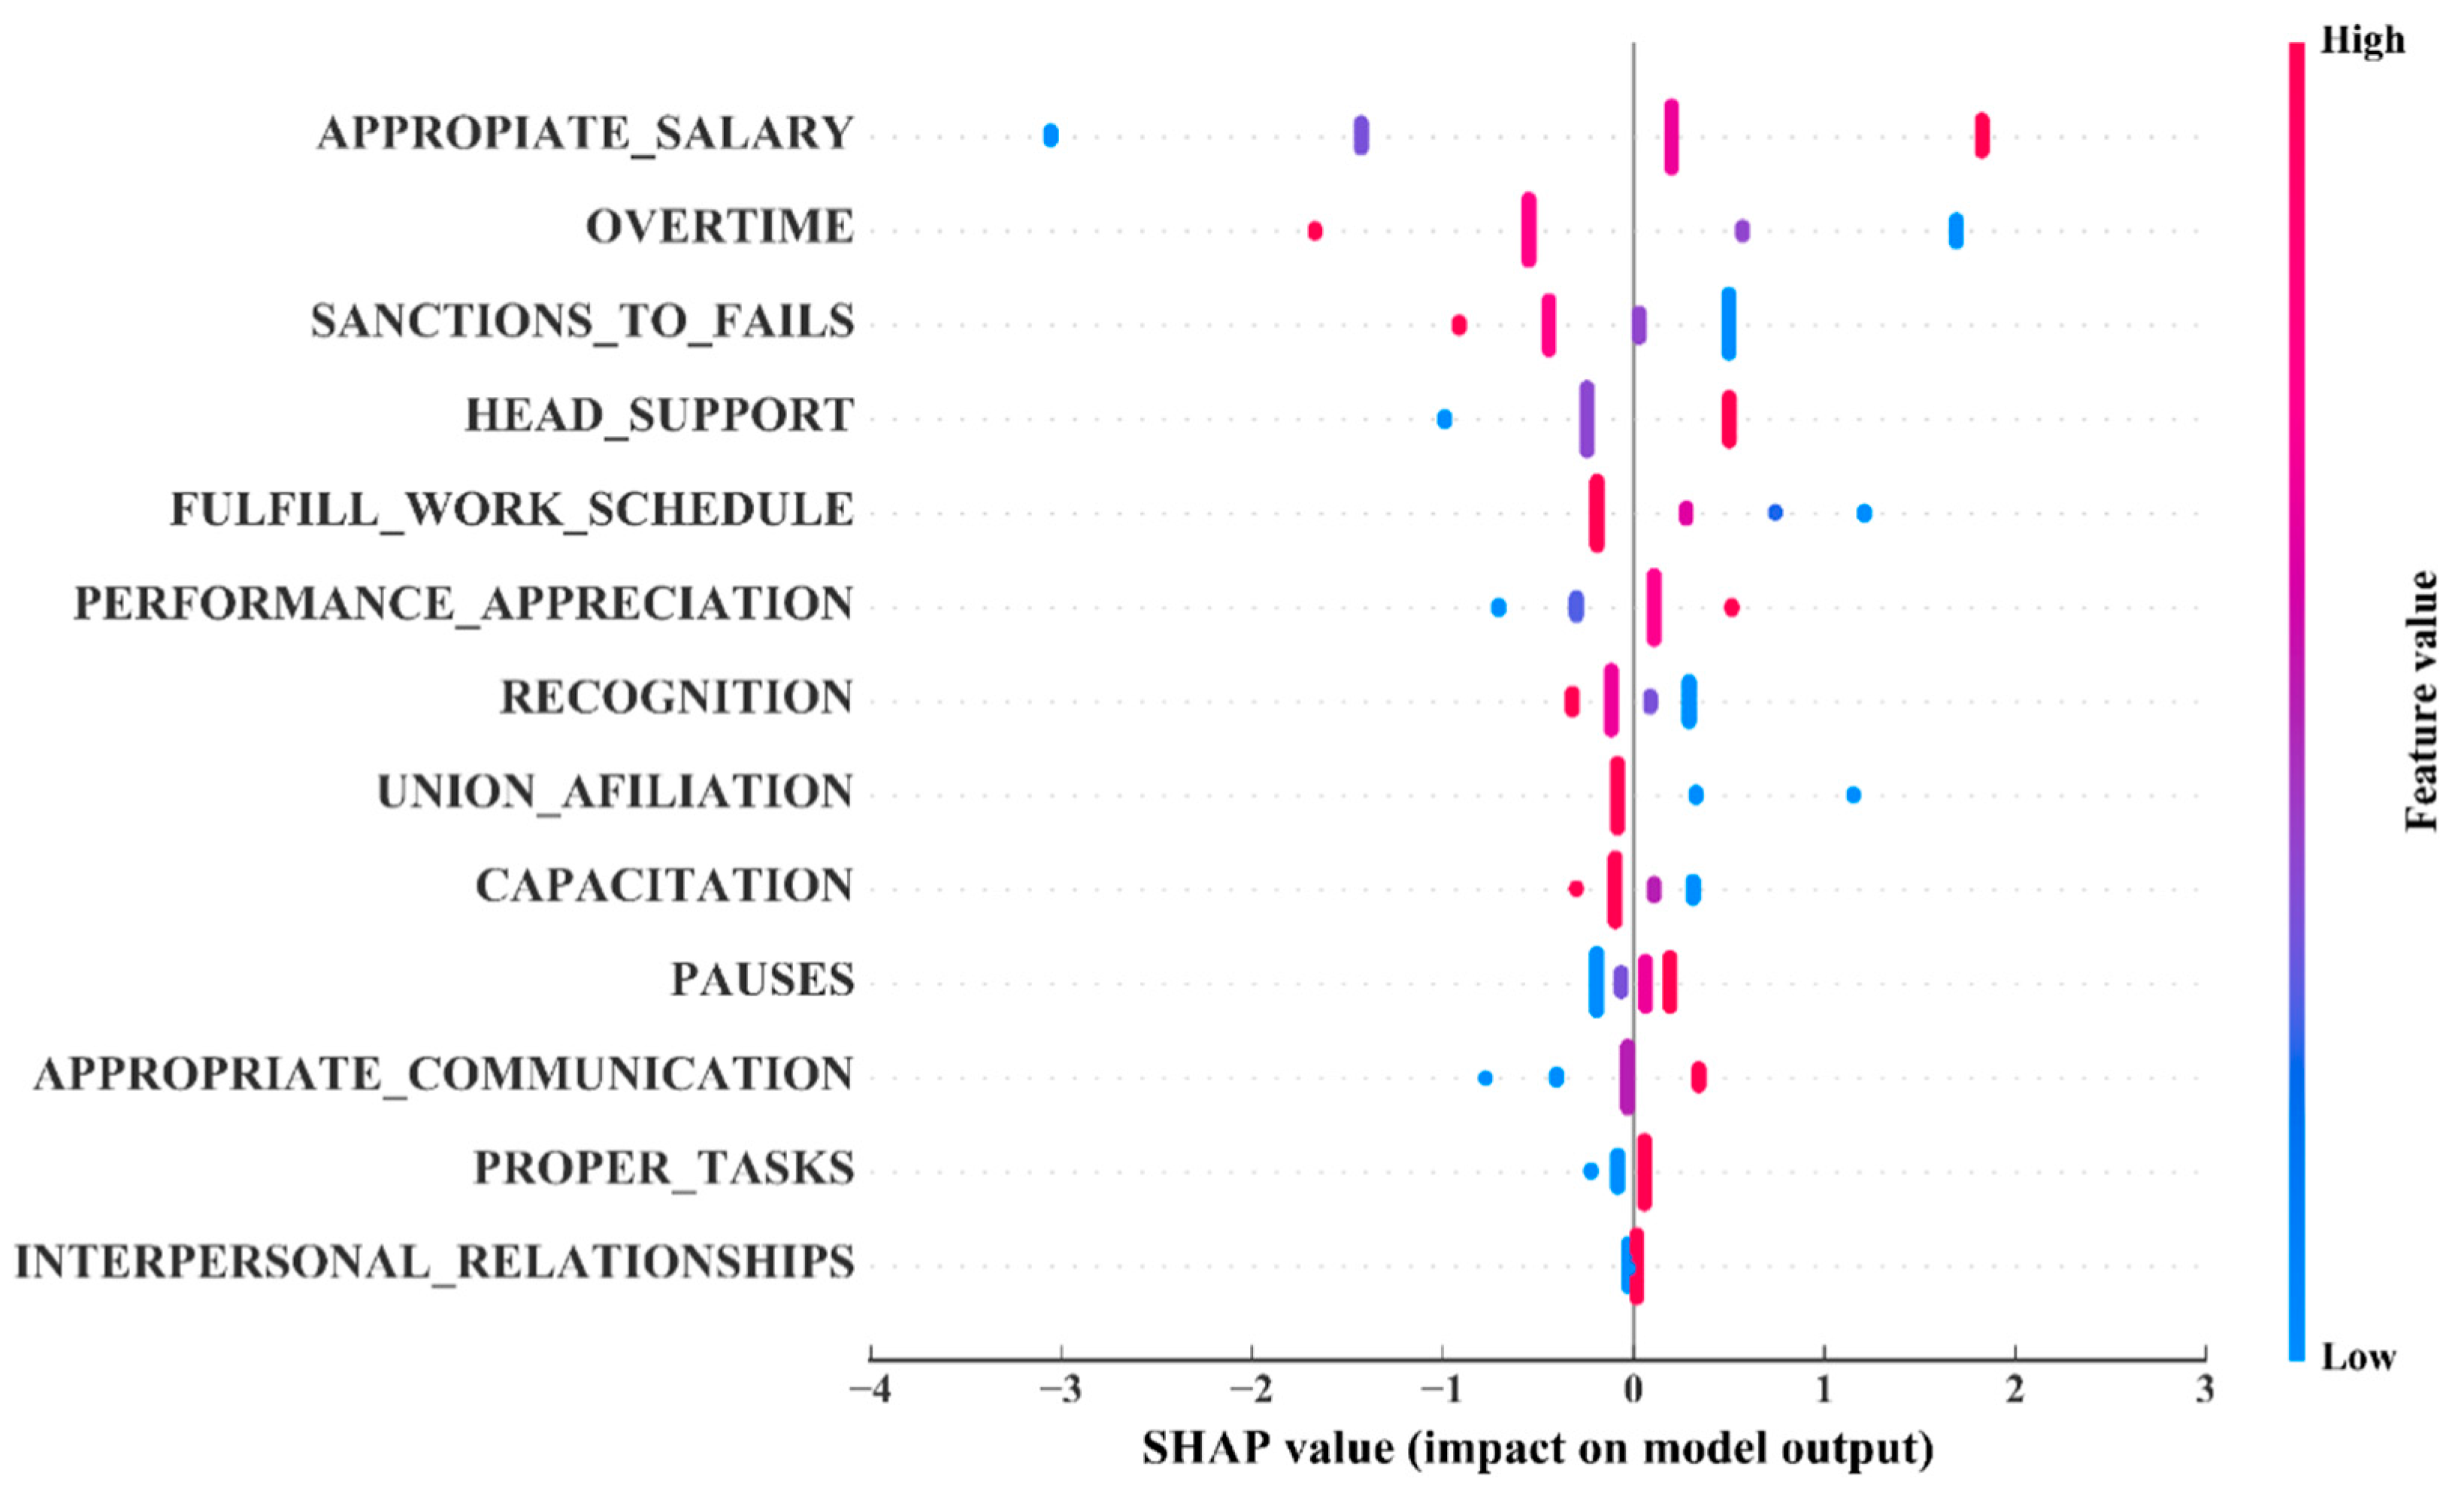
2.4.1. SHAP Summary Plots

The SHAP summary plots allow one to break down a prediction model to extract the impact of each feature. It computes SHAP values, which are used in game theory to assess how much each player in a collaborative game has contributed to the success (Shapley 1952). The idea is to assess how much a feature value has contributed to the prediction compared to the average prediction. It is simple to assess for a linear regression model, as the effect of each feature is the weight of the feature times the feature value. However, for complex models it requires a different analysis. Considering the prediction as a game, the actual prediction as a gain, and the features as players working together to receive the gain, the Shapley value is the average marginal contribution of a feature value across all possible coalitions (Molnar 2019).

2.4.2. Predictor importance in Decision Trees

There are several criteria for splitting data in the decision nodes. In this study, we have used the Gini’s diversity index (Jost 2006). It calculates the probability that two entities represent different types and is computed by subtracting the sum of the squared probabilities of each class from one. For DT models interpretation, we computed the importance of risk factors and symptoms by computing the predictor importance (PI) for each feature, which represents an estimate of the importance of each of the features of a DT model (Estimates of Predictor Importance for Classification Ensemble of Decision Trees—MATLAB 2020). PI is computed by summing changes in the risk due to splits on every feature and dividing the sum by the number of branch nodes.

3. Results

First, we have included the results of the statistical analysis of the risk factors and symptoms of burnout syndrome, followed by the results of the performance evaluation of the different machine learning models using cross-validation. At the end of the section, we have included the results of the machine learning interpretation analysis. Table 2 shows the statistical analysis of the risk factors and symptoms of burnout between the two groups (teachers under statutes 2277 and 1278). Data are represented as mean ± standard error. Obtained p-values from the Wilcoxon rank sum test are also shown. We found five risk factors to exhibit significant differences between groups, APPROPRIATE_COMMUNICATION, HEAD_SUPPORT, APPROPRIATE_SALARY, SANCTIONS_TO_FAILS, and OVERTIME. The first three were higher for statute 2277, and the latter two were lower for statute 2277. Only one symptom of burnout, HEADACHE, was significantly lower in statute 2277. None of the other symptoms exhibited significant differences between groups.
Table 3 includes the cross-validation accuracy of the DT and SVM models. For classification using risk factors only, Linear SVM obtained the best cross-validation accuracy (96%). In the case of using only symptoms of burnout, the RUSBoost DT model achieved the highest accuracy (82%). Overall, the classification task was more difficult (lower accuracy) using symptoms compared to risk factors.
The models with best performance (for risk factors and symptoms, respectively) are analyzed to extract information on the importance of the risk factors and symptoms. First, SHAP summary plot was used to analyze the importance of the risk factors in the Linear SVM model (Figure 1). SHAP values can be used to analyze how much a given feature changes the prediction model. The summary plot tells which features are more important than others, and their range of effects over the dataset. Vertical location shows what feature it is depicting, and the features are sorted from top to bottom in order of importance. The color shows whether that feature was high or low for that row of the dataset, and the amount of samples. Horizontal location shows whether the effect of that value caused a higher or lower prediction. The more spread the SHAP summary plot is for a feature, the more important and relevant is the feature for the model.
By plotting the SHAP values for every sample of every feature, we provide a detailed look at which features are most important for the Linear SVM model. APPROPRIATE_SALARY is the most relevant feature, followed by OVERTIME, SANCTIONS_TO_FAILS, and HEAD_SUPPORT. Starting with the feature FULFILL_WORK_SCHEDULE, the remaining features have relatively low impact on the model.
For the RUSBoost DT model to classify teachers under statutes 1278 and 2277 using only symptoms of burnout, we used the predictor importance (PI) analysis technique, described in the Methods section. The PI values must be evaluated relatively (Table 4). In other words, we can conclude on what features are more important than others, but not as an absolute measure of importance. The feature with the highest PI was FATIGUE, followed by HEADACHE, COMMUNICATION_DIFFICULTY, and LOSS_OF_APPETITE. The remaining features exhibited lower relative importance compared with the aforementioned features, as they achieved lower PI values.

4. Discussion

For the first time, we have used artificial intelligence, specifically machine learning interpretation techniques, to analyze the importance of risk factors and symptoms of burnout that differentiate two groups. We found that the level of satisfaction with earned income was the most relevant risk factor, followed by overtime work and the perceived severity of sanctions on lower performance. As for the symptoms, we found that fatigue at the end of the day, and frequent headaches were the most relevant. This observation can enable institutional authorities and policy makers to allocate resources to specific issues related to burnout in this specific group of workers.
Using statistical analysis, we found a total of six features (risk factors and symptoms) to be significantly different between teachers under statutes 2277 and 1278. Five factors regarding the salary, the channels and the spaces of communication with supervisors; the feeling of support from those supervisors; the set of sanctions established for low performance evaluations; as well as the overtime work, were the most important differentiators between teachers under statutes 2277 and 1278. The occurrence of frequent headaches was the only symptom of burnout syndrome which was significantly different between the two groups. The statistical analysis of the features (risk factors and symptoms) provides an overall exploration of the differences, but is only able to analyze one feature at a time, and the nonlinear relationships between burnout and the features cannot be considered. The p-value of the statistical analysis is not an appropriate measure of importance. Although the level of satisfaction with the earned income (APPROPRIATE_SALARY) was the feature that exhibited the largest difference between groups, the p-value of the statistical analysis identified communication issues (APPROPRIATE_COMMUNICATION) and the perception of support from supervisors (HEAD_SUPPORT) as the following p-values. In contrast, the machine learning interpretation analysis identified overtime work and the perceived severity of the sanctions to lower performance to be more important than the communication issues and lack of support from supervisors.
In the education field, some studies have shown a high vulnerability to burnout in teachers, due to the simultaneous realization of multiple activities and functions (Bambula et al. 2012). Teacher work regularly implies not only ensuring that students receive a quality education, but also other time-demanding and conflicting tasks, imposed not only by the work with students, but also by families, social networks and administration. In the same way, burnout syndrome is becoming a serious problem, not only for the teaching group, but also for the education system in general. This is due to its direct consequences on the quality of teaching and its corresponding increasing negative effect on attrition, labor rotation, absenteeism and the decrease in the productivity of education (Delgado 1995; Extremera et al. 2003; Redó 2009). León et al. (2008) conclude that the mental health of teachers is a current problem that must be considered and that may be associated with burnout syndrome.
Making an order of research ideas at national and global level, it is evident that various studies have demonstrated the presence of burnout syndrome in teachers, which analyze causal factors and degree of prevalence. However, the work comparing the degree of prevalence of burnout in teachers governed under labor association statutes 1278 against the group of teachers governed by statute 2277 is unknown.
Artificial intelligence has been widely used for some years, but it is only recently that researchers started to incorporate it in the psychological and behavioral sciences (DelPozo-Banos et al. 2018; Posada-Quintero and Bolkhovsky 2019; Arnold et al. 2012). For instance, various tools of artificial intelligence, including machine learning, have been used to analyze electronic health records (DelPozo-Banos et al. 2018). Other studies have used machine learning to improve the diagnosis of mood disorders (like depression or bipolar disorder) and suicidality (Pandey et al. 2012; Arnold et al. 2012; Ramasubbu et al. 2016). Yet, the potential of artificial intelligence and machine learning is immense for the analysis of data in the social sciences.
As for the limitations of the study, we have compared two groups of teachers under the assumption that differences between the groups are related only to the different statutes under which they were employed. However, the mean age of the group of teachers under statute 2277 is 18 years higher than the mean age of the group of teachers under statute 1278. This means they have been working longer and their salary is significantly higher. Although this is a potential limitation, we believe that at some extent the perception of the appropriateness of the earned salary is not only dependent on the amount of money earned, but also on the social benefits, working conditions, family size, and age, among other circumstances. In other words, although the groups expectedly have significantly different salaries, they could be equally satisfied with it if their salary levels were fair. Another potential limitation of the study is the use of teachers from a single school; as such, this is considered as a case study and cannot be therefore generalized. However, this also allows one to partially avoid the differences in social and economic circumstances if the teachers belonged to different schools.

5. Conclusions

For the first time, we have used machine learning interpretation analyses to identify the most important risk factors and symptoms of burnout between two groups of Colombian teachers working under statutes 2277 and 1278. The analysis techniques allowed us to conclude that the level of satisfaction with earned income was the most relevant feature, followed by overtime work and the perceived severity of the sanctions to lower performance. The most relevant symptoms of burnout syndrome were fatigue at the end of the day, and frequent headaches. In particular, with the caveat that this was for a single group of teachers, our results suggests that strategies to level the salary between the two statutes should be implemented, and the overtime work and the severity of the evaluation and sanctions should be reduced to diminish the risk of burnout in teachers under statute 1278. Furthermore, the occupational health providers should encourage the teachers under statute 1278 to perform activities aiming to manage excessive fatigue and headaches. In the broader aspect, we have developed a machine learning based analysis framework to identify the most relevant risk factors and symptoms of a given issue. The framework includes the cross-validation of machine learning models to identify the most accurate, and the application of machine learning interpretability techniques to extract information on the relevancy of the features included in the model. This analysis framework enables the identification of relevant conditions that elicit different issues in a given group of workers. Providing information on the importance of factors and symptoms can enable institutional authorities and policy makers to allocate resources to alleviate burnout or other conditions attending those identified as most relevant.

Author Contributions

J.I.P.-Q., P.N.M.-V., and R.M.P.-H. conceived the study, collected the data, and performed the statistical analysis; H.F.P.-Q. performed the data curation and machine learning analysis; J.I.P.-Q. and H.F.P.-Q. and drafted the manuscript. J.I.P.-Q. corrected the draft. All authors have read and agreed to the final version of the manuscript.

Funding

This research received no external funding.

Acknowledgments

The authors thank Youngsun Kong for his guidance with SHAP analysis in Python.

Conflicts of Interest

The authors declare no conflict of interest.

References

  1. Aceves, Gutiérrez, Guillermo Axayacalt, Miguel Ángel Celis López, Sergio Moreno Jiménez, Felipe Farias Serratos, and José de Jesús Suárez Campos. 2006. Síndrome de Burnout. Archivos de Neurociencias 11: 305–9. [Google Scholar]
  2. Aragüez Valenzuela, Lucía. 2017. El Impacto de Las Tecnologías de La Información y de La Comunicación En La Salud de Los Trabajadores: El Tecnoestrés. Revista Internacional de La Protección Social 2: 169–90. [Google Scholar] [CrossRef]
  3. Araujo Lugo, Martha Viviana, and Karina Elizabeth Solís Marín. 2017. Habilidades de comunicación efectiva y su relación, con la presencia de síndrome de burnout en médicos postgradistas de áreas clínicas y quirúrgicas de la Pontificia Universidad Católica del Ecuador, en el período 2012–2016. Available online: http://repositorio.puce.edu.ec:80/xmlui/handle/22000/13731 (accessed on 15 January 2020).
  4. Arnold, Steven E., Sharon X. Xie, Yuk Yee Leung, Li-San Wang, Mitchel A. Kling, Xiaosi Han, Eunsun J. Kim, David A. Wolk, David A. Bennett, Alice Chen-Plotkin, and et al. 2012. Plasma Biomarkers of Depressive Symptoms in Older Adults. Translational Psychiatry 2: e65. [Google Scholar] [CrossRef] [PubMed]
  5. Bambula, Fátima Díaz, Ana María López Sánchez, and María Teresa Varela Arévalo. 2012. Factores Asociados al Síndrome de Burnout En Docentes de Colegios de La Ciudad de Cali, Colombia. Universitas Psychologica 11: 217–27. [Google Scholar] [CrossRef]
  6. Bautista Macia, Marcela. 2009. La Profesionalización Docente En Colombia. Revista Colombiana de Sociología 32: 111–31. [Google Scholar]
  7. Breiman, Leo. 1996. Bagging Predictors. Machine Learning 24: 123–40. [Google Scholar] [CrossRef] [Green Version]
  8. Breiman, Leo. 2017. Classification and Regression Trees. Abindon: Routledge. [Google Scholar]
  9. Cabrera, Javier Herruzo, and Juan Antonio Moriana Elvira. 2004. Estrés y Burnout En Profesores. International Journal of Clinical and Health Psychology 4: 597–621. [Google Scholar]
  10. Chauhan, Nagesh Singh. 2020. Decision Tree Algorithm—Explained. Medium. January 15. Available online: https://towardsdatascience.com/decision-tree-algorithm-explained-83beb6e78ef4 (accessed on 15 January 2020).
  11. Cifuentes Cubillos, Carolina. 2013. Estatuto de Profesionalización Docente En Colombia: Análisis de Los Dos Estatutos Vigentes (Decreto 2277 de 1979 y Decreto 1278 de 2002), Diferencias En La Labor Docente. Ph.D. thesis, Universidad Nacional de Colombia, Bogotá, Colombia. [Google Scholar]
  12. Definition of ARTIFICIAL INTELLIGENCE. 2020. Available online: https://www.merriam-webster.com/dictionary/artificial+intelligence (accessed on 15 January 2020).
  13. Delgado, B. Domenech. 1995. Introduccion al Sindrome “Burnout” En Profesores y Maestros y Su Abordaje Terapeutico. Psicología Educativa 1: 63–78. [Google Scholar]
  14. DelPozo-Banos, Marcos, Ann John, Nicolai Petkov, Damon Mark Berridge, Kate Southern, Keith LLoyd, Caroline Jones, Sarah Spencer, and Carlos Manuel Travieso. 2018. Using Neural Networks with Routine Health Records to Identify Suicide Risk: Feasibility Study. JMIR Mental Health 5: e10144. [Google Scholar] [CrossRef] [Green Version]
  15. Doshi-Velez, Finale, and Been Kim. 2017. Towards a Rigorous Science of Interpretable Machine Learning. arXiv arXiv:1702.08608. [Google Scholar]
  16. Egbuna, Oluebube Princess. 2019. Artificial Intelligence, Machine Learning, Deep Learning and Data Science! What’s the Difference? Medium. April 3. Available online: https://medium.com/fbdevclagos/artificial-intelligence-machine-learning-deep-learning-and-data-science-whats-the-difference-e82f9e7094a (accessed on 15 January 2020).
  17. Estimates of Predictor Importance for Classification Ensemble of Decision Trees—MATLAB. 2020. Available online: https://www.mathworks.com/help/stats/compactclassificationensemble.predictorimportance.html (accessed on 15 January 2020).
  18. Extremera, Natalio, PABLO Fernández-Berrocal, and Auxiliadora Durán. 2003. Inteligencia Emocional y Burnout En Profesores. Encuentros En Psicología Social 1: 260–65. [Google Scholar]
  19. Friedman, Jerome H., Jon Louis Bentley, and Raphael Ari Finkel. 1976. An Algorithm for Finding Best Matches in Logarithmic Time. ACM Transactions on Mathematical Software 3: 209–26. [Google Scholar] [CrossRef]
  20. Gibbons, Jean Dickinson, and Subhabrata Chakraborti. 2011. Nonparametric Statistical Inference. In International Encyclopedia of Statistical Science. Berlin/Heidelberg: Springer, pp. 977–79. [Google Scholar]
  21. James, Gareth, Daniela Witten, Trevor Hastie, and Robert Tibshirani. 2017. An Introduction to Statistical Learning: with Applications in R, 1st ed. 2013, Corr. 7th Printing 2017 Edition. New York: Springer. [Google Scholar]
  22. Jost, Lou. 2006. Entropy and Diversity. Oikos 113: 363–75. [Google Scholar] [CrossRef]
  23. Knight-Wegenstein, A. G. 1973. Die Arbeitszeit Der Lehrer in Der Bundesrepublik Deutschland. Band I: Analyse 2. [Google Scholar]
  24. León, C., O. Matsui, and C. Beltrán. 2008. Factores Psicosociales y Síndrome de Burnout En Docentes de Educación Básica Del Estado de Jalisco. Investigación En Salud 1: 1–10. [Google Scholar]
  25. López-Elizalde, Carlos. 2004. Síndrome de Burnout. Revista Mexicana de Anestesiología 27: 131–33. [Google Scholar]
  26. Lundberg, Scott M, and Su-In Lee. 2017. A Unified Approach to Interpreting Model Predictions. In Advances in Neural Information Processing Systems 30. Edited by I. Guyon, U. V. Luxburg, S. Bengio, H. Wallach, R. Fergus, S. Vishwanathan and R. Garnett. Red Hook: Curran Associates, Inc., pp. 4765–74. Available online: http://papers.nips.cc/paper/7062-a-unified-approach-to-interpreting-model-predictions.pdf (accessed on 15 January 2020).
  27. Massey, Frank J., Jr. 1951. The Kolmogorov-Smirnov Test for Goodness of Fit. Journal of the American Statistical Association 46: 68–78. [Google Scholar] [CrossRef]
  28. Miller, Leslie H. 1956. Table of Percentage Points of Kolmogorov Statistics. Journal of the American Statistical Association 51: 111–21. [Google Scholar] [CrossRef]
  29. Minprotección Publica Instrumentos Para Evaluar Factores de Riesgo Psicosocial. 2011. Available online: https://www.minsalud.gov.co/Paginas/Minprotecci%C3%B3npublicainstrumentosparaevaluarfactoresderiesgopsicosocial.aspx (accessed on 15 January 2020).
  30. Molnar, Christoph. 2019. Interpretable Machine Learning. Morrisville: Lulu. [Google Scholar]
  31. Palmer, Yusvisaret, Antonio Gómez-Vera, Carlos Cabrera-Pivaral, Roberto Prince-Vélez, and Roberto Searcy. 2005. Factores de Riesgo Organizacionales Asociados al Síndrome de Burnout En Médicos Anestesiólogos. Salud Mental 28: 82–91. [Google Scholar]
  32. Pandey, A., N. A. Davis, B. C. White, Nicholas M. Pajewski, Jonathan B. Savitz, Wayne C. Drevets, and Brett A. McKinney. 2012. Epistasis Network Centrality Analysis Yields Pathway Replication across Two GWAS Cohorts for Bipolar Disorder. Translational Psychiatry 2: e154. [Google Scholar] [CrossRef] [Green Version]
  33. Pérez, Anabella Martínez. 2010. El Síndrome de Burnout. Evolución Conceptual y Estado Actual de La Cuestión. Vivat Academia 112: 42–80. [Google Scholar] [CrossRef] [Green Version]
  34. Posada Quintero, Jorge Iván, Paula Natalia Molano Vergara, Ronald Mauricio Parra Hernández, Francy Yaneth Brito Osorio, and Edward Andrey Rubio Orozco. 2018. Prevalencia Del Síndrome de Burnout En Docentes: Factores Asociados al Estatuto de Vinculación Laboral En Colombia. Revista Interamericana de Psicología Ocupacional 37: 119–33. [Google Scholar] [CrossRef]
  35. Posada-Quintero, Hugo F., and Jeffrey B. Bolkhovsky. 2019. Machine Learning Models for the Identification of Cognitive Tasks Using Autonomic Reactions from Heart Rate Variability and Electrodermal Activity. Behavioral Sciences 9: 45. [Google Scholar] [CrossRef] [PubMed] [Green Version]
  36. Protecting Workers’ Health. 2017. Available online: https://www.who.int/news-room/fact-sheets/detail/protecting-workers’-health (accessed on 15 January 2020).
  37. Ramasubbu, Rajamannar, Matthew R. G. Brown, Filmeno Cortese, Ismael Gaxiola, Bradley Goodyear, Andrew J. Greenshaw, Serdar M. Dursun, and Russell Greiner. 2016. Accuracy of Automated Classification of Major Depressive Disorder as a Function of Symptom Severity. NeuroImage: Clinical 12: 320–31. [Google Scholar] [CrossRef] [PubMed] [Green Version]
  38. Redó, Nuria Arís. 2009. El Síndrome de Burnout En Los Docentes. Electronic Journal of Research in Educational Psychology 7: 829–48. [Google Scholar]
  39. Rodríguez, Luz Adriana Medina. 2015. Innovación y Gestión Del Conocimiento; Síndromes Laborales Necesarios de Extiguir. RIDE Revista Iberoamericana Para La Investigación y El Desarrollo Educativo 6. [Google Scholar] [CrossRef] [Green Version]
  40. Roman, Victor. 2019. How to Develop a Machine Learning Model from Scratch. Medium. April 2. Available online: https://towardsdatascience.com/machine-learning-general-process-8f1b510bd8af (accessed on 15 January 2020).
  41. Saeb, Sohrab, Luca Lonini, Arun Jayaraman, David C. Mohr, and Konrad P. Kording. 2017. The Need to Approximate the Use-Case in Clinical Machine Learning. GigaScience 6. [Google Scholar] [CrossRef] [Green Version]
  42. Saquero, A., G. L. Jaime, and F. Ortín. 2018. Relación Entre el Síndrome de Burnout, Niveles de Optimismo, Edad y Experiencia Profesional en Entrenadoras y Entrenadores de Gimnasia Rítmica. Journal of Sport & Health Research 10: 79–90. [Google Scholar]
  43. Sauter, Steven L., Lawrence R. Murphy, Joseph J. Hurrell, and Lennart Levi. 2001. Factores Psicosociales y de Organización. In Enciclopedia de Salud y Seguridad En El Trabajo, 3rd ed. Madrid: Organización Internacional Del Trabajo y Ministerio de Trabajo y Asuntos Sociales, Capítulo 34. [Google Scholar]
  44. Sehra, Chirag. 2018. Decision Trees Explained Easily. Medium. January 19. Available online: https://medium.com/@chiragsehra42/decision-trees-explained-easily-28f23241248 (accessed on 15 January 2020).
  45. Seiffert, Chris, Taghi M. Khoshgoftaar, Jason Van Hulse, and Amri Napolitano. 2008. RUSBoost: Improving Classification Performance When Training Data Is Skewed. Paper presented at the 2008 19th International Conference on Pattern Recognition, Tampa, FL, USA, December 8–11; pp. 1–4. [Google Scholar]
  46. Shaikh, Raheel. 2018. Cross Validation Explained: Evaluating Estimator Performance. Medium. November 26. Available online: https://towardsdatascience.com/cross-validation-explained-evaluating-estimator-performance-e51e5430ff85 (accessed on 15 January 2020).
  47. Shapley, Lloyd S. 1952. A Value for n-Person Games. RAND-P-295. Santa Monica: RAND Corp., Available online: https://apps.dtic.mil/docs/citations/AD0604084 (accessed on 15 January 2020).
  48. Shawe-Taylor, John, and Nello Cristianini. 2000. An Introduction to Support Vector Machines and Other Kernel-Based Learning Methods. Cambridge: Cambridge University Press, vol. 204. [Google Scholar]
  49. Stake, Robert E. 1994. Case Studies. In Handbook of Qualitative Researh. Thousand Oaks: Sage Publications, pp. 236–47. [Google Scholar]
  50. Stake, Robert E. 1995. The Art of Case Study Research. Thousand Oaks: Sage. [Google Scholar]
  51. Stake, Robert E. 2005. Qualitative Case Studies. In The Sage Handbook of Qualitative Research. Thousand Oaks: Sage Publications Ltd. [Google Scholar]
  52. Tight, Malcolm. 2010. The Curious Case of Case Study: A Viewpoint. International Journal of Social Research Methodology 13: 329–39. [Google Scholar] [CrossRef]
  53. Tight, Malcolm. 2012. Researching Higher Education. London: McGraw-Hill Education (UK). [Google Scholar]
  54. Velásquez, Néstor Raúl Porras. 2017. Análisis de La Relación Entre La Salud Mental y El Malestar Humano En El Trabajo. Equidad & Desarrollo, 161–78. [Google Scholar] [CrossRef]
  55. Wang, Jingbo, Wai Wan Tsang, and George Marsaglia. 2003. Evaluating Kolmogorov’s Distribution. Journal of Statistical Software 8. [Google Scholar] [CrossRef]
Figure 1. SHAP summary plot for the Linear SVM model trained using only risk factors of burnout.
Socsci 09 00030 g001
Table 1. Questions of the survey instrument, with associated label, and type of question (risk factor or symptom).
ItemQuestionTypeAssociated Feature
Which statute of professionalization do you belong to?
1Do the tasks you do in the Educational Institution agree with your abilities and skills?Risk factorPROPER_TASKS
2Are the channels and spaces of communication with your bosses good?Risk factorAPPROPRIATE_COMMUNICATION
3Do you get along with your coworkers?Risk factorINTERPERSONAL_RELATIONSHIPS
4During the work day, do you have at least two breaks or pauses?Risk factorPAUSES
5At the end of the day, do you feel fatigued?SymptomFATIGUE
6When facing difficulties with parents or students, do you get support from your bosses?Risk factorHEAD_SUPPORT
Do you feel physical alterations associated with stressful situations?
Frequent headachesSymptomHEADACHE
7Easily irritatedSymptomIRRITABILITY
8Feel like cryingSymptomWISH_TO_CRY
9He has lost your appetiteSymptomLOSS_OF_APPETITE
10Irregular sleepSymptomIRREGULAR_SLEEP
11You feel depressedSymptomDEPRESSION
12You feel despairSymptomDESPAIR
13Communication difficultySymptomCOMMUNICATION_DIFFICULTY
You have consulted the doctor for:
14Mental healthSymptomMENTAL_ILLNESS
15Musculoskeletal InjuriesSymptomSKELETAL_MUSCLE_INJURIES
16Voice injuriesSymptomVOICE_INJURIES
17Gastric problemsSymptomGASTRIC_PROBLEMS
During your professional performance, have you ever:
18Received training opportunities?Risk factorCAPACITATION
19Received the salary required for you to meet your needs?Risk factorAPPROPRIATE_SALARY
20Been recognized for your work performance and contributions?Risk factorPERFORMANCE_APPRECIATION
21Been given permission to join a unionRisk factorUNION_AFILIATION
22Felt that your bosses have a tendency to look for failures and apply sanctions?Risk factorSANCTIONS_TO_FAILS
23Felt that your bosses are too strict about complying with working hours?Risk factorFULFILL_WORK_SCHEDULE
24Do you usually work overtime?Risk factorOVERTIME
25Do you think you need social recognition?Risk factorRECOGNITION
Table 2. Statistical analysis of risk factors and symptoms of burnout.
Statute 1278Statute 2277p-Value
RISK FACTORSPROPER_TASKS2.56 ± 0.5612.71 ± 0.5880.277
APPROPRIATE_COMMUNICATION2.03 ± 0.4992.47 ± 0.8 *0.003
INTERPERSONAL_RELATIONSHIPS2.57 ± 0.5022.76 ± 0.4370.171
PAUSES1.7 ± 1.21.53 ± 1.370.640
HEAD_SUPPORT2.27 ± 0.6082.65 ± 0.493 *0.033
CAPACITATION1.68 ± 0.9151.65 ± 0.9310.934
APPROPRIATE_SALARY1.69 ± 0.8562.53 ± 0.717 *0.001
PERFORMANCE_APPRECIATION1.72 ± 0.7012 ± 0.730.136
UNION_AFILIATION2.83 ± 0.5612.76 ± 0.7520.931
SANCTIONS_TO_FAILS1.42 ± 1.080.765 ± 1.03 *0.042
FULFILL_WORK_SCHEDULE2.61 ± 0.8032.65 ± 0.8620.639
OVERTIME1.8 ± 0.8331.18 ± 1.07 *0.043
RECOGNITION1.58 ± 11.24 ± 1.250.377
SYMPTOMSFATIGUE2.39 ± 0.5492.12 ± 0.7810.253
HEADACHE1.76 ± 0.761.24 ± 0.903 *0.033
IRRITABILITY1.49 ± 0.8181.47 ± 0.80.992
WISH_TO_CRY0.943 ± 0.9060.882 ± 0.9280.835
LOSS_OF_APPETITE0.912 ± 0.9650.563 ± 0.8920.173
IRREGULAR_SLEEP1.46 ± 0.8691.24 ± 0.9030.430
DEPRESSION1.17 ± 0.9541.06 ± 0.9290.705
DESPAIR1.41 ± 0.8651.29 ± 0.920.799
COMMUNICATION_DIFFICULTY1.11 ± 0.7740.706 ± 0.920.099
MENTAL_ILLNESS0.371 ± 0.8430.313 ± 0.7041.000
SKELETAL_MUSCLE_INJURIES0.853 ± 0.8571 ± 1.060.707
VOICE_INJURIES1.05 ± 1.081 ± 1.060.880
GASTRIC_PROBLEMS1.16 ± 1.071.47 ± 0.8740.307
* Represents statistically-significant difference.
Table 3. Cross-validation accuracy of the machine learning models.
Machine Learning ModelRisk FactorsSymptoms
Single DT92%71%
Bag DT 84%61%
RUSBoost DT 80%82%
Linear SVM96%67%
Gaussian SVM92%73%
Table 4. Predictor importance (PI) of the symptoms of burnout in the RUSBoost DT model.
Symptoms of BurnoutPI
FATIGUE0.0055
HEADACHE0.0050
IRRITABILITY0.0031
WISH_TO_CRY0.0008
LOSS_OF_APPETITE0.0040
IRREGULAR_SLEEP0
DEPRESSION0.0012
DESPAIR0
COMMUNICATION_DIFFICULTY0.0044
MENTAL_ILLNESS0.0018
SKELETAL_MUSCLE_INJURIES0.0026
VOICE_INJURIES0
GASTRIC_PROBLEMS0.0036

