Abstract
This study makes a systemic review to cluster and create a competitiveness relationship considering a systems dynamics approach. A dynamic hypothesis was constructed to validate what factors increase a cluster’s level of competitiveness, through causal analysis. Then, the causal diagram that validates the dynamic H0 hypothesis was constructed in Vensim PLE systems®. Literature review shows the evolution of the cluster system according to the current needs of the market, and emphasizes the need for new approaches and models that capture the complexity and dynamics of this system, allowing the understanding of its structure and the evaluation of the contribution of factors and capabilities to cluster competitiveness. It highlights the usefulness of systems dynamics as a simulation methodology for dynamic and complex systems, and establishes itself as a growing line of research applied to various systems of study. Dynamic hypothesis H0 was validated using the causal diagram, reaching the conclusion that innovation, productive management, financial management, organizational management, commercial management, and cluster management factors positively increase the cluster competitiveness level. From structure analysis, the behavior is associated to the archetype “Path Dependence”, usual in growing industrial markets.
1. Introduction
The clusters are systemic structures that are subject to research since they are considered an engine of economic development and a source of competitiveness (Felzensztein et al. 2018). A product of internal relationships and their interaction with the environment, the development of a cluster generates externalities associated with increased foreign investment, international cooperation, business networks, and knowledge appropriate for innovation (Gancarczyk and Gancarczyk 2018; Krägeloh et al. 2018; Lorenzo et al. 2018; Mudambi et al. 2017). Moreover, the clusters’ internal structure reinforces the improvement of internal capacities that allow the competitive progress of nations, especially the developing economy countries (Pietrobelli and Rabellotti 2005; Giuliani et al. 2005).
Due to the direct relationship between the cluster system and competitiveness, the notion of these structures and their approach have changed, answering to the need to evolve and adapt to current market conditions (Mudambi et al. 2017; Castellacci 2018; Yoon and Nadvi 2018; Comunian and England 2019). For instance, the premise used to be to gain a competitive advantage based on the synergy in a geographical location; whereas now, synergy is directed towards the formation of knowledge networks based on innovation and internationalization, including multiple factors that affect competitiveness (Cano-Kollmann et al. 2016; Sosnovskikh 2017; Taddeo et al. 2017).
Several models have been developed in order to relate the main factors and capacities with the contribution to business and cluster competitiveness. These advances include conceptual, qualitative, quantitative, statistical models, and the current trend that is framed towards dynamic models (Lorenzo et al. 2018; Alefari et al. 2018; Lee 2018; M. Porter 1990; Carayannis et al. 2012). The latter are characterized by a systemic vision that brings knowledge to the complex structure of the system and identifies the dynamic relationships between endogenous and exogenous variables (Castellacci 2018; Alefari et al. 2018; Smirnova et al. 2015). Furthermore, it allows the system simulation, evaluating strategies and policies, analyzing scenarios and making decisions based on systemic analysis (Wiley and Schaffernicht 2007; Sterman et al. 2015; J. Sterman 2000).
This work presents a novel approach, giving continuity to studies within the analysis of competitiveness in clusters using systems dynamics tools (Rocha et al. 2019; Yan and Liu 2018; Rodriguez Parada et al. 2016). Causal diagram construction allows for understanding the cluster system dynamic structure in relation to factors that affect its competitiveness and allows for validating the proposed H0 dynamic hypothesis, which constitutes the main contribution and challenges for this research.
2. Materials and Methods
This work developed three phases or complementary stages which are presented in Table 1.

Table 1.
Cluster competitiveness factors.
In phase 2, dynamic hypothesis construction follows the modeling process for complex problems, according to systems dynamics methodology (J. Sterman 2000), presented in Figure 1. This process begins with articulation of study problem, system delimitation, and modeling process scope. Subsequently, dynamic hypothesis is constructed using a block diagram and a causal diagram, allowing the understanding system, through feedback relationships between variables and feedback cycles, both reinforcement and balance. Once the dynamic hypothesis is validated, the process of formulating the flows and levels model begins, a model of differential equations that allows for observing the behavior of the system over time. This model must undergo the structure and behavior validation tests defined (J. Sterman 2000). The validated flows and levels model allows for the evaluation of policies and scenario analysis.
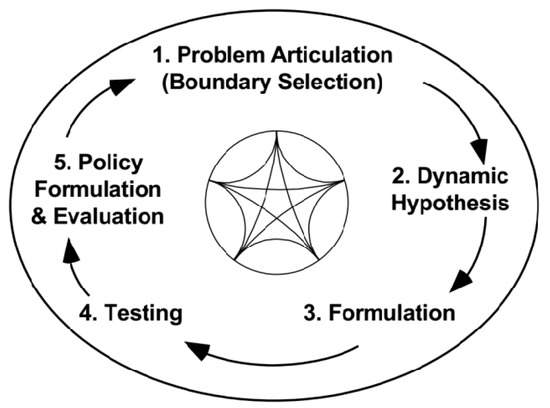
Figure 1.
Systems dynamics methodology (J. Sterman 2000).
In phase 3, validation is carried out by a panel of experts in the review of how the variables, parameters, and competitiveness factors influence the object of study “Cluster competitiveness level”. Relationship polarities and feedback cycles formation are reviewed; in this phase, structure validation tests are carried out from the theories and relationships identified, and according to the literature about dynamics systems (Qudrat-Ullah and Seong 2010; Valencia-Arias 2012). (1) Adjustment of limits: it was verified that the important concepts and structures to address political issues are endogenous to the model. (2) Verification of the structure: it was verified that the structure of the model is consistent with the relevant descriptive knowledge of the initial modeling system on the competitiveness of the cluster. The dimensional consistency tests, estimation, parameters, and extreme conditions verification are carried out directly to the level and flow model together with the behavior tests. The above corresponds to the continuation of the current work.
3. Results
3.1. Literature Review
3.1.1. Cluster Competitiveness
Cluster definition has evolved over time (Yoon and Nadvi 2018; Cano-Kollmann et al. 2016; Mutingi et al. 2017). Initially, Porter defined a cluster as a sectorial productive complex that performs similar or related activities in a spatial concentration geographically (M. Porter 1990). The concept refers in its structure to a group of companies that includes suppliers, related industries, support industries, government entities, universities, and research centers.
Clusters maintain their structure in terms of actors, but the approach has migrated towards knowledge cooperation systems and networks (Comunian and England 2019; Taddeo et al. 2017; Cabanelas et al. 2013) that promote and disseminate innovation (Felzensztein et al. 2018) and technological innovation (Mudambi et al. 2017).
Delgado et al. define a cluster as a geographic concentration of companies (or industries) around knowledge, skills, inputs, demand, and other competitiveness variables that promote the dissemination of knowledge and provide firms and regions with strength in international competition (Delgado et al. 2015). Authors like (Felzensztein et al. 2018), (Gancarczyk and Gancarczyk 2018), (Mudambi et al. 2017), (Sosnovskikh 2017), (Taddeo et al. 2017), (Cano-Kollmann et al. 2016), and (Sterman et al. 2015) argue that, beyond a spatial concentration and proximity effects between companies, the cluster system generates important externalities that are summarized in the specialization of work, use of resources, optimization of the supply chain, production improvement, reduction of transaction costs, knowledge/technology/resource transfer, export and internationalization, and migration towards global value chains (Gancarczyk and Gancarczyk 2018). These externalities are strengthened through networks of cooperation and competition (Sosnovskikh 2017; Taddeo et al. 2017; Delgado et al. 2015).
For Sosnovskikh, clusters can be defined according to three characteristics: proximity, value creation, and business environment. These are associated with related and support industries that, in combination with the innovation system, point not only to the competitive improvement of cluster companies (Felzensztein et al. 2018), but also to regional development (Gancarczyk and Gancarczyk 2018).
This is consistent with Porter’s theory, indicating that the cluster structure promotes the growth of the firm and the region, generating greater competitive advantage. Currently, cluster evolution has migrated from the evaluation of business competitiveness towards the development of regional clusters with global connection (Lorenzo et al. 2018; Mudambi et al. 2017; Lee 2018; Saranga et al. 2018), considered a key component of competitiveness in the global economy (Krägeloh et al. 2018; Sosnovskikh 2017; Zhou et al. 2018).
The development of regional clusters is a line of current research that is sustained as an engine of economic development and a source of industrial competitiveness (Felzensztein et al. 2018; Sosnovskikh 2017). Government action has promoted the formation of these competitiveness schemes, through the formulation of policies that facilitate their conformation and institutionality (Asheim et al. 2003; Gancarczyk and Gancarczyk 2018; Smirnova et al. 2015), the maturity of the signatures (Lee 2018; Sosnovskikh 2017), foreign investment (Lorenzo et al. 2018; Alefari et al. 2018), international cooperation (Delgado et al. 2015; Feser et al. 2008), and formation of knowledge networks (Felzensztein et al. 2018; Gancarczyk and Gancarczyk 2018; Alefari et al. 2018).
Investigations (Felzensztein et al. 2018; Gancarczyk and Gancarczyk 2018; Cano-Kollmann et al. 2016; Alefari et al. 2018; Smirnova et al. 2015; Delgado et al. 2015; Carbonara and Giannoccaro 2011; Lin et al. 2006) analyze clusters as a complex system that responds dynamically to technology and competition. Complexity is associated with the number of actors in the system and bilateral relations in operational transactions, market operations, knowledge transfer, and dissemination of innovation (Gancarczyk and Gancarczyk 2018; Menzel and Fornahl 2009; Huggins and Johnston 2010; Jack et al. 2008). The greater the maturity of the cluster, the greater the adoption of companies, government entities, and supporting industries, making the system more complex (Menzel and Fornahl 2009). Additionally, they question the initial model proposed by Porter (M. Porter 1990), because it is a static model that does not include real components that companies currently develop in their strategies, such as technological capabilities, management skills, and competitive strategies towards business improvement (Lorenzo et al. 2018; Mudambi et al. 2017).
It is then necessary to review the factors that affect the competitiveness of these systems and how its evaluation has been addressed through different models and approaches.
There is no academic consensus to conclude which factors have the greatest contribution in cluster competitiveness (Benzaquen et al. 2010). These factors differ in the evaluation and measurement of competitiveness because of their close relationship with the context in which they are developed, the variables considered, the frequency of measurement, and the statistical support in the evaluation process (Jia and Lin 2006; Lin et al. 2006). It is possible to identify common factors that start from a linear approach and guide the evolution trend of the cluster towards the systemic vision. Table 2 shows the relationship between the identified factors and the associated reference.
Table 2.
Cluster competitiveness factors.
Orozco et al. (2011) classify the factors of competitiveness as endogenous and exogenous, showing the importance of external factors such as policies and regulations in favor of internal factors such as innovation. Puello Pereira (2016) meticulously reviews competitiveness factors, adding them from a systemic approach in six main factors: innovation, organizational management, economic–financial management, productive management, commercial management, and cluster management. Sosnovskikh (2017) increases the level of aggregation of these factors and summarizes them in: factor of competence, factor of cooperation, and factor of sustainable development.
Current research maintains the systemic focus of the cluster, but migrates from factors of competitiveness to capabilities. Lorenzo et al. (2018) concluded that the competitive advantage of a firm is explained by the synergy of the company’s environment and internal capabilities, summarized in: technological capacity, management capacity/administration/management, and strategic capacity. The technological capacity is related to tools that improve productivity through process optimization and value creation (Chang and Singh 2000; Chuang and Lin 2017; Gambardella and Giarratana 2013; Gancarczyk and Gancarczyk 2018; Ruiz Ortega 2010), the ability to address with the strategic direction of human resources and alignment with the vision of the company, while the strategic capacity is related to the differentiation strategies in products, innovation, cost reduction, and quality improvement.
Saranga et al. (2018) argue that the theory on resources and capacities is an indispensable tool to understand competitive advantage, considering the structure of the innovation process, research and development, learning curve in product development processes, and development of tools and manufacturing as factors. The combination of these variables show market needs and help capitalize opportunities for competitiveness (Gambardella and Giarratana 2013; Lee 2018).
3.1.2. Cluster Competitiveness Assessment Models
The models developed to evaluate cluster competitiveness are mostly conceptual and qualitative (Puello Pereira 2016; Smirnova et al. 2015). The main model is the Diamond of Competitiveness (M. Porter 1990), which relates endogenous factors such as production capacity with exogenous factors such as demand, government policies, and related industries and support, through the analysis of rivalry and competition between companies.
Because of its great applicability, this model has been widely studied, adapted, and replicated in various systems and levels of aggregation, such as the Double Diamond Model of Competitiveness (Carayannis et al. 2012). This model is characterized by the dominance of the innovation factor from a systemic approach, which allows for increasing business efficiency and productivity with the strengthening of technological capacity regarding negotiation, and establishment of cooperation and international collaboration networks. Zhao et al. (2011) and Chung (2016) applied this model to the photovoltaic industry in China and the Asian logistics cluster, respectively. Other applications can be found in (Fundeanua and Cosmin 2014; Stavroulakis and Papadimitriou 2016; Tan 2006).
Regarding quantitative models, mathematical models based on algorithms, multicriteria evaluation, and statistical regressions are highlighted. Zubieta et al. (2011) quantified the productive competitiveness based on an algorithm of qualified and weighted attributes that includes factors of product, price, demand, quality, market share and competitive capacity in the medium and long term. Jarungkitkul and Sukcharoensin (2016) developed a multicriteria evaluation in the Asian logistics cluster, allowing the design of competitiveness policies and strategies in terms of integral logistics.
Lorenzo et al. (2018) developed a regression model that relates the dependent variable “competitive improvement” with technology, management capacity, and business strategy, as independent variables. The results conclude that technological capacity is the dominant explanatory variable of cluster competitiveness. Saranga et al. (2018) developed a statistical model based on the theory of resources and capabilities for the Indian automotive industry, considering the following variables: IPS (Innovation Process Structure), R&D (Research and Development), PEPPD (Past experience in product and process development) and TDM (Tooling development and manufacturing). Regression analysis shows significant correlation between IPS and PEPPD variables, and IPS and TDM; they also add that, in emerging economies, the PEPPD and the TDM determine the sustainability of the competitive advantage. Similar studies can be reviewed in (Felzensztein et al. 2018) and (Alefari et al. 2018).
For the modeling of these systems, Smirnova et al. (2015) argue that modeling the cluster dynamics and operation in an integrated environment is complex. Complexity is not only associated with the number of actors and variables, but also with the bidirectional relationships between these variables, parameters validation, and scenarios analysis. Statistical models do not fully capture the complexity and dynamics of the structure of these systems, and do not analyze causes or how they affect the behavior of the system over time. These statements are replicated in (Felzensztein et al. 2018; Castellacci 2018; Alefari et al. 2018; Zhou et al. 2018; Gancarczyk and Gancarczyk 2018; Mudambi et al. 2017; Smirnova et al. 2015) and (Menzel and Fornahl 2009), who argue the need to make approximations to cluster systems from other perspectives, research lines, and methodologies, such as dynamic mathematical modeling.
3.1.3. System Dynamics Applied to Cluster
System Dynamics is a method of simulation of continuous systems developed by Jay Forrester in 1960 to analyze supply chains in production systems and applications in industrial dynamics (Castellacci 2018; Forrester 1997). Because of its applicability in the understanding and learning of complex systems, and its ability to evaluate policies through scenario analysis, it has been used in multiple systems such as socioeconomic, social, natural, environmental, climate, among others (Dyner et al. 2008; Sterman et al. 2015).
Modeling with system dynamics includes the formulation of complex problems (Mollona 2008; J. D. Sterman 2003) and the construction of a dynamic hypothesis supported by different causal diagrams that unify the mental models of the actors involved in the process within its methodology (Martínez Marín and Arango Aramburo 2017; Radzicki and Tauheed 2009). This systemic analysis is complemented by system simulation, structure and behavior validation tests, and policy evaluation problems (Mollona 2008; J. D. Sterman 2003; Dyner et al. 2008; Sterman et al. 2015).
The additional characteristics of this methodology are summarized in the formulation of mathematical models with deterministic differential equations, the ability to associate the structure of the system with systemic archetypes of behavior, consider resistance to policies and statistical support in the calibration process, and estimation of parameters and validation (Castellacci 2018; J. Sterman 2000; J. W. Forrester 1997; Dyner et al. 2008; Hu et al. 2013; Alefari et al. 2018).
Current research necessities regarding cluster systems are associated with the use of new tools and methodologies for the analysis of complex systems (Smirnova et al. 2015), which facilitate the understanding of their systemic structure, the relationships between factors, and the contribution to competitiveness, not only at the business level, but at higher aggregation levels such as business, regional, and national cluster (Felzensztein et al. 2018; Gancarczyk and Gancarczyk 2018; Mudambi et al. 2017).
Still, the models reported in this growing line of research are few (Castellacci 2018; J. W. Forrester 1997; Alefari et al. 2018; Stavroulakis and Papadimitriou 2016). There are reports in the literature that are significant contributions to knowledge of the cluster system and system dynamics, serving as a reference for this research as the first systemic approach through the construction of a dynamic hypothesis.
Alefari et al. (2018) used system dynamics to model the importance of human resources in business competitiveness, arguing that this must be the most important human resource in companies due to their difficulty in imitating. In the construction of the hypothesis, they concluded that improving the performance of human resources is a combination of quality and quantity of work, and that developing these indicators translates into greater savings, resource generation, investment capacity, and competitiveness.
Dangelico et al. (2010) analyzed the dynamic complexity generated by knowledge and proximity in firms associated with a cluster of technologies, while Carbonara and Giannoccaro (2011) developed a model with systems dynamics to evaluate how the proximity of these companies affects cluster competitiveness.
Lin et al. (2006) developed a causal diagram dominated by reinforcement cycles to analyze the relationships between the factors that affect competitiveness in an industrial cluster, concluding in the labor force, technology, economic capacity, and market. Martínez Marín and Arango Aramburo (2017) constructed a simulation model with system dynamics to evaluate the investment in technological innovation capabilities that propitiate industrial growth for the software sector in Colombia. This dynamic hypothesis is also characterized by the dominance of positive feedback cycles, following the “Path Dependence” approach for developing industrial markets.
A systemic approach to study the role of entrepreneurship based on innovation of business cycles scenarios in Colombia was developed by (Aparicio et al. 2016). Preliminary results show that innovation is required as a long-term sustainable technological capacity to achieve greater productivity, competitiveness, and international collaboration.
A formal simulation model with System Dynamics (SD) to assess competitiveness in a generic company in the construction sector was developed by (Gilkinson and Dangerfield 2013). This new systemic approach facilitated the understanding of internal dynamics in companies that can promote a better future state with the monitoring of a competitiveness indicator.
3.2. Dynamic Hypothesis: Cluster Competitiveness
The Causal Diagram is the compilation of mental models through modeling techniques that facilitate the construction of the Dynamic Hypothesis (Gilkinson and Dangerfield 2013). These diagrams explain the system’s structure with feedback cycles resulting from the interaction of endogenous and exogenous variables (Arango et al. 2009; J. W. Forrester 1958). These cycles can be positive (R—Reinforcement) or negative (B—Balance). A reinforcement cycle is formed when a change in the source variable causes an effect in the same direction in the arrival variable, under the assumption that the other variables remain constant (J. Sterman 2000); otherwise, Balance Cycles are generated.
This study’s dynamic hypothesis is based on the interaction of “competitiveness level” with competitiveness factors documented by (Puello Pereira 2016) for cluster systems: Innovation, Productive Management, Financial Management, Organizational Management, Commercial Management, and Cluster Management. Thus, in the structure of the causal diagram, six additional levels are considered, associated with each competitiveness factor. Figure 2 shows the factors that affect the cluster and relationships to be validated by the authors in the study.
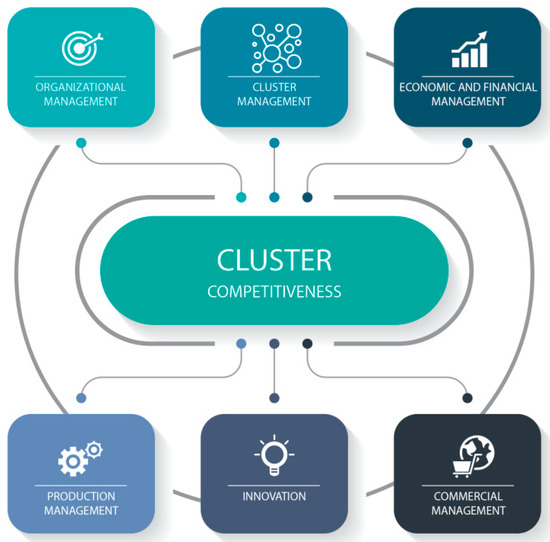
Figure 2.
Factors affecting Cluster Competitiveness.
For the proposed model validation, information from the furniture cluster in Atlántico, Colombia, was taken. The cluster is composed of companies that develop activities of design, production, distribution, marketing, and consumption of goods and services, whose objective is to contribute to the improvement of productivity through the articulation of the sector and the competitive development of its products and processes. The cluster has an operating income of $120.18 million dollars, has a 1.57% participation in the GDP of Atlántico, Colombia, and generates about 3200 jobs, presenting an average productivity index with medium sophistication (Puello Pereira 2016).
Table 3 presents cases of cluster analysis where factors proposed for this study were used and whose results highlight the positive effect of these factors on clusters’ competitiveness and performance.
Table 3.
Cluster Analysis Cases.
Studies from (Alefari et al. 2018; Puello Pereira 2016; Lin et al. 2006; Tan 2006; Fundeanua and Cosmin 2014; Stavroulakis and Papadimitriou 2016; Martínez Marín and Arango Aramburo 2017; Morecroft 2015; Aparicio et al. 2016; Gilkinson and Dangerfield 2013; Ghisolfi et al. 2017), characterized by the domain of positive cycles, associated with the systemic archetype “Success of the Successful” and the “Path Dependence” approach, are references for this hypothesis (J. Sterman 2000). This archetype has been extensively studied in the growth of industrial markets (Forrester 1997). As a differentiating factor, the negative cycle B1 is evidenced, resulting from the balance between the demand variable and the level of production (compliance with demand). The construction of the causal diagram was made in the Vensim PLE® simulation software. According to the above, the dynamic hypothesis was established:
Hypothesis 0 (H0).
The improvement of the factors of Innovation, Productive Management, Financial Management, Organizational Management, Commercial Management, and Cluster Management significantly increase the level of cluster competitiveness.
3.3. Proposed Causal Diagram
Figure 3 represents the proposed causal diagram in an aggregate form. Each competitiveness factor positively affects the Competitiveness Level variable (red lines). The formation of the 6 reinforcement cycles and a balance cycle takes place in the interaction between the factors, auxiliary variables, and exogenous variables.
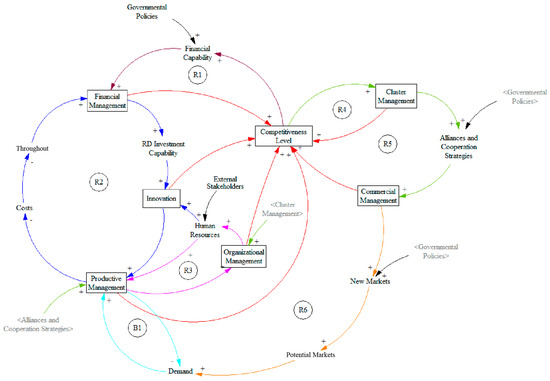
Figure 3.
Aggregate Causal Diagram—Cluster Competitiveness.
Figure 4 shows the formation of the cycles R1 and R2. The R1 cycle is formed as a consequence of the positive effect of the Competitiveness Level in the Financial Management factor. By increasing the level of competitiveness of the cluster, the improvement of the financial management factor is expected, strengthening the economic support to access credits and incentives of government policies (Sosnovskikh 2017; Alefari et al. 2018; Lee 2018; Chen et al. 2007). The cycle closes with positive action of the factor in mention in the Level of Competitiveness.
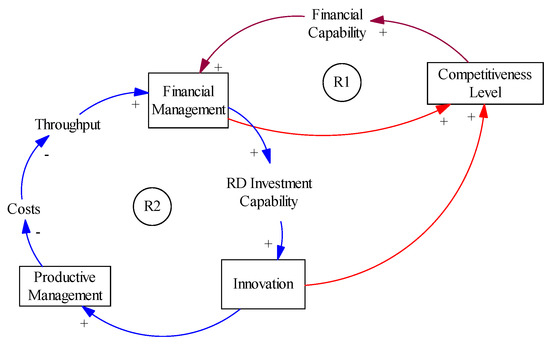
Figure 4.
R1 and R2 Cycles: Financial Management, Innovation, Productive Management, and Competitiveness Level.
The factors Financial Management, Innovation, and Productive Management intervene in the formation of the R2 cycle. Feedback is evidenced in the increase in financial management (cycle R1), translated into greater capital available for investment, which, in this case, refers to R&D investment as a condition that directly increases (Felzensztein et al. 2018; Lorenzo et al. 2018; Mudambi et al. 2017; Castellacci 2018; Sosnovskikh 2017). They positively affect Productive Management with the implementation of new technologies, operations, processes, and products that expand the productive capacity of cluster companies, increase the quality of products and/or associated services, reduce costs, and strengthen cluster entrepreneurship (Gancarczyk and Gancarczyk 2018; Lorenzo et al. 2018; Saranga et al. 2018; Aparicio et al. 2016; Gilkinson and Dangerfield 2013). The cycle ends with the positive effect on profitability, affecting Financial Management in the same direction.
Figure 5 shows the formation of the R3 cycle as an effect of Productive Management and its relationship with Organizational Management. The operational logic of this cycle is based on the fact that, by increasing Productive Management, Organizational Management must be increased to guarantee the systemic and sustainable growth of the cluster (Puello Pereira 2016). It must be responsible for providing Productive Management with qualified human resources to continue with reinforcement at the level of innovation (Cano-Kollmann et al. 2016; Alefari et al. 2018; Lin et al. 2006; Mudambi and Santangelo 2016), indicated in cycle R2.
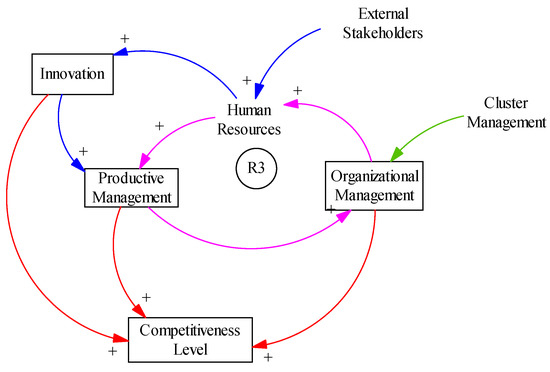
Figure 5.
R3 Cycle: Productive Management, Organizational Management and Competitiveness Level.
The R4 cycle strengthens the causal relationships between the Cluster Management and Competitiveness levels (Figure 6). This relationship is justified under the assumption that, at a higher level of competitiveness, greater management is required, in terms of market opening and expansion, representation and institutionality, integration, collaboration and cooperation, and strategic alliances between companies and external stakeholders (universities, research centers, governmental institutions, among others), (Fundeanua and Cosmin 2014; Ghisolfi et al. 2017; Ram Mudambi and Santangelo 2016). This last relationship gives rise to the formation of the R5 cycle due to the positive interaction with Commercial Management. Additionally, Cluster Management reinforces Organizational Management in terms of human resource capacity and strategic direction.
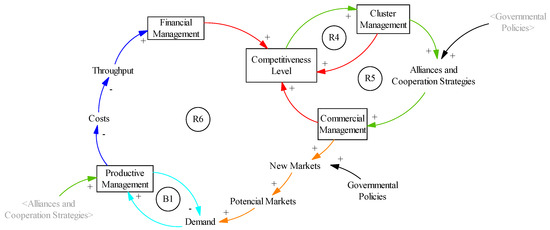
Figure 6.
Cycles R4, R5, R6, and B1. Commercial Management, Productive Management, Cluster Management, and Competitiveness Level.
The R6 cycle is formed as a continuation of R5, relating the factors Commercial Management, Productive Management, Organizational Management, Competitiveness Level, and Cluster Management. Cluster Management strengthens Commercial Management with the interaction of alliances and cooperation strategies, regional concentration, and industrial specialization with suppliers and support industries (Felzensztein et al. 2018; Lorenzo et al. 2018; Gilkinson and Dangerfield 2013; Sosnovskikh 2017). These, in turn, expand the capacity of expansion to new markets thanks to the action of government policies such as the Future-oriented Technology Analysis (FTA), for example; which increases the potential market share and affects the demand variable.
Once the relationship between demand and Productive Management is known, this process takes on the reinforcement of Organizational Management and the Level of Competitiveness.
4. Discussion
Literature review demonstrates a change in the conception of clusters, going from being static systems to dynamic systems of high complexity that seek to generate a competitive advantage to being regarded as the formation of knowledge networks that facilitate the transfer of innovation and technological diffusion (Sosnovskikh 2017; Alefari et al. 2018; Lee 2018). The cluster system as a dynamic system co-evolves in time according to market needs (Mudambi et al. 2017; Castellacci 2018; Yoon and Nadvi 2018).
The research approach associated with these systems has gone from analyzing business competitiveness to studying the cluster as an engine of regional economic development, considered a key element in global competitiveness (Felzensztein et al. 2018; Krägeloh et al. 2018; Lorenzo et al. 2018; Castellacci 2018). This condition has prompted the formulation of government policies that support these systemic structures towards competitiveness (Gancarczyk and Gancarczyk 2018; Lorenzo et al. 2018; Saranga et al. 2018).
Current research focuses on the need for new approaches in cluster modeling and measurement of its competitiveness, recognizing its systemic structure of high dynamics and complexity (Gancarczyk and Gancarczyk 2018; Smirnova et al. 2015). The complexity is not only focused on the number of actors, but also on the bidirectional dynamic relationships between these, delay effects, counterintuitive behavior, and resistance to policies–conditions that hinder the modeling of these systems in a real economic environment (Alefari et al. 2018; Smirnova et al. 2015).
The models developed to evaluate cluster competitiveness are useful, but not according to the current requirements of the modeling of these systems (Smirnova et al. 2015). It requires tools to understand the functioning of the system from its structure, understand the complexity of the interactions between variables, learn the dynamics of the system based on the causality relationships and evaluate the behavior of the system before the effect of strategies, scenarios, or policies. In addition, it is necessary to be able to quantify competitiveness through the measurement of their factors and the construction of indicators that demonstrate the maturity of the cluster and the capacity for international competition (Sosnovskikh 2017).
This study proposes a first systemic approach in the construction of the dynamic hypothesis, through the development of a causal diagram, following the methodology of dynamic simulation of systems. System dynamics allows the analysis of complex systems, by means of tools that facilitate the modeling through the understanding of causality relationships between variables and their effect on the system’s behavior over time. Currently, it is a growing line of research with applications in various systems, especially useful in the formulation of problems, construction of dynamic hypothesis, simulation of scenarios, comparison of system states, and evaluation of policies and strategies.
For the construction of the causal diagram, the structure of the cluster system and the main variables were associated with the factors proposed in (Puello Pereira 2016). The dynamic hypothesis tested in this study was H0: “The improvement of the factors of Innovation, Productive Management, Financial Management, Organizational Management, Commercial Management, and Cluster Management significantly increases the level of cluster competitiveness”.
As a result of this approach, the causal diagram shown in Figure 1 relates the variable “Competitiveness Level” with each of the factors under study. Causal relationships between these factors and demand variables, alliances–cooperation, credit capacity, and government policies were analyzed. Support industries such as universities are also linked, indispensable in the training of competitive human resources that meet the needs of the market.
The causal diagram is dominated by the six positive feedback cycles and balanced by a negative cycle between demand and productive management. Structure analysis corroborates the dynamic hypothesis proposed and associated with structural patterns “Path Dependence” and the archetype “Success of the Successful”, characteristic in competitive growing industrial markets (Mudambi et al. 2017; J. Sterman 2000; Menzel and Fornahl 2009) and, in this case, applied to a cluster’s competitive growth. Therefore, it is concluded that the factors of Innovation, Productive Management, Financial Management, Organizational Management, Commercial Management, and Cluster Management positively increase the level of a cluster’s competitiveness.
Dynamic hypothesis was validated by an expert panel and calibrated for the furniture Cluster in Atlántico, Colombia. This work constitutes an initial phase for a systemic approach to cluster systems in general, and allows for directing strategies and actions by competitiveness factor, according to their impact on the level of competitiveness. In future work, the second phase of the modeling process is presented with a formal model of dynamic simulation and evaluation of actions within the cluster strategy.
The limitations associated with this study mainly focus on the availability of cluster actors to actively participate in interviews, group modeling sessions, application of measurement instruments, and data availability, given the business informality that characterizes the wood and furniture sector in Atlántico, Colombia. From the modeling point of view, these limitations are overcome with the review of literature that contributes to the justification of the formation of causal relationships between variables.
5. Conclusions
The need for industrial sustainable development around environmental problems and climate change requires the creation of strategies from the regions. Therefore, in future work these aspects must be included from the initial point of modeling.
The tendency of change of competitiveness factors towards technological capabilities, production, and competitiveness strategy, as dominant variables that determine the level of competitiveness of a cluster, should also be considered.
New research could also aim to recognize the trend towards the formation of multipolar networks of firms competing for intracluster collaboration. This has marked the change of competitiveness towards the “Coopetition”, integration between collaboration and competition. Observing the systemic behavior of these new forces is a source of scientific interest around the cluster system.
Finally, the detailed construction of the dynamic structure of each level or competitiveness factor and the formal model of simulation to evaluate strategies that promote competitiveness in a particular cluster is proposed. Within these strategies, for industrial clusters, it is important to relate the technological adoption component around Industry 4.0.
Author Contributions
Writing—review & editing, S.M.-M., N.P.-P. and D.O.-G. All authors have read and agreed to the published version of the manuscript.
Funding
This research received no external funding.
Conflicts of Interest
The authors declare no conflict of interest.
References
- Alefari, Mudhafar, Angel Maria Fernández Barahona, and Konstantinos Salonitis. 2018. Modelling Manufacturing Employees’ Performance Based on a System Dynamics Approach. Procedia CIRP 72: 438–43. [Google Scholar] [CrossRef]
- Alic, John A. 1987. Evaluating Industrial Competitiveness at the Office of Technology Assessment. Technology in Society 9: 1–17. [Google Scholar] [CrossRef]
- Álvarez Falcón, César. 2014. Innovación, Competitividad y Nuevos Modelos de Negocio. Available online: https://sica.upc.edu.pe/sites/blogs.upc.edu.pe.epg.cuaderno-epg/files/02AlvarezEd8.pdf (accessed on 19 December 2019).
- Aparicio, Sebastain, David Urbano, and Diego Gómez. 2016. The Role of Innovative Entrepreneurship within Colombian Business Cycle Scenarios: A System Dynamics Approach. Futures 81: 130–47. [Google Scholar] [CrossRef]
- Arango, Santiago, John Prado, and Isaac Dyner. 2009. Evaluación de Políticas Públicas Para La Reducción de La Criminalidad En Medellín: Una Aproximación Con Dinámica de Sistemas. Ensayos Sobre Política Económica 27: 80–109. [Google Scholar] [CrossRef]
- Araoz, Mercedes, Carlos Carrillo, and Sandra van Gihhoven. 2011. Indicadores de Competitividad Para Los Países Andinos. Lima: Universidad del Pacífico. [Google Scholar]
- Arias, Milena Esther, and Silverio Alarcón. 2019. Sistemas Regionales de Innovación Agroalimentarios de Colombia: Un Análisis Factorial y de Clúster Para La Industria. Cuadernos de Desarrollo Rural 16: 2. [Google Scholar] [CrossRef]
- Arraut, Luis Carlos. 2010. La Gestión de Calidad Como Innovación Organizacional Para La Productividad En La Empresa. Revista EAN, 24–41. [Google Scholar] [CrossRef]
- Asheim, Bjørn T., Arne Isaksen, Claire Nauwelaers, and Franz Tödtling. 2003. Regional Innovation Policy for Small+ Medium Enterprises. Cheltenham: Edward Elgar Publishing. [Google Scholar]
- Benzaquen, Jorge-Carpio, Christian Alberto, Luis Alfoso del. Zegarra, and Luis Alberto Valdivia. 2010. Un Índice Regional de Competitividad Para Un País. Revista Cepal 102: 69–86. [Google Scholar] [CrossRef]
- Berumen, Sergio A. 2006. Una Aproximación a Los Indicadores de La Competitividad Local y Factores de La Producción. Cuadernos de Administración 19: 145–63. [Google Scholar]
- Cabanelas, Pablo, José Cabanelas Omil, and Xosé H. Vázquez. 2013. A Methodology for the Construction of Dynamic Capabilities in Industrial Networks: The Role of Border Agents. Industrial Marketing Management 42: 992–1003. [Google Scholar] [CrossRef]
- Cano-Kollmann, Marcelo, John Cantwell, Thomas J. Hannigan, Ram Mudambi, and Jaeyong Song. 2016. Knowledge Connectivity: An Agenda for Innovation Research in International Business. Journal of International Business Studies 47: 255–62. [Google Scholar] [CrossRef]
- Carayannis, Elias G., Vivienne Wei, and Liu Wang. 2012. Competitiveness Model—A Double Diamond. Journal of the Knowledge Economy 3: 280. [Google Scholar] [CrossRef]
- Carbonara, Nunzia, and Ilaria Giannoccaro. 2011. Interpreting the Role of Proximity on Industrial District Competitiveness Using a Complexity Science-Based View and Systems Dynamics Simulation. Journal of Geographical Systems 13: 415–36. [Google Scholar] [CrossRef]
- Castellacci, Fulvio. 2018. Co-Evolutionary Growth: A System Dynamics Model. Economic Modelling 70: 272–87. [Google Scholar] [CrossRef]
- Chang, Sea-Jin, and Harbir Singh. 2000. Corporate and Industry Effects on Business Unit Competitive Position. Strategic Management Journal 21: 739–52. [Google Scholar] [CrossRef]
- Chavarría, Hugo, Sergio Sepúlveda, and Patricia Rojas. 2002. Competitividad: Cadenas Agroalimentarias y Territorios Rurales. Elementos Conceptuales. Serie Documentos Técnicos (IICA); San Jose: IICA. [Google Scholar]
- Chen, Yiche, Yan-Ru Li, Pi-feng Hsieh, and Chung-Shing Lee. 2007. Strategies of Developing Deep Ocean Water Industry-Cluster and Value Network Views. Paper presented at PICMET’07-2007 Portland International Conference on Management of Engineering & Technology, Portland, OR, USA, August 5–9; pp. 351–57. [Google Scholar]
- Chiesa, Vittorio, and Davide Chiaroni. 2004. Industrial Clusters in Biotechnology: Driving Forces, Development Processes, and Management Practices. London: Imperial College Press. [Google Scholar] [CrossRef]
- Chuang, Shu-Hui, and Hong-Nan Lin. 2017. Performance Implications of Information-Value Offering in e-Service Systems: Examining the Resource-Based Perspective and Innovation Strategy. The Journal of Strategic Information Systems 26: 22–38. [Google Scholar] [CrossRef]
- Chung, Tae Won. 2016. A Study on Logistics Cluster Competitiveness among Asia Main Countries Using the Porter’s Diamond Model. The Asian Journal of Shipping and Logistics 32: 257–64. [Google Scholar] [CrossRef]
- Comunian, Roberta, and Lauren England. 2019. Creative Clusters and the Evolution of Knowledge and Skills: From Industrial to Creative Glassmaking. Geoforum 99: 238–47. [Google Scholar] [CrossRef]
- Dangelico, Rosa Maria, Achille Claudio Garavelli, and Antonio Messeni Petruzzelli. 2010. A System Dynamics Model to Analyze Technology Districts’ Evolution in a Knowledge-Based Perspective. Technovation. Technovation 30: 142–53. [Google Scholar] [CrossRef]
- Danko, Lukáš, Pavel Bednář, and Jana Matošková. 2017. Managers’ Activities within Cultural and Creative Clusters: An Essential Element for Cluster Development in the Visegrád Countries. Creativity Studies 10: 26–42. [Google Scholar] [CrossRef]
- Delgado, Mercedes, Michael E. Porter, and Scott Stern. 2015. Defining Clusters of Related Industries. Journal of Economic Geography 16: 1–38. [Google Scholar] [CrossRef]
- Dyner, Isaac, Gloria Elena Peña Zapata, and Santiago Arango. 2008. Modelamiento Para La Simulación de Sistemas Socio-Económicos y Naturales. Edited by Universidad Nacional de Colombia. Medellín: Universidad Nacional de Colombia. [Google Scholar]
- Feldman, Maryann, and Richard Florida. 1994. The Geographic Sources of Innovation: Technological Infrastructure and Product Innovation in the United States. Annals Association of American Geographers 84: 210–29. Available online: http://www.scopus.com/inward/record.url?eid=2-s2.0-0028600704&partnerID=tZOtx3y1 (accessed on 19 December 2019). [CrossRef]
- Felzensztein, Christian, Eli Gimmon, and Kenneth R. Deans. 2018. Coopetition in Regional Clusters: Keep Calm and Expect Unexpected Changes. Industrial Marketing Management 69: 116–24. [Google Scholar] [CrossRef]
- Fernando, Yudi, and Wen Xin Wah. 2017. The Impact of Eco-Innovation Drivers on Environmental Performance: Empirical Results from the Green Technology Sector in Malaysia. Sustainable Production and Consumption 12: 27–43. [Google Scholar] [CrossRef]
- Feser, Edward, Henry Renski, and Harvey Goldstein. 2008. Clusters and Economic Development Outcomes: An Analysis of the Link between Clustering and Industry Growth. Economic Development Quarterly 22: 324–44. [Google Scholar] [CrossRef]
- Forrester, Jay W. 1958. Industrial Dynamics: A Major Breakthrough for Decision Makers. Harvard Business Review 36: 37–66. [Google Scholar]
- Forrester, Jay Wright. 1997. Industrial Dynamics. Journal of the Operational Research Society 48: 1037–41. [Google Scholar] [CrossRef]
- Fundeanu, Daniela Doina, and Cosmin Sandu Badele. 2014. The Impact of Regional Innovative Clusters on Competitiveness. Procedia Social and Behavioral Sciences 124: 405–14. [Google Scholar] [CrossRef]
- Gambardella, Alfonso, and Marco S. Giarratana. 2013. General Technological Capabilities, Product Market Fragmentation, and Markets for Technology. Research Policy 42: 315–25. [Google Scholar] [CrossRef]
- Gancarczyk, Marta, and Jacek Gancarczyk. 2018. Proactive International Strategies of Cluster SMEs. European Management Journal 36: 59–70. [Google Scholar] [CrossRef]
- García Garnica, Alejandro, and Arturo Lara Rivero. 2004. Clúster y Coo-Petencia (Cooperación y Competencia) Industrial: Algunos Elementos Teóricos Por Considerar. Revista Latinoamericana de Economía 35: 141–61. [Google Scholar] [CrossRef]
- Ghisolfi, Verônica, Gisele de Lorena Diniz, Renato Ribeiro, and Helena Xavier. 2017. System Dynamics Applied to Closed Loop Supply Chains of Desktops and Laptops in Brazil: A Perspective for Social Inclusion of Waste Pickers. Waste Management 60: 14–31. [Google Scholar] [CrossRef] [PubMed]
- Gilkinson, Norman, and Brian Dangerfield. 2013. Some Results from a System Dynamics Model of Construction Sector Competitiveness. Mathematical and Computer Modelling 57: 2032–43. [Google Scholar] [CrossRef]
- Giuliani, Elisa, Carlo Pietrobelli, and Roberta Rabellotti. 2005. Upgrading in Global Value Chains: Lessons from Latin American Clusters. World Development 33: 549–73. [Google Scholar] [CrossRef]
- Gómez-Charris, Yulineth, David Ovallos, and Laura Cortabarría. 2017. Definición de Un Perfil Que Maximice La Capacidad Innovadora y Competitiva En Las Organizaciones. Caso de Aplicación: Sector Muebles Atlántico–Colombia. Revista ESPACIOS 38: 9. [Google Scholar]
- Hojnik, Jana, Mitja Ruzzier, and Aleš Lipnik. 2014. Outline of Implemented Eco-Innovation Activities—The Case of Clusters of South Eastern European Region. Organizacija 47: 267–79. [Google Scholar] [CrossRef]
- Hu, Tai-Shan, Chien-Yuan Lin, and Su-Li Chang. 2005. Role of Interaction between Technological Communities and Industrial Clustering in Innovative Activity: The Case of Hsinchu District, Taiwan. Urban Studies 42: 1139–60. [Google Scholar] [CrossRef]
- Hu, Bo, Armin Leopold, and Stefan Pickl. 2013. Transition towards Renewable Energy Supply—A System Dynamics Approach. In Green Growth and Sustainable Development. Berlin/Heidelberg: Springer, pp. 217–26. [Google Scholar]
- Huggins, Robert, and Andrew Johnston. 2010. Knowledge Flow and Inter-Firm Networks: The Influence of Network Resources, Spatial Proximity and Firm Size. Entrepreneurship and Regional Development 22: 457–84. [Google Scholar] [CrossRef]
- Irawati, Dessy, and David Charles. 2010. The Involvement of Japanese MNEs in the Indonesian Automotive Cluster. International Journal of Automotive Technology and Management 10: 180–96. [Google Scholar] [CrossRef]
- Jack, Sarah, Sarah Drakopoulou Dodd, and Alistair R. Anderson. 2008. Change and the Development of Entrepreneurial Networks over Time: A Processual Perspective. Entrepreneurship and Regional Development 20: 125–59. [Google Scholar] [CrossRef]
- Jacobs, Dany, and Ard Pieter De Man. 1996. Clusters, Industrial Policy and Firm Strategy: A Menu Approach. Technology Analysis and Strategic Management 8: 425–37. Available online: http://www.scopus.com/inward/record.url?eid=2-s2.0-0030403839&partnerID=tZOtx3y1 (accessed on 19 December 2019). [CrossRef]
- James, Al. 2005. Demystifying the Role of Culture in Innovative Regional Economies. Regional Studies 39: 1197–216. [Google Scholar] [CrossRef]
- Jarungkitkul, Wanida, and Sorasart Sukcharoensin. 2016. Benchmarking the Competitiveness of the ASEAN 5 Equity Markets: An Application of Porter’s Diamond Model. Benchmarking: An International Journal 23: 1312–40. [Google Scholar] [CrossRef]
- Jia, M., and X. Lin. 2006. Spillover Effect and Determination of Innovation Time for Industrial Cluster. Xinan Jiaotong Daxue Xuebao/Journal of Southwest Jiaotong University 41: 300–4. Available online: https://www.scopus.com/inward/record.uri?eid=2-s2.0-33747030902&partnerID=40&md5=3811eff8ee78486795b2708359b78633 (accessed on 19 December 2019).
- Jiang, Bing, and Cuixia Li. 2016. Application of Nonparametric Model to Measure Productivity of Dairy Industry Cluster. Revista Tecnica de La Facultad de Ingenieria Universidad Del Zulia 39: 80–86. [Google Scholar] [CrossRef]
- Krägeloh, Christian U., Grace Y. Wang, Qingbai Zhao, Oleg N. Medvedev, Yan Wu, and Marcus A. Henning. 2018. Revised Competitiveness Index for Use in China: Translation and Rasch Analysis. International Journal of Educational Research 90: 78–86. [Google Scholar] [CrossRef]
- Lee, Chang-Yang. 2018. Geographical Clustering and Firm Growth: Differential Growth Performance among Clustered Firms. Research Policy 47: 1173–84. [Google Scholar] [CrossRef]
- Li, Chong-Mao, Tao Cui, Rui Nie, Yuli Shan, Juan Wang, and Xiangyan Qian. 2017. A Decision Model to Predict the Optimal Size of the Diversified Management Industry from the View of Profit Maximization and Coordination of Industrial Scale. Sustainability 9: 642. [Google Scholar] [CrossRef]
- Lin, Chin Huang, Chiu Mei Tung, and Chih Tai Huang. 2006. Elucidating the Industrial Cluster Effect from a System Dynamics Perspective. Technovation 26: 473–82. [Google Scholar] [CrossRef]
- Lorenzo, Juan Ramón Ferrer, Maria Teresa Maza Rubio, and Silvia Abella Garcés. 2018. The Competitive Advantage in Business, Capabilities and Strategy. What General Performance Factors Are Found in the Spanish Wine Industry? Wine Economics and Policy 7: 94–108. [Google Scholar] [CrossRef]
- Maglioni, Samir. 2011. COOPERACION EMPRESARIAL EN INNOVACIÓN Y DESARROLLO: Un Camino Con Alta Probabilidad de Crecimiento y Éxito Empresarial 2011. Master’s thesis, Fachhochschule Mainz, University of Applied Sciences, Business School, Mannheim, Germany. [Google Scholar]
- Malmberg, Anders, and Peter Maskell. 1997. Towards an Explanation of Regional Specialization and Industry Agglomeration. European Planning Studies 5: 25–41. Available online: http://www.scopus.com/inward/record.url?eid=2-s2.0-0030863517&partnerID=tZOtx3y1 (accessed on 19 December 2019). [CrossRef]
- Martínez Marín, Sindy Johana, and S. Arango Aramburo. 2017. Dynamics Simulation Model for Evaluating the Investment in Technological Innovation in the Capabilities of Colombia Software Industries. Espacios 38. Available online: https://www.researchgate.net/publication/316696657_Dynamics_simulation_model_for_evaluating_the_investment_in_technological_innovation_in_the_capabilities_of_Colombia_Software_industries (accessed on 19 December 2019).
- Menzel, Max-Peter, and Dirk Fornahl. 2009. Cluster Life Cycles—Dimensions and Rationales of Cluster Evolution. Industrial and Corporate Change 19: 205–38. [Google Scholar] [CrossRef]
- Mollona, Edoardo. 2008. J. Morecroft, Strategic Modelling and Business Dynamics. A Feedback Systems Approach. Journal of Management & Governance 12: 213. [Google Scholar]
- Morecroft, John. 2015. Strategic Modelling and Business Dynamics: A Feedback Systems Approach. Edited by John Wiley & Sons. London: John Wiley & Sons. [Google Scholar]
- Mudambi, Ram, and Grazia D. Santangelo. 2016. From Shallow Resource Pools to Emerging Clusters: The Role of Multinational Enterprise Subsidiaries in Peripheral Areas. Regional Studies 50: 1965–79. [Google Scholar] [CrossRef]
- Mudambi, Ram, Susan M. Mudambi, Debmalya Mukherjee, and Vittoria G. Scalera. 2017. Global Connectivity and the Evolution of Industrial ClustersFrom Tires to Polymers in Northeast Ohio. Industrial Marketing Management 61: 20–29. [Google Scholar] [CrossRef]
- Mutingi, Michael, Charles Mbohwa, and Venkata P. Kommula. 2017. System Dynamics Approaches to Energy Policy Modelling and Simulation. Energy Procedia 141: 532–39. [Google Scholar] [CrossRef]
- Navarro Arancegui, Mikel. 2002. La Cooperación Para La Innovación de La Empresa Española Desde Una Perspectiva Internacional Comparada. Economía Industrial 346: 47–66. Available online: https://dialnet.unirioja.es/servlet/articulo?codigo=716695&info=resumen&idioma=SPA (accessed on 19 December 2019).
- Orozco, Francisco A., Alfredo F. Serpell, Keith R. Molenaar, and Eric Forcael. 2011. Modeling Competitiveness Factors and Indexes for Construction Companies: Findings of Chile. Journal of Construction Engineering and Management 140: B4013002. [Google Scholar] [CrossRef]
- Ovallos-Gazabon, David, and Paola Amar. 2014. Perfil Innovador de La Industria Manufacturera Colombiana. Caso Del Sector Metalmecánico de Barranquilla. Revista Ingenierias Universidad de Medellin 13: 115–36. [Google Scholar] [CrossRef]
- Ovallos-Gazabon, David, Jaime Velez-Zapata, Alberto Figueroa, Jaime Sarmiento, and Juancri Barrera. 2017. Conocimiento y Desarrollo Socioeconómico. Una Revisión de La Literatura. Revista ESPACIOS 38: 43. [Google Scholar]
- Pérez, Harold Alexis, and Bertha Inés Villalobos. 2010. Análisis Competitivo Del Sector Madera y Muebles de La Ciudad de Barranquilla. Inge-CUC 6: 195–214. [Google Scholar]
- Pietrobelli, Carlo, and Roberta Rabellotti. 2005. Mejora de La Competitividad En Clusters y Cadenas Productivas En América Latina: El Papel de Las Políticas. Washington, DC: Inter-American Development Bank. [Google Scholar]
- Porter, Michael. 1990. The Competitive Advantage of Nations. Harvard Business Review 68: 73–93. [Google Scholar]
- Porter, Michael. 2003. The Economic Performance of Regions. Regional Studies 37: 545–46. [Google Scholar] [CrossRef]
- Puello Pereira, Nataly del Rosario. 2016. Modelo Para La Medición de La Competitividad En Clusters Basado En Dinámica de Sistemas: Caso de Estudio: Cluster de Muebles Del Departamento Del Atlántico. Master’s thesis, Universidad Tecnológica de Bolivar, Cartagena, Colombia. [Google Scholar]
- Qudrat-Ullah, Hassan, and Baek Seo Seong. 2010. How to Do Structural Validity of a System Dynamics Type Simulation Model: The Case of an Energy Policy Model. Energy Policy 38: 2216–24. [Google Scholar] [CrossRef]
- Radzicki, Michael J., and Linwood Tauheed. 2009. In Defense of System Dynamics: A Response to Professor Hayden. Journal of Economic Issues 43: 1043–61. [Google Scholar] [CrossRef]
- Rocha, Hector, Martin Kunc, and David B. Audretsch. 2019. Clusters, Economic Performance, and Social Cohesion: A System Dynamics Approach. Regional Studies, 1–14. [Google Scholar] [CrossRef]
- Rodriguez Parada, Adolfo, Yara Anahi Jiménez Nieto, Laura Verónica Herrera Franco, and Patricia Espinosa Garcia. 2016. Desarrollo de Clústeres Industriales: Un Enfoque de Dinámica de Sistemas/Development of Industrial Clusters: A System Dynamics Approach. RICEA Revista Iberoamericana de Contaduria, Economia y Administración 5: 329–50. [Google Scholar] [CrossRef]
- Rokotyanskaya, Violetta V. 2015. The Development of Assessment of the Integral Coefficient of the Region’s Competitiveness. Moscow State University of Food Production, Volokolamskoye 9: 1679–85. [Google Scholar]
- Ruiz Ortega, María José. 2010. Competitive Strategies and Firm Performance: Technological Capabilities’ Moderating Roles. Journal of Business Research 63: 1273–81. [Google Scholar] [CrossRef]
- Saranga, Haritha, Rejie George, Judith Beine, and Ulli Arnold. 2018. Resource Configurations, Product Development Capability, and Competitive Advantage: An Empirical Analysis of Their Evolution. Journal of Business Research 85: 32–50. [Google Scholar] [CrossRef]
- Sher, Peter J., and Phil Y. Yang. 2005. The Effects of Innovative Capabilities and R&D Clustering on Firm Performance: The Evidence of Taiwan’s Semiconductor Industry. Technovation 25: 33–43. [Google Scholar] [CrossRef]
- Smirnova, Gulnara, Rustem Sabitov, Boris Morozov, Shamil Sabitov, Bulat Sirazetdinov, and Natalya Elizarova. 2015. To the Problem of Dynamic Modeling and Management in an Integrated Environment of the Industrial Cluster. IFAC-PapersOnLine 28: 1230–35. [Google Scholar] [CrossRef]
- Sosnovskikh, Sergey. 2017. Industrial Clusters in Russia: The Development of Special Economic Zones and Industrial Parks. Russian Journal of Economics 3: 174–99. [Google Scholar] [CrossRef]
- Stavroulakis, Peter J., and Stratos Papadimitriou. 2016. The Strategic Factors Shaping Competitiveness for Maritime Clusters. Research in Transportation Business and Management 19: 34–41. [Google Scholar] [CrossRef]
- Steinle, Claus, and Holger Schiele. 2002. When Do Industries Cluster? A Proposal on How to Assess an Industry’s Propensity to Concentrate at a Single Region or Nation. Research Policy 31: 849–58. Available online: http://www.scopus.com/inward/record.url?eid=2-s2.0-31244436948&partnerID=tZOtx3y1 (accessed on 19 December 2019). [CrossRef]
- Sterman, John. 2000. Business Dynamics: Systems Thinking and Modeling for a Complex World. New York: McGraw-Hill Education. [Google Scholar]
- Sterman, John D. 2003. Business Dynamics: Systems Thinking and Modeling for a Complex World. July-August; ESD-WP-2003-01.13. Paper presented at ESD Internal Symposium, Boston, MA, USA, January 13. [Google Scholar]
- Sterman, John, Rogelio Oliva, Kevin Linderman, and Elliot Bendoly. 2015. System Dynamics Perspectives and Modeling Opportunities for Research in Operations Management. Journal of Operations Management 39–40: 1–5. [Google Scholar] [CrossRef]
- Taddeo, Raffaella, Alberto Simboli, Anna Morgante, and Suren Erkman. 2017. The Development of Industrial Symbiosis in Existing Contexts. Experiences From Three Italian Clusters. Ecological Economics 139: 55–67. [Google Scholar] [CrossRef]
- Taib, Gunarif, S. Santosa, Masrul Djalal, and H. Helmi. 2015. Characteristic of Small Scale Food Industry Cluster in West Sumatera. International Journal on Advanced Science, Engineering and Information Technology 5: 131–34. [Google Scholar] [CrossRef]
- Tan, Justin. 2006. Growth of Industry Clusters and Innovation: Lessons from Beijing Zhongguancun Science Park. Journal of Business Venturing 21: 827–50. [Google Scholar] [CrossRef]
- Teece, David J., Gary Pisano, and Amy Shuen. 1997. Dynamic Capabilties and Strategic Management. Strategic Management Journal 18: 509–33. [Google Scholar] [CrossRef]
- Trigo, Alexandre, and Xavier Vence. 2012. Scope and Patterns of Innovation Cooperation in Spanish Service Enterprises. Research Policy 41: 602–13. [Google Scholar] [CrossRef]
- Trippl, Michaela, and Anne Otto. 2009. How to Turn the Fate of Old Industrial Areas: A Comparison of Cluster-Based Renewal Processes in Styria and the Saarland. Environment and Planning A 41: 1217–33. [Google Scholar] [CrossRef]
- Tsertseil, J. S., V. V. Kookueva, and K. V. Ordov. 2017. Regional Competitiveness within the Cluster’s Territory: Case of the Volga Federal District’s Chemical Industry. Progress in Economics Research 37: 169–84. [Google Scholar]
- Valencia-Arias, Alejandro. 2012. Aproximaciones a La Validación En Dinámica de Sistemas. Puentes 6: 61–68. [Google Scholar]
- Vivas, Salvador. 2013. Capacidades Dinámicas Para La Competitividad y La Innovación En El Siglo XXI. Cuadernos de Administración 26: 119–39. [Google Scholar]
- Wiley, John, and Martin Schaffernicht. 2007. Morecroft: Strategic Modelling Morecroft: Strategic Modelling. Padstow: TJ International Ltd, pp. 168–71. [Google Scholar]
- Xu, Y. 2016. Green Building Cluster: Key to China’s Green Building Industrialisation? In Sustainable Buildings and Structures, Proceedings of the 1st International Conference on Sustainable Buildings and Structures, ICSBS 2015. Suzhou: Department of Urban Planning and Design, Xi’an Jiaotong Liverpool University, pp. 261–68. Available online: https://www.scopus.com/inward/record.uri?eid=2-s2.0-84949845136&partnerID=40&md5=e8fbb366e729860518c26d14a6b7487f (accessed on 19 December 2019).
- Yan, Bo, and Lifeng Liu. 2018. A New Transshipment Policy in Cluster Supply Chains Based on System Dynamics. RAIRO-Operations Research 52: 1–15. [Google Scholar] [CrossRef]
- Yoon, Sukjin, and Khalid Nadvi. 2018. Industrial Clusters and Industrial Ecology: Building ‘Eco-Collective Efficiency’in a South Korean Cluster. Geoforum 90: 159–73. [Google Scholar] [CrossRef]
- Zhao, Zhen-Yu, Shuang-Ying Zhang, and Jian Zuo. 2011. A Critical Analysis of the Photovoltaic Power Industry in China–From Diamond Model to Gear Model. Renewable and Sustainable Energy Reviews 15: 4963–71. [Google Scholar] [CrossRef]
- Zhou, Jian, Ning Huang, David W. Coit, and Frank A. Felder. 2018. Combined Effects of Load Dynamics and Dependence Clusters on Cascading Failures in Network Systems. Reliability Engineering & System Safety 170: 116–26. [Google Scholar]
- Zubieta, Roberto, José Villadeamigo, and Luciano Cianci. 2011. Indice de Competitividad Productiva Aplicado a Empresas o Clusters. Industriales Manufactureros. Buenos Aires: Facultad de Ingeniería, Universidad de Buenos Aires. [Google Scholar]


© 2020 by the authors. Licensee MDPI, Basel, Switzerland. This article is an open access article distributed under the terms and conditions of the Creative Commons Attribution (CC BY) license (http://creativecommons.org/licenses/by/4.0/).