Article

Sports Influencers on Twitter. Analysis and Comparative Study of Track Cycling World Cups 2016 and 2018

by
José María Lamirán-Palomares
,
Tomás Baviera
and
Amparo Baviera-Puig
*
Department of Economics and Social Sciences, Building 3B, Universitat Politècnica de València, Camino de Vera s/n, 46022 Valencia, Spain
*
Author to whom correspondence should be addressed.
Soc. Sci. 2020, 9(10), 169; https://doi.org/10.3390/socsci9100169
Submission received: 27 July 2020 / Revised: 15 September 2020 / Accepted: 22 September 2020 / Published: 25 September 2020

Abstract

:
Social media has driven a sea change in the way users view and participate in sporting events through the media. In the digital medium, identifying the profiles with the greatest influential capacity is a key issue. Using the analytical hierarchy process (AHP), the aim of our research was to identify the most influential Twitter accounts in a major sporting event: The Track Cycling World Cups. The competitions from the years 2016 and 2018 were analysed, downloading all the tweets that included the official hashtag of each event and drawing up the graph of mentions and retweets. After reviewing the literature, activity, authority and popularity were defined as dimensions to assess influence, and two subcriteria were chosen as measures for each of them. Activity was measured by number of tweets and outdegree, authority by retweets and PageRank, and popularity by number of followers and indegree. By consulting experts following the AHP approach, various weights were assigned to these measures, resulting in authority as the most influential. With this weighting, the accounts with the greatest influence on Twitter turned out to be those related to organisation of the event and those of the athletes taking part.

1. Introduction

The online medium has significantly changed the way in which media audiences consume sporting events. Social networks have allowed fans, viewers and different stakeholders to achieve a high level of interconnection and interactivity focused on these sporting events and the news generated. This interconnection has spread regardless of national or cultural borders, turning this digital communication environment into a global exchange of shared experiences, discussion and participation between people of different places and status. Studies such as those by Gila and Molina (2016) on the Youth Olympic Games are a reflection of this evolution of social networks in the field of sporting events. This study details how, through the internet, the media and large companies are losing the leading role they previously had in favour of users, and the role that the International Olympic Committee plays as a precursor of social networks in the field of sport. All this with a detail of the evolution presented by the different editions of the Olympic Games and their presence on internet.
Previous works have demonstrated how the digital medium has come to play a crucial role in the consumption of sports through the media. Several studies have shown that fans engage in a variety of behaviours around and during sporting events in the online world, including relationships with athletes (Clavio et al. 2013), the exchange of information (Blaszka et al. 2016) or the interactivity in this exchange of information (Clavio and Walsh 2014). Other research has also shown the participation in the digital medium of the different sporting organisations (Lebel and Danylchuk 2016; Frederick et al. 2014), how athletes use this medium for the development of their personal brand (Frederick et al. 2015), or how organisations engage with fans (Thompson et al. 2017).
Sporting events are prime examples of interconnected environments that provide the public with a shared context in which to enjoy a sports competition and global electronic communication. At the same time, they illustrate the changing face of sports-consuming audiences, the potential scope that these events have within the online environment and, therefore, how they have evolved as a result of this more global and accessible digital communication. All these aspects were presented by Wang (2015), while also attempting to predict the attitudes of users participating in social media during these sporting events.
However, the dynamics and measurement of this digital communication involve different parameters than those of conventional media, where the audience is the main indicator. In the online medium, the logic of network communication requires measures to assess which users have the greatest ability to influence the general conversation. This is not a simple question, mainly due to the complexity of the interactions. For example Meenaghan et al. (2013) analysed how the growth of social media constitutes a great opportunity for sports entities and other companies if they can gauge the effectiveness and impact of campaigns on social networks like Twitter. Just as there is a lack of definition of clear parameters to define the influence on online media, it was not possible to detect any study on influential users in niche sporting events. Although the study by Yan et al. (2019) features users with influence on a large-scale event, such as the 2017 UEFA Champions League Final, that study did not present the combination of different variables to arrive at a single ranking of influence.
Our article contributes to covering this gap. As the aim is to address such a complex phenomenon as influence on social networks, two techniques were used, the combination of which is also novel. The social network analysis (SNA) technique, which attempts to characterise the interaction of numerous agents, has provided a first basis for activity on Twitter. Subsequently, the analytic hierarchy process (AHP) was applied. This methodology is especially appropriate for this problem, as it allows us to quantify the attributes of a certain phenomenon based on a series of assessments provided by experts. One advantage of AHP is that it ensures the consistency of these judgements, thereby increasing the reliability of the results.
Given the context, this research takes a two-pronged approach. On one hand, identifying the weight of the criteria that measure influence in the Twitter social network and, on the other, discovering which profiles have the greatest weight in said criteria in the context of a major sporting event. For the analysis, two editions of the largest track cycling event in the world were considered: The World Championships. The analysis focused on the event held in London in 2016 and the one in Apeldoorn (Netherlands) in 2018. For the analysis of both, the official hashtags created by their organisers were used; in the case of London 2016, #TWC2016, and in the second event, #Apeldoorn2018. The two editions were chosen to compare and contrast the use of Twitter, and thus analyse possible similarities and differences in the users who participated in the conversation of the two events. The aim is to better understand the influencing process on Twitter.

2. Literature Review and Theoretical Framework

2.1. Influence and Social Networks

Journalism in general and the work of journalists have undergone a great transformation in recent years. Immediacy and therefore expiry of information, the capacity to produce content by different users and interactive materials are some of the changes derived mainly from the introduction of the internet and with it from the digitisation of the work processes through the implementation of tools and services that did not previously exist. Veglis and Maniou (2018) provided an explanation of the changes taking place, starting from the two-step theory and its evolution towards a model of communication flows with a solid base in Big Data and macro data.
Social media platforms have a great responsibility and play an important part in this transformation of journalism and journalistic work. (Campos-Freire et al. 2016). The first social network platforms, such as MySpace or Facebook, which emerged as of 2004, are the ones that led to great changes in the behaviour of people in general (Fuentes et al. 2007; Gil and María 2012; Ayala 2012) and of many jobs and organisations in general, and in journalism in particular (Curiel 2012; Figaro et al. 2015). This is due to the fact that, although previously journalists were practically the only ones with the capacity for the production and “spread” of news, the arrival of the networks means that anyone has the capacity to create content and achieve its dissemination via these platforms, without the need for the support or endorsement that journalism involves for a communication medium.
In recent years, social networks applied to sport in general—and Twitter in particular—have been the subject of different analyses with their consequent conclusions, such as Dasilva et al. (2015) or Gallardo-Camacho et al. (2016). There are also other studies that cover a wide variety of topics, such as Pegoraro (2016), which examined professional athletes who used Twitter and the object of its use, or Sanderson and Hambrick (2016), who studied the activity on Twitter of different journalists in the field of sport. Likewise, different sports have been the subject of study, and among them cycling, the sport the object of our research. For example Kassing and Sanderson (2016) analysed the tweets sent by the cyclists taking part in an edition of the Giro d’Italia. All of these articles hinge around the use of Twitter among different users, and the main research focuses on the study of activity in this social network.
Several sporting organisations have also used Twitter to share information, communicating and interacting with their stakeholders (Hambrick et al. 2010), and the study by Witkemper et al. (2012) showed how Twitter presents an opportunity for organisations to engage in timely and direct contact with their audiences. In fact, other communication and marketing studies have examined the use of social media as a sports marketing tool. For example, Armstrong et al. (2016) explored The Los Angeles Kings’ social media marketing strategies and concluded that social media provided the team with an opportunity to foster the development of relationships and the brand community.
Finally, and in reference to our topic of analysis, influence and users, different studies have already discussed these users on Twitter, both in different sports and in other settings with different objectives. For example Clavio et al. (2016) analysed the interaction of a soccer team’s community on Twitter. Hambrick (2016) examined how bicycle race organisers and Twitter users disseminated information through the network to promote their events. Likewise, Hambrick and Pegoraro (2014) examined the social media communities that formed during the 2014 Olympics, Naraine et al. (2016) compared national and international multi-sport events, and Blaszka et al. (2016) looked into the use of the hashtag on Twitter during the 2011 World Series. These studies identify those users with the highest use of Twitter or analyse the interaction that is generated between the different users of an event or around a certain hashtag, but they fail to identify or define the parameters of influence.
We could define social influence as the ability of a user to intentionally or unintentionally, and based on their opinions, produce changes in the beliefs, attitudes, motivation or behaviour of others (Day 2020). Specifically, in the social media environment, this influence can be understood as the ability to control the flow of information (Toole et al. 2012) and influence the interactions taking place among users that form a network (Leavitt et al. 2009). The different users who participate in social networks, including the communication media, adapt their ability to influence others in an environment of change. Although social networks allow access to all users, not all users are the same, and they differ from each other by their ability to influence others, as this will determine the impact and scope of the global conversation (Fuchs 2014). Influence therefore becomes an extremely important value in this context of massive information flows.

2.2. How to Measure Digital Influence

To extract data from social networks and thus be able to determine the different variables or parameters that can be part of the measurement criteria, it is possible to use different methodologies. User-generated content (UGC) is therefore the object of study, on the basis of which several methods are applied to extract information. The studies by Saura et al. (2019a) or Saura et al. (2019b) provide a vision of the way in which this data gathering is possible and the comparison between different methodologies. The importance of these two studies also lies in the fact that they both use the software applied in our analysis, Gephi. The former analyses the education sector, and the latter examines the digital marketing sector, in a comparison between approaches. They are therefore indicative studies of the importance and possibilities of the large amount of user-generated content (UGC), and, moreover, in a social network such as Twitter (the same as used in our analysis). Other articles carrying out studies on social networks and which also used this same software are described below: Akhtar et al. (2013) with an analysis about Facebook; Thirumalai et al. (2017), in a cost analysis for Facebook web click data; or Bruns (2012), with a study of conversations on Twitter.
There are also studies on the world of sports that use Gephi software, even in some cases setting out from the SNA, and without the study of any specific social network, analysing sports performance, such as the study by Hurst et al. (2016) focused on women’s volleyball. In this study, the social network analysis approach is used and with it, this software. If we focus more specifically on sports events and Twitter, we find the analysis by Gouveia et al. (2018), which studied the conversation generated in this social network over a soccer match in Portugal, a match of maximum rivalry between two clubs in Lisbon, Benfica and Sporting. That study analysed two specific hashtags (one for each club) and the user groups that interact around each of them. This study, similar to ours, analysed the profiles with major influence on the event, but with a great difference; this identification was carried out after the conversation analysis and without identifying the variables belonging to a certain group that might explain this supposed influence.
Another study using Gephi and which could be presented with similarities to ours is that of Yan et al. (2019). In it, they study a specific event, the 2017 UEFA Champions League final and the conversation generated on Twitter with the hashtag #UCL. They present the users with a greater influence on the conversation under three parameters of social network analysis, and even carry out their ranking and categorisation. This study presents the analysis at three specific times of the event, before, during and after it, and the evolution of the interest that was generated around the hashtag at these points of the analysis, and thus takes into account the dynamism of social networks, but it does not analyse the reason for the inclusion in those rankings. With the analysis carried out and as a summary, we present a table of different studies that use the same software as that used in our article (Table 1).
With all the data generated on social platforms, digital influence is a complicated concept to measure due to its multidimensionality and the large number of variables that appear in digital networks. Several formulas are used to measure it. Riquelme and González-Cantergiani (2015) detailed and classified the different measures used in the scientific literature on the influence on Twitter, and the importance of the need to know variables to be able to define the most influential users. As detailed in their study, the variables that can be part of the different criteria are very varied and come from different sources, such as the Twitter tool per se, complex mathematical models or rankings used in web analytics. Therefore, the totality of this review leads us to the adoption of three widely used and specific dimensions for Twitter: activity, popularity and authority (Riquelme and González-Cantergiani 2015; Lamirán-Palomares et al. 2019):
  • Activity: A user is considered active when their participation in Twitter is constant and frequent, regardless of the attention they receive from other users. When talking about participation, reference is made to all activity that is measurable in a broad sense. In this sense, some of the variables analysed are the generation of original tweets and retweets, mentions or responses. The most active users may generate a large volume of information to be spread throughout their network of contacts.
  • Authority: A user has authority when they post messages that arouse the interest of other users, that is, they receive many retweets, quotes or likes, which would be some of the variables considered. So, a user has great authority when they have links with other highly connected users in the network that enhance their range. Authority is linked with the interaction among the actors in a network. The key to providing a user with digital authority is thus their ability to actively or passively connect to the digital debate.
  • Popularity: A user is deemed popular when they are acknowledged by many other users of the network. One example could be a celebrity, who need not necessarily be considered as active. A priori, the number of followers is one of the main variables of this indicator. The greater the number of followers, the greater the popularity of a user to and their potential to circulate the information. However, some research works have already noted that users with a high degree of popularity are not necessarily influential on Twitter (Cha et al. 2017).

2.3. Research Questions

Within these dimensions, we see how many and different variables can be identified as part of them: generation of tweets, retweets, number of followers, connections with other users, responses to tweets, etc. So, once the dimensions and the possible variables were identified, we would ask ourselves three questions on which to base our research:
RQ1: What would be the most appropriate weight of each of these three dimensions (activity, authority and popularity) that would allow us to quantitatively assess the influence of a sporting event?
To this end, we shall measure the dimensions already identified (activity, authority and popularity) by different variables. Through this question, we try to ascertain the weight of the dimensions and the key variables for a user to be considered influential. Thanks to this information, users can be classified based on general interaction over the course of events, before posing the second research question.
RQ2: Which user profile (based on its assignment to different groups) holds the highest positions according to the dimensions and variables analysed?
A priori, it could be considered that some specific roles would occupy the positions of “greater influence” as stated in the studies by Hambrick et al. (2010), or Naraine et al. (2016), where a relevance in the conversation is indicated by the fact of occupying a certain role (organiser or journalist). In our event, we shall observe the users ranked best based on the above dimensions and assign them to certain categories and roles.
RQ3: Where do the users with a greater influential capacity come from?
Once the users are categorised based on their occupation and role, it is interesting to analyse the geographical origin. Studies such as those by Toole et al. (2012), distinguish the geographical origin of influencers, and therefore consider that in a sporting event the most influential profiles may be conditioned by the country or area of origin, which may be an interesting observation. The country organising the event or those teams with the highest number of medals are parameters to consider in this analysis, and studying whether these or other variables act as conditioning factors for Twitter influence will be of interest and thus the object of research.
Finally, the great contributions of our study, which have not been made at any previous time, are therefore: (i) the analysis of social networks in niche sporting events compared to the analysis of large events; (ii) the identification and establishing of a criterion that combines different dimensions to measure influence; (iii) the use of a new methodology in our sector, combining a highly contrasted software in the analysis of social networks, with another multicriteria methodological process, as detailed below.

3. Methodology

3.1. Social Network Analysis (SNA)

Social media can play an integral role in the experience of sporting events to varying degrees and with different effects, either to highlight positive effects such as supporting athletes or to expose negative issues and problems. Researchers can explore these activities on social media through social media analysis (Social Network Analysis, SNA), which suggests that individuals and groups form relationships, and the combination of individuals, groups, and their accompanying relationships form networks used to exchange information and other resources. Social networks can be developed without any connection to sports facilities (Maclean et al. 2011) and teams (Warner et al. 2012). They can also occur in online environments, as the SNA facilitates the creation of these networks (Bruns et al. 2014). SNA can help event organisers understand how different communities emerging on social networks develop and expand their knowledge, and how these communities can play a critical role in the conversations that take place around their events, whether through positive or negative word of mouth (WOM) (Sahelices-Pinto and Rodríguez-Santos 2014).
Two methodologies were used to carry out our research. Initially, the SNA served to identify a part of the variables related to influence on Twitter. SNA arose from the Gestalt Theory of Lewin (1939), who formulated the theory with a graphic analysis. Later, other researchers such as Freeman (1978) or Lozares (1996) developed and applied the mathematical basis of the theory. SNA studies the patterns of the situational relationship between the different actors to gauge the social behaviour of a population and evaluate the interdependent actions among the different users, even though not all users are directly related (Scott 2017).
SNA can help achieve a better understanding of how the different users taking part in the conversation use a social network such as Twitter. Wasserman and Faust (1994) defined social networks such as collections of individuals, organisations and events, plus the shared relationships between all of them. Social network analysis examines them by observing their members in their natural environments, defining their roles within the social network and analysing their network of relationships (Wasserman and Faust 1994).
Researchers use social media analytics to explore different groups and events using sociograms that visually represent members of social media and their relationships. Each member of the network is represented by a single point (node), and a line joining two nodes indicates that the members of the network share a relationship. The collection of nodes and lines becomes a sociogram, and the resulting diagram shows the members of the network, their shared relationships and the collective social network (de Nooy et al. 2005). Sociograms describe the social network, helping to identify the influential network members who spread information to others in the network. The most influential members are generally located near the centre of the network and have a greater number of lines or relationships linking them with other members. Less influential members have fewer relationships and position themselves in remote locations along the periphery of the network (de Nooy et al. 2005).
Although SNA is now a common methodological approach in many areas, more recently it has become the focus of research in the field of sports. In this sense, Wäsche et al. (2017) provided a general assessment of the utility of the theory, showing a range of different applications to investigate sports management. Quatman and Chelladurai (2008) went further, exploring patterns of social interaction between different academics in the field of sports management, using a social network perspective. Clavio et al. (2016), Hambrick (2016), Sanderson and Hambrick (2016), Hambrick and Pegoraro (2014) and Naraine et al. (2016) have already used this methodological approach to identify popular users on different social networks. SNA can help event organisers understand how social media communities are structured, thereby expanding the knowledge necessary to manage and administer the conversations that communities develop around these events, which is clearly exemplified in our research.

3.2. Analytic Hierarchy Process (AHP)

After SNA, the second methodology applied was the Analytical Hierarchy Process, also known as AHP, developed by Saaty (1980) and designed for solving complex problems with multiple possibilities. The AHP method is based on the evaluation of different criteria to arrange a process into a hierarchy in order to optimise decision-making. This methodology is used for problem solving where it is necessary to prioritise between different options and decide the most convenient one. These decisions can range from simple personal and qualitative decisions to highly complex quantitative conclusions. The hierarchical analysis process thus becomes a flexible and robust multicriteria decision-making tool, and it is used in problems where both quantitative and qualitative aspects must be taken into account.
The AHP technique organises the critical aspects of a problem into a hierarchical structure and reduces complex decisions to a series of comparisons, thus allowing hierarchisation of the different criteria assessed. AHP has been applied to resolve a wide variety of problems and is based on the principle that the experience and knowledge of the actors are as important as the data used in the process. When tackling a problem, this process calls for subjective assessment by means of a questionnaire from a group of experts regarding the importance of the different criteria for its resolution, specifying the relative importance of each of them. To this end, the different criteria are compared in pairs, first among the different criteria, and subsequently between each of the subcriteria, using a scale from 1 to 9, where 1 assumes the same importance of the two variables compared, and 9 assumes an extreme importance of one against the other. Rankings of 3, 5 and 7 show different degrees of importance of one compared to the other.
After each expert evaluates the criteria through the aforementioned scale (1, 3, 5, 7, 9), an individual matrix is created that contains the pairwise comparisons or judgements. In this matrix, all the elements are positive and verify the properties of reciprocity and consistency. Consistency is checked using a ratio that reflects how consistent the judgements made by experts are in relation to large samples of purely random judgements. This consistency ratio is a value that is calculated and compared with a reference value that varies according to the size of the matrix (Saaty 2008; Cheng and li 2001). In our case, the consistency ratio considered as a reference was 10% (Saaty 2008). If the value of the consistency ratio obtained is equal to or less than 10%, it means that the evaluation within the matrix is acceptable and that there is a good level of consistency in the pairwise comparisons. In contrast, if the consistency ratio is greater than 10%, it is because there is an inconsistency in the pairwise comparisons and, therefore, the evaluation process of that expert should be reviewed or discarded. An acceptable consistency ratio (less than or equal to 10%) helps ensure reliability in the decision-making process. In order to merge the individual judgements from each expert into a single rating representative of the entire group, the geometric mean is used. (Saaty 2008) recommends this method, as it maintains the property of reciprocity of pairwise comparisons.
One of the advantages of AHP is the possibility of adding different types of information, which facilitates participation in the process, both of users with a marked technical tendency and others without that profile. Likewise, it allows for the development of very different types of analysis, with purely quantitative situations, or others with qualitative situations. The hierarchical analysis process is ideal in the multicriteria decision-making problem, given its relative simplicity in application, as demonstrated by the various applications recorded in the literature. For all these reasons, AHP constitutes a very adequate methodology to face our problem, given the complex dimensions of which the social phenomenon of influence on Twitter is composed.

3.3. Data Variables

From the identification of the three fundamental dimensions of influence, a pair of variables associated with each dimension was determined. According to AHP nomenclature, the dimensions would work as criteria and the variables as subcriteria. In each dimension, one of the variables or subcriteria would correspond to a measure of centrality of the SNA (outdegree, PageRank and indegree) and the other would be provided by the activity on Twitter. In this sense, the activity would be measured by the number of tweets, and by the tweets with mentions to other users (outdegree); authority would be measured by the number of retweets and PageRank, and popularity by the number of followers and mentions received from other users (indegree) (Lamirán-Palomares et al. 2019).
In SNA, each node has a degree of centrality, characterised by its relative position within the network according to the users connected to it. The interactions of each user (node) are differentiated between indegree (interaction initiated by the node) and outdegree (the interaction is directed at the node) (Newman 2010). In addition, we use PageRank, a measure that assumes that a user is important when mentioned by other important users. PageRank was developed by Google to provide the organic positioning of web pages in search results. PageRank assesses the likelihood that a user who randomly clicks on links will reach a particular page (Page and Brin 1998). Table 2 shows the detail of the variables with their explanation.

3.4. Research Process

Figure 1 shows the phases of the current research. After each event was held, the tweets were downloaded. Through the Audiense platform, the tweets that included each hashtag were captured. It is important to note that the hashtags analysed (TWC2016 and Apeldoorn2018) were not used simultaneously for any other topic apart from the event studied. In fact, the hashtag #Apeldoorn2018 refers solely and exclusively to the event that we analysed, and the hashtag #TWC2016 was subsequently used at the end of that year for two events that had nothing to do with ours, and at no coinciding point in time, so it was not possible to include any of these in our corpus. Audiense is a platform that allows access to the Twitter API (Application Programming Interface). We asked for all the tweets where the hashtag of each event was included.
Next, the variables associated with influence were evaluated, according to their three dimensions. Using Gephi software (Bastian et al. 2009), graphs of the interaction between users (including mentions and retweets) were constructed and variables from the SNA were calculated. Subsequently, the experts were consulted to establish the weight of the various criteria (activity, authority and popularity) and subcriteria (Lamirán-Palomares et al. 2019), using AHP methodology.
The questionnaires were transferred to fifteen heterogeneous experts from both the professional and academic spheres, who, in addition to working on aspects related to digital communication, had to be active users on Twitter and, therefore, be accustomed to the use of this social network. In order to provide an objective view of the different variables that make up influence, these experts worked or had worked in agencies where they managed different social media accounts, and so could provide a vision beyond the subjectivity of simple social media users. As a common factor among these experts was that they were all located in the same country, and to reinforce and avoid possible errors due to bias and subjectivity, once the questionnaires had been completed, they were subjected to an analysis of the degree of inconsistency, according to the AHP methodology per se.
Questionnaires were conducted with the experts in order to assign a balanced weight to each variable, so that the degree of influence of the users could be quantified. The questionnaires were completed following the AHP methodology, that is, with pairwise comparisons of the different criteria and subcriteria. Of the fifteen questionnaires completed by the experts, three were eliminated, as they presented a consistency ratio greater than 10%, the reference value according to AHP methodology. With the results of all the experts, the geometric mean was calculated, as recommended by Saaty (2008), to obtain a single judgement representative of the entire group. Then, the final weight of each subcriterion was calculated from the geometric means.
Next, the 25 highest rated user accounts from each of the six subcriteria assessed in the research were identified and ordered. Given that some of these accounts appeared in more than one subcriterion, it was normalised by the sum of the value of each of them and the weights obtained were applied, identifying the 25 most influential user accounts. Finally, the users were categorised into seven groups according to their profile. One of the authors made an initial classification and another revised it. When there was a discrepancy, the third author was consulted. The seven groups were as follows:
  • 1 = Athlete taking part in the event;
  • 2 = Media (press, radio, TV, etc.);
  • 3 = Fans in general;
  • 4 = Cycling-related media (magazines, websites, etc.);
  • 5 = Journalists, bloggers, former cyclists;
  • 6 = Related institutions (federations, team, organisers);
  • 7 = Others not attached to the previous groups.
Finally, the comparison and analysis of the results obtained in the two events were carried out. For each of the two events, London 2016 and Apeldoorn 2018, the number of tweets and users were different. In London, the users numbered more than 20,000 and in Apeldoorn only 7281. The 25 highest rated user accounts from each of the six subcriteria assessed in the research were identified and ordered. Coincidentally, 89 total accounts were identified in each event as the sum of the 25 most influential accounts for each subcriterion. Table 3 details the general data of each of the two editions analysed.

4. Results

4.1. Criteria and Subcriteria of Influence

Table 4 shows the ranking of the subcriteria that determine the influence of a user on Twitter according to the survey carried out. The numbers in parentheses represent the weight distribution of the different criteria and subcriteria considered in the analysis. In the last column, the final weight corresponding to each subcriterion and whose total sum is 100% appears. In view of the results, we deduced that authority, which includes as subcriteria the number of retweets with 37.28% weighting, plus PageRank, 24.75%, is the criterion whereby a user is considered more influential on Twitter (62.03%), according to the experts consulted. Next, we have popularity (29.59%), which consists of indegree (20.17%) plus the number of followers (9.42%). Finally, at a great distance from the previous two, we have activity (8.38%), with the subcriteria of outdegree (5.16%) and the number of tweets (3.22%). The subcriteria belonging to authority (number of retweets and PageRank) have a higher weight than the other four, and all of them are ranked in the same order as the criteria.
According to the hierarchy obtained from criteria and subcriteria, we shall determine which are the most influential Twitter user accounts during the two editions of the event.

4.2. Determination of the Most Influential Users

Figure 2 and 
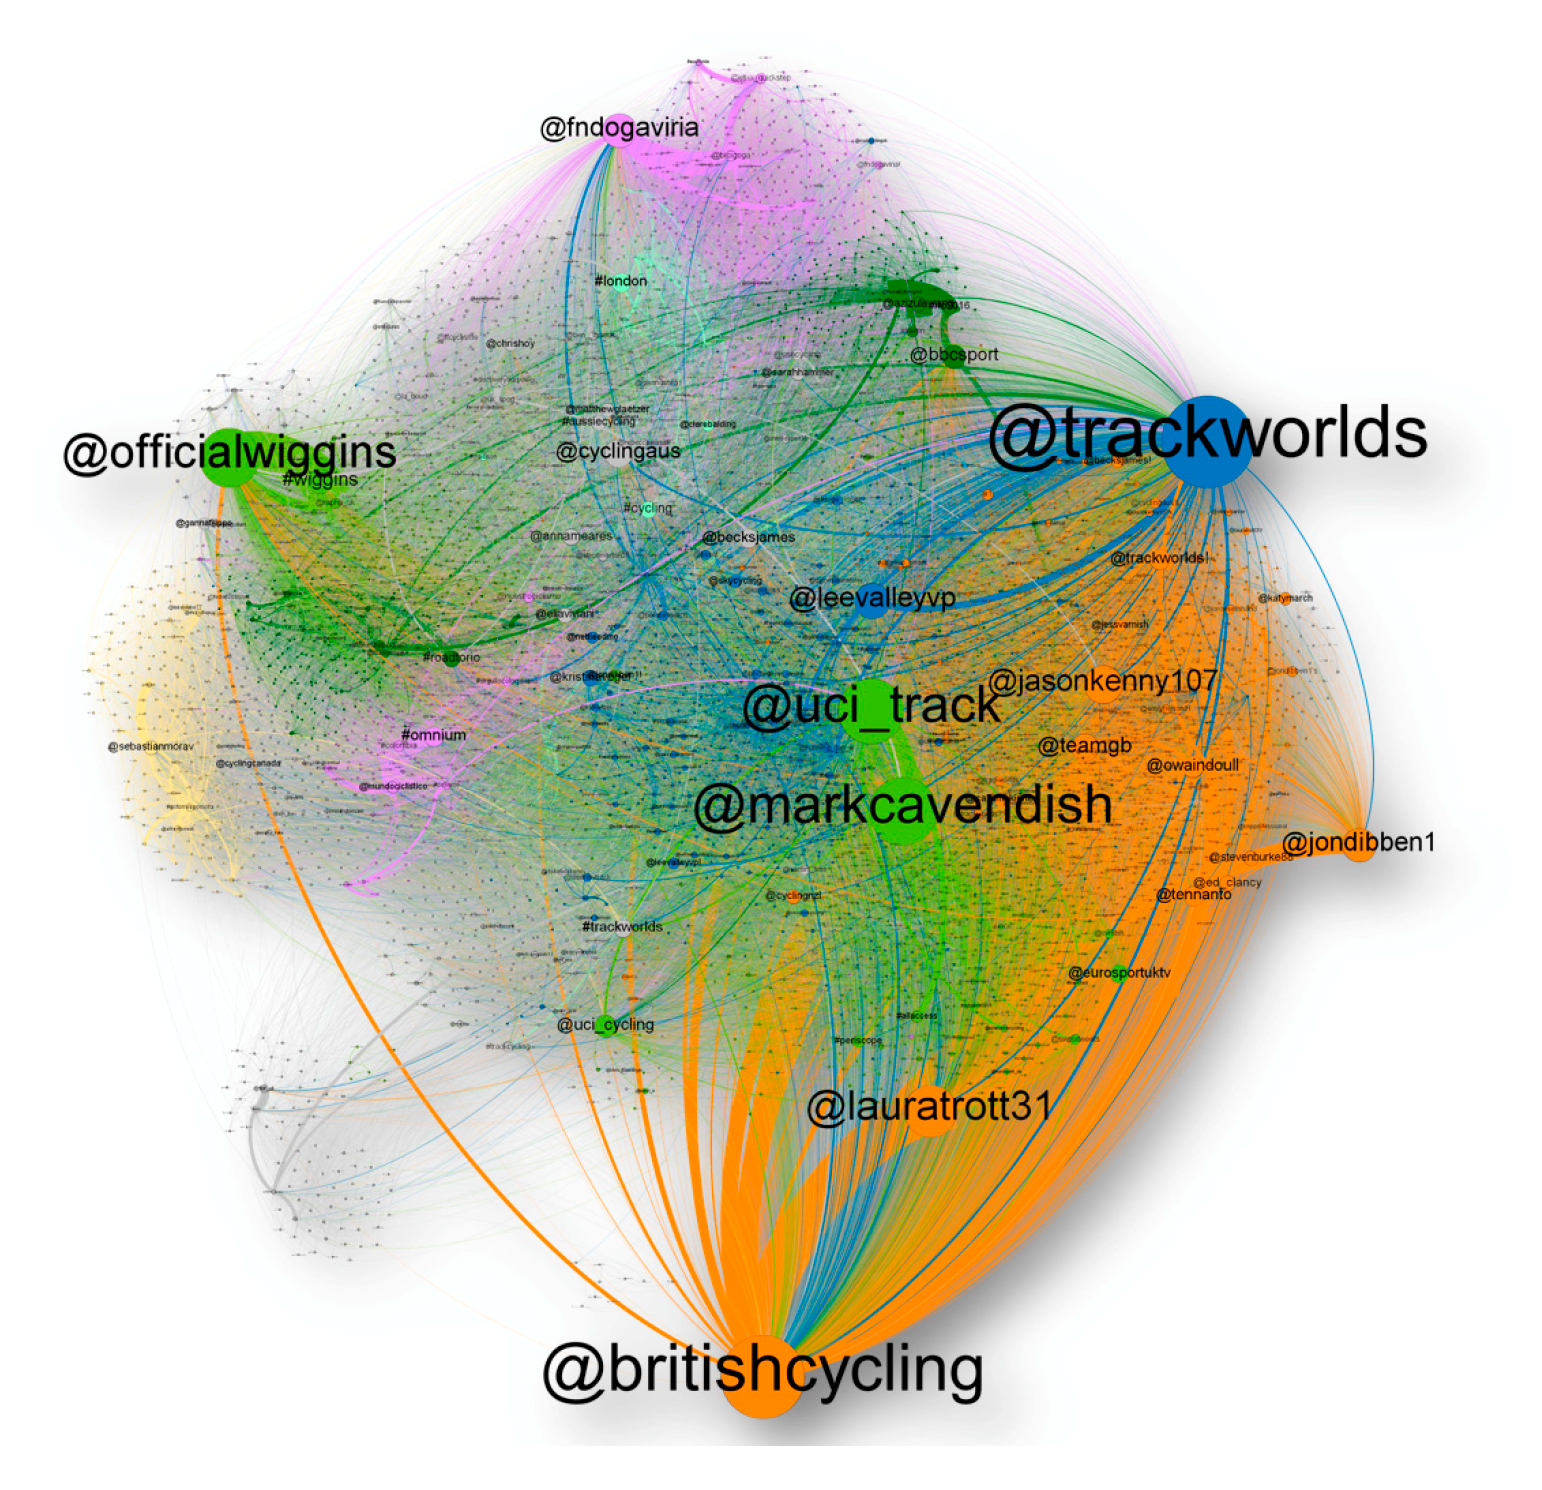
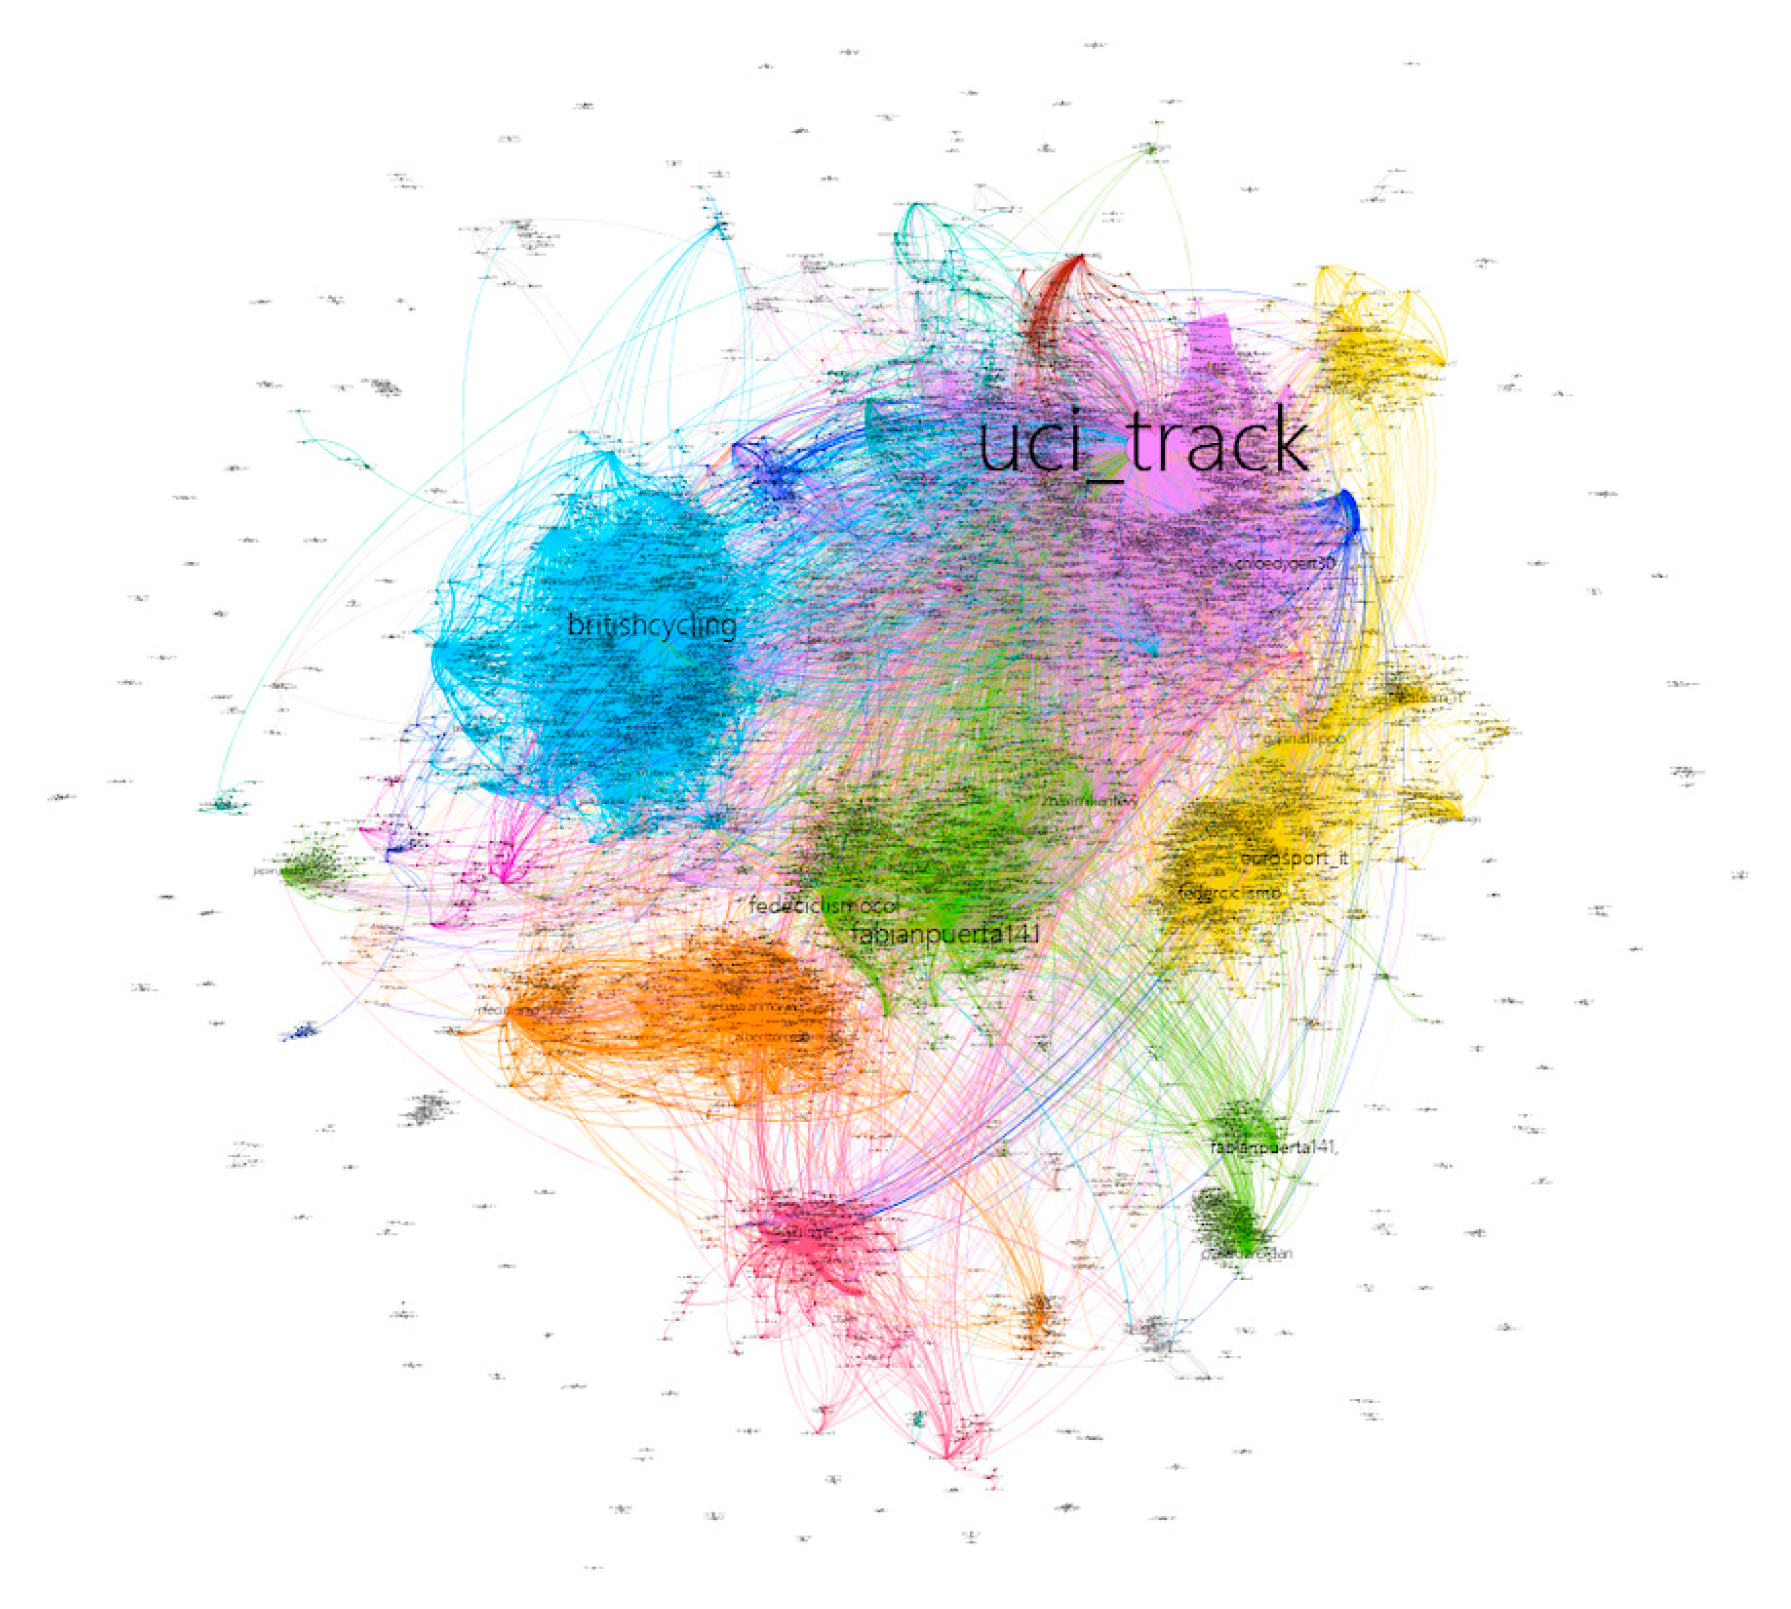
Figure 3 show the graphs of the interaction of users through Twitter during the events studied, considering the interaction as the mentions received among all of them (indegree). Figure 2 reflects the London event, hashtag #TWC2016, and Figure 3 the event in Apeldoorn (Netherlands), where the hashtag was #Apeldoorn2018. Each of the nodes is equivalent to a user and its size represents the importance in terms of mentions received. The different colours show the different clusters or groups identified by the Gephi software used.
The clusters show users that are grouped by close interactions. The largest nodes are in the case of London 2016 Trackworlds, which was the organising account of the event, and in Apeldoorn2018 the International Cycling Union, UCI_Track. At first glance it can already be seen how in 2016 there was a greater number of influential accounts compared to 2018, where a single account of great relevance appears, the aforementioned UCI_Track. With these graphs, we have synthesised the conversation graphically to identify the relative position of the users in the global interaction.
Table 5 shows a comparison, summary and summation of the two events. In the sum of the total of the two events, we find among the most influential accounts: fourteen athletes, (category one); twenty-one related in one way or another to the event such as organisation, federations … (category six); five media outlets (category two) and the rest of the accounts in other categories (three, four, five and seven). It should be noted that the first three, in each of the two events, belong to the same category (six), in particular, that of accounts related to the event organisation. These outcomes give us an idea of the relevant role played by the organisers in promoting the media diffusion of the event. It is also important to note that the (Twitter) accounts of the event, in one case Trackworlds and in the other wkbaanapeldoorn, appear in very different positions. In London, the official account of the event appears as a great influencer in the third position, whereas in Apeldoorn it comes last.
Table 6 and Table 7 show the ordering and classification of the accounts according to the weight obtained in the AHP for each of the events. Analysing the 25 most influential accounts of the 2016 event, we found:
  • Eight accounts belonging to athletes, seven men and one woman (category one),
  • Eight that were related in one way or another to the event (category six) (organisation, federations …),
  • Three media outlets (category two),
  • Six different accounts from other categories.
This distribution is accentuated even further in the top ten positions, as there are six accounts related to organisation of the event, namely @britishcycling, @ucitrack, @trackworlds, @teamGB, @cyclingAUS and @leevalleyvp; three profiles of athletes (@officialwiggins, @markvavendish and @ lauratrott31) and one media account (@BBCSport).
Observing the origin of the athletes who appear in this classification, those of the British team stand out, as five of their profiles appear here, (@officialwiggins, @markcavendish, @lauratrott31, @jasonkenny107 and@jondibben1). We have one Colombian cyclist@fndogaviria, one from Malaysia (@azizulawang) and closing this classification, one Spanish rider (@sebastianmorav). It should be noted that this presence in the ranking comes about in very different ways, as there are several runners who do not present any activity during the course of the event (Cavendish, Trott, Kenny and Dibben), and others who do so intensely (Wiggins, Wang and Mora).
After the athletes, among the 25 most influential profiles, we then find general media, then specialist media, and finally others not attached to any of the above categories. This is the case of the profile of Colombian President Juan Manuel Santos, who appears in this list for his “participation” in the event by congratulating Colombian runner Fernando Gaviria (who also appears in the ranking) for winning his medal.
If we look at the 2018 event, among the 25 accounts we find:
  • Thirteen related with the event (category six),
  • Six athletes, five men and one woman (category one),
  • Two media (category two),
  • Four accounts from other categories (four and seven).
It should be noted that the first three accounts, UCI_Track, BritishCycling and Fedeciclismocol (the Colombian Cycling Federation), and also the fifth, (FederCiclismo) belong to the same category, that of accounts related to the event organisation, category six. Thus, and as in the 2016 edition, these results confirm the relevant role of the organisers as promoters of the event.
In the 2018 edition, the next group in importance is that of athletes. In this group, the Colombian Fabián Puerta and Spaniards Albert Torres and Sebastián Mora stand out (also appearing in 2016), along with Italian Filippo Ganna and Germany’s Maximilian Levy. The only woman who appears in this ranking is the American Chloe Dygert. Notably, it should be mentioned that all the athletes who appear in this ranking won a medal during the championship, and it is also noteworthy that no athlete from the organising country (Netherlands) appears in this classification, although there were several who had a presence in the medal standings and also had profiles on Twitter.
Lastly, we have another six profiles, two from the mainstream media, Eurosport from Italy and the BBC, which were two media outlets broadcasting the event, and four from two different groups. These were three “public” characters: Juan Manuel Santos, (Colombian President who also appears in the 2016 ranking), Carlos Vives (Colombian singer) and Clara Luz Roldan (Colombian politician), as well as a specialised magazine (Mundo Ciclístico). These four profiles have in common that they are Colombian in origin. This circumstance is related to the medal gained by one of the athletes present in the ranking, the Colombian Fabián Puerta. This data item could reflect the popularity of track cycling and, in particular, of the event analysed in Colombia.
Next, Table 8 and Table 9 reflect the distribution by categories and geographic origin of the different users for the two editions of the event, in addition to the detail of the medals achieved by each of the countries that had influential users.

5. Discussion

The aim of our research was to identify influential Twitter users during an event, the Track Cycling World Cup. Two editions of the championship were considered: London 2016 and Apeldoorn 2018. The influence was evaluated according to the criteria of activity, authority and popularity. Thanks to the hierarchical analysis methodology, we were able to assign weights to different variables that measured each dimension of influence. This way, we identified the most influential Twitter accounts for each event and the typology of these accounts/users according to the seven major groups established.
With the results obtained, and in response to RQ1, it was verified that the authority criterion was rated with 62% weighting according to influence, followed by popularity with 29.6% and finally activity with 8.4%, as the order and degree of the criteria to be considered within influence. This highlights the importance of the contents of a tweet, as when the content is relevant it will have a high number of retweets, a subcriterion belonging to authority, which represents 37.28% of the total influence.
Usually, the most important variables used in other sports-related research to assess influence have been the number of followers (Hambrick 2016; Hambrick and Sanderson 2013; Hambrick and Pegoraro 2014), the number of tweets (Hambrick and Pegoraro 2014) and the different measures of centrality (Wäsche et al. 2017; Naraine and Parent 2016; Naraine et al. 2016). The outcome of this research may indicate that the number of followers may not be the only suitable criterion to gauge the influence of the user on Twitter, and that others should be considered when choosing influencers at a sporting event.
In fact, the number of retweets received has a weight of more than 37% within the total for influence according to the experts consulted, with the remaining 25% being the PageRank variable. Continuing with the ordering of the subcriteria, the mentions received (20%) would be the next variable to consider, along with the number of followers (9%), the outdegree (5%) and the number of tweets (3%).
Focusing the discussion on RQ2, firstly, the presence of category six user accounts, which are cycling-related institutions, such as national federations or the event organisation, should be highlighted. Between the two editions of the event there were 21 accounts in this category. They are “specialised” accounts that present weights in all the subcriteria, so that the “construction” of influence is carried out from all possible aspects. Secondly, the accounts of the athletes taking part (category one) stand out, of which there were 14.
Therefore, with the quantitative results and the qualitative categorisation defined, the second research question would be answered. The highest ranked accounts are those belonging to cyclists and institutions related to the event, in addition to the accounts of the different national teams. This result could be understood as logical, given that these users are the main “actors” of the sporting event. This logical assumption that athletes are the most important actors in a sporting event can also be extrapolated to the case of social networks and the possibilities offered both to followers (Stavros et al. 2014) and to clubs and associations (Sanderson 2014) or the organisers of a sporting event (Sjöblom et al. 2018). In these three studies, the motivations of club fans or attendees of a sporting event for interacting with clubs and at events are already verified. Therefore, if athletes are an important users of networks that generate more interest both in the practice of sport and through their activity in social media or even in other media, the limitation of the use of their social networks, which occurs on some occasions as indicated below, can greatly limit the scope of the conversations that are generated in them.
Moreover, the great importance of event organisers and related accounts (federations, teams, etc.) in providing the event with great media coverage is notable. If these accounts promote that participation, the messages of the rest of the actors involved could be greatly amplified, with all the implications that could be derived. Similarly, it could be seen how promoting the event is not the responsibility of the cyclists, as they are taking part in the races, but if the participation of any of them is achieved, the possibilities of the “involved” being considered as an influencer greatly increase. This point is thus a line of discussion that can be agreed between the organisers of an event and those responsible for the athletes, incentivising the use or participation of athletes in the digital conversation, as in minority sports it this can help greatly to extend the scope and significance of media coverage, or even the construction of an experience with the user, which is much more complicated to achieve in sports or events of the greatest global significance, such as the Soccer or Basketball World Cups, or club competitions in these sports at the highest level.
After this point, we consider it interesting to carry out the analysis of the geographical origin of the accounts that appear in the classification, to try to analyse causes and/or possible connection points and respond to the last of the RQs. One of the parameters that we understand may be relevant is the origin of the athletes who were awarded a medal in the course of the event (Cerezuela 2003; Rojas-Torrijos 2012). Carrying out the geographical analysis of the origin of the medal winners and the influential users as shown in Table 8 and Table 9, it is important to distinguish between both editions and observe that the greater or lesser influence of these accounts will not always be related to the number of medals achieved in the different trials.
In the 2016 event, Great Britain appeared to lead both rankings. It was the country with the highest number of medals and the one with the most influential users. The fact that it was the organiser country that year may explain the large number of influential users in that edition. This contrasts with the results for 2018, where the Netherlands, despite being the organiser and the country with the most medals, only had one user among the 25 most influential. Equally notable in the same sense were other countries such as Germany and Australia, which despite winning a large number of metals in both editions, had barely one or two users among the most influential accounts. In 2016, Germany won eight medals and had zero influential users and in 2018 Australia got six medals and had no outstanding users. In the opposite sense, Colombia appears, with two medals, one in each edition, and a great following among its profiles in the two years, five in 2016 and six in 2018.
These data on geographic origin could be understood a priori, by trying to link them with the importance that each country attaches to this sport, so in Colombia cycling in all its forms is one of the sports with the greatest media impact, as also occurs in England. On the opposite side we would have Germany and Australia, countries with a great number of successes in this discipline, but with little impact on their digital environment. As we have verified, the participating cyclists (category one) are one of the groups with the greatest presence in the list of influential accounts determined. Their role as promoters of the event can therefore be considered crucial. For this reason, the analysis of the connection between medals achieved and presence in the ranking of influential accounts is interesting. When analysing this parameter, we see that all the athletes who appeared on the list of influencers did achieve a medal, but nevertheless there are many athletes who despite winning a medal did not appear among the influential accounts. Analysing whether the reason is that they did not take this social network into account, or did not use it, we observe that:
  • In the 2016 edition, there were 76 athletes who won a medal.
  • From that total, 53 had a Twitter account, so only 23 did not have one.
  • Eight athletes appear in the list of the 25 most influential, and of these eight (seven men and one woman) all won a medal.
  • In the 2018 edition, 80 athletes achieved at least one medal.
  • From that total, 54 had a Twitter account and 26 did not.
  • There were six athletes among the 25 most influential accounts, and all of them (five men and a woman) won a medal.
Among the athletes who did have an account, it was analysed whether they used it during the course of the event, understanding “use” as use to send a tweet. Whereas some athletes did make considerable use of it, others sent out only the odd tweet and others never used it at any time. So, again it appears that activity is not the most prominent criterion, and in fact it turns out that, among the most influential athletes, there are some who did not send any tweets. In contrast, this user group did score very high rankings in the other criteria and subcriteria.
In the light of these data, we could extrapolate that, if the athletes who obtained the medal had had outstanding scores in all the subcriteria, their appearance among the most influential accounts could be facilitated. It cannot be concluded that their appearance among the influential accounts is a consequence of the result obtained, but of the sum of all the criteria, just as happens for the rest of the users. Summarising, and responding to RQ3, in the 2016 edition the most influential users came from the organising country, Great Britain, which had 12 accounts in this classification. However, this was not the case in the 2018 edition, where only the event organiser account appears among the 25 most influential, specifically ranked 25th.

6. Conclusions

In conclusion, this current study complements the studies carried out individually for the events of 2016 and 2018, and where initially the identification of the criteria that influence an event on Twitter was the most important research question. Furthermore, this study considers two editions of an event, which confers an important added value to overcoming the limitations derived from the consideration of only one. In addition, our research provides an important fact by adding the geographical consideration of users who appear to be influential in an event and looking for the factors that may define their appearance in this classification. Our analysis and results, notwithstanding the fact that influence on social networks in general and on Twitter in particular is a complex phenomenon to measure, may be useful for future studies of influence on Twitter and potentially on other social media platforms, in addition to serving as a parameter and standards of action for organisers seeking media coverage of an event and its amplification through social networks, especially Twitter.
Finally, another important conclusion to be added would be that even taking into account the complexity of identifying influential users, considering the criterion of authority with the number of retweets as the main variable and the characteristics (categories and origin) of the users influential a priori, would allow us to consider these conclusions not only to learn more about the behaviour of social network users, but also to provide information for the media that use Twitter as a tool to distribute their content and for the brands that seek a presence at an event and/or need to know the possible return on an action carried out on social networks during a sports event. At this time in which traditional media organisations increasingly turn to social networks to recover audiences lost due to the increase in interactivity, provide feedback guidelines and develop a relationship with followers, understanding the complex phenomenon of influence on social networks becomes a strategic factor for all stakeholders involved in the organisation of a sports event.

7. Theoretical and Practical Implications

This study provides other implications regarding the management of sporting events, as this research is useful for all those interested in identifying the most influential accounts in an event. Thus, the accounts of the most mentioned and most authoritative national cyclists and teams could be particularly relevant for those companies interested in sponsoring events. Therefore, national teams and cyclists should pay attention to their Twitter accounts as part of their strategy, due to their impact on the conversation. Similarly, event organisers must be aware that promoting the event cannot be the responsibility of cyclists, as they are competing in races. Rather, this responsibility must fall on themselves, in addition to “taking advantage” of specialist media and those fans with influential accounts according to some of the dimensions analysed. The information they provide can help organisations better understand the customer experience and target the most influential for building relationships and stimulating interaction.
Likewise, and placing this study as a prelude to other subsequent research, once the criteria that measure influence have been identified and the most influential users are identified, the next step could be to analyse the possible impacts regarding return both in media coverage of an event and when evaluating possible sponsorships, either for an event itself or for a particular athlete.
The analysis of the activity on the Twitter social network of athletes taking part in an event could be another of the implications of this study. Sometimes, the activity of these athletes is limited by the indications and “orders” of those responsible for them, either coaches or the event organisers themselves. Thus, for example, during the 2014 World Cup in Brazil, there were several coaches who did not allow or restricted the activity of their athletes on social networks, so the possibilities for them to take part in the conversation and/or fulfil their sponsorship contracts with some brands may be limited, with the implications that this would entail. Or the International Olympic Committee (IOC) that limits the use that can be made of social networks by athletes during their participation in the Olympics, as dictated by Rule 40 of the IOC Olympic Charter. Or even the practical work by Loayza Valarezo (2015) that analysed possible relationship between the use of social networks and sporting performance. Given all of the above, it would be interesting to know the reasons that caused, for example, the athletes of the Netherlands team to have little activity in the edition of the event analysed in this research.
Gender analysis might be another interesting implication. Studies such as those by (Lebel and Danylchuk 2016) or by (Burch et al. 2015) already established differences between the ways in which athletes of one sex or another use Twitter, and implications could therefore be established that explain the fact that fewer women appear in the ranking of influencers, one woman only in each of the editions among influential athletes, namely Britain’s Laura Trott in 2016 and the American Chloe Dygert in 2018 in Pruszkow.

8. Limitations and Future Research

The most important limitations of this analysis are derived, first of all, from the fact that the study was carried out on a single sport and one of a more or less minority nature. Track cycling is considered a niche sport compared to road cycling, so a comparison with some other trial of a similar scope to those developed in road cycling would be ideal: road cycling world championships, or even one of the great team events, Vuelta a España, Giro d’Italia or Tour de France. It would be interesting with this comparison to determine whether the results obtained follow the same pattern of influence. The comparison could even be drawn both inside and outside the world of cycling. Thus, future research questions to answer could be whether the network works similarly for other cycling events (for example, the Giro d’Italia cited in another research work) or for other sports.
Another limitation is that the results are specific to one social network: Twitter. In our case, the analysis has been carried out on this social network, but it could be compared with other social network platforms such as Facebook or Instagram, which are also relevant (Park et al. 2009). In addition, the growth in the number of users of the latter, more than 1 billion in the world (data as of February 2020) could advise an assessment of a network where the hashtag is also one of the axes of communication, as on Twitter.
The dynamic nature of social media is another limitation. In these networks, changes are constantly taking place. At the start of the trials, the debating networks are some that may be different during the course of the trials and others different at the end. Abeza et al. (2014) and Yu and Wang (2015) reported different results depending on the period of time studied. Abeza et al. (2014) compared the use of Twitter for sponsorship activation by Olympic Programme sponsors during the Sochi 2014 Winter Olympics through the Olympic time period (i.e., before, during and after). In our study, the analysis focuses on the whole image of the entire interaction. The time dimension should also be included to compare the network at different time periods (i.e., before, during and after). Therefore, the analysis could focus on how the network evolves throughout the duration of the event.

Author Contributions

Conceptualisation, J.M.L.-P. and A.B.-P.; methodology, T.B.; software, J.M.L.-P.; validation, T.B.; formal analysis, A.B.-P.; writing—original draft preparation, J.M.L.-P.; writing—review and editing, T.B. and A.B.-P. All authors have read and agreed to the published version of the manuscript.

Funding

This research received no external funding.

Conflicts of Interest

The authors declare no conflict of interest.

References

  1. Abeza, Gashaw, Ann Pegoraro, Michael L. Naraine, Benoît Séguin, and Norm O’Reilly. 2014. Activating a Global Sport Sponsorship with Social Media: An Analysis of TOP Sponsors, Twitter, and the 2014 Olympic Games. International Journal of Sport Management and Marketing 15: 184–213. [Google Scholar] [CrossRef]
  2. Akhtar, Nadeem, Hira Javed, and Geetanjali Sengar. 2013. Analysis of Facebook Social Network. Paper presented at 5th International Conference on Computational Intelligence and Communication Networks, CICN 2013, Mathura, India, September 27–29; pp. 451–54. [Google Scholar] [CrossRef]
  3. Armstrong, Cole G., Elizabeth B. Delia, and Michael D. Giardina. 2016. Embracing the Social in Social Media: An Analysis of the Social Media Marketing Strategies of the Los Angeles Kings. Communication and Sport 4: 145–65. [Google Scholar] [CrossRef]
  4. Ayala, Pérez T. 2012. Marshall Mcluhan, Las Redes Sociales y La Aldea Global. Revista Educación y Tecnología 2: 8–20. [Google Scholar]
  5. Bastian, Mathieu, Sebastien Heymann, and Mathieu Jacomy. 2009. Gephi: An Open Source Software for Exploring and Manipulating Networks. Icwsm 8: 361–62. [Google Scholar]
  6. Blaszka, Matthew, Lauren M. Burch, Evan L. Frederick, Galen Clavio, and Patrick Walsh. 2016. #WorldSeries: An Empirical Examination of a Twitter Hashtag during a Major Sporting Event. International Journal of Sport Communication 5: 435–53. [Google Scholar] [CrossRef] [Green Version]
  7. Bruns, Axel. 2012. How long is a tweet? Mapping dynamic conversation networks on twitter using Gawk and Gephi. Information Communication and Society 15: 1323–51. [Google Scholar] [CrossRef] [Green Version]
  8. Bruns, Axel, Katrin Weller, Jean Burgess, Merja Mahrt, and Cornelius Puschmann. 2014. Twitter and Society. New York: Peter Lang, ISBN 978-1-4331-2169-2. [Google Scholar]
  9. Burch, Lauren M., Evan L. Frederick, and Ann Pegoraro. 2015. Kissing in the Carnage: An Examination of Framing on Twitter during the Vancouver Riots. Journal of Broadcasting and Electronic Media 59: 399–415. [Google Scholar] [CrossRef]
  10. Campos-Freire, Francisco, José Rúas-Araújo, Xosé López-García, and Valentín-Alejandro Martínez-Fernández. 2016. Impacto de Las Redes Sociales En El Periodismo. El Profesional de La Información 25: 449. [Google Scholar] [CrossRef]
  11. Cerezuela, Berta. 2003. La Información y Documentación Deportiva y Los Grandes Eventos Deportivos. Centre d’Estudis Olímpics UAB 14. Available online: https://ddd.uab.cat/pub/worpap/2003/hdl_2072_4955/WP086_spa.pdf (accessed on 17 July 2020).
  12. Cha, Meeyoung, Hamed Haddadi, Fabrício Benevenuto, and Krishna P. Gummadi. 2017. Measuring User Influence in Twitter: The Million Follower Fallacy. Available online: https://www.aaai.org/ocs/index.php/ICWSM/ICWSM10/paper/viewFile/1538/1826 (accessed on 21 April 2017).
  13. Cheng, Eddie W. L., and Heng li. 2001. Analytic Hierarchy Process: An Approach to Determine Measures for Business Performance. Measuring Business Excellence. [Google Scholar] [CrossRef]
  14. Clavio, Galen, and Patrick Walsh. 2014. Dimensions of Social Media Utilization among College Sport Fans. Communication & Sport 2: 261–81. [Google Scholar] [CrossRef]
  15. Clavio, Galen, Patrick Walsh, and Ryan Vooris. 2013. The Utilization of Twitter by Drivers in a Major Racing Series. International Journal of Motorsport Management 2: 2. Available online: http://scholar.wssu.edu/cgi/viewcontent.cgi?article=1009&context=ijmm (accessed on 21 April 2017).
  16. Clavio, Galen, Lauren M. Burch, and Evan L. Frederick. 2016. Networked Fandom: Applying Systems Theory to Sport Twitter Analysis. International Journal of Sport Communication 5: 522–38. [Google Scholar] [CrossRef] [Green Version]
  17. Curiel, Eva Herrero. 2012. El Periodismo En El Siglo de Las Redes Sociales. Vivat Academia, 1113. [Google Scholar] [CrossRef]
  18. Dasilva, J. Pérez, María Teresa Santos, and K. Meso Ayerdi. 2015. Radio y Redes Sociales: El Caso de Los Programas Deportivos En Twitter. Revista Latina de Comunicacion Social 70: 141–55. [Google Scholar] [CrossRef] [Green Version]
  19. Day, Brian. 2020. Persuasion: Social Influence and Compliance Gaining; Sixth Edition, by Robert H. Gass and John S. Seiter. Applied Environmental Education & Communication 19: 221–22. [Google Scholar] [CrossRef]
  20. de Nooy, Wouter, Andrej Mrvar, and Vladimir Batagelj. 2005. Exploratory Social Network Analysis with Pajek. Exploratory Social Network Analysis with Pajek. Cambridge: Cambridge University Press. [Google Scholar] [CrossRef]
  21. Figaro, Roseli, Claudia Nonato, and Rafael Grohman. 2015. Los Cambios En El Mundo Del Trabajo Del Periodista—Figaro, Roseli, Nonato, Cláudia, Grohmann, Rafael—Google Libros. Barcelona: Editorial UOC. [Google Scholar]
  22. Frederick, Evan, Choong Hoon Lim, Galen Clavio, Paul M. Pedersen, and Lauren M. Burch. 2014. Choosing Between the One-Way or Two-Way Street. Communication & Sport 2: 80–99. [Google Scholar] [CrossRef]
  23. Frederick, Evan L., Lauren M. Burch, and Matthew Blaszka. 2015. A Shift in Set: Examining the Presence of Agenda Setting on Twitter during the 2012 London Olympics. Communication and Sport 3: 312–33. [Google Scholar] [CrossRef]
  24. Freeman, Linton C. 1978. Centrality in Social Networks Conceptual Clarification. Social Networks 1: 215–39. [Google Scholar] [CrossRef] [Green Version]
  25. Fuchs, Christian. 2014. The Power and Political Economy of Social Media. In Social Media: A Critical Introduction. London: SAGE Publications Ltd., pp. 97–125. [Google Scholar] [CrossRef]
  26. Fuentes, J. Moyano, S. Bruque Cámara, and Jacob Eisenberg. 2007. La influencia de las redes sociales en la adaptación de los trabajadores al cambio tecnológico. Cuadernos de Economía y Dirección de La Empresa 10: 147–69. [Google Scholar] [CrossRef] [Green Version]
  27. Gallardo-Camacho, Jorge, Eva Lavín, and Paula Fernández-García. 2016. Los Programas de Televisión Deportivos y Su Relación Con La Audiencia Social En Twitter En España. Revista Latina de Comunicacion Social 71: 272–86. [Google Scholar] [CrossRef] [Green Version]
  28. Gil, Antón, and Ana María. 2012. El Fenómeno de Las Redes Sociales y Los Cambios En La Vigencia de Los Derechos Fundamentales. Revista de Derecho de La UNED, 10. [Google Scholar] [CrossRef]
  29. Gila, José M. Pardo, and María Teresa Calle Molina. 2016. Los Juegos Olímpicos de La Juventud y Las Redes Sociales (2010–2014): Evolución y Retos En Las Nuevas Formas de Comunicación Para La Transmisión de Valores Olímpicos/The Youth Olympic Games and Social Networks (2010–2014): Evolution and Challenges of Ne. Citius Altius Fortius 9: 17–30. [Google Scholar] [CrossRef] [Green Version]
  30. Gouveia, Célia, Lapa Tiago, and Fátima Branco Di. 2018. Benfica vs. Sporting: O Derby Visto a Partir Do Twitter. Available online: http://www.scielo.mec.pt/scielo.php?script=sci_arttext&pid=S1646-59542018000200004 (accessed on 12 September 2020).
  31. Hambrick, Marion E. 2016. Six Degrees of Information: Using Social Network Analysis to Explore the Spread of Information within Sport Social Networks. International Journal of Sport Communication 5: 16–34. [Google Scholar] [CrossRef]
  32. Hambrick, Marion E., and Ann Pegoraro. 2014. Social Sochi: Using Social Network Analysis to Investigate Electronic Word-of-Mouth Transmitted through Social Media Communities. International Journal of Sport Management and Marketing 15: 120–40. [Google Scholar] [CrossRef]
  33. Hambrick, Marion E., and Jimmy Sanderson. 2013. Gaining Primacy in the Digital Network: Using Social Network Analysis to Examine Sports Journalists’ Coverage of the Penn State Football Scandal via Twitter. Journal of Sports Media 8: 1–18. [Google Scholar] [CrossRef]
  34. Hambrick, Marion E., Jason M. Simmons, Greg P. Greenhalgh, and T. Christopher Greenwell. 2010. Understanding Professional Athletes’ Use of Twitter: A Content Analysis of Athlete Tweets. International Journal of Sport Communication 3: 454–71. [Google Scholar] [CrossRef]
  35. Hurst, Marta, Manuel Loureiro, Beatriz Valongo, Lorenzo Laporta, Pantelis T. Nikolaidis, and José Afonso. 2016. Systemic Mapping of High-Level Women’s Volleyball Using Social Network Analysis: The Case of Serve (K0), Side-out (KI), Side-out Transition (KII) and Transition (KIII). International Journal of Performance Analysis in Sport 16: 695–710. [Google Scholar] [CrossRef]
  36. Kassing, Jeffrey W., and Jimmy Sanderson. 2016. Fan–Athlete Interaction and Twitter Tweeting Through the Giro: A Case Study. International Journal of Sport Communication 3: 113–28. [Google Scholar] [CrossRef]
  37. Lamirán-Palomares, José M., Tomás Baviera, and Amparo Baviera-Puig. 2019. Identifying Opinion Leaders on Twitter during Sporting Events: Lessons from a Case Study. Social Sciences 8: 141. [Google Scholar] [CrossRef] [Green Version]
  38. Leavitt, Alex, Evan Burchard, David Fisher, and Sam Gilbert. 2009. The Influentials: New Approaches for Analyzing Influence on Twitter. Available online: http://webecologyproject.org (accessed on 17 July 2020).
  39. Lebel, Katie, and Karen Danylchuk. 2016. How Tweet It Is: A Gendered Analysis of Professional Tennis Players’ Self-Presentation on Twitter. International Journal of Sport Communication 5: 461–80. [Google Scholar] [CrossRef]
  40. Lewin, Kurt. 1939. Field Theory and Experiment in Social Psychology: Concepts and Methods. American Journal of Sociology 44: 868–96. [Google Scholar] [CrossRef]
  41. Loayza, Valarezo, and Belén María. 2015. La Rreducción del uso de las redes Sociales como norma Administrativa para Mejorar el Desempeño de los Atletasn (Examen Complexivo) UTMATCH. Machala: Unidad Académica de Ciencias Empresariales, Available online: http://186.3.32.121/handle/48000/3284 (accessed on 23 July 2020).
  42. Lozares, Carlos. 1996. La Teoría de Redes Sociales. Papers: Revista de Sociologia 48: 103–26. [Google Scholar] [CrossRef]
  43. Maclean, Joanne, Laura Lynne Cousens, and Martha L. Barnes. 2011. Look Who’s Linked with Whom: A Case Study of One Community Basketball Network Park Tourism View Project Recreation Planning View Project. Article in Journal of Sport Management. [Google Scholar] [CrossRef]
  44. Meenaghan, Tony, Damien McLoughlin, and Alan McCormack. 2013. New Challenges in Sponsorship Evaluation Actors, New Media, and the Context of Praxis. Psychology & Marketing 30: 444–60. [Google Scholar] [CrossRef]
  45. Naraine, Michael L., and Milena M. Parent. 2016. Illuminating Centralized Users in the Social Media Ego Network of Two National Sport Organizations. Journal of Sport Management 30: 689–701. [Google Scholar] [CrossRef]
  46. Naraine, Michael L., Jessie Schenk, and Milena M. Parent. 2016. Coordination in International and Domestic Sports Events: Examining Stakeholder Network Governance. Journal of Sport Management 30: 521–37. [Google Scholar] [CrossRef]
  47. Newman, Mark. 2010. Networks: An Introduction. Oxford: OUP. [Google Scholar] [CrossRef] [Green Version]
  48. Page, Lawrence, and Sergey Brin. 1998. The Anatomy of a Large-Scale Hypertextual Web Search Engine. Computer Networks 30: 107–17. [Google Scholar] [CrossRef]
  49. Park, Namsu, Kerk F. Kee, and Sebastián Valenzuela. 2009. Being Immersed in Social Networking Environment: Facebook Groups, Uses and Gratifications, and Social Outcomes. Cyberpsychology and Behavior 12: 729–33. [Google Scholar] [CrossRef] [Green Version]
  50. Pegoraro, Ann. 2016. Look Who’s Talking—Athletes on Twitter: A Case Study. International Journal of Sport Communication 3: 501–14. [Google Scholar] [CrossRef]
  51. Quatman, Catherine, and Packianathan Chelladurai. 2008. The Social Construction of Knowledge in the Field of Sport Management: A Social Network Perspective. Journal of Sport Management 22: 651–76. [Google Scholar] [CrossRef]
  52. Riquelme, Fabián, and Pablo González-Cantergiani. 2015. Measuring User Influence on Twitter: A Survey. Information Processing and Management 52: 949–75. [Google Scholar] [CrossRef] [Green Version]
  53. Rojas-Torrijos, José Luis. 2012. Del Fútbol Por Exceso a La Espectacularización de La Información En El Periodismo Deportivo. Propuestas Para Una Mayor Diversificación Temática de Los Contenidos. La Laguna: Sociedad Latina de Comunicación Social, pp. 1–13. Available online: http://www.revistalatinacs.org/12SLCS/2012_actas.html (accessed on 17 July 2020).
  54. Saaty, Thomas. 1980. The Analytic Hierarchy Process: Planning, Priority Setting, Resource Allocation. New York and London: McGraw-Hill International Book Co. [Google Scholar]
  55. Saaty, Thomas L. 2008. Decision Making with the Analytic Hierarchy Process. International Journal of Services Sciences 1: 83–98. [Google Scholar] [CrossRef] [Green Version]
  56. Sahelices-Pinto, César, and Carmen Rodríguez-Santos. 2014. E-WoM and 2.0 Opinion Leaders. Journal of Food Products Marketing 20: 244–61. [Google Scholar] [CrossRef]
  57. Sanderson, Jimmy. 2014. Shaping, Driving, Engaging, and Influencing in 140 Characters: Exploring Twitter’s Role in a Labor Dispute. Qualitative Research Reports in Communication 15: 43–50. [Google Scholar] [CrossRef]
  58. Sanderson, Jimmy, and Marion E. Hambrick. 2016. Covering the Scandal in 140 Characters: A Case Study of Twitter’s Role in Coverage of the Penn State Saga. International Journal of Sport Communication 5: 384–402. [Google Scholar] [CrossRef]
  59. Saura, Jose Ramon, Ana Reyes-Menendez, and Dag R. Bennett. 2019a. How to Extract Meaningful Insights from UGC: A Knowledge-Based Method Applied to Education. Applied Sciences 9: 4603. [Google Scholar] [CrossRef] [Green Version]
  60. Saura, Jose Ramon, Ana Reyes-Menendez, and Ferrão Filipe. 2019b. Comparing Data-Driven Methods for Extracting Knowledge from User Generated Content. Journal of Open Innovation: Technology, Market, and Complexity 5: 74. [Google Scholar] [CrossRef] [Green Version]
  61. Scott, John. 2017. Social Network Analysis, 4th ed. Thousand Oaks: SAGE Publications Ltd., Available online: https://www.amazon.es/Social-Network-Analysis-John-Scott/dp/1473952123 (accessed on 17 July 2020).
  62. Sjöblom, Max, Lobna Hassan, Joseph Macey, Maria Törhönen, and Juho Hamari. 2018. Liking the Game: How Can Spectating Motivations Influence Social Media Usage at Live Esports Events? In ACM International Conference Proceeding Series. New York: Association for Computing Machinery, pp. 160–67. [Google Scholar] [CrossRef]
  63. Stavros, Constantino, Matthew D. Meng, Kate Westberg, and Francis Farrelly. 2014. Understanding Fan Motivation for Interacting on Social Media. Sport Management Review 17: 455–69. [Google Scholar] [CrossRef]
  64. Thirumalai, Chandrasegar, Kaitha Sai Sree, and Haripriya Gannu. 2017. Analysis of Cost Estimation Function for Facebook Web Click Data. Paper presented at International Conference on Electronics, Communication and Aerospace Technology, (ICECA), Coimbatore, India, April 20–22; Volume 2, pp. 172–75. [Google Scholar] [CrossRef]
  65. Thompson, Ashleigh Jane, Andrew J. Martin, Sarah Gee, and Andrea N. Geurin. 2017. Fans’ Perceptions of Professional Tennis Events’ Social Media Presence: Interaction, Insight, and Brand Anthropomorphism. Communication and Sport 5: 579–603. [Google Scholar] [CrossRef]
  66. Toole, Jameson L., Meeyoung Cha, and Marta C. González. 2012. Modeling the Adoption of Innovations in the Presence of Geographic and Media Influences. Edited by de Polavieja Gonzalo G. PLoS ONE 7: e29528. [Google Scholar] [CrossRef] [Green Version]
  67. Veglis, Andreas, and Theodora A. Maniou. 2018. The Mediated Data Model of Communication Flow: Big Data and Data Journalism. Kome 6: 32–43. [Google Scholar] [CrossRef]
  68. Wang, Xiao. 2015. Using Attitude Functions, Self-Efficacy, and Norms to Predict Attitudes and Intentions to Use Mobile Devices to Access Social Media during Sporting Event Attendance. Mobile Media & Communication 3: 75–90. [Google Scholar] [CrossRef]
  69. Warner, Stacy, Matthew T. Bowers, and Marlene A. Dixon. 2012. Team Dynamics: A Social Network Perspective. Journal of Sport Management 26: 53–66. [Google Scholar] [CrossRef]
  70. Wäsche, Hagen, Geoff Dickson, Alexander Woll, and Ulrik Brandes. 2017. Social Network Analysis in Sport Research: An Emerging Paradigm. European Journal for Sport and Society 14: 138–65. [Google Scholar] [CrossRef]
  71. Wasserman, Stanley, and Katherine Faust. 1994. Network Data, Measurement and Collection. In Social Network Analysis: Methods and Applications (Structural Analysis in the Social Sciences). Cambridge: Cambridge University Press, pp. 28–66. [Google Scholar] [CrossRef]
  72. Witkemper, Chad, Choong Lim, and Adia Waldburger. 2012. Social Media and Sports Marketing: Examining the Motivations and Constraints of Twitter Users. Sport Marketing Quarterly 21: 170. [Google Scholar]
  73. Yan, Grace, Nicholas M. Watanabe, Stephen L. Shapiro, Michael L. Naraine, and Kevin Hull. 2019. Unfolding the Twitter Scene of the 2017 UEFA Champions League Final: Social Media Networks and Power Dynamics. European Sport Management Quarterly 19: 419–36. [Google Scholar] [CrossRef]
  74. Yu, Yang, and Xiao Wang. 2015. World Cup 2014 in the Twitter World: A Big Data Analysis of Sentiments in U.S. Sports Fans’ Tweets. Computers in Human Behavior 48: 392–400. [Google Scholar] [CrossRef]
Figure 1. Detail of the steps carried out for the research in the two events.
Socsci 09 00169 g001
Figure 2. Interaction graph of the event with hashtag #TWC2016.
Socsci 09 00169 g002
Figure 3. Interaction graph of the event with hashtag #Apeldoorn2018.
Socsci 09 00169 g003
Table 1. Studies that use Gephi as software for social network analysis. Source: own creation.
AuthorsYearTopics StudiedSocial Network Analysed
Bruns2011Hashtags, replies, communication studiesTwitter
Hurst2016Voleyball, sport performance, --------
Thirumalai, Sree and Gannu2017Social Network Analysis, Cost estimation function, web click data Facebook
Gouveia, Lapa and Di Fatima2018Football, users clusters, sporting eventsTwitter
Yan, Watanabe et al.2019Football, Uefa Champions League, influence, power dynamicsTwitter
Saura, Reyes-Menendez and Bennet2019Education, sentiment analysis, Twitter
Saura, Reyes-Menendez and Filippe2019Digital marketing, data-driven methods, bussines knowledgeTwitter
Table 2. Variables that make up each dimension of influence on Twitter.
DimensionVariables (Origin)Description
ActivityNumber of tweets (Twitter)Tweets published by a user during the data capture period
ActivityOutdegree (SNA)Tweets published by a user during the data capture period
AuthorityNumber of retweets (Twitter)Tweets published by a user during the period and retweeted by other users
AuthorityPageRank (SNA)Value that measures the importance of the user according to the Google algorithm applied to the interactions received during the capture period (retweets and mentions)
PopularityNumber of followers (Twitter)Users following an account
PopularityIndegree (SNA)Number of mentions of a user received during the capture period
Table 3. General data of the two world championships analysed.
EventUCI Track 2016 World ChampionshipUCI Track 2018 World Championship
Event locationLondon (UK)Apeldoorn (Netherlands)
Event date2–6 March 201628 February–4 March 2018
Official hashtag#TWC2016#Apeldoorn2018
No. tweets analysed55,57219,701
Users taking part20,1757281
Table 4. Weighting of the subcriteria that determine the influence of a user on Twitter.
RankingCriterionSubcriterionWaiting
1Authority (0.620)Number of retweets (0.601)37.28%
2Authority (0.620)PageRank (0.399)24.75%
3Popularity (0.296)Indegree (0.682)20.17%
4Popularity (0.296)Number of followers (0.318)9.42%
5Activity (0.084)Outdegree (0.616)5.16%
6Activity (0.084)Number of tweets (0.384)3.22%
Table 5. Grouping of users by category and event. Source: own creation.
AccountsYear 2016Year 2018Total
1. Athletes8614
2. Communication media325
3. Fans101
4. Specialist media213
5. Journalists, bloggers …112
6. Event institutions81321
7. Others224
Most influential accountBritish CyclingUCI track
Most influential athleteOfficial WigginsFabián Puerta
Most influential media outletBBC SportEurosport IT
Organising account (position)Trackworlds (3)Wkbaanapeldoorn (25)
Table 6. The 25 most influential accounts with a breakdown by variable and group allocation. World Championship 2016.
RankingUserNo TweetsNo FollowersNo RetweetsIndegreeOutdegreePageRankWeightingCategory
1@britishcycling355117,36878121842860.026500.162656
2@uci_track236681737411315590.018970.089606
3@trackworlds3045749171019241200.033180.082876
4@officialwiggins2651,5579191243220.016510.044581
5@markcavendish01,280,0000145300.018710.038611
6@teamgb107676,0421646531310.006150.038526
7@BBCSport105,352,955100134590.004680.036382
8@lauratrott310306,000094000.014140.025631
9@cyclingaus25627,529639305600.007840.022556
10@leevalleyvp22758911824681070.008110.018916
11@bicigoga54112,56782724290.002980.018275
12@fndogaviria113,932056510.009660.016111
13@jasonkenny1070101,000061300.008360.015651
14@BBCNews16,232,2000010.000020.015432
15@jondibben104353046600.009260.014481
16@mundociclistico5517,821484255350.002590.013394
17@PelotonWatch55921,999510128200.001690.013284
18@JuanManSantos14,348,0231331510.000320.013157
19@skycycling7052,44947717720.002610.011926
20@uci_cycling57168,002212290160.004550.011836
21@azizulawang2744,894333253240.003340.011671
22@GazetteDesSport3174487466123260.001460.011382
23@robayocolombia6822635195701440.001860.010923
24@ThreeSixtyMgmt1037654310980.001410.010617
25@sebastianmorav201497310207150.003370.010511
Table 7. The 25 most influential accounts with a breakdown by variable and group allocation. World Championship 2018.
RankingUserNo TweetsNo FollowersNo RetweetsIndegreeOutdegreePageRankWeightingCategory
1UCI_Track29414,17836722087730.058740.233026
2BritishCycling161156,5321189818470.018030.079366
3fedeciclismocol2236,99050339580.01180.03746
4Eurosport_IT2773,34251133960.010740.035672
5Federciclismo4725,907350339200.010150.029876
6fabianpuerta141317,318067450.015980.026831
7BBCSport67,250,358114060.002070.026472
8FFCyclisme8618,543402145240.006560.024996
9JuanManSantos15,298,442606110.0040.023937
10RFECiclismo9724,890348174210.006050.023176
11JCF_cycling7915,50844914430.003590.023156
12ClaraLuzRoldan126,02322222200.006970.018885
13ItaliaTeam_it651,81121916600.006750.017556
14TeamGB17928,775234143130.002570.017286
15mundociclistico1737,11626020480.003180.016974
16SebastianMoraV7218715027770.006030.016811
17carlosvives14,988,5390010.000040.0167
18chloedygert30846190305100.008520.01431
19alberttorresb36313564229390.005950.01411
20gannafilippo82938029090.007530.013081
21maximilianlevy82968024690.006620.011361
22Coninews5236,97015114020.002260.011216
23Japan_Olympic1399,06510410200.003210.009996
24usacycling1359,59153162140.004090.009716
25wkbaanapeldoorn8594746123340.003950.009666
Table 8. Distribution of influential users by country and category. 2016 Event.
Influential Users Category
CountryMedalsInfluential Users1234567
Germany80
Australia52 1 1
Colombia551 111 1
Spain211
France30
Great Britain91252 5
Italy11 1
Malaysia021 1
The Netherlands40
USA20
Others222 2
The user categories are as follows: 1—Athletes; 2—Media; 3—Fans; 4—Specialist media; 5—Journalists, bloggers; 6—Organisations and/or institutions related to the event or cycling; 7—Other different profiles.
Table 9. Distribution of influential users by country and category. 2018 Event.
Influential Users Category
CountryMedalsInfluential Users1234567
Germany 611
Australia60
Colombia161 1113
Spain132 1
France21 1
Britain63 1 2
Italy6511 3
Japan12 2
The Netherlands121 1
USA421 1
Others151 1
The user categories are as follows: 1—Athletes; 2—Media; 3—Fans; 4—Specialist media; 5—Journalists, bloggers; 6—Organisations and/or institutions related to the event or cycling; 7—Other different profiles.

