Article

The Diffusion and Implementation of the Balanced Scorecard in the Norwegian Municipality Sector: A Descriptive Analysis

Department of Business, Marketing and Law, School of Business, University of South-Eastern Norway, Bredalsveien 14, 3511 Hønefoss, Norway
*
Author to whom correspondence should be addressed.
Soc. Sci. 2019, 8(5), 152; https://doi.org/10.3390/socsci8050152
Submission received: 4 April 2019 / Revised: 4 May 2019 / Accepted: 6 May 2019 / Published: 14 May 2019
(This article belongs to the Section Social Economics)

Abstract

:
The Balanced Scorecard (BSC) has over the last two and a half decades received much attention as a management model for both private and public sector organizations. However, the BSC concept’s use and application in local governments and municipalities remains relatively understudied. This is particularly the case for the Norwegian context. Therefore, the aim of this article is to conduct a descriptive analysis of the diffusion and implementation of the BSC in the Norwegian municipality sector. The article draws on two sources of data: (1) an electronic survey sent to all 428 municipalities in Norway, yielding a response rate of 26%, and (2) follow-up interviews with representatives from 15 municipalities. In the empirical analysis, the article first provides an overall overview of patterns related to the diffusion and implementation of the BSC in the Norwegian municipality sector. With respect to BSC diffusion and implementation, the data show that the BSC is still widely used among Norwegian municipalities and has not yet entered a clear downturn phase. With respect to adoption and implementation, a more fine-grained analysis of five categories of respondents (non-adopters, planners, implementers, current users, ex-users) is also carried out, focusing on the motives, perceptions and applications of the concept. The analysis reveals considerable variation when it comes to perceptions and experiences associated with BSC adoption and implementation.

1. Introduction

1.1. The Balanced Scorecard

The Balanced Scorecard (BSC) was introduced as a new innovative performance measurement system in the early 1990s (Kaplan and Norton 1992). In short, the BSC was introduced and presented as an integrated system, combining conventional backward-looking financial performance measures and more forward-looking non-financial measures related to customers, internal processes as well as learning and growth. The aim of the BSC was to help reduce problems related to managerial myopia and short-termism (cf. Merchant and Van der Stede 2012, pp. 473–77), by providing managers with “early warnings” about the future performance of an organization.
Over the course of its first two and a half decades, the BSC concept has received much attention and enjoyed huge levels of popularity among both academics and practitioners (Frigo 2012; Hoque 2012, 2014). For example, the bi-annual surveys carried out by Bain and Company have shown that the BSC, in recent years, consistently has ranked as one of the most widely used management tools among managers in the private sector (Rigby and Bilodeau 2015, 2018).
However, the popularity and use of the BSC are not confined to the private sector. Over time, the BSC has gained attention and traction in the public sector as well. To a large extent, the popularity and appeal of the BSC in the public sector can be attributed to the New Public Management (NPM) wave which, over the last few decades, has swept through the public sector, with calls for modernization, improved resource utilization and value for taxpayer money (Christensen and Lægreid 2001; Hood 1995; Hyndman and Lapsley 2016). NPM-inspired reforms have been accompanied by the introduction and adaptation of new managerial and accounting concepts and practices in the public sector (Brignall and Modell 2000; Jackson and Lapsley 2003; Lapsley and Wright 2004; Olson et al. 1998).
The BSC is a prominent example of the many new management concepts that have been introduced and become popular among managers of public sector organizations (Farneti and Guthrie 2008; Johnsen 2001; Niven 2011; Northcott and Taulapapa 2012). According to leading proponents of the BSC (Kaplan and Norton 1999; Kaplan 2000; Niven 2011), the concept can relatively easily be adapted to fit the needs and unique challenges of public sector organizations, such as municipalities. Therefore, the BSC has been put forth as a solution (and by some as a panacea) to many of the problems and challenges facing contemporary public sector organizations in relation to management and governance.

1.2. Purpose and Contribution

The research question we seek to address in this study is: To what extent and in what ways is the BSC diffused and implemented in the Norwegian municipality sector? Empirically, we attempt to answer this research question by drawing on a combination of survey and interview data. In our view, a hybrid approach allows for an updated and balanced picture of the use and application of the BSC in this sector.
While proponents of the BSC have heralded its usefulness for public sector organizations, the concept’s use and application in public sector areas such as local government and municipalities remains relatively underexplored in the literature (Northcott and Taulapapa 2012, p. 169). Hence, in our view, the current paper can contribute to filling this gap in the literature by examining the diffusion and implementation of the BSC in the Norwegian municipality sector.
We argue that the study has implications at both the theoretical and practical levels. Theoretically, our findings engage with the emerging literature on the diffusion and implementation of the BSC in the municipality sector (e.g., Funck and Larsson 2014; Hellström et al. 2012). From a broader perspective, it is of relevance to the existing literature on the diffusion and implementation of innovative management concepts (Røvik 2007; Wedlin and Sahlin 2017; Örtenblad 2015), and how such concepts are used and applied in different economic, social and geographical contexts (Hagedorn-Rasmussen and Klethagen 2018; Lillrank 1995; Wittrock 2015).
From a practical standpoint, the study’s findings can potentially be of interest and use to managers of Norwegian municipalities who are currently using or considering adopting and implementing the BSC. For example, our findings suggest that users at different stages of implementation have different perceptions of the benefits and problems associated with the BSC.

1.3. Structure

The rest of the article is structured in the following way. In Section 2, we provide a brief review of related work on the diffusion and implementation of the BSC in the municipality sector, with a particular focus on the Scandinavian countries. Thereafter, in Section 3, we outline and discuss the overall research approach. In Section 4, we provide an overview of the overall diffusion and implementation pattern of the BSC in the Norwegian municipality sector. In Section 5, we turn to a more fine-grained analysis of the implementation of the concept, by looking at the five different categories of respondents (non-adopters, planners, implementers, users, and ex-users).
Then, in Section 6, we discuss the study’s findings in relation to existing research on the diffusion and implementation of the BSC in the municipality sector, and more broadly research on innovative management concepts. Finally, in Section 7, we conclude this paper by presenting the conclusions, implications, as well as limitations and directions for future research.

2. Related Work on the BSC in the Municipality Sector

2.1. Prior Research on the BSC

Since its introduction in the early 1990s (Kaplan and Norton 1992), the BSC has attracted much attention in academic circles. Several recent literature reviews show that there is a growing body of research on the BSC in both private, public sector and third sector contexts (Abdel-Kader et al. 2011; Banchieri et al. 2011; Hoque 2014; Lueg and Carvalho e Silva 2013; Lueg and Julner 2014). However, since the BSC literature is well surveyed in previous review articles, the purpose of this section of the paper is not to provide a comprehensive and broad-based overview of existing research on BSC in the public sector. Instead, our aim is to narrowly discuss related work pertaining to the BSC in the municipality sector, which will allow for a contextualization of the study’s research question.

2.2. Research on the BSC in Municipalities

As Northcott and Taulapapa (2012, p. 169) have pointed out, public sector areas such as local government and municipalities have received relatively little attention in previous BSC research. While there are several dispersed studies on the use and application of the BSC in local governments and municipalities (e.g., Bianchi and Montemaggiore 2008; Funck and Larsson 2014; Greatbanks and Tapp 2007; Hellström et al. 2012; Kasperskaya 2008; Sharma and Gadenne 2011), the current body of literature can be characterized as relatively small, especially in comparison to the considerably larger literature on the BSC in the private sector.
In the following, our focus will be on related work, which we deem to be of particular relevance for addressing our study’s research question of how the BSC is diffused and implemented in the Norwegian municipality sector. Therefore, we deem studies which have been carried out in the Scandinavian context (i.e., Sweden, Denmark and Norway) to be of particular relevance. The municipality sectors in these countries share some important similarities in terms of being Social Democratic welfare states (Esping-Andersen 1990), where the public sector (e.g., municipalities) plays a large role in the economy. In these countries, municipalities are responsible for providing a wide range of public services affecting people’s lives.
While previous research has shown that NPM reforms have been implemented and received differently in the Scandinavian countries (Green-pedersen 2002), we argue that these countries share enough commonalities in terms of size, structure, politics, and culture to make examination of past research on the diffusion and implementation of the BSC in these countries particularly relevant for contextualizing the study’s research question.

2.3. Research on the BSC in the Scandinavian Municipality Sector

In this section, we examine extant research on the BSC in municipality sector of the three Scandinavian countries, starting with Sweden.
In previous work, it has been shown that the BSC has a long history in Sweden, dating back to the mid-1990s (Lindvall 1995). Various sources suggest that the BSC has been used in the Swedish municipality sector since the mid-to-late 1990s. Evidence of this includes a report on how to implement the BSC in Swedish municipalities (Sande and Wæærn 1999) and a book about BSC in municipalities (Ericsson and Gripne 2004).
Other studies have examined the diffusion and use of the BSC in the Swedish municipality sector. For example, in a survey, Andersson and Ericsson (2002) generally found widespread usage of the BSC in Swedish municipalities. However, they also found that that approximately 25% of municipalities used a highly modified version of BSC which fit better with the non-profit motives of municipalities.
In a more recent study, Hellström et al. (2012) investigated the diffusion pattern of the BSC in Swedish municipalities by surveying 190 municipalities. The authors found evidence of an S-shaped diffusion pattern. Furthermore, they found that the BSC was mostly used in larger municipalities, and in particular in “soft services” (e.g., elderly care). Hellström et al. (2012) also found evidence of municipalities adding a fifth perspective to their BSCs. Overall, the findings from this study support the notion that the BSC concept has “interpretive space” and that the concept is commonly interpreted and adapted in different ways (Braam et al. 2007; Braam 2012).
Funck and Larsson (2014) investigated the adoption and diffusion of the BSC in Swedish municipalities and county councils and found what they referred to as a “wave-like pattern” of BSC adoption and diffusion. While the results show that Swedish municipalities started to adopt and implement the BSC quite early, after several years, many municipalities have started to discard and abandon the BSC and have instead turned their focus toward alternative management concepts.
In Denmark, research has shown that the BSC emerged during the mid-1990s (Madsen 2011; Madsen and Slåtten 2016). Around that time, the BSC was mostly a private sector phenomenon, and several studies have shown that the BSC has been popular in the private sector in Denmark (Nielsen et al. 2003; Nielsen and Sørensen 2004; Sandalgaard and Bukh 2008). Considerably less is known about the BSC’s popularity in the public sector, as studies of the concept’s usage in the Danish municipality context are hard to come by. One exception is the study by Nielsen and Nielsen (2009) which indicates that the BSC, in particular, has a low degree of diffusion in the public sector, and that the usage of the BSC is relatively low compared with similar concepts such as Activity Based Costing and different Quality Management concepts (e.g., EFQM and TQM).
The relatively low level of usage of the BSC in the Danish municipality sector can partly be explained by the fact that Danish government agencies have been relatively passive in relation to the BSC. For example, the government agency in charge of new initiatives in the area (Økonomistyrelsen) has been slow in embracing new management concepts such as the BSC. Part of the reason could be attributed to the considerable popularity of the “business excellence” model in the public sector during the mid-2000s, and it is possible that this model was recommended as an alternative to the BSC (Nielsen and Nielsen 2009). However, this does not mean that Danish municipalities do not use the BSC. For example, in a study of Danish municipalities, Pedersen (2009, p. 6) found that Danish municipalities sometimes utilize the BSC as a part of a shift towards flatter organizational structures.
Compared to their Danish counterparts, Norwegian government-affiliated actors have been much more active in promoting and popularizing the BSC in the municipality sector. For example, there was a strong focus on the BSC in the Norwegian public sector during early 2000s, evidenced by a string of government reports and “implementation guides” written to help municipalities understand the benefits of the BSC (Kommunal- og regionaldepartmentet 2002, 2004, 2007; Statskonsult 2001).
In Norway, quite a few studies have been carried out in the municipality sector. However, most of the studies to date have been case studies of individual municipalities (Jønsrud 2007; Løvbak 2014; Steen and Olsen 2007) or a limited number of municipalities (Møller-Pettersen and Thorud 2014). In addition, some surveys of Norwegian municipalities’ management practices have been carried out. These surveys generally show an increase in BSC use, from an adoption rate of approximately 25% in 2004 to more than 50% in 2008 (Hovik and Stigen 2004, 2008).
A more recent study found that 56% of Norwegian municipalities use the BSC (Daleq and Hobbel 2015; Fallan et al. 2015). Furthermore, the adoption rate increased to 65% when municipalities which reported that they plan to adopt the BSC are included. Moreover, these authors found that financial managers of municipalities play an important role in the decision to adopt the BSC, and that Norwegian municipalities are not forced to adopt the BSC (e.g., due to statutory requirements).

2.4. Evaluation

In this brief review of related work, we have focused narrowly on extant research carried out in the Scandinavian municipality sector context. Taken as a whole, we find that the reviewed studies generally indicate that the BSC concept has taken slightly different diffusion trajectories in each of the three Scandinavian countries.
In Denmark, available evidence suggests that the BSC has not been nearly as popular in the public sector as it has been in the private sector. By contrast, in Sweden and Norway, there has generally been more government-related pressure and influence, which in turn has paved the way for more knowledge, awareness, and interest in the BSC concept among municipalities. While there are some indications that the popularity of the BSC may be on a downward trajectory in Sweden, in Norway, the concept’s popularity seems to have remained relatively more stable over time.
While this brief review of related work helps paint a broad picture of the diffusion and implementation of the BSC in the municipality sectors of the Scandinavian countries, our knowledge about the diffusion and implementation of the BSC in the municipality sector is still limited. For example, most of the extant research in the Norwegian context only provides a broad overview of the extent of adoption and diffusion, and we know very little about how the BSC concept is implemented and applied (e.g., emphasis on different parts of the concept), and what the perceptions and experiences are.
Therefore, in the next section, we will describe and outline the research approach utilized in this study to obtain a picture of the diffusion and implementation of the BSC in the Norwegian municipality sector.

3. Methods and Data

3.1. Research Design

In Section 2, we showed that the diffusion and implementation of the BSC in the municipality sector is relatively underexplored in the research literature. This is particularly the case for the Norwegian context. Therefore, a main aim of our current study is to contribute to filling this gap in the literature by obtaining an overall picture of the current state of BSC diffusion and implementation in Norwegian municipalities.
When designing the study, we prioritized obtaining data from a large number of organizations (breadth) rather than “rich” data from a small number of organizations (depth). Therefore, we deemed the survey method to be a suitable methodological choice given its advantages in terms of reaching a large number of respondents in a time and resource efficient way (Ghauri and Grønhaug 2002). However, since qualitative research interviews can provide more in-depth insights than is possible using the survey method, we decided to conduct follow-up interviews with some survey respondents.
Therefore, our research approach bears similarities to the hybrid approach followed by Northcott and Taulapapa (2012) in their earlier study of BSC in public sector organizations. It can be argued that our research approach resembles a “mixed methods approach” (see e.g., Johnson et al. 2007). Although our research design is weighted towards the quantitative survey data, the qualitative follow-up interviews play a role in supplementing and corroborating the survey data. The “richer” interview data could generate new and surprising insights and may help “bring to life” some of the survey data. Therefore, we argue that following a mixed-methods approach increases the validity of our findings.

3.2. Survey

In this section, we discuss some key issues related to the choice of the survey as the main research method. More specifically, we chose to carry out an electronic survey (e-survey) instead of a traditional postal survey. E-surveys have several advantages such as being highly cost-efficient and being able to reach a large number of respondents in a speedy manner (Cobanoglu et al. 2001; Jansen et al. 2007; Sue and Ritter 2011).
We administered the e-survey using the survey software package MI Pro Research Studio (www.mipro.net). Table 1 provides an overview of the structure of the questionnaire. Designing an effective questionnaire is important to increase the likelihood of a high response rate and valid data. In practice, this meant that we took care in ensuring that the questionnaire was not too long and time-consuming to complete, as this could greatly affect the respondents’ willingness to participate in the study and complete the survey.
Therefore, we made five versions of the questionnaire, each tailored to different types of respondents, based on their prior experiences with the BSC (Table 1). Each version of the questionnaire contained a different number of questions, ranging from 19 (short version) to 40 (long version). In this way, we were able to capitalize on one of the strengths of the e-survey methodology, namely its ability to adapt dynamically to the characteristics of a particular respondent. If the questionnaire would not have had such a dynamic component, it would arguably have been hard to get a respondent representing a non-adopting municipality to answer a long questionnaire about the BSC. Non-adopters may not even have heard of the BSC and might feel that a survey about the BSC does not concern them. In this study, however, such non-adopting respondents were presented with a much shorter version taking less than 4 min to complete (see Table 1).
The questions used in the survey were inspired by and adapted from previous BSC surveys carried out by, for instance, Speckbacher et al. (2003) in a private sector context and Northcott and Taulapapa (2012) in a public sector context. Most of the survey questions were closed-ended and utilized seven-point Likert scales (1–7). For most of the questions, the respondents could mark several alternatives. This means that in several of the tables, the numbers add to more than 100%.
The e-survey was sent to all of the 428 municipalities in Norway during the winter of 2014. The e-mail addresses were gathered manually from each municipality’s website. We sent two survey reminders to try to increase the response rate. In the end, a total of 111 respondents had answered the survey, which equals a response rate of 26%. While a response rate of 26% is lower than typical guidelines in the research methods literature (Ghauri and Grønhaug 2002; Mitchell and Jolley 2012), we argue that this response rate is satisfactory since e-surveys tend to yield relatively low response rates (Cook et al. 2000; Shih and Fan 2008).
The municipalities who participated represented 18 out of the 19 counties in Norway. The municipalities represented by these respondents show a great variation in terms of size and complexity. One indicator of size and complexity is the number of employees in each municipality. One of the background surveys in our survey asked respondents to report the approximate number of employees in their municipality. Table 2 below shows the frequency of municipalities within different size categories.

3.3. Interviews

The second phase of the data collection process involved the carrying out of qualitative follow-up interviews with survey respondents. These respondents self-selected into participating in a follow-up interview, by indicating their willingness to elaborate on their answers in a short follow-up interview. In total, 15 follow-up phone interviews were conducted. Conducting phone interviews was a pragmatic solution given the great geographical distances in Norway as well as resource limitations (cf. Opdenakker 2006).
Only one person was interviewed from each municipality. In most cases, this person had some kind of managerial role in the municipality, oftentimes responsible for management and/or accounting system, or in charge of implementing the BSC in the organization.
Two of the researchers carried out the interviews during May 2014 (see Table 3). Most of the interviews lasted between 15 and 30 min, although some were considerably shorter in duration. To this point, it should be noted that the length of the interview varied based on the category that the respondent represented. It was a general trend that the respondents’ prior experiences with the BSC greatly affected the extensiveness of their answers. For example, in cases where the interviewee had little prior experience with the BSC (e.g., category 1, never used the BSC), the interviews were kept brief. Conversely, the longest interview was with a current user of the BSC, as this interviewee naturally had more experience with the concept and was willing to elaborate on these issues in length.
The interviews were semi-structured and supported by an interview guide. The interview guide reflected a topic-centered approach. In designing the interview guide, we focused on covering themes related to the respondents’ experiences with the BSC as well as perceptions of the BSC. Therefore, we utilized a combination of open-ended and more structured questions, which enabled a balance between the need to explore new issues (flexibility) and the need to make sure that the same issues were covered across different interviews (standardization). Since most of the questions were open-ended, the responses varied considerably both with respect to content and length. Before the data could be analyzed, the interviews were transcribed. The data were then coded manually and analyzed using an “issue focused” approach (Weiss 1994) where issues/themes were the focus of the analysis.

4. Overall Patterns Related to Diffusion and Implementation

In this section, we present the overall patterns related to the diffusion and implementation of the BSC in the Norwegian municipality sector. This entails a description of the data about BSC adoption, diffusion and implementation in the sector as a whole. The rest of the section is divided into three parts. The first part focuses on the pre-adoption phase, i.e., how the municipalities became aware of and encountered the BSC concept. The second part focuses on patterns related to the adoption and diffusion of the BSC, while the third part focuses on the implementation of the BSC.

4.1. Pre-Adoption

As noted in the innovation diffusion literature (e.g., Rogers 1995), knowledge and awareness is an important first step in the diffusion process. Therefore, we wanted to explore the level of awareness of the BSC concept among the municipalities. The respondents were asked about whether or not they had heard of the BSC. Nearly all of the respondents claimed to have heard of the BSC (94.6%). This is not a very surprising finding since the BSC has been presented as a suitable management model for municipalities since the early 2000s and has received considerable attention in Norwegian business media, conferences, and business schools (Madsen 2011, 2012).
We also asked the respondents where they first learned about the BSC concept. As can be seen from Table 4, many respondents marked several alternatives, meaning that they learned about the concept through several (or a combination of) channels. The most frequent answers were seminars and conferences (approximately 87%), followed by books and articles (approximately 75%), and consultants (approximately 54%). In addition, some came to know about the concept via educational programs (approximately 44%), while approximately 35% answered the Internet.
Overall, these findings are mostly in line with has been found in previous studies on the adoption and diffusion of the BSC. Previous studies have shown that the channels such as the conference/seminar scene, consultants, business media as well as academics have been important in BSC diffusion and dissemination (Madsen 2014). The particular importance of conferences/seminars and books and articles in Norway can be explained by the fact that there were several government-sponsored BSC conferences and publications about how to use and apply the BSC in municipalities in the early 2000s (Kommunal- og regionaldepartmentet 2002, 2004; Statskonsult 2001).
Next, we asked the respondents to characterize their own perceived understanding of the BSC concept (Table 5). Overall, the respondents report that they have a good understanding of the concept (mean = 5.70). No respondents report that they have a low or very low level of understanding of what the BSC is about.

4.2. Adoption

Table 6 shows the stages of the adoption and implementation of the BSC. The survey data show that approximately 32% of the respondents are currently using the BSC. In addition, roughly 11% report that they are either planning to adopt and implement the BSC, or that they are in the process of adopting and implementing the BSC. Approximately 44% of the respondents had never implemented the BSC, while approximately 6% of the respondents have previously used, but since then stopped using the BSC.
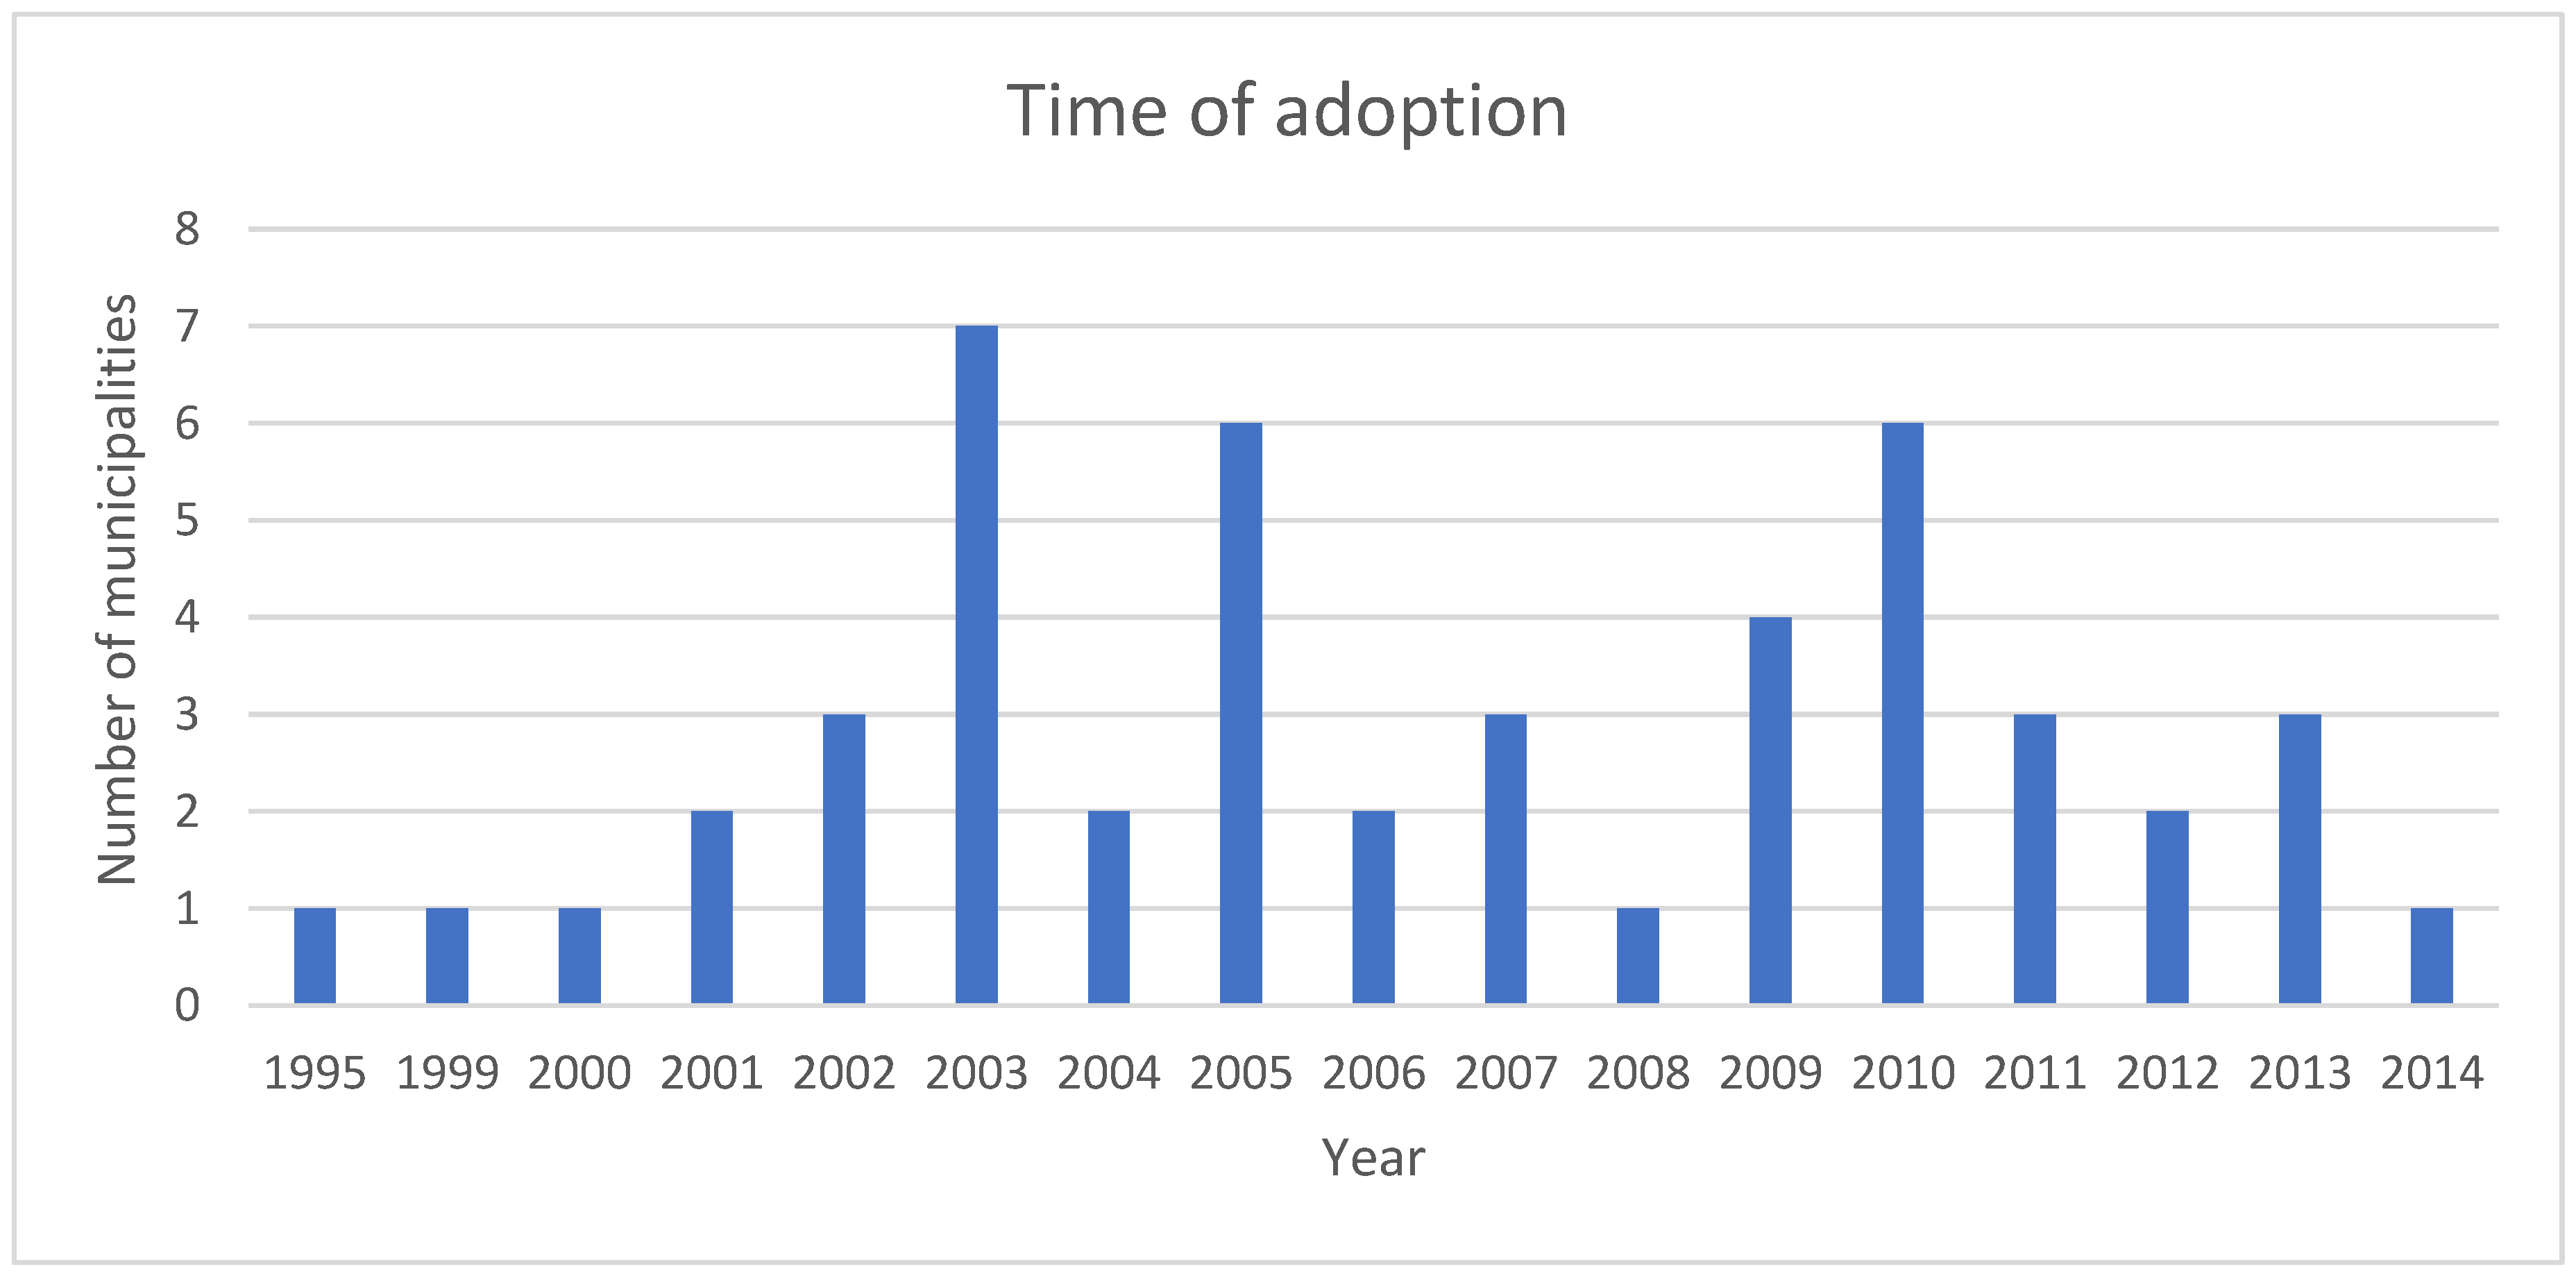
Figure 1 shows when the municipalities first made the decision to adopt the BSC. The figure shows that 2003 is the year with the highest number of new adopters. The sharp increase in the number of new adopters in 2003 can be viewed in light of the fact that there was much discourse about the BSC in the Norwegian municipality sector during the early 2000s. As noted previously, the Norwegian government (including the state-run consulting firm Statskonsult) was, at the time, actively encouraging and recommending BSC adoption (Statskonsult 2001), by publishing reports, as well as by arranging conferences and seminars about the BSC and related issues, featuring influential actors and opinion leaders such as the Norwegian Minister of Finance (Madsen 2011, 2012).

4.3. Implementation

The survey data (Table 7) show that management was most commonly involved in the adoption and implementation process. The important role of management is to be expected since the BSC is usually presented as a “top-down” management concept. Several interviewees stressed the importance of the BSC being anchored at the managerial level. However, a large number also mentioned that they had a designated “BSC team” in charge of the implementation process. The frequent use of a “BSC team” is not unexpected since having organizational members championing the concept is a typical success factor in BSC implementation projects (Madsen and Stenheim 2014a).
As pointed out earlier, the BSC concept typically has to be adapted and customized when it is to be used in public sector organizations such as municipalities. Therefore, we asked the respondents about what types of perspectives they used in their BSCs. Table 8 shows that the most important perspectives were (in order of importance): (1) the user perspective, (2) the financial perspective, (3) the employee perspective and (4) the community perspective. The respondents who indicated that they were using other perspectives wrote that they use perspectives related to resource utilization, community development, service delivery, local community and inhabitants.
Even though there is considerable variation in terms of the types of perspectives mentioned by the respondents, we deem it to be likely that some of the perspectives refer to roughly the same things (e.g., local community and community, or inhabitants and users). Hence, it is possible that these variations reflect mostly local linguistic translations. In related research on the BSC in Norway, it has been shown that users often make linguistic adaptations of different elements of the BSC, e.g., when it comes to the labelling of perspectives (Madsen and Slåtten 2015).

4.4. Summary

In the first part of this section, we examined overall patterns concerning the diffusion and implementation of the BSC in the Norwegian municipality sector. The data show that nearly all of the respondents are aware of the concept. Furthermore, the respondents have encountered the concept via different channels and actors, with conferences/seminars and books/articles being mentioned most frequently. While the number of new adopters peaked in 2003, there were also a considerable number of new adopters in 2009/2010. Approximately a third of the respondents are current users of the BSC, while approximately 11% report that they are currently implementing or planning to implement the concept. Almost half of the respondents (47%) have not implemented the concept, while approximately 6% have stopped using the BSC.
In the last part, in more detail, we examined how the BSC is implemented in Norwegian municipalities. The data show that it is mainly managerial actors who have been involved in the implementation of the BSC in most of the municipalities, but a considerable number of respondents also report that they have used designated “BSC teams” in the implementation process. When it comes to the types of BSCs used, the most commonly used perspectives in the BSCs were (1) the user perspective, (2) the financial perspective, (3) the employee perspective, and (4) the community perspective.

5. Perceptions and Experiences Associated with Adopting and Implementing the BSC

In the following, we shift to a more in-depth analysis of five categories of respondents identified in the survey, focusing on exploring their perceptions and experiences with adopting and implementing the concept in their respective municipality. We have grouped the respondents in five categories: (1) “non-adopters,” (2) “planners,” (3) “implementers,” (4) “users,” and (5) “ex-users”.

5.1. Non-Adopters

The first category (“non-adopters”) consists of the municipalities which have never adopted and implemented the BSC (N = 49). In this section, we attempt to identify (1) their reasons for not adopting the concept, (2) their use of alternative management concepts (if any), and (3) their general views on the usefulness of the BSC in municipalities.
While this group of respondents are non-adopters, we still asked them about whether or not they have previously considered adopting and implementing the BSC (Table 9). The data show that approximately 25% have not considered the BSC, while approximately 30% have made a decision against adopting the concept. Approximately 16% indicated that they are currently in a process where they evaluate different management concepts, which means that this could potentially lead to BSC adoption in the future. Almost 30% of the respondents answered that they have chosen to import different elements of the BSC without adopting the concept as a whole.
The respondents who answered that they had imported different elements of the BSC were asked another question about what types of BSC elements that they use. As Table 10 shows, “Key Performance Indicators” (KPIs) is the most frequently used element. Moreover, several respondents report that they utilize the basic thinking or philosophy of the BSC, but without self-identifying as BSC adopters.
Since the municipalities in this category had not adopted and implemented the BSC, we wanted to explore in greater detail their reasons for non-adoption. As Table 11 shows, the most common reasons for not adopting the BSC were that that the concept is viewed as (1) too time consuming, (2) little actual usage, (3) not enough knowledge, and (4) too costly and resource intensive.
We also wanted to explore how the non-adopters perceived the BSC concept. The respondents generally have a relatively neutral stance toward the concept in terms of its relevance for municipalities (mean = 3.98) and its usefulness as strategic tool in the municipality sector (mean = 4.02).
However, even among the non-adopters, there were some respondents who had a very favorable view of the BSC. For example, two of the non-adopters mentioned in follow-up interviews that their liking of the concept was in large part shaped by experiences from working with the concept in other organizations:
“I have used BSC a lot, a whole lot, and have fantastic experiences with it from previous positions. So I am extremely positive towards BSC if used in the right way… It is hard to explain my enthusiasm”
“I have previously worked for eight years for Oslo Municipality, so I have very positive experiences from working with the concept”

5.2. Planners

This category (“planners”) consists of the respondents who indicated that they were planning to adopt and implement the BSC in the near future (N = 5). In this subsection, we explore in more depth the reasons why they are planning to adopt and implement the BSC.
Since the respondents in this category are planning to adopt and implement the BSC at some time in the near future, we asked them about when they planned to adopt the BSC. One respondent declined to answer, but the remaining four respondents answered within the current calendar year (one respondent) or within the next calendar year (three respondents).
We also wanted to explore why these municipalities are planning to adopt the BSC. Table 12 shows that the respondents generally agree with most of the statements regarding the BSC. The mean value is greater than five for nearly all of the statements, and the only statement which has a mean value of less than four is the one concerning knowledge about the BSC concept. However, it is to be expected that respondents who are in the planning stage do not perceive themselves to have a high level of knowledge about the BSC.
The top three reasons for planned adoption are that the BSC is perceived as being useful as (1) a strategic tool, (2) a reporting and measurement tool, and (3) a holistic management system. In general, the “planners” have a favorable view of the BSC as well as relatively high expectations with respect to the potential performance enhancing effects of the concept. That respondents from this category are optimistic about the potential effects of the BSC is not surprising since prospective users are unlikely to consider and plan to adopting a new management concept unless they perceive considerable potential benefits (Benders 1999).

5.3. Implementers

In this category (“implementers”), we find the municipalities that are currently in the process of implementing the BSC (N = 8). Our focus in this subsection is on exploring why these municipalities have chosen to implement the BSC. For example, we examine how long it took before the municipalities had a well-functioning and satisfactory BSC system in place. Furthermore, we also examine the municipalities’ expectations of the concept, as well as the various challenges they have encountered in the implementation phase.
We asked the “implementers” about when they made the decision to adopt and implement the BSC. In response to this question, one respondent answered that the decision was made as far back as 2009, while the rest answered 2010 (two respondents), 2012 (two respondents), and 2013 (three respondents). Of these respondents, five reported that management made the decision to adopt the BSC, one answered that the decision was made at the county level, while the remaining two respondents did not know or did not remember. When it comes to who has been most involved in the implementation process, six respondents answered management, while the remaining two answered that there was a designated “BSC team” in the municipality.
The respondents were also asked about the reasons for the adoption and implementation of the BSC. The data in Table 13 show that the following aspects of the BSC appear to be particularly influential in the decision to adopt and implement the concept: (1) goal attainment, (2) goal congruence, (3) linking financial and non-financial results, (4) stimulating improvements, and (5) common management system. The mean was >6.00 for all of these statements.
Again, we see that knowledge about the BSC in the municipality is not considered an important reason for BSC adoption (mean = 3.38). However, since the municipalities in this category are still in the process of implementing the BSC, the low level of knowledge is not very surprising. However, adopting a new management concept which the organizational members knows little about could potentially lead to potential implementation problems at a later point in time.
Since the respondents in this category were in the process of implementing the BSC, we wanted to explore their expectations with respect to how long it would take to get the BSC “up and running” at a satisfactory level. Table 14 shows that most of the respondents expect that it will take between one and four years to reach a satisfactory level of implementation. One respondent does not know.
Table 15 shows that there are no large differences between experienced challenges and expected future challenges with respect to BSC implementation. The most obvious difference is related to “little knowledge about the BSC”, where fewer municipalities are expecting lacking knowledge in the future. The reason why they might not perceive lack of knowledge to be a future problem could be that they assume that knowledge about the BSC will increase over time as they become familiar with the concept. It is also interesting to note that several respondents expect to continue to have issues related to development and use of KPIs (“limiting the number of KPIs” and “selecting the right KPIs”). However, such KPI-related issues are fairly common in BSC implementation projects (Madsen and Stenheim 2014b).

5.4. Current Users and Ex-Users

In this subsection, we look at the two categories “users” and “ex-users” together (N = 43), since these two categories contain both the municipalities that have adopted and implemented the BSC (N = 36) as well as those that at one point used the BSC but since then have stopped using the concept (N = 7). We examine reasons for adoption as well as implementation challenges.
The respondents were asked about their reasons for BSC adoption. Table 16 shows that the most commonly reported reasons were related to the BSC concept’s measurement and reporting properties. There are four aspects of the BSC that appear to be particularly important in influencing adoption: (1) the BSC helps with looking at relationships between goals, initiatives and results, (2) the BSC is a common management system that provides feedback, (3) the BSC is a strategic tool, and (4) the BSC is a reporting and measurement tool. All of these reasons were marked by more than 70% of the respondents.
The respondents were asked to evaluate how the implementation process unfolded. Table 17 shows that more than half of the respondents had experienced problems during the implementation process, while approximately a third reported no problems. A smaller number of respondents were not able to provide an answer to this question since they were not present during the implementation phase.
We also asked the respondents about what they perceive to be the challenges related to the implementation of the BSC in their organizations. As Table 18 shows, the most common challenges are related to the choice and selection of KPIs, a lack of knowledge, and that much time and resources are consumed in the implementation process. Furthermore, some report challenges related to culture as well as resistance from employees and managers.
In this subsection, we have looked at two categories of respondents (current users and ex-users) together. In the following, we will examine each of these two categories separately. The data show that approximately 14% of the respondents who report that they have adopted the BSC have since then abandoned the concept. This means that most are still currently using the concept.

5.5. Current Users

This subsection examines the category of respondents who reported that they are currently using the BSC (N = 36). We explore how long the current users have been using the BSC, their level of satisfaction with the concept, the adaptations they have made to the concept, as well as their perceptions about the concept’s effects and success rate.
First, we examine how long the current users of the BSC have been using the BSC. As can be seen from Table 19, 11 respondents report that they have used the BSC for more than 10 years. One respondent reports having used the BSC for more than 15 years, while 10 respondents answer that they have used the BSC between 10 and 15 years. Only three of the respondents answer that they have used the BSC for two years or less. This indicates that there are not that many recent adopters among the current users.
Table 20 shows how long it took before the municipalities became satisfied with their current “BSC system.” The data show that approximately 30% of the respondents report that it took three to four years before they become satisfied. Moreover, almost 40% report that they are still not satisfied. However, it is difficult to know whether this indicates a very high aspiration level (i.e., “perfectionism”), or a more serious failure in meeting more modest expectations (which could lead to disillusionment).
The respondents were also asked whether they have adapted and customized the BSC concept. Almost all of the respondents (97%) answer that they have adapted the BSC to their organization’s special needs and circumstances. In the follow-up interviews, it was commonly mentioned that the BSC concept is adapted in various ways (e.g., “more focus on risk management,” “greater emphasis on interaction with inhabitants and the local community,” “ethics as a separate perspective after a corruption scandal”).
Table 21 provides some illustrative quotes about the adaptation and customization of the BSC. For example, there is considerable variation in terms of how “faithful” the users are to Kaplan and Norton’s theory. For example, some municipalities are very pragmatic in their use and application of the concept whereas others are “by the book.” Moreover, some make local conceptual and linguistic translations of the BSC concept, for instance in their labelling of the perspectives they use in their BSC model (Madsen and Slåtten 2015).
Next, we explore the experiences of the current users of the BSC. For example, we examine the extent to which they perceive the BSC to be a user-friendly concept. The data in Table 22 suggest that the respondents, on average, perceive the BSC to be a moderately user-friendly concept. For example, the statement “the information I get from BSC is simple and easy to understand” has the highest mean value (mean = 5.00). In addition, the statement about the usefulness of the BSC for carrying out tasks receives a moderate level of agreement. In the interviews, some respondents would mention that the concept is useful in terms of “saving much time and effort” and that it “reduces the amount of work”.
We also wanted to explore the effects of implementating the BSC on decision making as well as performance evaluation processes. First, we explore whether the BSC helps respondents make decisions (Table 23). When it comes to effects on decision-making processes, the survey data suggest that the BSC concept may be moderately helpful in terms of improving decision making (mean = 4.45) and for explaning decisions (mean = 4.27).
With respect to effects on performance evaluation processes, the data in Table 24 show that the respondents generally agree with the statements. In particular, respondents agree quite strongly with the statement that the BSC makes it possible for them to compare results over time (mean = 5.83), and that is a better way of measuring performance than traditional performance measurement (mean = 5.03).
We also wanted to explore how the municipalities have evaluated the results of BSC implementation. Table 25 shows that approximately 92% of respondents have positive experiences from the implementation of the BSC. Of these, approximately half perceive the BSC to be a complicated system. Only approximately 8% found the BSC to be of no use.
Related to experiences from using the BSC, we wanted to explore the current users’ satisfaction with the BSC vis-a-vis previous practices. Overall, the data suggest that respondents perceive the BSC to be a net improvement over previous practices (mean = 5.25). This moderately high level of satisfaction can be interpreted as an indication that most respondents are relatively likely to continue using the BSC, at least in the short term. We also asked the respondents about how they perceive the success and usefulness of the BSC. When asked about whether they have succeeded in implementing the BSC, the respondents are relatively neutral (mean = 4.50). However, when it comes to how they perceive the usefulness of the BSC, the respondents are slightly more positive (mean = 4.97).

5.6. Ex-Users

This final category (“non-users”) contains the municipalities which have stopped using the BSC (N = 7). In this subsection, we attempt to determine how long they used the BSC before it was abandoned, the reasons why they stopped using the BSC, whether BSC concept was adapted and customized, as well as their experiences associated with using the BSC.
The survey data show that the duration of use varies considerably (Table 26). Only one of the respondents reported that they used the BSC only for a very short period of time (less than a year), and most used the BSC for several years before ultimately abandoning it. One respondent reported that they used the BSC between 10 and 15 years before ultimately abandoning the concept.
Following up on the question related to abandonment, the respondents were asked about the reasons for why the BSC was discarded. As Table 27 shows, the top three reasons were related to: (1) the concept was not used in practice, (2) problems with respect to the identification of useful KPIs, and (3) resource-intensiveness.
As in our analysis of the previous category (“current users”), we wanted to examine whether the BSC was adapted to the ex-users’ unique needs and circumstances. Approximately 40% of the municipalities answered “no” to this question. It is possible that the lack of adaptation of the BSC concept could be a reason why some of the respondents did not perceive a sufficiently high degree of success and therefore stopped using the concept.
This finding of relatively low levels of adaptations of the BSC can be seen in light of research on the performance effects of BSC implementation. Research indicates that organizations that do not customize and “match” the BSC with their specific organizational circumstances (e.g., strategy) tend to be less successful in their BSC implementations, e.g., in terms of realized performance improvements (Braam and Nijssen 2004; Davis and Albright 2004). Our data lend some support to this view. Most of the municipalities in this category who reported a high level of satisfaction with the BSC had done the work themselves without relying much on external help.
The ex-users were asked to consider a number of statements concerning their experiences with the BSC. The mean values in Table 28 show that the respondents generally tend to disagree with the statements. This finding is not surprising since these respondents represent municipalities that have stopped using the concept. All of the mean values are less than four and many are even less than three. For example, respondents tend to strongly disagree with the statement that “using the BSC was easy” (mean = 2.57) and that “the BSC made my job easier” (mean = 2.57). However, it should be noted that the standard deviation is relatively high, which indicates that there is considerable variation in the responses.
The respondents were asked about whether they perceived that the municipality had been successful in terms of implementing the BSC, as well as whether they had been able to use resources more efficiently as a result of BSC implementation. Table 29 shows that the respondents generally did not perceive the BSC to be a success, nor that they were able to utilize resources in a more efficient way as a result of BSC implementation.
Again, these low values are to be expected in this category since the municipalities are ex-users. It is conceivable that these municipalities would have continued using the BSC if they had perceived a greater degree of success, or if they had been able to utilize resources better. To this point, one interviewee commented that: “No, I only saw negative consequences of it, that’s how I experienced it. It was also in the end terminated by the top managers. If it had been successful, we would not have abandoned it.”.
Finally, we asked the respondents about how they evaluated the results of implementing the BSC. The results show that implementation experiences are mixed. Three of the respondents answered that the BSC system was complicated and not useful. The same number of respondents answered that the system was complicated but that the results were positive. One respondent answered that even though the system was not complicated, it did not provide any utility compared to the previous system.

6. Discussion

In this section, we transition from a descriptive analysis of the different categories of respondents to a discussion of the results in the context of existing research on the BSC in municipalities. We also try to contextualize the findings in light of the broader literature on the diffusion and implementation of innovative management concepts and ideas.
The section is divided into three parts, each focusing on a specific theme relevant to the empirical material: (1) diffusion, (2) implementation, and (3) effects.

6.1. Diffusion

The first theme concerns the diffusion of the BSC. Overall, the survey data suggest that an important motive driving BSC adoption by municipalities is that it was seen as an effective management concept that would provide a more holistic overview of performance and a better governance model. This suggests that what Abrahamson (1991) calls “efficient choice” has been an influential motive driving adoption behavior.
At the same time, other parts of the survey data suggest that most municipalities have encountered the BSC concept through channels such as conferences/seminars, books/articles and consulting firms. This suggests that social and institutional pressures, or what Abrahamson’s (1991) labels “fad” and “fashion” motives, have also been influential in the adoption and diffusion of the BSC in Norwegian municipalities. Previous research conducted in Norway also lend some support to the role of these types of social/institutional pressures, as there was as a strong “hype” in relation to the BSC in Norway during the early 2000s, with much of the activity focusing on public sector adoption and application (Madsen 2011). As our survey data indicate, many municipalities adopted the BSC during this time, and the number of new adopters peaked in 2003.
The findings also have some implications for debates about the lifecycle of management fashions (Abrahamson 1996; Carson et al. 2000). The adoption and diffusion pattern of the BSC in the Norwegian municipality sector lends some support to the view that the BSC is not a typical transient management fashion (cf. Braam et al. 2007). The lifecycle curve of the BSC, particularly in the Norwegian municipality sector, appears to be considerably more drawn-out. In fact, the data show that several of the adopters are still using the concept more than 10 years after it was first adopted. This suggests that the concept has become entrenched and taken root within the municipalities.
Our findings also suggest that the usage level is quite stable over time. Even though there appears to be a small decrease in the level of usage of BSC in Norway, there is not enough evidence to conclude that the concept is a clear downturn phase. In contrast, in Sweden, Funck and Larsson (2014) observed that there has been a decrease in the number of municipalities using BSC, and therefore speculate about whether the BSC will be replaced by a new management fashion.
The diverging diffusion trajectories of the BSC in the municipality sectors of the Scandinavian countries lend support to the view that the lifecycles of fashionable concepts are highly context specific, meaning that a concept’s evolution and trajectory differs across national contexts (Benders and Van Bijsterveld 2000; Madsen and Slåtten 2013). In this case, it appears that the BSC has had relatively more staying power in the Norwegian municipality sector than in Sweden and Denmark.
The relatively institutionalized nature of the BSC in the Norwegian municipality sector can, at least to some extent, be attributed to the “institutional work” (Perkmann and Spicer 2008) carried out by government-affiliated actors, for instance in terms of disseminating knowledge about the concept and promoting adoption and implementation (Madsen 2011; Madsen and Slåtten 2015). In Denmark, where the BSC has not had the same level of adoption and diffusion in the municipality sector, government-affiliated actors have been relatively more passive in relation to the concept and instead promoted other concepts related to quality and excellence (Nielsen and Nielsen 2009). Therefore, in our view, this suggests that institutional work may have played a role in the institutionalization of the “BSC fashion” in the Norwegian municipality sector.

6.2. Implementation

The second theme pertains to the implementation of the BSC concept. Overall, our findings have some implications for research on how the BSC is implemented in practice in municipalities.
The data generally show that the BSC is mostly used by municipalities as a measurement and reporting tool. It appears that Norwegian municipalities primarily perceive the BSC to be useful as a measurement and reporting tool, in that it offers a broader and more holistic view of performance, both internally and externally. The users of BSCs were mostly concerned with the identification and selection of useful KPIs, which is not surprising given their perception and interpretation of the BSC as primarily a measurement and reporting tool. Hence, the findings are mostly in line with those of previous studies carried out in other countries (e.g., Griffiths 2003; Northcott and Taulapapa 2012).
While some see the BSC as a strategic tool, the data indicate municipalities rarely use the more advanced and ambitious parts of the BSC such as causal relationships and strategy maps. Why are Norwegian municipalities implementing the BSC in this way? The data in this study suggest that there is limited knowledge about newer parts of the “BSC theory,” for instance related to areas such as the development and establishment of causality and strategy maps.
The follow-up interviews generally revealed that respondents had a low level of understanding and had not reflected much about how different perspectives and measures were related, instead preferring to use the BSC as a simpler measurement and reporting tool. However, this type of relatively basic BSC use is not confined to the municipality sector, and challenges associated with using the newer and more advanced parts of the BSC are quite common in the private sector as well (Madsen and Stenheim 2014b). Similarly, in their study carried out in Sweden, Funck and Larsson (2014) found that Swedish municipalities had trouble with causal relationships in their BSCs.
As a whole, the data about the implementation of the BSC in Norwegian municipalities suggest that most use what can be characterized as a “Type I BSC” (Speckbacher et al. 2003), where the focus is on performance measurement. The same pattern can be seen in the Norwegian private sector, where organizations tend to use the BSC primarily for performance measurement purposes (Madsen 2011, 2012).

6.3. Effects

The last theme concerns the effects of BSC adoption and implementation. The data show that the experiences differ between different categories of respondents. Not surprisingly, prospective users and current users of the BSC generally have positive perceptions and/or experiences, while the ex-users are more negative. However, the data show that it generally takes several years before the users become satisfied with the BSC, and some are still not satisfied even several years after adoption and implementation. Moreover, the responses from the ex-users show that some were never able to realize the potential benefits of the BSC. It is unclear what the reasons may be but if users are not able to reach a high level of satisfaction, this could lead to disillusionment, which, over time, could result in a negative view of the BSC concept (Benders and Van Veen 2001).

7. Conclusions

7.1. Contributions

This article provides new insight into the diffusion and implementation of the BSC in municipalities, an area of the public sector which Northcott and Taulapapa (2012, p. 169) note has been relatively underexplored in the extant BSC literature. We argue that the findings of the study have implications at theoretical, methodological, and practical levels.
Theoretically, the article contributes to the literature on the adoption and diffusion of the BSC in the municipality sector. Our study provides an updated picture of BSC use in the Norwegian municipality sector, which, with the exception of some dispersed studies, is not well documented elsewhere. Moreover, the finding that the BSC appears to have more staying power in the Norway than in Sweden and Denmark provides some support for the view that fashionable management concepts such as the BSC may have distinct country- and sector-specific trajectories (Benders and Van Bijsterveld 2000; Madsen and Slåtten 2013).
At the methodological level, the article has implications for the debate about how to research management concepts and ideas. Researching the diffusion and implementation of management concepts such as the BSC is certainly not easy, and presents researchers with a number of difficult choices with respect to methods (Strang and Wittrock 2019). In this paper, we have utilized a hybrid approach combining a dynamic questionnaire and qualitative follow-up phone interviews. While certainly not perfect, a hybrid approach could be a good way to research the diffusion and implementation of management concepts such as the BSC. For example, a dynamic questionnaire allows researchers to group respondents in different categories and carry out more fine-grained analyses of adoption and implementation, and compare and contrast the use and application of a concept across different categories of respondents.
At the practical level, the results have implications for managers working in Norwegian municipalities and who are currently using or considering adopting and implementing the BSC. Our study provides new insights into how Norwegian municipalities implement the BSC, and what they consider to be the main challenges associated with the use and application of the concept. An interesting finding is that municipalities mostly use the BSC as a measurement and reporting tool, or close to what is referred to as a “Type I” BSC in the research literature (Speckbacher et al. 2003). Moreover, the municipalities report limited knowledge and understanding of some parts of the concept, and challenges related to, for instance, establishing causal relationships between measures and perspectives. This suggests that there is an untapped potential to utilize more ambitious versions of the BSC in municipalities. Since researchers point out that strategy maps are important in order to derive utility from BSC use (Lucianetti 2010; Lueg 2015), it is important to increase the level of knowledge and understanding among municipal managers.

7.2. Limitations

The research reported in this paper should be considered explorative and preliminary. Therefore, there are some limitations which should be considered carefully when interpreting and evaluating the findings.
First, the survey is cross-sectional in nature, which means that it only provides a snapshot of the diffusion and implementation of the BSC at a single point in time. Moreover, the survey data were collected in 2014, which means that the responses could have been affected by various external economic and social conditions present at the time.
A second limitation is related to the use of a single respondent from each municipality. This admittedly weakens the results. Since we were only able to capture this one individuals’ views and perspectives on the BSC, we are in a sense letting this person speak on behalf of the organization. It is arguably difficult to know the extent to which this individual’s views and perceptions are shared by the rest of the organization. Therefore, there is a risk that this respondent provided a biased picture of how the BSC is used and applied in the organization.
Third, the response rate is relatively low, which means that there is a serious risk that non-response bias could threaten the validity and generalizability of the results.

7.3. Future Research

Considering the current study’s limitations, there are several ways researchers could extend this research in future work.
First, this study has shown that the BSC is still widely used in Norwegian municipalities, and the concept does not seem to have reached a clear decline phase. In future research, it would be useful to carry out replications of this survey to track developments and evolution in the diffusion and implementation pattern of the BSC. This could shed light on whether the BSC concept still has staying power, or whether it will soon suffer the fate of typical “boom and bust” management fashions and be replaced by the next public sector management trend, which according to Funck and Larsson (2014) is already happening in Sweden.
Second, this paper has also revealed an implementation pattern in Norwegian municipalities in which the BSC is primarily used for measurement and reporting purposes. In other words, the implementation pattern resembles what in the literature is referred to as “Type I” (Speckbacher et al. 2003) or “First Generation” (Lawrie and Cobbold 2004) usage. While using “Type I” BSCs is common in the Norwegian private sector as well (Madsen 2011), we know little about how the usage of “Type I” BSCs differs between the public and private sectors. An idea for future research would be to attempt to develop a typology of BSC use in the municipality sector. For example, researchers could take, as a point of departure, the various typologies of BSC use currently found in the literature (Brudan 2005; Lawrie and Cobbold 2004; Perkins et al. 2014; Soderberg et al. 2011; Speckbacher et al. 2003).
Third, other qualitative and longitudinal approaches could shed more light on how the BSC concept is interpreted, implemented and translated in municipalities. Such research could provide more insight into the types of BSCs which are needed in municipalities. For example, researchers could undertake interventionist research using approaches such as action research (Grønhaug and Olson 1999) and take an active role in trying to improve BSC practices in municipalities.
Finally, our results indicate that finding good performance measures is a key success factor. Using a field study approach, researchers could possibly investigate in detail the process of identifying and selecting measures, and explore how different organizational members and other stakeholders influence this process. Several organizational theories could guide such investigations. For example, it would be possible to utilize organizational theories such as different perspectives on the “translation” of management concepts (Wæraas and Nielsen 2016) or the “virus” theory (Røvik 2011) to shed light on how concepts such as the BSC are diffused and implemented in municipalities.

Author Contributions

Conceptualization, B.A., A.R.; Data curation, B.A. and A.R.; Formal analysis, B.A., A.R., D.Ø.M. and T.S.; Resources, D.Ø.M. and T.S.; Supervision, D.Ø.M.; Writing—original draft, D.Ø.M. and T.S.; Writing—revision and editing, D.Ø.M. and T.S.

Funding

This research received no external funding. The APC was funded by the University of South-Eastern Norway’s Open Access Publication Fund.

Conflicts of Interest

The authors declare no conflict of interest.

References

  1. Abdel-Kader, Magdy, Souad Moufty, and Erkki K. Laitinen. 2011. Balanced Scorecard Development: A Review of Literature and Directions for Furture Research. In Review of Management Accounting Research. Edited by M. G. Abdel-Kader. Hampshire: Palgrave Macmillan, p. 214. [Google Scholar]
  2. Abrahamson, Eric. 1991. Managerial fads and fashions: The diffusion and rejection of innovations. Academy of Management Review 16: 586–612. [Google Scholar] [CrossRef]
  3. Abrahamson, Eric. 1996. Management Fashion. Academy of Management Review 21: 254–85. [Google Scholar] [CrossRef]
  4. Andersson, Jenny, and Petra Ericsson. 2002. Diffusion av balanserat styrkort i offfentlig sektor-en studie av adopterande og icke-adopterande kommuner. Master’s thesis, University of Gothenburg, Gothenburg, Sweden. [Google Scholar]
  5. Banchieri, Lucia Clara, Fernando Campa Planas, and Maria Victoria Sanchez Rebull. 2011. What has been said, and what remains to be said, about the balanced scorecard? Proceedings of Rijeka Faculty of Economics—Journal of Economics and Business 29: 155–92. Available online: https://papers.ssrn.com/sol3/papers.cfm?abstract_id=2266338 (accessed on 10 January 2018).
  6. Benders, Jos. 1999. Tricks and Trucks? A Case Study of Organization Concepts at Work. International Journal of Human Resource Management 10: 624–37. [Google Scholar] [CrossRef]
  7. Benders, Jos, and Mark Van Bijsterveld. 2000. Leaning on lean: The reception of management fashion in Germany. New Technology, Work and Employment 15: 50–64. [Google Scholar] [CrossRef]
  8. Benders, Jos, and Kees Van Veen. 2001. What’s in a fashion? Interpretive viability and management fashions. Organization 8: 33–53. [Google Scholar] [CrossRef]
  9. Bianchi, Carmine, and Giovan Battista Montemaggiore. 2008. Enhancing strategy design and planning in public utilities through “dynamic” balanced scorecards: Insights from a project in a city water company. System Dynamics Review 24: 175–213. [Google Scholar] [CrossRef]
  10. Braam, Geert, and Edwin Nijssen. 2004. Performance effects of using the Balanced Scorecard: A note on the Dutch experience. Long Range Planning 37: 335–49. [Google Scholar] [CrossRef]
  11. Braam, G., Jos Benders, and Stefan Heusinkveld. 2007. The balanced scorecard in the Netherlands: An analysis of its evolution using print-media indicators. Journal of Organizational Change Management 20: 866–79. [Google Scholar] [CrossRef]
  12. Braam, Geert. 2012. Balanced Scorecard’s Interpretative Variability and Organizational Change. In Business Dynamics in the 21st Century. Edited by C.-H. Quah and O. L. Dar. Rijeka: InTech. [Google Scholar]
  13. Brignall, Stan, and Sven Modell. 2000. An institutional perspective on performance measurement and management in the ‘new public sector’. Management Accounting Research 11: 281–306. [Google Scholar] [CrossRef]
  14. Brudan, Aurel. 2005. Balanced Scorecard typology and organisational impact. KM Online Journal of Knowledge Management 2: 1–12. [Google Scholar]
  15. Carson, Paula, Patricia Lanier, Kerry David Carson, and Brandi Guidry. 2000. Clearing a path through the management fashion jungle. Academy of Management Journal 43: 1143–58. [Google Scholar]
  16. Christensen, Tom, and Per Lægreid. 2001. New Public Management: The Transformation of Ideas and Practice. London: Ashgate Pub Limited. [Google Scholar]
  17. Cobanoglu, Cihan, Bill Warde, and Patrick J. Moreo. 2001. A comparison of mail, fax and web-based survey methods. International Journal of Market Research 43: 441. [Google Scholar] [CrossRef]
  18. Cook, Colleen, Fred Heath, and Russel L. Thompson. 2000. A meta-analysis of response rates in web-or internet-based surveys. Educational and Psychological Measurement 60: 821–36. [Google Scholar] [CrossRef]
  19. Daleq, Basil, and Mats Anneus Hobbel. 2015. Spredningen av balansert målstyring i norske kommuner. Master’s thesis, Sør-Trøndelag University College, Trondheim, Norway. [Google Scholar]
  20. Davis, Stan, and Tom Albright. 2004. An investigation of the effect of Balanced Scorecard implementation on financial performance. Management Accounting Research 15: 135–53. [Google Scholar] [CrossRef]
  21. Ericsson, Björn, and Anders Gripne. 2004. Att införa Balanced Scorecard i kommunal verksamhet. Stockholm: Kommentus Förlag. [Google Scholar]
  22. Esping-Andersen, Gøsta. 1990. The Three Worlds of Welfare Capitalism. Cambridge: Polity Press, vol. 6. [Google Scholar]
  23. Fallan, Even, Tor-Eirik Olsen, Basil Daleq, and Mats Anneus Hobbel. 2015. Bruk av balansert målstyring i norske kommuner. Magma 18: 62–75. Available online: https://www.magma.no/bruk-av-balansert-malstyring-i-norske-kommuner (accessed on 17 March 2018).
  24. Farneti, Federica, and James Guthrie. 2008. Italian and Australian local governments: Balanced scorecard practices. A research note. Journal of Human Resource Costing & Accounting 12: 4–13. [Google Scholar]
  25. Frigo, Mark L. 2012. The balanced scorecard: 20 years and counting. Strategic Finance 94: 49–53. [Google Scholar]
  26. Funck, Elin K., and Rolf G. Larsson. 2014. The Rise and Fall of the Balanced Scorecard in Municipalities and County Councils in Sweden. Working Paper 2014:1. Växjö, Sweden: Centre for Management Accounting Research (CMAR). [Google Scholar]
  27. Ghauri, Pervez, and Kjell Grønhaug. 2002. Research Methods in Business Studies, 2nd ed. Harlow: Prentice Hall Europe, Pearson Education Limited. [Google Scholar]
  28. Greatbanks, Richard, and David Tapp. 2007. The impact of balanced scorecards in a public sector environment—Empirical evidence from Dunedin City Council, New Zealand. International Journal of Operations & Production Management 27: 846–73. [Google Scholar] [CrossRef]
  29. Green-pedersen, Christoffer. 2002. New Public Management Reforms of the Danish and Swedish Welfare States: The Role of Different Social Democratic Responses. Governance 15: 271–94. [Google Scholar] [CrossRef]
  30. Griffiths, John. 2003. Balanced scorecard use in New Zealand government departments and crown entities. Australian Journal of Public Administration 62: 70–79. [Google Scholar] [CrossRef]
  31. Grønhaug, Kjell, and Olov Olson. 1999. Action research and knowledge creation: Merits and challenges. Qualitative Market Research: An International Journal 2: 6–14. [Google Scholar] [CrossRef]
  32. Hagedorn-Rasmussen, Peter, and Pål Klethagen. 2018. International management concepts meeting Nordic working life. In Work and Wellbeing in the Nordic Countries: Critical Perspectives on the World’s Best Working Lives. Edited by Helge Hvid and Eivind Falkum. New York: Routledge. [Google Scholar]
  33. Hellström, Mikael, Peter Jönsson, and Ulf Ramberg. 2012. A Swedish Solution to Pervasive Problems–Implementation of Balanced Scorecard? Working Paper. Lund, Sweden: Institute of Economic Research, Lund University. [Google Scholar]
  34. Hood, Christopher. 1995. The “New Public Management” in the 1980s: Variations on a theme. Accounting, Organizations and Society 20: 93–109. [Google Scholar] [CrossRef]
  35. Hoque, Zahirul. 2012. 20th Anniversary of the balanced scorecard. Journal of Accounting & Organizational Change 8. [Google Scholar] [CrossRef]
  36. Hoque, Zahirul. 2014. 20 years of studies on the Balanced Scorecard: Trends, accomplishments, gaps and opportunities for future research. The British Accounting Review 46: 33–59. [Google Scholar] [CrossRef]
  37. Hovik, Sissel, and Inger Marie Stigen. 2004. Kommunal Organisering 2004. Available online: https://www.regjeringen.no/contentassets/6ac839eba291440a8845b7f5c22b8049/2004.pdf (accessed on 20 November 2018).
  38. Hovik, Sissel, and Inger Marie Stigen. 2008. Kommunal organisering 2008: Redegjørelse for kommunal-og regionaldepartementets organisasjonsdatabase. Norsk institutt for by-og regionforskning. Available online: https://evalueringsportalen.no/evaluering/kommunal-organisering-2008-redegjorelse-for-kommunal-og-regionaldepartementets-organisasjonsdatabase/kommunal_organisering_nibr.pdf/@@inline (accessed on 21 November 2018).
  39. Hyndman, Noel, and Irvine Lapsley. 2016. New Public Management: The Story Continues. Financial Accountability & Management 32: 385–408. [Google Scholar]
  40. Jackson, Audrey, and Irvine Lapsley. 2003. The diffusion of accounting practices in the new “managerial” public sector. International Journal of Public Sector Management 16: 359–72. [Google Scholar] [CrossRef]
  41. Jansen, Karen J., Kevin G. Corley, and Bernard J. Jansen. 2007. E-survey methodology. In Handbook of research on electronic surveys and measurements. Edited by Rodney A. Reynolds and Robert Woods. Hershey: Idea Group Reference, pp. 416–25. [Google Scholar]
  42. Johnsen, Åge. 2001. Balanced scorecard: Theoretical perspectives and public management implications. Managerial Auditing Journal 16: 319–30. [Google Scholar] [CrossRef]
  43. Johnson, R. Burke, Anthony J. Onwuegbuzie, and Lisa A. Turner. 2007. Toward a definition of mixed methods research. Journal of Mixed Methods Research 1: 112–33. [Google Scholar] [CrossRef]
  44. Jønsrud, Ruth Høyland. 2007. Balansert målstyring i Bærum kommune: Prosess og effekter. Master’s thesis, University of Oslo, Oslo, Norway. [Google Scholar]
  45. Kaplan, Robert S., and David P. Norton. 1992. The balanced scorecard—Measures that drive performance. Harvard Business Review 70: 71–79. [Google Scholar]
  46. Kaplan, Robert S., and David P. Norton. 1999. The balanced scorecard for public-sector organizations. Balanced Scorecard Report 15: 1999. [Google Scholar]
  47. Kaplan, Robert S. 2000. Overcoming the Barriers to Balanced Scorecard Use in the Public Sector. Balanced Scorecard Report. Boston: Harvard Business School Publishing. [Google Scholar]
  48. Kasperskaya, Yulia. 2008. Implementing the Balanced Scorecard: A comparative study of two Spanish city councils—An institutional perspective. Financial Accountability & Management 24: 363–84. [Google Scholar] [CrossRef]
  49. Kommunal- og regionaldepartmentet. 2002. Veileder: Resulatat og dialog. Balansert målstyring (BMS) i kommunal sektor. Oslo, Norway. Available online: https://www.regjeringen.no/globalassets/upload/kilde/krd/rus/2002/0005/ddd/pdfv/148013-veileder_bms.pdf (accessed on 20 August 2018).
  50. Kommunal- og regionaldepartmentet. 2004. Resultatledelse. Bruk av balansert målstyring og andre former for systematiske resultatmålinger i kommunal sektor; Report H-2154; Oslo, Norway: Ministry of Local Government and Regional Development. Available online: https://www.regjeringen.no/no/dokumenter/publikasjonsnummer-h-2154/id88080/ (accessed on 13 January 2019).
  51. Kommunal- og regionaldepartmentet. 2007. Resultatledelse for lokalpolitikere; Report HH-2219; Oslo, Norway: Ministry of Local Government and Regional Development. Available online: https://www.regjeringen.no/no/dokumenter/resultatledelse-for-lokalpolitikere-/id494975/ (accessed on 13 January 2019).
  52. Lapsley, Irvine, and Elisa Wright. 2004. The diffusion of management accounting innovations in the public sector: A research agenda. Management Accounting Research 15: 355–74. [Google Scholar] [CrossRef]
  53. Lawrie, Gavin, and Ian Cobbold. 2004. Third-generation balanced scorecard: Evolution of an effective strategic control tool. International Journal of Productivity and Performance Management 53: 611–23. [Google Scholar] [CrossRef]
  54. Lillrank, Paul. 1995. The transfer of management innovations from Japan. Organization Studies 16: 971–86. [Google Scholar] [CrossRef]
  55. Lindvall, Jan. 1995. Det balanserade styrkortet i praktiken. Ekonomi & Styrning 5: 11–14. [Google Scholar]
  56. Lucianetti, Lorenzo. 2010. The impact of the strategy maps on balanced scorecard performance. International Journal of Business Performance Management 12: 21–36. [Google Scholar] [CrossRef]
  57. Lueg, Rainer, and Ana Luisa Carvalho e Silva. 2013. When one size does not fit all: A literature review on the modifications of the balanced scorecard. Problems and Perspectives in Management 11: 86–94. [Google Scholar]
  58. Lueg, Rainer, and Pernille Julner. 2014. How are Strategy Maps Linked to Strategic and Organizational Change? A Review of the Empirical Literature on the Balanced Scorecard. Corporate Ownership & Control 11: 439–46. [Google Scholar]
  59. Lueg, Rainer. 2015. Strategy maps: The essential link between the balanced scorecard and action. Journal of Business Strategy 36: 34–40. [Google Scholar] [CrossRef]
  60. Løvbak, Kjell Rune. 2014. Balansert målstyring i Elverum kommune.-en studie av implementering og bruk av balansert målstyring som styringsverktøy i Elverum kommune. Master’s thesis, Hedmark University College, Rena, Norway. [Google Scholar]
  61. Madsen, Dag, and Kåre Slåtten. 2013. The Role of the Management Fashion Arena in the Cross-National Diffusion of Management Concepts: The Case of the Balanced Scorecard in the Scandinavian Countries. Administrative Sciences 3: 110–42. [Google Scholar] [CrossRef]
  62. Madsen, Dag Øivind. 2011. The Impact of the Balanced Scorecard in the Scandinavian Countries: A Comparative Study of Three National Management Fashion Markets. Ph.D. thesis, Norwegian School of Economics, Department of Strategy and Management, Bergen, Norway. [Google Scholar]
  63. Madsen, Dag Øivind. 2012. The Balanced Scorecard i Norge: En studie av konseptets utviklingsforløp fra 1992 til 2011. Praktisk økonomi og Finans 28: 55–66. Available online: https://www.idunn.no/pof/2012/04/the_balanced_scorecard_i_norge_enstudie_av_konseptets_utv (accessed on 20 August 2018).
  64. Madsen, Dag Øivind, and Tonny Stenheim. 2014a. Perceived benefits of balanced scorecard implementation: Some preliminary evidence. Problems and Perspectives in Management 12: 81–90. [Google Scholar]
  65. Madsen, Dag Øivind, and Tonny Stenheim. 2014b. Perceived problems associated with the implementation of the balanced scorecard: Evidence from Scandinavia. Problems and Perspectives in Management 12: 121–31. [Google Scholar]
  66. Madsen, Dag Øivind. 2014. How do managers encounter fashionable management concepts? A study of balanced scorecard adopters in Scandinavia. International Journal of Management Concepts and Philosophy 8: 249–67. [Google Scholar] [CrossRef]
  67. Madsen, Dag Øivind, and Kåre Slåtten. 2015. The Balanced Scorecard: Fashion or Virus? Administrative Sciences 5: 90–124. [Google Scholar] [CrossRef]
  68. Madsen, Dag Øivind, and Kåre Slåtten. 2016. Balanced Scorecard i Danmark: Framvekst og utvikling. Økonomistyring & Informatik 32: 147–73. [Google Scholar]
  69. Merchant, Kenneth A., and Wim A. Van der Stede. 2012. Management Control Systems: Performance Measurement, Evaluation, and Incentives, 3rd ed. London: Prentice Hall. [Google Scholar]
  70. Mitchell, Mark, and Janina Jolley. 2012. Research Design Explained. Belmont: Cengage Learning. [Google Scholar]
  71. Møller-Pettersen, Berit S, and Atle Thorud. 2014. Balansert målstyring i kommuner: En casestudie av 12 kommuner. Master’s thesis, Oslo and Akershus University College, Oslo, Norway. Available online: https://oda-hioa.archive.knowledgearc.net/handle/10642/2155 (accessed on 10 November 2018).
  72. Nielsen, Christian, and Steen Nielsen. 2009. Implementering og anvendelse af nyere ledelsesteknologier i den kommunale sektor. Ledelse & Erhvervsøkonomi 74: 37–53. [Google Scholar]
  73. Nielsen, Steen, Preben Melander, and Morten Jacobsen. 2003. Moderne økonomistyringsværktøjer i Danmark år 2001. Økonomistyring & Informatik 18: 377–413. [Google Scholar]
  74. Nielsen, Steen, and Rene Sørensen. 2004. Motives, diffusion and utilisation of the balanced scorecard in Denmark. International Journal of Accounting, Auditing and Performance Evaluation 1: 103–24. [Google Scholar] [CrossRef]
  75. Niven, Paul R. 2011. Balanced Scorecard: Step-by-Step for Government and Nonprofit Agencies. Hoboken: John Wiley & Sons. [Google Scholar]
  76. Northcott, Deryl, and Tuivaiti Ma’amora Taulapapa. 2012. Using the balanced scorecard to manage performance in public sector organizations: Issues and challenges. International Journal of Public Sector Management 25: 166–91. [Google Scholar] [CrossRef]
  77. Olson, Olov, James Guthrie, and Christopher Humphrey. 1998. Global Warning: Debating International Developments in New Public Financial Management. Oslo: Cappelen Akademisk Forlag. [Google Scholar]
  78. Opdenakker, Raymond. 2006. Advantages and disadvantages of four interview techniques in qualitative research. Forum Qualitative Sozialforschung/Forum: Qualitative Social Research 7: 11. Available online: http://www.qualitative-research.net/index.php/fqs/article/view/175/392 (accessed on 13 January 2019).
  79. Pedersen, Tor Helge. 2009. Fra kommunale forvaltninger til “forvaltningsløse” kommuner. In En komparativ og oversettelsesteoretisk studie av organisatorisk utflating i danske og norske kommuner. Tromsø: Universitetet i Tromsø, Det samfunnsvitenskapelige fakultet, Institutt for statsvitenskap. [Google Scholar]
  80. Perkins, Mike, Anna Grey, and Helge Remmers. 2014. What do we really mean by “Balanced Scorecard?”. International Journal of Productivity and Performance Management 63: 148–69. [Google Scholar] [CrossRef]
  81. Perkmann, Markus, and Andre Spicer. 2008. How are Management Fashions Institutionalized? The Role of Institutional Work. Human Relations 61: 811–44. [Google Scholar] [CrossRef]
  82. Rigby, Darrell, and Barbara Bilodeau. 2015. Management Tools & Trends 2015. Boston: Bain & Company, Inc. [Google Scholar]
  83. Rigby, Darrell, and Barbara Bilodeau. 2018. Management Tools & Trends. Boston: Bain & Company, Inc. [Google Scholar]
  84. Rogers, E. M. 1995. Diffusion of Innovations, 4th ed. New York: The Free Press. [Google Scholar]
  85. Røvik, K. A. 2007. Trender og translasjoner–ideer som former det 21. århundrets organisasjon. Oslo: Universitetsforlaget. [Google Scholar]
  86. Røvik, K. A. 2011. From Fashion to Virus: An Alternative Theory of Organizations’ Handling of Management Ideas. Organization Studies 32: 631–53. [Google Scholar] [CrossRef]
  87. Sandalgaard, Niels, and Per Nikolai Bukh. 2008. Danske virksomheders budgetpraksis: Udbredelse og anvendelse. Aalborg: Notat, Institut for Erhvervsstudier, Aalborg Universitet. [Google Scholar]
  88. Sande, Martin, and Gabriella Wæærn. 1999. Konsten att sytra—Exempel på kommunala Balanced Scorecard. Stockholm: Svenska Kommunförbundet. [Google Scholar]
  89. Sharma, Bishnu, and David Gadenne. 2011. Balanced scorecard implementation in a local government authority: Issues and challenges. Australian Journal of Public Administration 70: 167–84. [Google Scholar] [CrossRef]
  90. Shih, Tse-Hua, and Xitao Fan. 2008. Comparing response rates from web and mail surveys: A meta-analysis. Field Methods 20: 249–71. [Google Scholar] [CrossRef]
  91. Soderberg, Marvin, Suresh Kalagnanam, Norman T. Sheehan, and Ganesh Vaidyanathan. 2011. When is a balanced scorecard a balanced scorecard? International Journal of Productivity and Performance Management 60: 688–708. [Google Scholar] [CrossRef]
  92. Speckbacher, Gerhard, Juergen Bischof, and Thomas Pfeiffer. 2003. A descriptive analysis of the implementation of balanced scorecards in German-speaking countries. Management Accounting Research, 361–88. [Google Scholar] [CrossRef]
  93. Statskonsult. 2001. Balansert Målstyring i offentlig sektor. Report 2001:23. Oslo: Statskonsult. [Google Scholar]
  94. Steen, Lene, and Elisabeth Olsen. 2007. Nytteverdi av balansert målstyring som styringssystem i offentlig sektor-Lenvik kommune. Master’s thesis, University of Tromsø, Tromsø, Norway. [Google Scholar]
  95. Strang, David, and Christian Wittrock. 2019. Methods for the Study of Management Ideas. In Oxford Handbook of Management Ideas. Edited by A. Sturdy, H. Stefan Heusinkveld, Trish Rey and D. Strang. Oxford: Oxford University Press. [Google Scholar]
  96. Sue, Valerie M., and Lois A. Ritter. 2011. Conducting Online Surveys. Thousand Oaks: Sage. [Google Scholar]
  97. Wedlin, Linda, and Kerstin Sahlin. 2017. The Imitation and Translation of Management Ideas. In The Sage Handbook of Organizational Institutionalism. Edited by Royston Greenwood, Christine Oliver, Thomas B. Lawrence and Renate E. Meyer. Thousand Oaks: SAGE, pp. 102–27. [Google Scholar]
  98. Weiss, Robert S. 1994. Learning from Strangers: The Art and Method of Qualitative Interview Studies. New York: Free Press. [Google Scholar]
  99. Wittrock, Christian. 2015. Reembedding Lean: The Japanese Cultural and Religious Context of a World Changing Management Concept. International Journal of Sociology 45: 95–111. [Google Scholar] [CrossRef]
  100. Wæraas, Arild, and Jeppe Agger Nielsen. 2016. Translation Theory ‘Translated’: Three Perspectives on Translation in Organizational Research. International Journal of Management Reviews 18: 236–70. [Google Scholar] [CrossRef]
  101. Örtenblad, Anders. 2015. Handbook of Research on Management Ideas and Panaceas: Adaptation and Context. Cheltenham: Edward Elgar Publishing. [Google Scholar]
Figure 1. Time of adoption (N = 48).
Socsci 08 00152 g001
Table 1. Different versions of the questionnaire.
VersionCategoryLength (Approx.)# of Questions
1Never used the BSC2–4 min.19
2Planning to use the BSC4–5 min.20
3The BSC is currently implemented4–6 min.27
4Currently using the BSC10 min.40
5Previously used the BSC8–10 min.37
Table 2. Size and complexity of the municipalities in the sample.
Number of EmployeesFrequencyPercentage
Below 2001210.8
200–4993531.5
500–9992522.5
1000–19991513.5
2000–39991311.7
4000–599954.5
6000–799900
8000–999921.8
Above 999932.7
Do not know10.9
Table 3. Overview of the follow-up interviews.
CategoryRespondentDurationDate
1R#1-14 min 35 s23 May 2014
1R#1-211 min 17 s23 May 2014
1R#1-36 min 37 s30 May 2014
1R#1-413 min 48 s26 May 2014
1R#1-58 min 53 s27 May 2014
1R#1-617 min 41 s20 May 2014
3R#3-115 min 22 s30 May 2014
3R#3-217 min 55 s22 May 2014
4R#4-115 min 35 s19 May 2014
4R#4-219 min 20 s20 May 2014
4R#4-319 min 27 s20 May 2014
4R#4-433 min 28 s20 May 2014
4R#4-526 min 20 s20 May 2014
4R#4-614 min 40 s24 May 2014
5R#5-18 min 48 s19 May 2014
Table 4. Contact points (N = 105).
ActorFrequencyPercentage
Consultants5754.3
Seminars and conferences9186.7
Books and articles7975.2
Educational programs4643.8
Internet3835.2
Do not remember21.9
Table 5. Perceived understanding of the BSC (N = 105).
To What Extent Do You Understand What the BSC Concept Is About?FrequencyPercentage
1 (Very low)00
200
354.5
4119.9
52926.1
62522.5
7 (Very high)3531.5
Table 6. Stage of adoption and implementation (N = 111).
Stage of AdoptionFrequencyPercentage
Never adopted and implemented the BSC4944.1
Planning to adopt and implement the BSC54.5
In the process of adopting and implementing the BSC87.2
Currently using the BSC3632.4
Stopped using the BSC76.3
Never heard of the BSC65.4
Table 7. Involvement in the implementation process.
Implementers
(N = 8)
Current and Ex-Users
(N = 43)
Total
(N = 51)
Illustrative Interview Quotes
Management62430“It has not always been anchored among top management… (…) it is very important that it is anchored at the top, if not it is a tough job to get it started”
“Anchored among management, they have to own it, and stand behind it, and they have to carry the torch at all times, and keep the fire burning”
Employees011“It was the employees of the municipality who played a role in facilitating this… (…) they drove the whole Scorecard process”
“BSC team”21618
Internal consultants000
External consultants011
None of the above000
Do not know011
Table 8. BSC perspectives used (N = 51).
PerspectiveImplementers
(N = 8)
Current Users
(N = 36)
Ex-Users
(N = 7)
Total
(N = 51)
Financial635748
User835750
Community427637
Employees734647
Work processes48113
Internal processes39214
Learning and growth48315
Renewal1629
Development69217
Regional development actor0202
Other1405
Do not know0000
Table 9. Prior consideration of the BSC (N = 49).
StatementFrequencyPercentage
1. Yes, but we decided against the BSC1530.6
2. No, we have not considered the BSC1224.4
3. We are in a process where we evaluate different management concepts816.3
4. No, but we have imported different elements of the BSC1428.5
Table 10. Selective use of elements of the BSC (N = 14).
ElementFrequency
Strategy map1
Perspectives3
KPIs (Key Performance Indicators)11
CSFs (Critical Success Factors)3
Basic thinking/philosophy7
Do not know0
Other1
Table 11. Rationales for not adopting the BSC (N = 49).
RationaleFrequencyPercentageIllustrative Quotes from Interviews
Too time consuming1938.8
Too costly and resource intensive1428.6
Little management interest1224.5“It is hard to sell to politicians… they are very concerned with finances”
Management turnover48.2
Little actual usage1734.7
Few actual changes in processes612.2
Not necessary510.2“Our former manager had previous bad experiences with the concept, and was not interested in using it”
Too complicated and theoretical1224.5“Management in the public sector… it is a bit complicated to put it that way...”
Not enough knowledge1530.6
Stakeholders not supportive36.1
None of the above612.2“The first thing that comes to my mind is that it is old-fashioned”
Do not know48.2
Table 12. Reasons why the municipality is planning to adopt the BSC (N = 5) [Scale: 1–7].
StatementMeanStd. Deviation
1. The BSC is a reporting and measurement tool which will provide updated and balanced information6.000.707
2. The BSC is a common management system for the municipality which provides feedback on how we are attaining our goal both at unit level and the municipality as a whole5.800.837
3. The BSC is a strategic tool which will help look at relationships between goals, initiatives and results6.200.837
4. The BSC is a tool which will make us better equipped to document goal attainment and results at the political level5.800.837
5. The BSC is a tool which will improve decision making5.201.304
6. The BSC is a tool which will help us communicate strategy within our municipality5.200.837
7. The BSC is a tool which will help us communicate strategy outside of the municipality5.400.548
8. The BSC is a tool which will help create a better understanding of the municipality’s results by linking financial and non-financial results5.800.447
9. The BSC stimulates learning and growth4.800.837
10. The BSC stimulates improvements5.601.140
11. The BSC fosters the spread of a more open and performance-oriented culture5.601.140
12. The BSC is a tool which helps with monitoring performance5.800.837
13. The BSC fosters dialogue and cooperation5.000.707
14. The BSC helps with accountability5.600.894
15. There is considerable knowledge about BSC in the municipality3.601.140
Table 13. Reasons for adopting the BSC (N = 8) [Scale: 1–7].
StatementMeanStd. Deviation
1. The BSC is a reporting and measurement tool which will provide updated and balanced information5.631.685
2. The BSC is a common management system for the municipality which provides feedback on how we are attaining our goal both at unit level and the municipality as a whole6.001.604
3. The BSC is a strategic tool which will help look at relationships between goals, initiatives and results6.381.188
4. The BSC is a tool which will make us better equipped to document goal attainment and results at the political level6.381.408
5. The BSC is a tool which will improve decision making5.501.690
6. The BSC is a tool which will help us communicate strategy within our municipality5.751.581
7. The BSC is a tool which will help us communicate strategy outside of the municipality4.751.832
8. The BSC is a tool which will help create a better understanding of the municipality’s results by linking financial and non-financial results6.381.847
9. The BSC stimulates learning and growth5.752.188
10. The BSC stimulates improvements6.251.832
11. The BSC fosters the spread of a more open and performance-oriented culture5.502.204
12. The BSC is a tool which helps with monitoring performance4.632.066
13. The BSC fosters dialogue and cooperation5.251.753
14. The BSC helps with accountability4.751.389
15. There is considerable knowledge about BSC in the municipality3.381.061
Table 14. Expectation of time to satisfaction (N = 8).
TimeFrequency
<6 months0
7–12 months0
1–2 years4
3–4 years3
5–6 years0
7–8 years0
9–10 years0
11–15 years0
>15 years0
Do not know1
Table 15. Experienced vs. expected implementation challenges (N = 8).
ExperiencedExpected
Implementation challengeFrequencyFrequency
Cultural difficulties43
Little knowledge about the BSC74
Management involvement not satisfactory11
Resistance from employees00
Resistance from managers00
Time consuming34
Costly, resource-intensive22
Limiting number of KPIs46
Selecting the right KPIs56
None of the above00
Table 16. Reasons for BSC adoption (N = 43).
StatementFrequencyPercentage
1. The BSC is a reporting and measurement tool which will provide updated and balanced information3070.0
2. The BSC is a common management system for the municipality which provides feedback on how we are attaining our goals both at unit level and the municipality as a whole3172.1
3. The BSC is a strategic tool which will help look at relationships between goals, initiatives and results3172.1
4. The BSC is a tool which will make us better equipped to document goal attainment and results at the political level3479.1
5. The BSC is a tool which will improve decision making2353.5
6. The BSC is a tool which will help us communicate strategy within our municipality1637.2
7. The BSC is a tool which will help us communicate strategy outside of the municipality1023.3
8. The BSC is a tool which will help create a better understanding of the municipality’s results by linking financial and non-financial results2558.1
9. The BSC stimulates learning and growth1432.6
10. The BSC stimulates improvements1944.2
11. The BSC fosters the spread of a more open and performance-oriented culture1023.3
12. The BSC is a tool which helps with monitoring performance716.3
13. The BSC fosters dialogue and cooperation2046.5
14. The BSC helps with accountability1227.9
15. There is considerable knowledge about BSC in the municipality920.9
None of the above12.3
Table 17. Evaluation of the implementation process (N = 43).
StatementFrequency
There were problems during the implementation23
There were no problems during the implementation14
Was not present during the implementation5
Do not know1
Table 18. Challenges related to BSC implementation (N = 43).
Type of ChallengeFrequencyPercentageIllustrative Interview Quotes
Cultural challenges818.6
Knowledge1330.2
Managerial involvement614.0“It is challenging to get the managers to see that BSC is a part of the total picture, and that it is supposed to help used manage and govern the municipality in a better way”
Employee resistance614.0
Managerial resistance37.0
Time consuming1228.0“There has to be people who have the time to facilitate the process”
Resource consuming818.6
Limiting number of KPIs1125.6“Defining critical factors… it is not always easy, and it is even more difficult to measure them… so it is not easy to know whether we are measuring the right things”
Choosing the right KPIs1944.2
None of the above00.0
Do not know00.0
Table 19. Length of BSC use (N = 36).
Length of UseFrequencyPercentage
<6 months00.0
7–12 months25.6
1–2 years12.8
3–4 years411.1
5–6 years614.0
7–8 years716.3
9–10 years511.6
11–15 years1027.8
>15 years12.8
Table 20. Time to reach satisfaction (N = 36).
TimeFrequencyPercentage
Less than 6 months00
7–12 months12.8
1–2 years12.8
3–4 years1130.6
5–6 years38.4
7–8 years00
9–10 years25.6
11–15 years12.8
More than 15 years00
Still not satisfied1438.9
Do not know38.4
Table 21. Adaptations of the BSC concept.
Type of AdaptationIllustrative Quotes from Interviews
Theory vs. practice (pragmatism)“We don’t care about the theory, we have found our template, our way of doing it, and we run our processes quickly and efficiently. The theoretical things do play a big role when we are out running processes, but we have a theoretical background, so that we know what we are doing and how and why. But for the politicians is it about getting a result and to finish a process, start using it in practice”
Complexity and simplification“It is important not to make it to complicated, because this a system that is going to be used in practice, and the reasons why it is still here is because we have been able to simplify it. We have managed to translate it so that managers, employees and politicians follow it, right? Make it as simple as possible. Then you have the issue of liberating yourself from the terminology and concepts, and not to talk to employees about BSC, perspectives and so on, it doesn’t mean anything. Going back to what I said, what matters is to make the employees reflect about their daily work and if we are satisfied with what we are accomplishing. If not, what can we do to improve?”
Conceptual and linguistic adaptations“We don’t have the traditional perspectives from Kaplan and Norton, we have local community, which is about how it is to live in the municipality, e.g., outdoor activities, culture, population growth and so on. And then we have combined inhabitants and users, in that perspective there are user surveys which look at service quality, e.g., the quality of schools, school administration and so on. Then we have the organizational perspective and then the financial perspective.”
Table 22. User-friendliness (N = 36) [Scale: 1–7].
StatementMeanStd Deviation
Using the BSC is simple4.331.373
The BSC is a flexible system4.641.334
It is easy to become good at using the BSC3.891.409
The municipality’s BSC system is easy to use4.561.182
The BSC makes my job easier4.601.241
The information I get from the BSC is simple and easy to understand5.001.394
The BSC is a useful system to carry out my tasks4.691.255
Table 23. The BSC and decision making (N = 36) [Scale: 1–7].
StatementMeanStd. Deviation
I use the BSC to analyze why problems arise3.521.716
I use the BSC to understand data3.941.713
I use the BSC to explain my decisions4.271.567
I use the BSC to justify decisions3.561.625
The BSC helps me improve decision making4.451.394
Table 24. The BSC and performance evaluation (N = 36) [Scale: 1–7].
StatementMeanStd. Deviation
The BSC is better at measuring performance than traditional financial performance measurement5.031.547
The BSC gives me a better understanding of the municipality’s results5.291.426
The BSC gives me the possibility of comparing results over time5.831.200
The BSC gives me the opportunity to compare the results of different parts of the organization4.691.827
The BSC gives me the opportunity to examine cause and effect relationships4.091.676
Table 25. Results of BSC implementation (N = 36).
Result FrequencyPercentage
It is a complicated system, and has no use12.8
It is a complicated system, but the results are positive1747.2
It is not complicated, but has no use25.6
It is not complicated, and the results are positive1644.4
Table 26. Duration of use before abandonment (N = 7).
Duration of UseFrequency
<6 months0
7–12 months1
1–2 years1
3–4 years2
5–6 years1
7–8 years1
9–10 years0
11–15 years1
>15 years0
Table 27. Reasons why the BSC was discarded (N = 7).
ReasonFrequencyIllustrative Quotes from Interviews
Time intensive2“It was costly, both in terms of finances and time... it was not a success, we never got any results, and we need concrete results if we are to go for new things…”
Resource intensive3
Little managerial involvement0
Change of management1
Was not used in practice4“The system was not compatible with the existing systems and practices”
Did not lead to changes in processes1“The system was adapted to a certain extent but it did not work”
Not necessary1
Too complicated and theoretical2“It created more problems than it solved… it was impossible to make it work…”
Not enough knowledge to utilize the potential1
Problems identifying KPIs4
Ended up with too many KPIs2
Stakeholders do not support the implementation of the BSC0
None of the above0
Table 28. Experiences with using the BSC [Scale: 1–7].
StatementMeanStd. Deviation
Using the BSC was easy2.571.902
It was easy to become good at using the BSC2.861.773
The BSC made my job easier2.571.718
The BSC was used to analyze causes of problems2.711.604
The BSC was used to justify decisions2.711.496
The BSC was better suited to measure performance than traditional financial measurement systems3.501.049
The BSC provided a better understanding of the municipality’s results3.432.070
The BSC provided opportunities to examine cause and effect relationships3.432.070
The BSC was used coordinate activities with co-workers2.431.272
Table 29. Perceived success (N = 7) [Scale: 1–7].
The Municipality Has Succeeded in Using the BSCThe Municipality Is Using Resources More Efficiently as a Result of BSC Implementation
Mean2.862.43
Std. Deviation1.5741.718

