Article

Quality Culture of Manufacturing Enterprises: A Possible Way to Adaptation to Industry 4.0

1
Faculty of Operation and Economics of Transport and Communications, University of Zilina, 010 26 Zilina, Slovakia
2
School of Expertness and Valuation, The Institute of Technology and Business in Ceske Budejovice, 3701 Ceske Budejovice, Czech Republic
3
Department of Social-Human Sciences, Faculty of Social and Human Sciences, Spiru Haret University, 041916 Bucharest, Romania
4
Management Department, University of Dabrowa Gornicza, 41-300 Dabrowa Gornicza, Poland
*
Author to whom correspondence should be addressed.
Soc. Sci. 2019, 8(4), 124; https://doi.org/10.3390/socsci8040124
Submission received: 10 March 2019 / Revised: 11 April 2019 / Accepted: 15 April 2019 / Published: 19 April 2019
(This article belongs to the Special Issue Industry 4.0 Implication for Economy and Society)

Abstract

:
The concept of Industry 4.0 means a new paradigm of modern manufacturing. This phenomenon requires continuous innovation processes and technological development from each enterprise. Traditional concepts of quality must absorb changes and prepare themselves for new challenges. The studies linked to successful adaptation to Industry 4.0 focus mostly on technical dimensions and forget the impact of organisational culture. One should, however, remember that quality culture plays a crucial role in the organisational culture of manufacturing enterprises with elements of quality management implemented. Developed quality cultures support the innovation environment, which is why it is necessary for the enterprises to identify the current level of their quality culture and detect significant factors that differentiate individual quality cultures and focus on them. Given this fact, the aim of the paper is to analyse the typical cultures and quality concepts and to detect the factors that differentiate individual quality cultures in Slovakia. We use data from our own survey; dependences were indicated by means of correspondence analysis and the test of proportion. The improvement and assurance of quality, the use of information and the overall effectiveness are significant factors detected by the discriminant analysis. The conclusions of the survey may be used by scientific researchers but especially by manufacturing enterprises interested in quality which are coming to terms with the era of Industry 4.0.

1. Introduction

Quality management is an evergreen research theme in the contemporary world (Gunasekaran et al. 2019) and quality itself has been a top subject for years (Ondra et al. 2018). The world is at the threshold of the fourth industrial revolution that has already begun. This is the fourth milestone which is fundamentally changing enterprises (Mohelska and Sokolova 2018). Within a modern enterprise, change is a constant process that can be managed and predicted (Sujova and Remen 2018). All sectors have to move toward Industry 4.0 (Hamid et al. 2018). Although quality management became popular in the 1980s and 1990s, 21st-century enterprises in the era of Industry 4.0 are still struggling with the concept (Gunasekaran et al. 2019). Industry 4.0 significantly changes products and production systems concerning design, processes, operations and services. Certainly, the implementation of this concept has further consequences for management and future jobs through the creation of new business models (Moravcikova et al. 2017; Meyer 2018; Slusarczyk 2018) and in the cases when it is not appropriately managed, financial losses may occur (Meyer et al. 2017). Since the primary impact of Industry 4.0 is perceived in value-creating processes, and has so far had the greatest transformative effect in this area, the model can be considered to be appropriate (Nagy et al. 2018).
Industry 4.0 and its other synonyms such as Smart Manufacturing, Smart Production or the Internet of Things have been identified as major contributors in the context of the digital and automated manufacturing environment or projects aimed at the creation of zones of economic activity related to economic support and high level of economic efficiency (Pierzyna 2019). The term Industry 4.0 comprises a variety of technologies to enable the development of the value chain resulting in reduced manufacturing lead times, as well as improved product quality and organisational performance (Kamble et al. 2018). Dalenogare et al. (2018) consider Industry 4.0 a new industrial stage in which vertical and horizontal manufacturing process integration and product connectivity can help companies to achieve a higher level of industrial performance. Most studies discuss technical aspects, but do not pay attention to managerial approaches and organisational culture, which are a major factor influencing the success of this concept. It is especially interesting to find out whether, how and to what extent these knowledges are embedded into the business world and market (Domańska 2018). Implementing the Industry 4.0 concept requires continuous innovation and education that not only depend on people’s abilities, but also on organisational culture (Mohelska and Sokolova 2018). Barney (1986) indicates that organisational culture was a source of sustained competitive advantage for enterprises almost 35 years ago, and Jancikova and Brychta (2009) also consider organisational culture a significant factor in ensuring competitive advantage, an argument which is still highly relevant nowadays. Positive organisational culture is an essential principle of a successful enterprise. Muras (2017) emphasises that modern enterprises are constantly searching for an optimal enterprise infrastructure and culture, as well as changing their managerial approach to pave the way for innovative culture; quality culture is that innovative culture. Wu et al. (2011) reiterate that quality culture plays a critical role in organisational culture and appropriate quality makes management programs more effective. Industry 4.0 can be recognised as a great opportunity for the development and improvement of competitiveness, although the state of preparations for its implementation varies widely depending on country, sector, or even an individual company (Slusarczyk 2018); developed quality culture can facilitate implementation of this concept. The key to success is to understand customer needs, and fulfill them with the highest quality, adapting at the same time to the expected changes in market demand (Kovács and Kot 2017).
Definitions by authors that have been interested in quality culture vary quite widely. Quality culture encompasses organisational practices, central values and philosophy and can be defined as the concentration of all people and resources in a never-ending quest for greater quality and service in every dimension of the organisation (Viljoen and van Waveren 2008). Quality culture is the pattern of habits, beliefs and behaviour concerning quality (Watson and Gryna 2001; Palus et al. 2014; Popescu 2018). The quality culture of an organisation is a subset of the organisation’s overall culture. It reflects the general approach, the values, and the orientation to quality that permeate organisational actions (Cameron and Sine 1999). Leadership emphasis, message credibility, peer involvement, and employee ownership are attributes which predict the corporate culture focused on quality (Srinivasan and Kurey 2014).
Popescu et al. (2018a) declare that even if sophisticated technologies of Industry 4.0 have been embraced, productivity growth is still moderate. Georgescu et al. (2018) explain that adopting the overall quality system is a profound transformation involving changes at all levels of the enterprise, starting with the management system as a whole, continuing with the change in attitudes and behaviours among the employees of the enterprise. Goetsch and Davis (2013) consider the ultimate, anticipative result of endeavour in the quality culture, the environment of continuous improvement of quality in all areas of the enterprise. Fielden et al. (2018) mention that news stories that are rapidly shared through social media can generate important advertising returns. In our case, in the quality culture, news stories about continuous improvement of the quality shared through employees can generate the most important advertisement of the enterprise. Popescu et al. (2018b) point out that underperforming individuals confront a deep supervisory exigency, but Kuo and Tsai (2019) demonstrate—from the perspective of employees—that this innovative culture also has a positive effect on performance and underperformance and the supervisory exigency has disappeared. The positive influence on operational performance is confirmed by the empirical study of Gambi et al. (2015). The study by Hebbar and Mathew (2017) interprets the significance in harnessing the quality culture of the enterprise to enhance the overall quality of performance. Abakumova and Primierova (2018) and Ahmad et al. (2018) support the importance of the quality culture of the enterprise and its consequence of quality performance because, as a rule, households with a high level of earnings prefer high-quality and exclusive goods.
Numerous studies can be found which focus on bankruptcy prediction in Slovakia (Kovacova et al. 2018), Slovak research on identifying significant sources of enterprise goodwill (Kliestik et al. 2018a), or using controlling as a competitiveness tool on the Slovak market (Vagner 2016), but detection of the existence and the development of quality cultures in the context of Industry 4.0 is still lacking. It is necessary to examine these facts, as Kanovska (2018) notes that smart manufacturing is still developing and taking place in different forms. Krajcsak (2018) finds ISO standards and Total Quality Management (TQM) only appropriate organisational cultures, not quality culture; this is another scientific gap when it comes to determining a representative culture quality for traditional quality concepts. Those are sectoral standards, ISO standards and TQM philosophy (Konecny 2017). Classical quality-orientated managements change, learn and adapt to innovation brought about by Industry 4.0 (Bourke and Roper 2017).
Given the deliberations presented, the aim of this paper is to analyse the typical dependence between quality cultures and quality concepts and to detect the factors that differentiate individual quality cultures in Slovakia. Our paper is structured as follows. Firstly, we present the literature review, concentrating on analyses of different aspects associated with quality culture in contemporary enterprises. Secondly, we present the materials and methods that were applied in this research. The appropriately methods of mathematical statistics are used and described to fulfil the aim. These methods were run: Person chi-square test, Cramer’s V and Pearson contingency coefficient, correspondence analysis, test of a proportion, Kaiser-Meyer-Olkin (KMO) measure of adequacy, Bartlett’s test of sphericity, Varimax with Kaiser normalisation, Cronbach’s alpha, the test of Box’s M, Wilks’ Lambda test, and discriminant analysis. The next part of our paper presents the research results and analyses the results in detail. We use data from our own survey. It was made purposive sample of 2909 “respondents”, it must be manufacturing enterprises, which implementing at one quality management system. The enterprises were addressed electronically by emails and was required to fill the survey by quality managers, technical managers or supervisors. Based on provided data medium dependence between the quality concepts and the quality cultures is indicated, typical relations between individual quality concepts and individual quality cultures are characterised, and three significant factors (the improvement and assurance of quality, the use of information and the overall effectiveness) are detected that differentiate individual quality cultures in Slovakia. Finally, we present the conclusions and limitations of our study.

Literature Review

The topic of quality culture is a matter of interest for a number of scholars representing a variety of scientific institutions who have analysed it from different points of view. For example, Sinclair and Collins (1994) discuss the quality culture, whilst Dellana and Hauser (1999) went even further in carrying out a study defining the quality culture. Woods (1997) detects six values of quality culture and Harvey and Stensaker (2007) link understandings and the boundaries of the quality culture. Tari et al. (2018) highlight that the quality culture can motivate the enterprise to adopt quality standards (sectoral standard and ISO standards). Gaigne and Larue (2016) study the impact that minimum quality standards have on industry structure, trade, and welfare when firms can develop their own private standard which is of a higher quality than the public standard. Vanagas (2005) evaluates the role of quality culture in the implementation of total quality management in agricultural companies. Panuwatwanich and Nguyen (2017) deal with the evidence from the Vietnamese construction industry considering the influence of culture on the implementation of TQM philosophy. The tangibility of quality culture is described by Porter (1997). Campos et al. (2014) test total quality culture in the enterprises of two subsectors of the tourism industry and show that leadership is a critical success factor for total quality culture, mainly if the manager is directly involved in quality, behaves unambiguously, and leads and motivates cultural changes. In addition, Meyer and Meyer (2016) found that leadership also contributes to the creation of enabling business environment in general. Industry 4.0 implementation for multinationals was the goal of the work of Telukdarie et al. (2018). Previous research into diagnosing and changing culture was undertaken by Handfield and Ghosh (1994); Cameron and Barnett (2000); Lo (2002); Cao et al. (2005); Kull and Wacker (2010); Baird et al. (2011). Changing and learning in enterprises oriented to quality in the era of Industry 4.0 is highlighted in the study by Bourke and Roper (2017). Iqbal and Asrar-ul-Haq (2018) examine the relationship between TQM practices and employee performance in the dynamic technological sector in Pakistan. Amin et al. (2017) show that TQM constructs have significant relationships to employee satisfaction. A new TQM model in the environment of innovation is delivered by Shan et al. (2018a, 2018b). The relationship between TQM and quality culture has been examined by Hildebrandt (1991); Hauser and Dellana (1998); Kujala and Lillrank (2004); Prajogo and McDermott (2005); Wu et al. (2009); Gimenez-Espin et al. (2013); Todorut and Bojnica (2013); and Pakurár et al. (2019). Hebbar and Mathew (2017) identify the critical TQM practices or factors and the impact of the quality culture on these practices and quality of performance in automotive enterprises in India. The results obtained support the significant positive relationship between quality culture and all critical factors. TQM practices have a positively significant relationship to quality culture, which plays a major role in boosting the quality of performance in the enterprise (Androniceanu 2017). Another study from India carried out by Patyal and Koilakuntla (2017) explores the relationship between quality management and performance, specifically how the infrastructure and core quality management practices affect quality and business performance.
Garvin (1988) points out that quality cultures have developed over time in enterprises. He labels four major quality cultures: inspection culture, statistical control culture, quality assurance culture and strategic quality management culture. Cole (1999) identifies two main quality cultures that typify manufacturing enterprises: a new quality paradigm and an old quality paradigm.
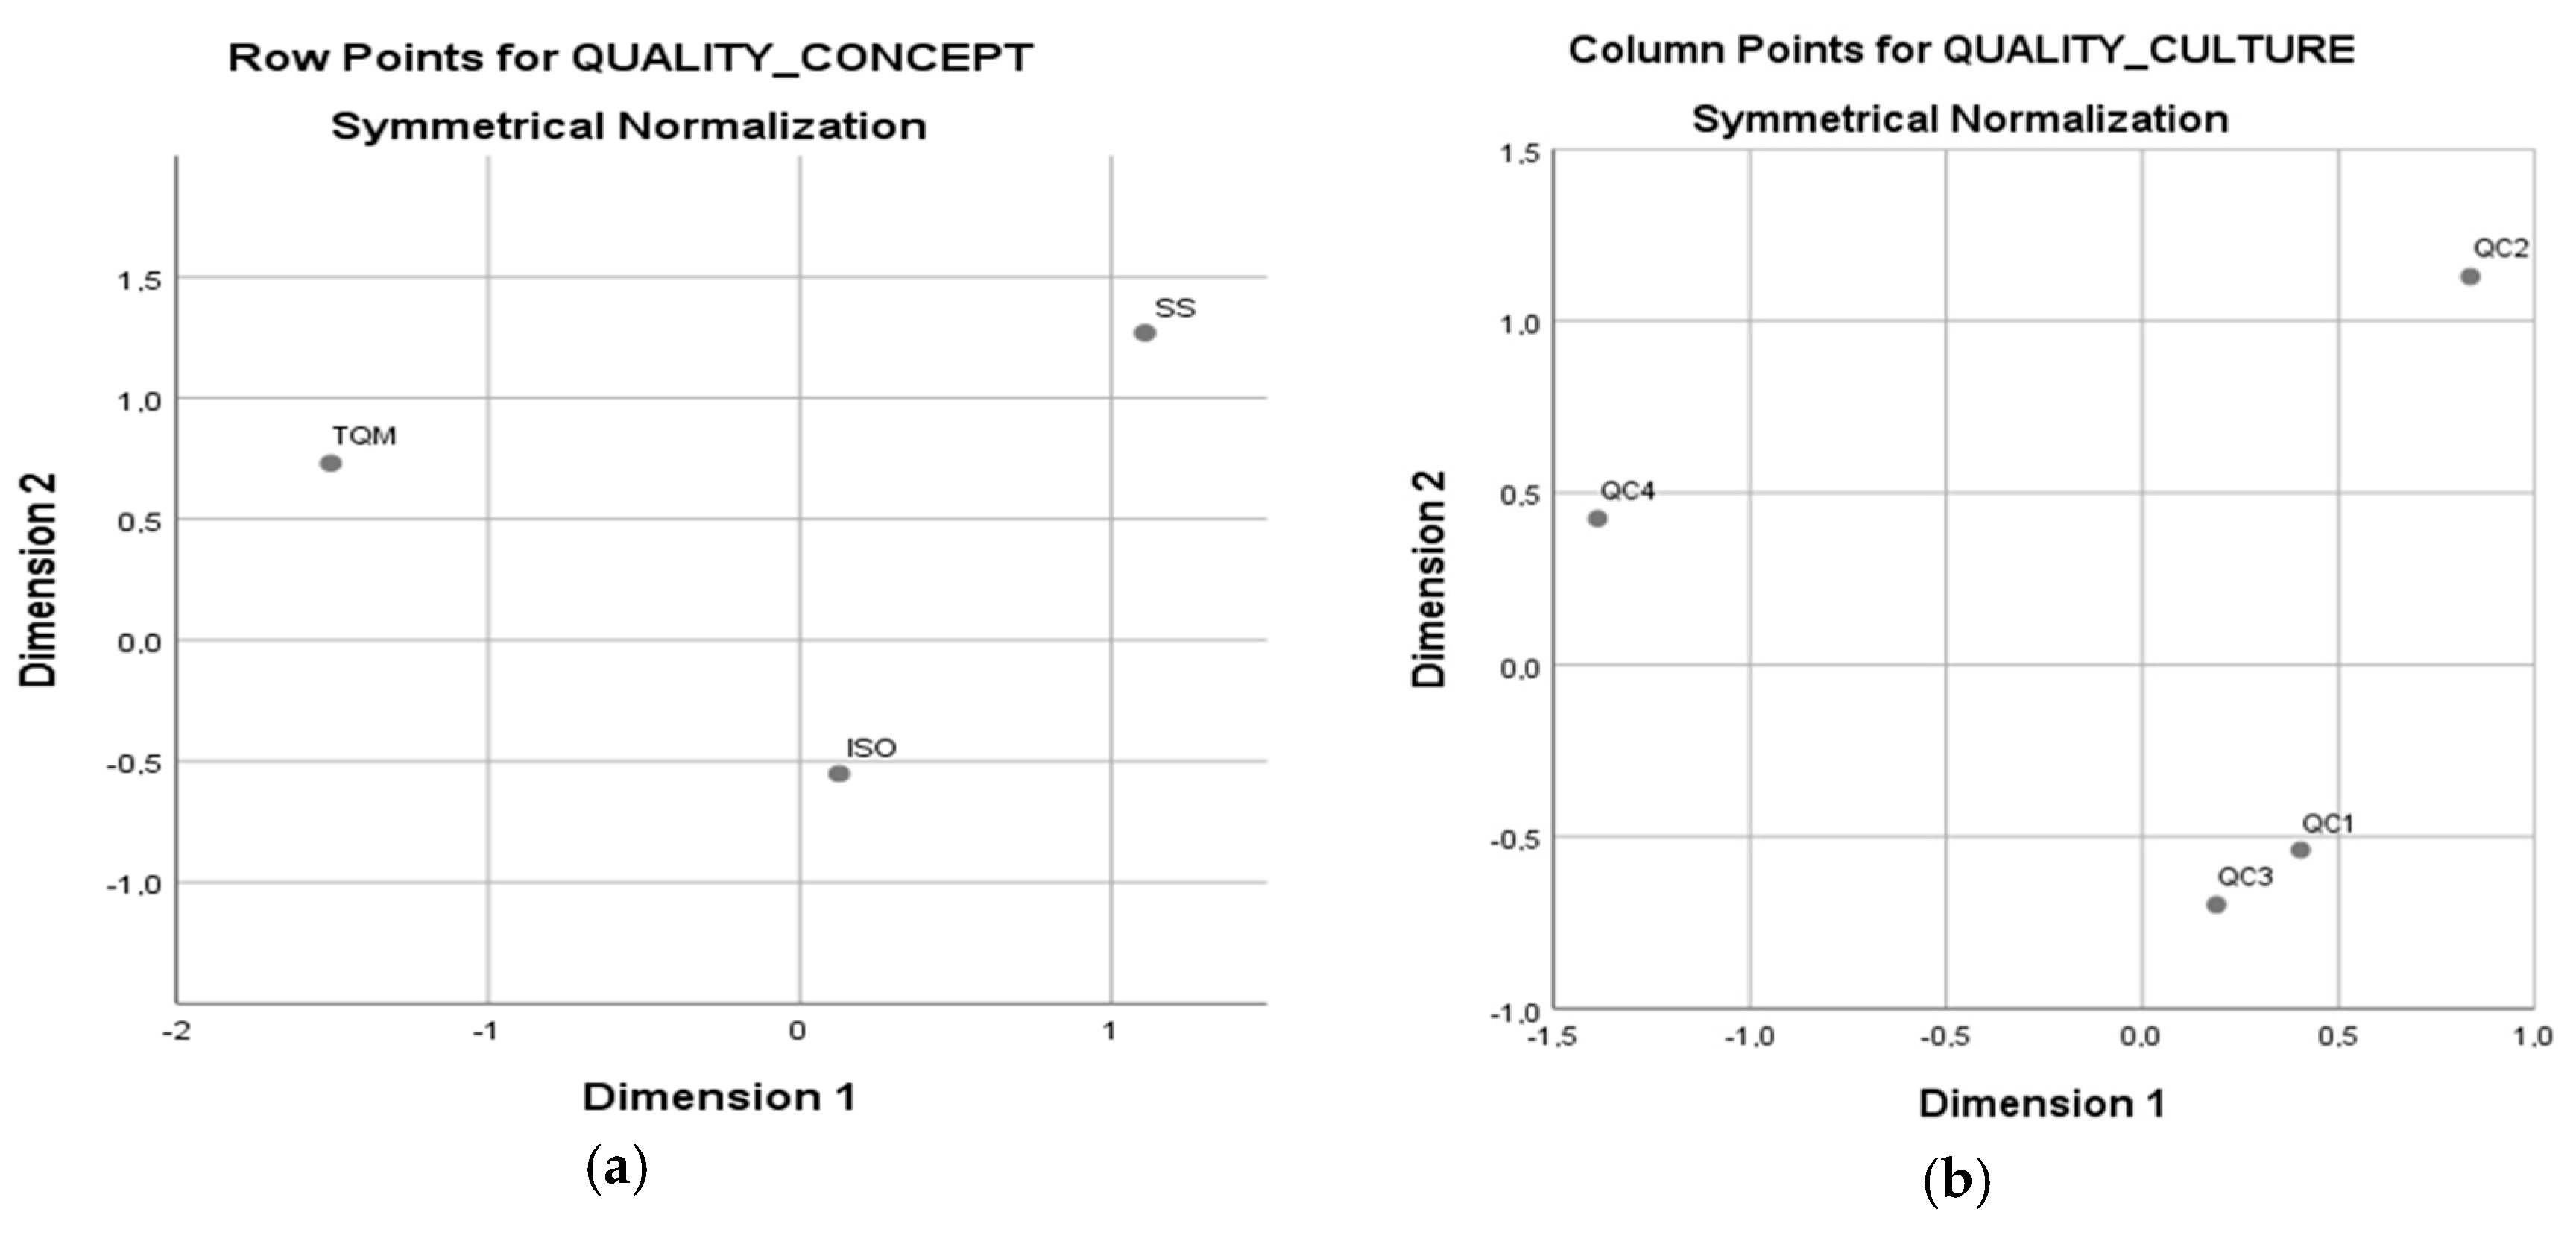
 Cameron and Sine (1999) and Cameron and Quinn (1999) made a comprehensive classification of quality culture (QC) and divided QC into levels depending on their development: the absence of emphasis on quality (QC1), error detection culture (QC2), error prevention culture (QC3) and creative quality culture (QC4). Based on this proposed classification, Gimenez-Espin et al. (2013) introduce an alternative type of culture: the mixed culture or culture for quality, which can be between adhocratic and clan cultures. It can have a double orientation—external and internal—and can promote flexibility. The culture of operational excellence through Industry 4.0 is monitored by Quezada et al. (2017). Shan et al. (2018a, 2018b) develop a model of a prominent paradigm to improve manufacturing performance in order to gain further competitive advantage.
Empirical evidence of the impact of quality culture on quality or operational performance was provided by Adam et al. (1994) in Korea, New Zealand and the USA, Kanji and Wong (1998) in the construction industry, Ogbonna and Harris (2000) in UK enterprises, Barrett and Waddell (2001a, 2001b) in Australia, and Corbett and Rastrick (2000) in New Zealand. Watson and Gryna (2001) analyse the quality culture in small businesses. Wu (2015) empirically assesses the path from quality culture to infrastructure practices, core practices, and finally to quality performance using data collected from Chinese manufacturing enterprises in a structural equitation model. The results indicate a chain effect that quality culture serves as an antecedent of infrastructure practices to take effect and infrastructure practices providing a supporting foundation for core practices to generate a positive impact on quality performance. Ilies et al. (2015), based on evidence from metal construction industry organisations from northwestern Romania, develop regression models explaining and making predictions about the variation of variables which synthesise the quality culture. Another study from the Romanian metal construction industry, undertaken by Ilies et al. (2017), obtains a surprising result concerning the leadership style favourable to the development of the quality culture. The managers from the organisations analysed, who have an authoritarian leadership style, favour the development of the quality culture more than managers who adopt a democratic style. It is worth to add that a part of the organisational culture is also the intergenerational collaboration of employees. As the majority of developed countries faces changing transition towards older population structure, it has to be reflected also in organisations and the organisational culture (Kubíčková et al. 2018).
Cronemyr et al. (2017) indicate the need for a tool that measures not only the quality values but also behaviour that supports or obstructs the quality culture. They suggest how a measuring tool which measures quality culture can be designed and structured in Swedish conditions. Ko and Stein (2019) propose two methodologies to catalyse and sustain continuous improvement within an enterprise to adopt a positive quality culture. Key factors of manufacturing enterprise development in the context of Industry 4.0 in Russia are assessed by Tolstykh et al. (2018).
A systematic literature review identifying the current trends and future perspectives of Industry 4.0 is undertaken by Kamble et al. (2018). Ghobakhloo (2018) provides a strategic roadmap for the future of the manufacturing industry toward Industry 4.0. Gunasekaran et al. (2019) present a research pathway towards Industry 4.0 for quality management in 21st-century enterprises. Mohelska and Sokolova describe management approaches for Industry 4.0 from an organisational culture perspective in the Czech Republic. Sujova and Remen (2018) evaluate the management of changes in business processes affected by Industry 4.0 in Slovak conditions. A review of service-oriented manufacturing paradigms is carried out by Siderska and Jadaan (2018). Luthra and Mangla (2018) as well as Ohanyan and Androniceanu (2017) comprehensively evaluate the challenges of Industry 4.0 in emerging economies. Oliff and Liu (2017) integrate methods of Industry 4.0 with emerging paradigms of existing manufacturing processes to quality improvement. The use of ISO standards in Big Data analytics cloud services is analysed by Roy et al. (2017). Slusarczyk (2018) inspects the attitudes to and preparation of entrepreneurs for Industry 4.0. The expected contribution of Industry 4.0 technologies for industrial performance is discussed by Dalenogare et al. (2018).

2. Materials and Methods

A detailed analysis of the literature allows us to formulate the following hypotheses:
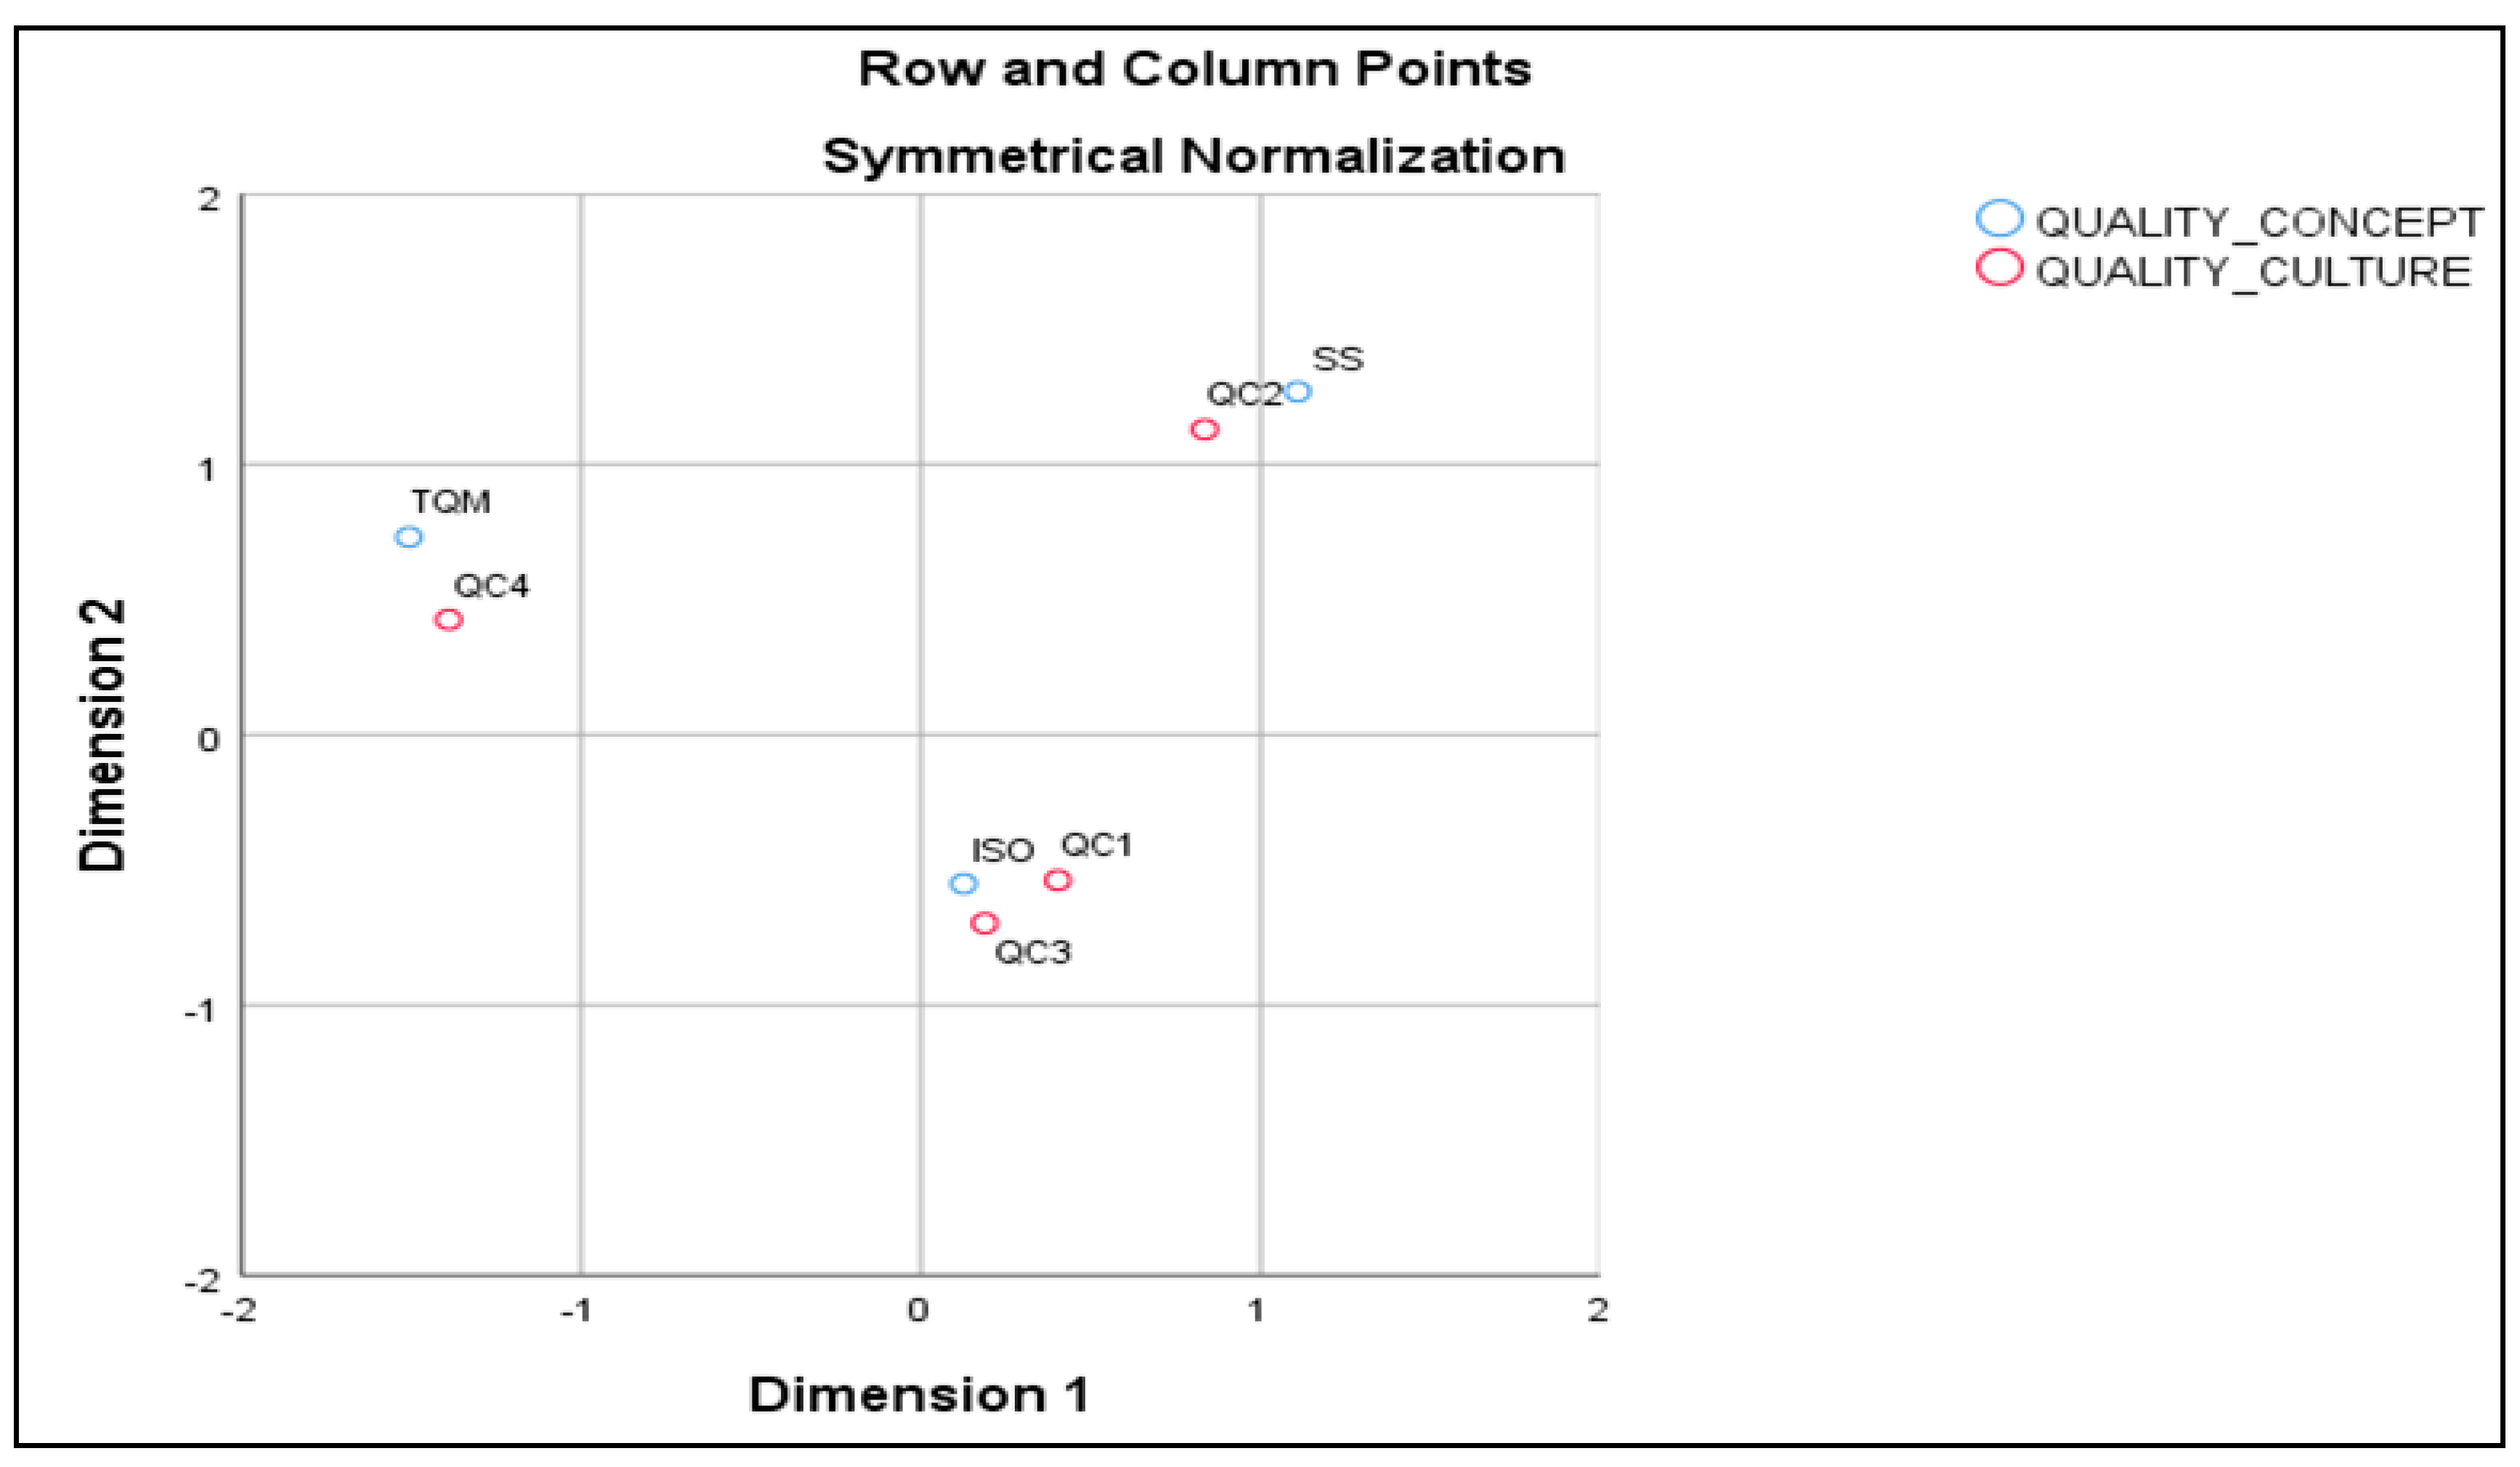
Hypothesis 1.
A significant dependence exists between quality culture and quality concept.
Hypothesis 2.
Error detection culture is implemented in more than 50% of enterprises with sectoral standards.
Hypothesis 3.
Error prevention culture is implemented in more than 50% of enterprises with ISO standards.
Hypothesis 4.
Creative quality culture is implemented in more than 50% of enterprises with TQM.
Hypothesis 5.
A significant discriminant function exists in differentiating quality cultures.
All details regarding the materials and methodology are as follows:
1. The information (primary source) used in this article was gained from the survey undertaken by the authors. The content and the trend of the questions were taken from the American research carried out by Cameron and Sine (1999) and modified to Slovak conditions because of the subsequent possibility of comparing the results. The survey was carried out in 2018 to detect the level of the development of a quality culture in Slovak manufacturing enterprises. The decision was made to provide non-probability sampling (purposive sampling). Two required conditions must be met by the enterprises: it had to be a manufacturing enterprise and at least one of the quality management systems had to be implemented in the enterprise.
2. After determining the attributes of the purposive sampling of the enterprises, the sample size is determined, meaning the number of responses from each quality culture. The decision was made to connect two recommendations. Saunders et al. (2012) state in their book that sample size determination is specific for each case and must reflect a number of factors. They specify minimum sample sizes for different study characters, specifically 12 to 30 responses for heterogeneous samples. Singh and Masuku (2014), quoting Sudman (1976), suggest that each minor group of the sample should necessarily contain 20 to 50 elements.
3. There is no database in Slovakia that would meet the conditions demanded; because of this, the researchers compiled their own database based on data from the Slovak Society for Quality, the Slovak Office of Standards, Metrology and Testing, participants of the National Quality Award of the SR, the Slovak National Accreditation Service and Certification companies. The final database created by authors consists of 2909 enterprises. 2909 questionnaires were sent electronically, and the number of correctly recorded responses in the given time was 126, representing the completion of approximately every 23rd questionnaire and a return rate of 4.33%.
4. The survey determined the level of the development of quality culture and implemented the quality concept. Cross-tabulation of quality culture and quality concept was undertaken to identify the possibility of the use of the Person chi-square test and to test the dependence between nominal variables. The assumption of 20% of cells having less than five expected (theoretical) observations is satisfied. The strength of dependence and its statistical significance were tested by Cramer’s V and Pearson contingency coefficient according to Rezankova (2017).
5. Subsequently, the authors undertook the correspondence analysis with an overview and correspondence map of row points, an overview and correspondence map of column points, and a correspondence map of row and column points as well, in order to detect the relationship between categories of quality culture and the quality concept. Correspondence analysis is a method used to detect groups of similar categories. Its main advantage is the ability to analyse the relationship between the categories of two variables at the same time (Rezankova 2017). Correspondence analysis examines the internal structure by means of correspondence maps showing variable categories in a reduced two-dimensional coordinate system. Kral et al. (2009) discuss the fact that row and column points can be considered as coordinates of the point in r(s)—dimensional space, and from the viewpoint of the practical application, their visual representation uses two-dimensional correspondence maps.
6. The hypothesis is determined to identify the relations between categories of variables. To test the hypothesis, a test of a proportion is used, where test statistics T (Equation (2)) to the critical value of standard normal distribution are compared. There are two approaches to verify the range of the test (due to the approximation of the normal distribution) and none of them has a significant preference. Thus, the validity of both approaches is verified (Equations (3) and (4)).
T =   m n π 0 π 0 ( 1     π 0 )   n
nπ0(1 − π0) > 5
nπ0 ≥ 5 and (1 − π0) ≥ 5
7. The survey contained 97 questions measured by a 6-point Likert scale, where point 1 corresponds to ‘strongly disagree’ and 6 ‘strongly agree’. Questions were labelled from Q18 to Q114. All questions have the same positive coding. The set of questions is reduced to 8 heterogeneous components (factors, variables) by factor analysis, and it assessed percentages of total variance explained not the criterion of convergence of eigenvalue to the value 1. The adequacy of the use of factor analysis is checked by the KMO measure and Bartlett’s test of sphericity. The extraction method is a principal component analysis, the rotation method is Varimax with Kaiser normalisation and rotation converged in 10 iterations. The reliability of the factors is tested by Cronbach’s alpha. The values of internal consistence of factors are made both with and without outliers and for divided parts of the sample, by the Pareto principle (80:20).
8. The use of canonical discriminant analysis is conditional on fulfilling some assumptions. It is necessary to check assumptions concerning independent variables (created by factor analysis) and the dependent variable (detected quality culture). All observations are assumed to be independent and have identical distribution (Sadaf et al. 2018). Factor analysis prevents the occurrence of multicollinearity between dependent variables. The assumption of the multivariate normal distribution is not met, but the discriminant analysis is quite robust in order to break this assumption. The outliers, identified by box-plots, have to be removed. The equality of covariance matrices of individual groups retained in the test of Box’s M and the equality among groups of the independent variables is rejected by Wilks’ Lambda test.
9. The sample is divided 80%/20%; data is stratified and divided according to the individual group based on Kral et al. (2009). The larger part of the sample is used to construct the model, and the smaller part to validate the model. A significant canonical discriminant function was created in the discriminant analysis; this function was run by means of the stepwise method in three steps. The stepwise method of the discriminant analysis was applied to find the linear combination of those variables that best discriminate the groups of cases (Kliestik et al. 2018b). Three significant factors were identified; the value of intercept and the equation of the model were also written.
10. The final model (Z-score) differentiates individual quality cultures in Slovak manufacturing enterprises; the selection of the enterprise to individual quality culture is based on a comparison of counted scores to centroids.
11. The validation of the model formed was carried out on the origin sample, from which the model was created, cross-validation and test sample.
IBM SPSS Statistics v. 25 software was used, rented from Kivuto Solutions Inc., Naas, Co. Kildare, Ireland.

3. Results

This section involves all results concerning the quality culture of manufacturing enterprises in Slovak conditions.

3.1. Quality Culture and Quality Concept

In this subsection, we test the dependence between quality culture and quality concept, detect the intensity of the dependence, and identify the typical quality culture for each quality concept.

3.1.1. The Dependence of Quality Culture and Quality Concept

Firstly, we created the cross-tabulation Table 1 of the quality cultures and the quality concepts. Observed counts determined from the survey are contained therein. To test the dependence of the variables by Pearson chi-square, it is necessary to check the condition of theoretical (expected) counts. 80% of the cells have to have an expected count higher than 5. In our case, it is 83.33% of the cells. This fact is confirmed by Table A1 in the Appendix A.
Testing of Hypothesis 1. We test the hypothesis of dependence between the quality culture and the quality concept at the significance level of 0.05, which is compared to the significance (p-value). Based on data from Table 2, we reject the hypothesis of the independence of the variables analysed and accept the significant dependence of the quality culture and the quality concept.
The Pearson chi-square test confirms the dependence between these nominal variables. Based on data from the Mantel–Haenszel test shown in Table 3, we repeatedly confirm the dependence. It would be useful to observe the problem of this dependence after excluding QC1 (absence of the emphasis on quality).
We identified the significant dependence of the nominal variables. Rezankova (2017) recommends indicating the intensity of the dependence by means of Cramer’s V and Pearson contingency coefficient according to this scale:
0.0 < the value of the coefficients ≤ 0.3 weak dependence
0.3 < the value of the coefficients ≤ 0.8 medium dependence
0.8 < the value of the coefficients ≤ 1.0 strong dependence
The values of Cramer’s V and Pearson contingency coefficient determine a medium level of dependence between the quality cultures and the quality concepts. The significance of the coefficients should be below the determined significance level. Based on the comparison of the significance from Table 4 to the significance level of 0.05, we assess that both of the contingency coefficients are statistically significant.

3.1.2. The Detection of Typical Quality Culture for Quality Concept

We detected the dependence between variables and, following analysis, focus on searching for internal dependence between the categories of the quality culture and the quality concept. Kral et al. (2009) state that, if dependence between the qualitative (nominal or ordinal) factors is confirmed, it is worth carrying out the correspondence analysis.
The first outputs of the correspondence analysis are the row and the column points which are found in Table 5 and Table 6. The column labelled Total in the point tables indicates the contribution of the row (column) points in total inertia. The inertia represents the degree of the quality with which the points of the multidimensional space have been transformed into the correspondence map. In both cases, the individual contributions were assigned the value 1, which reflects the fact that the two-dimensional map correctly corresponds to the analysed categories.
In Figure 1 the categories of the quality culture and the quality concept transformed into two-dimensional correspondence maps are shown.
We derived the relationship between the categories of analysed variables based on a common correspondence map of row and column points (Figure 2). The enterprises which have implemented sectoral standards prefer the approach of QC2, while the enterprises managed by ISO standards prefer the approach of QC3. The enterprises that follow the TQM philosophy prefer the approach of QC4. However, we must not forget the fact, emphasised by Kral et al. (2009), that the correspondence analysis is only a descriptive method, and does not provide an apparatus for verifying the conclusions. For this reason, we have decided to verify the indicated dependencies by testing a portion. The result of the test of the portion did not serve to confirm the random occurrence, but rather marked the systematic phenomenon of Slovak manufacturing enterprises having implemented at least one of the quality management systems.
Testing of Hypothesis 2. Based on the data shown in Table 7, we accept the hypothesis that error detection culture is implemented in more than 50% of enterprises with sectoral standards.
Testing of Hypothesis 3. Based on the data shown in Table 8, we accept the hypothesis that error prevention culture is implemented in more than 50% of enterprises with ISO standards.
Testing of Hypothesis 4. Based on the data shown in Table 9, we accept the hypothesis that creative quality culture is implemented in more than 50% of enterprises with TQM.
Durana (2018) detected that the most preferable quality concept in Slovak manufacturing enterprises is ISO standards. We indicate that the characteristic quality culture for this quality management system is error prevention culture, which is why this type of development is the most commonly used quality culture among Slovak manufacturing companies.

3.2. Model of Quality Culture

Before running the discriminant analysis and forming the model of quality culture, it is necessary to identify input variables (factors) by factor analysis, check the reliability of created factors, divide the sample of the enterprises and test all required assumptions concerning discriminant analysis.

3.2.1. Factor Analysis

The answers obtained by means of the survey were ordinal variables. Rimarcik (2007) recommends that social sciences take advantage of the possibility of using the methods of interval variables for analysing ordinal variables, if two assumptions are met. Namely, that there are at least five categories, a 6-point Likert scale is used, and at the same time there is no reason to predict significant differences in the distance between individual categories. We consider the answers of the statistical units as the interval input variable.
Before undertaking the factor analysis, it is necessary to calculate sampling adequacy. Factor analysis requires the correlation of original input variables (Kral et al. 2009). It is possible to use the KMO criterion to evaluate the dependence of the input variables. As shown in Table 9, a KMO value between 0.8 and 1 indicates the sampling is adequate, concretely, if the value is in the spread 0.80 to 0.89, adequacy is meritorious (Kaiser and Rice 1974). The correlation matrix is an identity matrix, which would indicate that variables are unrelated, which is the null hypothesis of Bartlett’s test of sphericity. We reject the null hypothesis and accept an alternative hypothesis; the correlation matrix is not an identity matrix based on a comparison of the significance level 0.05 and significance in Table 10. The variables are related, and factor analysis is highly useful.
The number of factors was chosen according to total variance explained. Kral et al. (2009) write that in social science it is necessary to have 60% to 70% of total variance explained. Eight components that explained 66.034% of variability were determined, as shown in Table 11. Ideally, for interpreting any indicator should show saturation with just one factor. In practical situations, one indicator has high factor saturation with several factors. It is rotated and tried again repeatedly to ensure that each indicator has high saturation in one factor (Kral et al. 2009). In Table A2 in Appendix A is a rotated component matrix with all components made and all coefficients of used questions sorted by size. We named the factors according to the contents of the questions involved (Table 11) and used them as input variables in a discriminant analysis.
Rimarcik (2007) emphasises that answers to the individual questions do not have the same importance as the overall score of the factors. Furthermore, Rimarcik (2007) describes Cronbach’s alpha as a possible method for determining the reliability of the method used. Cronbach’s alpha is an index of internal consistency of the factor and can take values from 0 to 1. If the value converges to 1, it is a sign of a very high internal correlation between the items, and indicates that items are based on the same principle. Rimarcik (2007) states that a Cronbach’s alpha value of at least 0.8 is required. The values of Cronbach’s alpha are shown in Table 12. It is necessary to add that we gain values of Cronbach’s alpha for four samples: the sample with outliers, the sample after elimination of the outliers and divided samples. The sample without outliers was stratified and divided. Detailed information about the stratification is demonstrated in Table A3 in Appendix A. We note that the high value of Cronbach’s alpha means that the questions were appropriately linked to the factors and the factor creates a basis for the very reliable results of analyses which followed. We have not used a factor score, but the average of the questions. In further research the factor score could be used and the results can be compared if some differences occur.

3.2.2. Testing of Assumptions

First of all, it is important to ensure that the assumptions concerning independent variables and the dependent variable are met. Kral et al. (2009) states that we have a file, and the units in it are divided into N disjoint groups. In our case, we have N equal to 4. Furthermore, Kral et al. (2009) claim that the number of input variables must be at least two smaller than the number of statistical units. In our case, we have eight explanatory variables and 92 statistical units. It is recommended that 20 statistical units are applied to each variable, if it is difficult to follow, the recommendations say at least five units per variable. The final condition is that each group must necessarily be larger than the number of input variables, which is the case for each quality group.
The hypothesis of the equality covariance matrices was tested. Based on data from the Box’s M test in Table 13, the significance is above the significance level of 0.05; we retain the hypothesis that covariance matrices of individual groups of the quality culture are equal.
We tested the hypothesis of the equality of means among groups of the dependent variable at a significance level of 0.05. All values from the significance column should be below the determined significance level and thus may be used as relevant input variable in discriminant analysis. Comparing significance (Table 14) to the significance level; we reject the hypothesis of equality and accept the hypothesis that the means among the groups of the quality culture are not equal for all independent variables.

3.2.3. Discriminant Analysis

Testing of Hypothesis 5. We test the hypothesis of the existence of a significant discriminant function differentiating quality cultures at the significance level of 0.05, which is compared to the Sig. (Significance). Based on data in Table 15, we accept the hypothesis that a significant discriminant function differentiating quality cultures exists. The stepwise method of discriminant analysis running in three steps detected three significant variables from among the eight variables entered. The value of canonical correlation is very high and the value of percentages of explained variance is as well. These attributes mark that functions sufficiently and strongly differentiate individual quality cultures from each other. Table 16 shows significant variables that have not been removed from the function: the improvement and assurance of quality, the use of information and overall effectiveness. □
The improvement and assurance of quality has the highest value of correlation (correlation coefficient) as shown in Table 15, which means this factor has the highest classification ability from all significant variables.
The final notation of the model of the classification of the quality culture in the conditions of Slovak manufacturing enterprises is:
Z - score = 11.628 + 1.439   Improvement   and   assurance   of   quality + 1.007   Use   of   information + 0.442   Overall   effectiveness
The classification of the enterprises to the individual quality culture is made based on the comparison of the achieved Z-score and the value of the centroid. The centroids symbolise the characteristic points that represent the position of each quality culture of the enterprise within the identified classification function. The representative values of centroids for individual quality culture are shown in Table 17.
To verify the classification ability of the model formed, we use Equation (4) to predict the classification of the test group of the enterprises (20% of the sample) compared to individual quality culture as identified from the survey. The total classification ability of the model is 80%.
IBM SPSS software has implemented the function of the validation of the original group (80% of the sample) and cross-validation. 85.4% of original grouped cases are correctly classified and 83.3% are cross-validated. All classification results are demonstrated in Table 18.
In our case, the discriminant analysis generated three significant discriminators: the improvement and assurance of quality, the use of information and the overall effectiveness.

4. Discussion

Firstly, we compare our results to previous research undertaken by Cameron and Sine (1999) and Jancikova (2008) because the same questions were used in the survey. The levels of the quality culture are differentiated by the approach to the use of the information about the expectations and the satisfaction of the customer, the quality of the product and the production quality, the cost items, the reasons for success or its shortcomings. This content is captured as the use of information and proved to be significant in both Slovak and American research (Table 19). More developed quality cultures focus on quality as a strategic advantage, engaging employees and giving them greater powers. Quality teams are founded, and enterprises focus on improvement and the assurance of quality. They come with quality-improving reports, and stories of the improvement are shared within the enterprise. Quality has its own plans, management and goals. This description of these activities is involved in a variable called improvement and the assurance of quality. It is a statistically significant factor in all analysed research. The last significant factor in our discriminant function is the overall effectiveness of the enterprise, which is identical to the content of the excellence used in Czech research (Table 19). This factor is characterised by its orientation to high quality, which gains a new definition. Organisational culture and the strategy of the enterprise are no longer separate. The preferences of the customers are created through the provision of the services beyond their expectations. New loyalty of the employees is thereby created. The work of the employees is consistent, production is characterised by minimal repairs and reworking of the products, and work absenteeism is also minimal. There is a high degree of teamwork within the department as well as in cooperation between the departments. As indicated by the label and the content of the variable in Czech research, this factor is aimed at achieving excellence and world-class quality. Comparing the significant discriminant variables, we have two common variables in the case of the identified American function as well as in the case of the determined Czech function. Slovak enterprises should pay attention to the significant factors detected to ease their effort to absorb and adopt the principles of Industry 4.0.
All three functions have the same position of the centroids for the individual quality culture. Comparing our research and that of Cameron and Sine (1999) and Jancikova (2008), there is a clear intersection in Table 20. The centroid positions of the two less developed quality cultures are found in the negative part, while the opposite position of the centroids of the two more advanced cultures are oriented in the positive part.
Srinivasan and Kurey (2014) support the connection between quality culture and Industry 4.0 and their study confirms that an excellent quality environment can be created through a true culture where every employee has a passion to imbue rather than simply follow mundane rule-based techniques, such as quality control tools or imitation of best procedures and practices.
Mohelska and Sokolova (2018) also do not focus on technical aspects, but rather managerial approaches for Industry 4.0. According to their findings, Czech respondents perceive the organisational culture in the organisations under review as more bureaucratic and supportive than innovative. In their view, the signs of innovative culture are not so striking. It is necessary to change managerial approaches to support innovative solutions. Quality culture is one of the possible innovative solutions.
A limitation of our research is that we focus on only creating positive quality culture, but other authors discuss further possible solutions for manufacturing enterprises to prepare for Industry 4.0.
Ghobakhloo (2018) discusses the fact that manufacturers who are transitioning into Industry 4.0 need to devise new marketing strategies, and the assessment of their level of digital market maturity is the first step for this purpose, and describes modern marketing strategies such as market sensing and learning strategy as well as data-driven marketing, which is coupled with blockchain-based platforms and smart contracts. Wu (2015) emphasis that an IT governance team should perform a detailed analysis of existing IT infrastructure (e.g., networks, computer hardware and software, sensors, controllers and actuators) and identify the most meaningful approach for using them in support of Industry 4.0 transition. Hamid et al. (2018) highlight the effective application of a reinvestment allowance that was designed to support Industry 4.0. Tolstykh et al. (2018) suggest the creation of a laboratory which will allow manufacturing enterprises to carry out analysis, assessment and engineering of existing processes from the perspective of digitalisation, performance, project orientation and efficiency. Telukdarie et al. (2018) propose global standardisation and inter-functional integration. They deal with a global system approach, as defined by Industry 4.0 (vertical, horizontal and total business integration).
We consider the following areas as potential directions for further progress on this topic:
  • An extension of the areas of interest to the service enterprises and public organisations.
  • An extension of the areas of interest to businesses that have not implemented a certain quality management system.
  • Characterisation of a comprehensive framework of the quality culture in the era of Industry 4.0 through active cooperation with the business sphere.

5. Conclusions

Industry 4.0 is no longer a “future trend” and many leading enterprises have placed it at the centre of their strategic agenda; those manufacturers who are able to catch up will benefit from the competitive advantages that are available to the early adopters (Ghobakhloo 2018). Developed quality cultures enable enterprises to adapt to Industry 4.0. The current knowledge of the level of quality culture in Slovak conditions is highly insufficient. For this reason, the identified gap can be filled at least in part with the results of the article. We have confirmed the existence of a medium dependency between the quality concepts and the quality cultures. We emphasise the creation of a methodology for identifying a characteristic quality culture for each quality concept. Based on the methodology, we have indicated the fact that error detection culture is typical for manufacturing companies that follow at least one sectoral standard. For manufacturing companies that have at least one ISO standard implemented, a typical quality approach is defined by an error prevention culture. Manufacturing companies tending towards the TQM philosophy prefer a creative quality culture. Part of the article concerning the formation of a model quality culture in the era of Industry 4.0 detects significant factors that differentiate individual quality culture in the Slovak Republic. Manufacturing enterprises should focus their attention on the improvement and assurance of quality, the use of the information and its overall effectiveness.
The future research is focused on the adaptation of Industry 4.0 to all enterprises on the national market, not only to manufacturing enterprises implementing at least one quality concept, which is considered to be the limitation of the study. A comprehensive view of the topic will be necessary to extent the scope to the service enterprises, public organisations and, lastly, to enterprises that have not implemented any quality concept. The final aim related to this topic will be creating a detailed description of the model of the status of the quality culture in the era of Industry 4.0 with proactive and flexible cooperation with successful Slovak adopters to Industry 4.0.

Author Contributions

Conceptualization P.D. and G.L.; methodology. P.D. and W.S.; software. P.D. and V.S.; validation. P.D. and V.S.; formal analysis. P.D. and P.K.; investigation. P.D.; resources. P.D. and G.L.; data curation. P.D.; writing—original draft preparation. P.D.; writing—review and editing. G.L. and W.S.; visualization. P.D. and V.S.; supervision. G.L. and W.S.; project administration. P.D. and P.K.; funding acquisition. P.D. and P.K.

Funding

This research received no external funding.

Acknowledgments

This research was financially supported by the Slovak Research and Development Agency—Grant NO. APVV-15-0505 Integrated model of management support for building and managing the brand value in the specific conditions of the Slovak Republic.

Conflicts of Interest

The authors declare no conflict of interest.

Appendix A

Table A1. Cross-tabulation of quality culture and quality concept (expected counts).
Quality ConceptQuality CultureTotal
Quality Culture 1
(Absence of Emphasis on Quality)
Quality Culture 2
(Error Detection Culture)
Quality Culture 3
(Error Prevention Culture)
Quality Culture 4
(Creative Quality Culture)
Sectoral Standards2.65.19.35.122
ISO standards9.618.634.118.681
Total Quality Management2.75.39.75.323
Total15295329126
Table A2. Rotated component matrix.
Component
Question12345678
Question 660.6540.1380.0650.090.3530.2220.1880.168
Question 570.6510.1800.2860.0980.2360.154−0.0420.065
Question 640.6480.1960.2350.0870.4070.1870.0940.137
Question 560.6390.3070.2370.0640.2670.2890.0920.065
Question 760.6310.2280.2560.2920.0570.1030.1130.141
Question 800.6300.1080.0780.3350.2020.3380.1430.182
Question 780.6190.1320.1210.4840.1240.1450.0290.122
Question 620.6190.4310.3770.1390.0760.0010.1150.137
Question 600.6100.2340.3960.2210.2330.1560.1020.01
Question 770.5910.2620.2160.4490.0050.1850.1560.064
Question 720.5780.3860.3070.2730.1650.2260.0930.091
Question 670.5750.3420.1060.0390.1260.1750.1900.070
Question 750.5640.2970.2810.240−0.1230.1360.3910.066
Question 790.5480.2360.2880.3240.1590.2350.0970.017
Question 580.5310.0180.3390.2350.4860.0660.0520.131
Question 730.5160.3240.3090.3890.0250.1390.0910.267
Question 1120.4910.4850.1110.166−0.0090.1550.2030.111
Question 290.4890.2350.4750.2540.0970.192−0.0010.060
Question 260.488−0.1270.4140.1510.1290.2320.217−0.004
Question 630.4330.3300.1990.3570.090.1750.3000.213
Question 650.4320.3470.0770.3430.0980.2430.0370.247
Question 300.4190.3170.2500.2940.3030.0760.2240.061
Question 850.0430.7640.2190.1760.1270.1370.1360.152
Question 700.3600.7340.0970.0900.0970.1860.0610.105
Question 860.1640.7150.2690.0960.0080.1280.1610.105
Question 880.2690.7120.2080.1700.1490.0930.1810.182
Question 690.2800.6790.1200.2810.2000.2080.1470.132
Question 710.5160.5780.2540.0670.1200.194−0.0100.123
Question 870.1100.5410.3570.340.1150.2450.1260.042
Question 680.5340.5360.1090.0970.1220.068−0.0630.234
Question 360.1590.5200.3040.3250.3710.1150.201−0.079
Question 1010.2700.5190.1060.2920.2210.1810.3940.060
Question 910.1410.5190.3730.2720.1840.0350.0840.324
Question 920.2250.5130.3280.3460.2240.0350.1110.377
Question 1130.2930.5050.2090.2880.096−0.0720.360−0.021
Question 470.2670.4840.3410.3000.2910.2170.1950.037
Question 740.3390.4600.1890.2740.1120.3300.269−0.061
Question 440.3420.4450.0830.1780.3740.2400.1740.180
Question 980.2970.4260.1700.2510.2960.2310.187−0.200
Question 550.3260.4180.0600.2380.2400.3840.1310.212
Question 380.2270.1330.8270.1680.0020.0540.0030.140
Question 490.2960.1280.8090.1450.0390.12−0.0130.104
Question 480.1530.2110.7190.0720.240.1510.065−0.066
Question 370.2100.1370.7110.1330.2410.025−0.013−0.196
Question 240.2510.3010.7070.064−0.0060.2460.0550.161
Question 250.2440.2860.7040.121−0.0170.2770.0640.072
Question 310.1990.2740.6690.1380.067−0.0370.0590.050
Question 590.5190.2580.5820.0640.1960.1320.052−0.060
Question 330.3350.1670.524−0.0150.046−0.0870.0490.003
Question 89−0.098−0.1540.510−0.3080.0520.1200.1860.123
Question 99−0.2370.0000.495−0.114−0.324−0.0250.1360.030
Question 230.2110.3370.3710.0270.3540.3320.013−0.079
Question 280.1390.2530.3470.1820.2440.3130.218−0.007
Question 940.265−0.0220.0130.6490.231−0.0110.2800.304
Question 1100.1020.2950.1830.6370.0740.1640.0850.247
Question 1140.2710.258−0.0090.6100.1690.1510.2410.027
Question 320.2130.2310.0360.5930.3550.2920.1510.077
Question 950.4100.2150.1300.5620.2330.1750.2160.256
Question 820.1710.283−0.0480.5600.3070.3650.1670.264
Question 810.1270.119−0.0450.5520.2290.3060.1970.162
Question 830.2560.293−0.0160.5270.3140.3220.2320.150
Question 1020.1460.4360.1100.5160.2030.0000.4490.047
Question 930.0520.2950.3500.505−0.0120.0710.1580.359
Question 1030.2260.4550.1130.4980.1700.1470.272−0.018
Question 1110.3380.3570.1110.4700.1120.1720.4250.200
Question 350.2950.0760.2810.4670.3360.2590.2210.201
Question 900.2250.2500.3580.4650.1070.064−0.0330.305
Question 960.1030.0900.2420.4030.058−0.1030.278−0.046
Question 340.2970.2680.3100.3860.2460.3600.1980.100
Question 1000.3660.2340.2130.3720.330.0320.2270.209
Question 42−0.0350.184−0.0160.2540.6660.1740.1000.294
Question 410.3330.1060.2270.2220.6290.1680.1150.195
Question 400.3630.1270.2510.1290.6230.1990.1440.084
Question 610.2700.3230.1350.2880.5870.1170.1720.236
Question 390.2650.0580.4440.0700.5130.2910.0960.087
Question 430.2070.202−0.0610.2890.5020.1950.2890.352
Question 530.0940.2470.0580.1910.4960.4110.0640.239
Question 840.2510.241−0.0630.3330.4010.3400.1360.306
Question 510.3130.1520.1970.0220.2540.7030.1820.158
Question 520.2810.1850.1520.1520.1940.6130.1680.145
Question 460.2780.3010.2420.3300.1660.6020.1220.042
Question 220.3520.1390.2030.2710.1110.5350.1440.308
Question 450.2790.2840.3550.3330.1110.5120.1300.122
Question 500.2350.0600.4170.0140.2320.5050.1110.134
Question 540.2140.302−0.0670.2790.3500.4630.1660.347
Question 270.3800.2520.1290.2080.3150.3930.2720.263
Question 970.3000.2470.2860.1620.2760.3010.2730.006
Question 1070.0280.1160.0280.271−0.0110.0460.7590.059
Question 105−0.0030.1950.1300.1780.0610.2750.7320.013
Question 1090.1280.142−0.0110.1170.3540.0890.6910.268
Question 1080.1580.0930.1040.1030.1120.0060.6660.362
Question 1060.1730.1480.0870.1230.1420.2680.6070.192
Question 1040.1730.3470.0510.2730.0720.3900.4940.056
Question 190.1050.1790.0330.1940.2100.2200.2350.729
Question 180.1460.081−0.090.2380.2160.1940.3110.717
Question 210.2390.1290.2520.1770.2410.1280.1570.616
Question 200.2440.3370.0980.2960.310.1360.0890.500
Bolt values indicate the highest saturation of questions with the component.
Table A3. Stratified dividing of the sample.
Quality Culture80%20%100%
Quality Culture 1 (absence of emphasis on quality)12315
Quality Culture 2 (error detection culture)23629
Quality Culture 3 (error prevention culture)421153
Quality Culture 4 (creative quality culture)19524
Total9625121

References

  1. Abakumova, Juliet, and Olena Primierova. 2018. Globalization, growth and inequality: Testing causality and asymmetries. Ekonomicko-Manazerske Spektrum 12: 83–95. [Google Scholar]
  2. Adam, Everett E., Jr., Lawrence M. Corbett, and Boo H. Rho. 1994. Quality improvement practices in Korea, New Zealand and the USA. International Journal of Quality & Reliability Management 11: 6–18. [Google Scholar]
  3. Ahmad, Ishtiaq, Judit Oláh, József Popp, and Domicián Máté. 2018. Does Business Group Affiliation Matter for Superior Performance? Evidence from Pakistan. Sustainability 10: 3060. [Google Scholar] [CrossRef]
  4. Amin, Muslim, Abdullah Mohamed Aldakhil, Chengzhong Wu, Sajad Rezaei, and Cihan Cobanoglu. 2017. The structural relationship between TQM, employee satisfaction and hotel performance. International Journal of Contemporary Hospitality Management 29: 1256–78. [Google Scholar] [CrossRef]
  5. Androniceanu, Armenia. 2017. The three-dimensional approach of Total Quality Management, an essential strategic option for business excellence. Amfiteatru Economic 19: 61–78. [Google Scholar]
  6. Baird, Kevin, Kristal J. Hu, and Robert Reeve. 2011. The relationships between organizational culture, TQM practices and operational performance. Journal of Operation & Production Management 31: 789–814. [Google Scholar]
  7. Barney, Jay B. 1986. Organizational culture—Can it be a source of sustained competitive advantage. Academy of Management Review 11: 656–65. [Google Scholar] [CrossRef]
  8. Barrett, Brendan, and Dianne Waddell. 2001a. Quality culture and its impact on quality performance: Part 1. Quality Australia 15: 1–11. [Google Scholar]
  9. Barrett, Brendan, and Dianne Waddell. 2001b. Quality culture and its impact on quality performance: Part 2. Quality Australia 15: 1–12. [Google Scholar]
  10. Bourke, Jane, and Stephen Roper. 2017. Innovation, quality management and learning: Short-term and longer-term effects. Research Policy 46: 1505–18. [Google Scholar] [CrossRef]
  11. Cameron, Kim S., and Carole K. Barnett. 2000. Organizational quality as a cultural variable: An empirical investigation of quality culture, processes, and outcomes. The Quality Movement and Organization Theory 271: 294. [Google Scholar]
  12. Cameron, Kim S., and Robert E. Quinn. 1999. Diagnosing and Changing Organizational Culture. Boston: Addison-Wesley, ISBN 0-201-33871-8. [Google Scholar]
  13. Cameron, Kim S., and Wesley Sine. 1999. Framework for organizational quality culture. Quality Management Journal 6: 7–25. [Google Scholar] [CrossRef]
  14. Campos, Anna C., Julio da Costa Mendes, Joao Albino Silva, and Patricia Ooom do Valle. 2014. Critical success factors for a total quality culture: A structural mode. Tourism & Management Studies 10: 7–15. [Google Scholar]
  15. Cao, Changxing, Ying Xiong, and Xi Zeng. 2005. A research on enterprise quality culture in supply chain. Paper presented at the 2005 International Conference on Innovation & Management, Wuhan, China, October 29–30. [Google Scholar]
  16. Cole, Robert E. 1999. Learning from the quality movement: What did and didn’t happen and why? California Management Review 41: 43–73. [Google Scholar] [CrossRef]
  17. Corbett, Lawrence M., and Kate N. Rastrick. 2000. Quality performance and organizational culture: A New Zealand study. International Journal of Quality and Reliability Management 17: 14–26. [Google Scholar] [CrossRef]
  18. Cronemyr, Peter, Ingela Backstrom, and Asa Ronnback. 2017. Quality culture deployment—Using behaviours to explain, diagnose and improve a quality culture. International Journal of Quality and Service Sciences 9: 498–518. [Google Scholar] [CrossRef]
  19. Dalenogare, Lucas S., Guilherme B. Benitez, Nestor F. Ayala, and Alejandro G. Frank. 2018. The expected contribution of Industry 4.0 technologies for industrial performance. International Journal of Production Economics 204: 383–94. [Google Scholar] [CrossRef]
  20. Dellana, Scott A., and Richard D. Hauser. 1999. Toward defining the quality culture. Engineering Management Journal 2: 11–15. [Google Scholar] [CrossRef]
  21. Domańska, Agnieszka. 2018. Cooperation between knowledge-based institutions and business: Empirical studies and network theories. Forum Scientiae Oeconomia 6: 81–94. [Google Scholar]
  22. Durana, Pavol. 2018. Global quality management systems in Slovak companies. Paper presented at the 18th International Scientific Conference Globalization and Its Socio-Economic Consequences, Rajecke Teplice, Slovakia, October 10–11. [Google Scholar]
  23. Fielden, Anna, Marian Grupac, and Peter Adamko. 2018. How users validate the information they encounter on digital content platforms: The production and proliferation of fake social media news, the likelihood of consumer exposure, and online deceptions. Geopolitics, History, and International Relations 10: 51–57. [Google Scholar]
  24. Gaigne, Carl, and Bruno Larue. 2016. Quality standards, industry structure, and welfare in a global economy. American Journal of Agricultural Economics 98: 1432–49. [Google Scholar] [CrossRef]
  25. Gambi, Lillian do Nascimento, Harry Boer, Mateus C. Gerolamo, Frances Jorgensen, and Luiz C. Ribeiro Carpinetti. 2015. The relationship between organizational culture and quality techniques, and its impact on operational performance. International Journal of Operations & Production Management 35: 1460–84. [Google Scholar]
  26. Garvin, David A. 1988. Managing Quality: The Strategic and Competitive Edge. New York: Free Press, ISBN 978-0029113806. [Google Scholar]
  27. Georgescu, Bogdan, Daniel Moise, and Anna F. Cruceru. 2018. Total quality management from the perspective of organizational culture. Paper presented at the 6th International Conference on Marketing and Business Development, Bucharest, Romania, June 14–16. [Google Scholar]
  28. Ghobakhloo, Morteza. 2018. The future of manufacturing industry: A strategic roadmap toward Industry 4.0. Journal of Manufacturing Technology Management 29: 910–36. [Google Scholar] [CrossRef]
  29. Gimenez-Espin, Juan A., Daniel Jimenez-Jimenez, and Micaela Martinez-Costa. 2013. Organizational culture for TQM. Total Quality Management & Business Excellence 24: 678–92. [Google Scholar]
  30. Goetsch, David L., and Stanley Davis. 2013. Quality Management for Organizational Excellence: Introduction to Total Quality. London: Pearson, ISBN 978-0132558983. [Google Scholar]
  31. Gunasekaran, Angappa, Nachiappan Subramanian, and Wai T. E. Ngai. 2019. Quality management in the 21st century enterprises: Research pathway towards Industry 4.0. International Journal of Production Economics 207: 125–29. [Google Scholar] [CrossRef]
  32. Hamid, Nadiah A., Fairus Halizam A. Hamzah, Rohaya M. Noor, and Norazah M. Azali. 2018. Determinats of reinvestment allowance (RA) tax incentive utilization in embracing Industry 4.0. Polish Journal of Management Studies 18: 94–104. [Google Scholar] [CrossRef]
  33. Handfield, Robert, and Soham Ghosh. 1994. Creating a total quality culture through organizational change: A case analysis. Journal of International Marketing 2: 7–36. [Google Scholar] [CrossRef]
  34. Harvey, Lee, and Bjorn Stensaker. 2007. Quality culture: Understandings, boundaries and linkages. European Journal of Education 43: 427–42. [Google Scholar] [CrossRef]
  35. Hauser, Richard D., and Scott A. Dellana. 1998. An empirical examination of the impact of corporate culture on total quality management. Paper presented at the 29th Annual Meeting of the Decision-Sciences-Institute, Las Vegas, NU, USA, November 21–24. [Google Scholar]
  36. Hebbar, Rakshita R., and Asish O. Mathew. 2017. Impact of quality culture on TQM practices and quality performance—A case study. Calitatea 18: 95–100. [Google Scholar]
  37. Hildebrandt, Steen. 1991. Quality culture and TQM. Journal of Total Quality Management 2: 1–16. [Google Scholar] [CrossRef]
  38. Ilies, Liviu, Horatiu C. Salagean, and Florin Estefan. 2015. The impact of quality culture on customer relationship. Empirical study in the industrial companies from the north-west of Romania. Paper presented at the 9th International Management Conference: Management and Innovation for Competitive Advantage, Bucharest, Romania, November 5–6. [Google Scholar]
  39. Ilies, Liviu, Horatiu C. Salagean, and Ioana Beleiu. 2017. The impact of quality culture and leadership on customer relationship in organizations from the Romanian metal construction industry. Amfiteatru Economic 19: 1050–63. [Google Scholar]
  40. Iqbal, Anam, and Muhammad Asrar-ul-Haq. 2018. Establishing relationship between TQM practices and employee performance: The mediating role of change readiness. International Journal of Production Economics 203: 62–68. [Google Scholar] [CrossRef]
  41. Jancikova, Alexandra. 2008. Organizační Kultura a Řízení Kvality. Ph.D. thesis, Masarykova Univerzita, Brno, Czech Republic. [Google Scholar]
  42. Jancikova, Alexandra, and Karel Brychta. 2009. TQM and organizational culture as significant factors in ensuring competitive advantage: A theoretical perspective. Economics & Sociology 2: 80–95. [Google Scholar]
  43. Kaiser, Henry F., and John Rice. 1974. Little Jiffy Mark IV. Educational and Psychological Measurement 34: 111–17. [Google Scholar] [CrossRef]
  44. Kamble, Sachin S., Angappa Gunasekaran, and Shradha Gawankar. 2018. Industry 4.0 framework: A systematic literature review identifying the current trends and future perspectives. Process Safety and Environmental Protection 117: 408–25. [Google Scholar] [CrossRef]
  45. Kanji, Gopal K., and Alfred Wong. 1998. Quality culture in the construction industry. Total Quality Management 9: 133–40. [Google Scholar] [CrossRef]
  46. Kanovska, Lucie. 2018. Smart services and their benefits for manufacturers from a global perspective. Ekonomicko-Manazerske Spektrum 12: 46–56. [Google Scholar]
  47. Kliestik, Tomas, Maria Kovacova, Ivana Podhorska, and Jana Kliestikova. 2018a. Searching for key sources of goodwill creation as new global managerial challenge. Polish Journal of Management Studies 17: 144–54. [Google Scholar] [CrossRef]
  48. Kliestik, Tomas, Maria Kovacova, Katarina Valaskova, and Lucia Svabova. 2018b. Bankruptcy prevention: New effort to reflect on legal and social changes. Science and Engineering Ethics 24: 791–803. [Google Scholar] [CrossRef]
  49. Ko, Peiyi, and Martin Stein. 2018. Design methodologies for continuous improvement. Paper presented at the AHFE International Conference on Ergonomics in Design, Orlando, FL, USA, July 21–25. [Google Scholar]
  50. Konecny, Vladimir. 2017. Manažérstvo Kvality. Systémy, Princípy, Postupy. Žilina: EDIS, ISBN 978-80-554-1406-5. [Google Scholar]
  51. Kovacova, Maria, Tomas Kliestik, Pavol Kubala, Katarina Valaskova, Mladen Radisic, and Jelena Borocki. 2018. Bankruptcy models: Verifying their validity as a predictor of corporate failure. Polish Journal of Management Studies 18: 167–79. [Google Scholar] [CrossRef]
  52. Kovács, György, and Sebastian Kot. 2017. Economic and social effects of novel supply chain concepts and virtual enterprises. Journal of International Studies 10: 237–54. [Google Scholar] [CrossRef]
  53. Krajcsak, Zoltan. 2018. Successes of quality management systems through self-evaluation and commitment in different organizational cultures: A case study. Management Decision 56: 1467–84. [Google Scholar] [CrossRef]
  54. Kral, Pavol, Maria Kanderova, Alena Kascakova, Gabriela Nedelova, and Veronika Valencakova. 2009. Viacrozmerné Štatistické Metódy so Zameraním na Riešenie Problémov Ekonomickej Praxe. Banská Bystrica: Univerzita Mateja Bela, ISBN 978-80-8083-840-9. [Google Scholar]
  55. Kubíčková, Lea, Vladimír Hajko, Martina Rašticová, and Naďa Hazuchová. 2018. Active work participation of the Czech elderly. Acta Universitatis Agriculturae et Silviculturae Mendelianae Brunensis 66: 1287–93. [Google Scholar] [CrossRef]
  56. Kujala, Jaakko, and Paul Lillrank. 2004. Total quality management as a cultural phenomenon. The Quality Management Journal 11: 43–55. [Google Scholar] [CrossRef]
  57. Kull, Thomas J., and John G. Wacker. 2010. Quality management effectiveness in Asia: The influence of culture. Journal of Operations Management 28: 223–39. [Google Scholar] [CrossRef]
  58. Kuo, Tsuang, and Gwo Y. Tsai. 2019. The effects of employee perceived organisational culture on performance: The moderating effects of management maturity. Total Quality Management & Business Excellence 30: 267–83. [Google Scholar]
  59. Lo, Tommy Y. 2002. Quality culture: A product of motivation within organization. Managerial Auditing Journal 17: 272–76. [Google Scholar] [CrossRef]
  60. Luthra, Sunil, and Sachin K. Mangla. 2018. Evaluating challenges to Industry 4.0 initiatives for supply chain sustainability in emerging economies. Process Safety and Environmental Protection 117: 168–79. [Google Scholar] [CrossRef]
  61. Meyer, Natanya. 2018. South African Female Entrepreneurs’ Intention to Remain in Business. Ph.D. thesis, North-West University, Vanderbijlpark, South Africa. [Google Scholar]
  62. Meyer, Danie, and Natanya Meyer. 2016. The relationship between the creation of an enabling environment and economic development: A comparative analysis of management at local government sphere. Polish Journal of Management Studies 14: 150–60. [Google Scholar] [CrossRef]
  63. Meyer, Natanya, Danie Meyer, and Sebastian Kot. 2017. The development of a process tool for improved risk management in local government. Quality Access to Success 18: 425–29. [Google Scholar]
  64. Mohelska, Hana, and Marcela Sokolova. 2018. Management approaches for industry 4.0-the organizational culture perspective. Technological and Economic Development of Economy 24: 2225–40. [Google Scholar] [CrossRef]
  65. Moravcikova, Dominika, Anna Krizanova, Jana Kliestikova, and Martina Rypakova. 2017. Green marketing as the source of the competitive advantage of the business. Sustainability 9: 2218. [Google Scholar] [CrossRef]
  66. Muras, Wojciech. 2017. Leadership as a driver for innovative projects—Key challenges and winning. Forum Scientiae Oeconomia 5: 5–14. [Google Scholar]
  67. Nagy, Judit, Judit Oláh, Edina Erdei, Domicián Máté, and József Popp. 2018. The Role and Impact of Industry 4.0 and the Internet of Things on the Business Strategy of the Value Chain—The Case of Hungary. Sustainability 10: 3491. [Google Scholar] [CrossRef]
  68. Ogbonna, Emmanuel, and Lloyd C. Harris. 2000. Leadership style, organizational culture and performance: Empirical evidence from UK companies. International Journal of Human Resources Management 11: 766–88. [Google Scholar] [CrossRef]
  69. Ohanyan, Gurgen, and Armenia Androniceanu. 2017. Evaluation of IMF program effects on employment in the EU. Acta Oeconomica 67: 311–32. [Google Scholar] [CrossRef]
  70. Oliff, Harley, and Ying Liu. 2017. Towards Industry 4.0 utilizing data-mining techniques: A case study on quality improvement. Paper presented at the 50th CIRP Conference on Manufacturing Systems, Taichung, Taiwan, May 3–5. [Google Scholar]
  71. Ondra, Pavel, Davis Tucek, and Rastislav Rajnoha. 2018. The empirical quality management practices study of industrial companies in the Czech Republic. Polish Journal of Management Studies 17: 180–96. [Google Scholar] [CrossRef]
  72. Pakurár, Miklós, Hossam Haddad, János Nagy, József Popp, and Judit Oláh. 2019. The Service Quality Dimensions that Affect Customer Satisfaction in the Jordanian Banking Sector. Sustainabilty 11: 1113. [Google Scholar] [CrossRef]
  73. Palus, Hubert, Hana Matova, Anna Krizanova, and Jan Parobek. 2014. A survey of awareness of forest certification schemes labels on wood and paper products. Acta Facultatis Xylologiae Zvolen 56: 129–38. [Google Scholar]
  74. Panuwatwanich, Kriengsak, and Thanh T. Nguyen. 2017. Influence of organisational culture on total quality management implementation and firm performance: Evidence from the Vietnamese construction industry. Management and Production Engineering Review 8: 5–15. [Google Scholar] [CrossRef]
  75. Patyal, Vishal S., and Maddulety Koilakuntla. 2017. The impact of quality management practices on performance: An empirical study. Benchmarking-An International Journal 24: 511–35. [Google Scholar] [CrossRef]
  76. Pierzyna, Janusz. 2019. The use of EU funding in the development of local economic activity zones. Forum Scientiae Oeconomia 7: 85–102. [Google Scholar]
  77. Popescu, Ruxandra-Irina. 2018. Selling cultural organizations—A case study on client’s perception of the cultural activity of Calea Victoriei Foundation. Administratie si Management Public 31: 81–96. [Google Scholar] [CrossRef]
  78. Popescu, Gheorghe H., Irina E. Petrescu, Oana M. Sabie, and Mihaela Musat. 2018a. Labor-Displacing technological change and worldwide economic insecurity: How automation and the creation of innovative tasks shape inequality. Psychosociological Issues in Human Resource Management 6: 80–85. [Google Scholar]
  79. Popescu, Gheorghe H., Irina E. Petrescu, and Oana M. Sabie. 2018b. Algorithmic labor in the platform economy: Digital infrastructures, job quality, and workplace surveillance. Economics, Management, and Financial Markets 13: 74–79. [Google Scholar]
  80. Porter, Alan M. 1997. In some companies quality culture is tangible. Purchasing 122: 51–52. [Google Scholar]
  81. Prajogo, Daniel I., and Christopher M. McDermott. 2005. The relationship between total quality management practices and organizational culture. International Journal of Operations and Production Management 25: 1101–22. [Google Scholar] [CrossRef]
  82. Quezada, Luis E., Shun F. Chiu, Sergio E. Gouvea da Costa, and Kim H. Tan. 2017. Operational excellence towards sustainable development goals through Industry 4.0. International Journal of Production Economics 190: 1–2. [Google Scholar] [CrossRef]
  83. Rezankova, Hana. 2017. Analýza Dat z Dotazníkových Šetření. Průhonice: Professional Publishing, ISBN 9788090659483. [Google Scholar]
  84. Rimarcik, Marian. 2007. Štatistika pre Prax. Košice: Marián Rimarčík, ISBN 8096981311. [Google Scholar]
  85. Roy, Jonathan, Hebatalla Terfas, and Witold Suryn. 2017. On the use of ISO/IEC standards to address data quality aspects in Big Data Analytics cloud services. Paper presented at the 20th International Conference on Business Information Systems (BIS), Poznan, Poland, June 28–30. [Google Scholar]
  86. Sadaf, Rabeea, Judit Olah, Jozsef Popp, and Domician Mate. 2018. An investigation of the influence of the worldwide governance and competitiveness on accounting fraud cases: A cross-country perspective. Sustainability 10: 588. [Google Scholar] [CrossRef]
  87. Saunders, Mark, Philip Lewis, and Adrian Thornhill. 2012. Research Methods for Business Students. Upper Saddle River: Pearson Education Limited, ISBN 978-0273750758. [Google Scholar]
  88. Shan, Ang W., Mohd F. Ahmad, Nor Aziati B. A. Hamid, and Aida Mustapha. 2018a. The mediating effect of total productive maintenance (TPM) between total quality management (TQM) and business performance. Advanced Science Letters 24: 4657–60. [Google Scholar] [CrossRef]
  89. Shan, Ang W., Mohd F. Ahmad, Shiau W. Chan, Nik H. M. Nor, Hashim F. Bin, Mohd F. Hassan, and Nor A. A. Rahman. 2018b. Moderated mediation of innovation between Total Quality Management (TQM) and business performance. Advanced Science Letters 24: 9316–19. [Google Scholar] [CrossRef]
  90. Siderska, Julia, and Khair S. Jadaan. 2018. Cloud manufacturing: A service-oriented manufacturing paradigm. A review paper. Engineering Management in Production and Services 10: 22–31. [Google Scholar] [CrossRef]
  91. Sinclair, John, and David Collins. 1994. Towards a quality culture. International Journal of Quality & Reliability Management 11: 19–29. [Google Scholar]
  92. Singh, Ajay S., and Micah B. Masuku. 2014. Sampling techniques & determination of sample size in applied statistics research: An overview. International Journal of Economics, Commerce and Management 2: 1–22. [Google Scholar]
  93. Slusarczyk, Beata. 2018. Industry 4.0—Are we ready? Polish Journal of Management Studies 17: 232–48. [Google Scholar] [CrossRef]
  94. Srinivasan, Ashwin, and Bryan Kurey. 2014. Creating a culture of quality. Harvard Business Review 92: 23–25. [Google Scholar]
  95. Sudman, Seymour. 1976. Applied Sampling. New York: Academic Press, ISBN 9780126757507. [Google Scholar]
  96. Sujova, Andrea, and Ondrej Remen. 2018. Management of changes in business processes: An empirical study in Slovak enterprises. Engineering Management in Production and Services 10: 37–50. [Google Scholar] [CrossRef]
  97. Tari, Juan-Jose, Jose F. Molina-Azorin, Jorge Pereira-Moliner, and Maria D. Lopez-Gamero. 2018. The internalization of a sectorial standard for quality management: A qualitative analysis in tourism. In ISO 9001, ISO 14001, and New Management Standards. Edited by Inaki Heras-Saizarbitoria. Cham: Springer International Publishing AG, pp. 97–108. ISBN 978-3-319-65675-5. [Google Scholar]
  98. Telukdarie, Arnesh, Eyad Buhulaiga, Surajit Bag, Shivam Gupta, and Zongwei Luo. 2018. Industry 4.0 implementation for multinationals. Process Safety and Environmental Protection 118: 316–29. [Google Scholar] [CrossRef]
  99. Todorut, Amalia V., and Moise Bojnica. 2013. Total quality management and quality culture. Quality-Access to Success 14: 79–82. [Google Scholar]
  100. Tolstykh, Tatyana, Elena Shkarupeta, Yrii Kostuhin, and Anna Zhaglovskaya. 2018. Key Factors of manufacturing enterprises development in the context of Industry 4.0. Paper presented at the 31st International-Business-Information-Management-Association Conference, Milan, Italy, April 25–26. [Google Scholar]
  101. Vagner, Ladislav. 2016. Controlling as a competitiveness tool in the global market. Paper presented at the 16th International Scientific Conference on Globalization and its Socio-Economic Consequences, Rajecke Teplice, Slovakia, October 5–6. [Google Scholar]
  102. Vanagas, Povilas. 2005. The role of culture of quality for total quality management implementing in agricultural companies. Paper presented at the 2nd International Scientific Conference on Rural Development, Kaunas, Lithuania, November 17–19. [Google Scholar]
  103. Viljoen, Stephanus. J., and Cornelis C. van Waveren. 2008. An improved model for quantifying an organizational quality culture. Paper presented at the 2008 Portland International Conference on Management of Engineering & Technology (PICMET’08), Cape Town, South Africa, July 27–31; pp. 1781–89. [Google Scholar]
  104. Watson, Mary A., and Frank M. Gryna. 2001. Quality culture in small company: Four Case studies: How to determine the quality culture at a small company. Quality Progress 34: 41–47. [Google Scholar]
  105. Woods, John A. 1997. The six values of a quality culture. National Productivity Review 16: 49–55. [Google Scholar] [CrossRef]
  106. Wu, Sarah J. 2015. The impact of quality culture on quality management practices and performance in Chinese manufacturing firms. International Journal of Quality & Reliability Management 32: 799–814. [Google Scholar]
  107. Wu, Sarah J., Dongli Zhang, and Roger G. Schroeder. 2009. The impact of quality culture on quality practices customization. Paper presented at the 3rd International Conference on Operations and Supply Chain Management, Wuhan, China, July 28–August 5. [Google Scholar]
  108. Wu, Sarah J., Dongli Zhang, and Roger G. Schroeder. 2011. Customization of quality practices: The impact of quality culture. International Journal of Quality & Reliability Management 28: 263–79. [Google Scholar]
1
p-value = 0.00526 for 60.10% of the enterprises with sectoral standards.
2
p-value = 0.04779 for 50.12% of the enterprises with ISO standards.
3
p-value = 0.00335 for 61.58% of the enterprises with TQM.
Figure 1. Correspondence maps of quality concepts (row points) and quality culture (column points). (a) Correspondence map of row points (b) Correspondence map of column points.
Socsci 08 00124 g001
Figure 2. Common correspondence map of the quality concepts and the quality culture.
Socsci 08 00124 g002
Table 1. Cross-tabulation of quality culture and quality concept (observed counts).
Quality ConceptQuality CultureTotal
Quality Culture 1
(Absence of Emphasis on Quality)
Quality Culture 2
(Error Detection Culture)
Quality Culture 3
(Error Prevention Culture)
Quality Culture 4
(Creative Quality Culture)
Sectoral Standards2173022
ISO standards139481181
Total Quality Management0321823
Total15295329126
Table 2. Pearson chi-square test.
Pearson Chi-SquaredfNumber of Valid CasesSignificance
92.87861260.000
Table 3. Mantel–Haenszel test.
Mantel-Haenszel TestdfNumber of Valid CasesSignificance
30.21961260.000
Table 4. Cramer’s V and Pearson contingency coefficient.
Nominal by NominalValueNumber of Valid CasesSignificance
Cramer’s V0.6071260.000
Pearson contingency coefficient0.6511260.000
Table 5. Overview of row points.
Quality ConceptMassScore in DimensionInertiaContribution
12of Point to Inertia of Dimensionof Dimension to Inertia of Point
1212Total
SS0.1751.1091.2680.2980.3360.4890.4590.5411.000
ISO0.6430.126−0.5520.1190.0160.3410.0550.9451.000
TQM0.183−1.5050.7300.3200.6480.1700.8250.1751.000
Active total1.000 0.7371.0001.000
Table 6. Overview of column points.
Quality CultureMassScore in DimensionInertiaContribution
12of Point to Inertia of Dimensionof Dimension to Inertia of Point
1212Total
QC10.1190.403−0.5390.0320.0300.0600.3840.6161.000
QC20.2300.8351.1290.2710.2510.5110.3790.6211.000
QC30.4210.189−0.6980.1270.0230.3570.0750.9251.000
QC40.230−1.3880.4250.3070.6950.0720.9220.0781.000
Active total1.000 0.7371.0001.000
Table 7. The enterprises with sectoral standards implemented.
The Enterprises with Sectoral Standards Implemented
Null hypothesis (H0):π0 = 0.5; QC2 is implemented in 50% of enterprises with SS.
Alternative hypothesis (H1):π0 = 0.5; QC2 is implemented in more than 50% of enterprises with SS.
Level of significance (α) =0.05
Distribution of the sample can be approximated by a normal distribution:Yes, both conditions are met.
Test statistic (T) =2.5584
Critical value of standard normal distribution (Z) =1.6449
Comparison T to Z value:|2.5584| > 1.6449
Decision:H0 rejected and H1 accepted, QC2 is implemented in more than 50% of enterprises with SS.1
Table 8. The enterprises with ISO standards implemented.
The Enterprises with ISO Standards Implemented
Null hypothesis (H0):π0 = 0.5; QC3 are implemented in 50% of enterprises with ISO standards.
Alternative hypothesis (H1):π0 = 0.5; QC3 is implemented in more than 50% of enterprises with ISO.
Level of significance (α) =0.05
Distribution of the sample can be approximated by a normal distribution:Yes, both conditions are met.
Test statistic (T) =1.6667
Critical value of standard normal distribution (Z) =1.6449
Comparison T to Z value:|1.6667| > 1.6449
Decision:H0 rejected and H1 accepted, QC3 is implemented in more than 50% of enterprises with ISO standard.2
Table 9. The enterprises with TQM philosophy implemented.
The Enterprises with TQM Philosophy Implemented
Null hypothesis (H0):π0 = 0.5; QC4 is implemented in 50% of enterprises with TQM.
Alternative hypothesis (H1):π0 = 0.5; QC4 is implemented in more than 50% of enterprises with TQM.
Level of significance (α) =0.05
Distribution of the sample can be approximated by a normal distribution:Yes, both conditions are met.
Test statistic (T) =2.7107
Critical value of standard normal distribution (Z) =1.6449
Comparison T to Z value:|2.7107| > 1.6449
Decision:H0 rejected and H1 accepted, QC4 is implemented in more than 50% of enterprises with TQM.3
Table 10. Kaiser-Meyer-Olkin (KMO) measure and Bartlett’s test.
KMO Measure of Sampling Adequacy0.856
Bartlett’s test of sphericityApprox. chi-square13,927.553
df4656
Significance0.000
Table 11. Total variance explained.
ComponentInitial EigenvaluesContent
Total% of VarianceCumulative %
142.91544.24244.242Improvement and assurance of quality
26.2526.44650.688Assessment, rewarding and training of employees
33.5033.61154.299Use of information
43.0013.09457.393Satisfaction of customers and employees
52.4472.52359.916Collection of information
62.2592.32962.245Benchmarking
71.9361.99664.241Overall effectiveness
81.7391.79366.034Priorities of management
Table 12. Cronbach’s alpha.
VariableNumber of ItemsCronbach’s Alpha
With OutliersWithout Outliers80% of the Sample20% of the Sample
Variable 1220.9660.9670.9650.977
Variable 2180.9590.9590.9600.962
Variable 3130.9130.9120.8690.897
Variable 4170.9470.9490.9520.941
Variable 580.9050.9050.9240.886
Variable 690.9220.9200.9170.899
Variable 760.8760.8810.8980.812
Variable 840.8980.9000.8820.839
Table 13. Box’s M test.
Box’s M12.999
FApprox.1.183
df19
df2320.184
Significance0.305
Table 14. Wilks’ Lambda.
VariableWilks’ LambdaFdf1df2Significance
Variable 10.234100.1323920.000
Variable 20.32663.3203920.000
Variable 30.32862.9453920.000
Variable 40.42541.4583920.000
Variable 50.51728.6673920.000
Variable 60.36653.1743920.000
Variable 70.57322.8773920.000
Variable 80.62718.2693920.000
Table 15. Canonical correlation and the significance of discriminant function.
EigenvalueCanonical Correlation% of VarianceWilks’ LambdaChi-SquaredfSignificance
5.1240.91590.30.100210.29690.000
Table 16. The unstandardised coefficients and correlations.
VariableCoefficientCorrelationContent
Variable 11.4390.784Improvement and assurance of quality
Variable 31.0070.600Use of information
Variable 70.4420.326Overall effectiveness
Constant−11.628--
Table 17. The centroids of quality cultures.
Quality CultureCentroid
Quality Culture 1 (absence of emphasis on quality)−2.717
Quality Culture 2 (error detection culture)−1.965
Quality Culture 3 (error prevention culture)0.074
Quality Culture 4 (creative quality culture)3.932
Table 18. Classification results.
Quality CulturePredicted Group MembershipTotal
QC1QC2QC3QC4
Original group (80% of the sample)CountQC1930012
QC21202023
QC30634242
QC40001919
%QC175.025.00.00.0100.0
QC24.387.08.70.0100.0
QC30.014.381.04.8100.0
QC40.00.00.0100.0100.0
Cross-validatedCountQC1930012
QC22192023
QC30733242
QC40001919
%QC175.025.00.00.0100.0
QC28.782.68.70.0100.0
QC30.016.778.64.8100.0
QC40.00.00.0100.0100.0
20% of the sampleCountQC130003
QC214106
QC3009211
QC400145
%QC1100.00.00.00.0100.0
QC216.766.716.70.0100.0
QC30.00.081.818.2100.0
QC40.00.020.080.0100.0
Table 19. Comparison of significant variables.
American ResearchCzech ResearchSlovak Research
Information useImprovement of qualityImprovement and assurance of quality
Information and analysisExcellenceUse of information
Customer satisfactionTraining of employees and quality management objectivesOverall effectiveness
Quality assuranceAttitudes and work morale-
Quality tools--
Table 20. Comparison of centroids.
Quality CultureAmerican ResearchCzech ResearchSlovak Research
Quality Culture 1 (absence of emphasis on quality)−4.97−2.706−2.717
Quality Culture 2 (error detection culture)−0.45−0.595−1.965
Quality Culture 3 (error prevention culture)0.230.6080.074
Quality Culture 4 (creative quality culture)1.311.3553.932

