Abstract
The industrial linkages and supply effects of the U.S. Research and Development (R&D) sector are examined using the input-output approach. Although the U.S. has the highest R&D intensity among major OECD countries, the U.S. R&D sector has relatively low backward and forward linkages to other industrial sectors. Moreover, the supply investment effect of the U.S. R&D sector is the least, showing that the sector is not likely to stimulate the production of the other sectors. The supply shortage effect of the U.S. R&D sector is also the least among the countries. The findings in this study imply that improving the linkages and supply effects of the R&D sector may be more important than increasing only the amount of R&D expenditure in the U.S.
1. Introduction
The investment in Research and Development (R&D) is a source of innovation for productivity growth beyond the technological frontier. Since R&D stimulates creative activities increasing knowledge stock, the considerable investment in R&D is expected to contribute to the sustainable economic growth (Bayoumia et al. 1999; Griffith et al. 2004; Sveikauskas 2007). According to the Organization for Economic Cooperation and Development (OECD), the gross domestic spending on R&D (i.e. the total expenditure on R&D in a country) is regarded as the main indicator of determining the extent to which the country carries out innovative activities (Yamano and Ahmad 2006). Figure 1 shows the R&D intensity measured as the ratio of the gross domestic spending on R&D to the gross domestic product and all countries involved in the OECD have increased the expenditure on R&D since 1985. Some countries such as France, Germany, Italy, Japan, the U.K., and the U.S. have varied between 1985 and 2013.
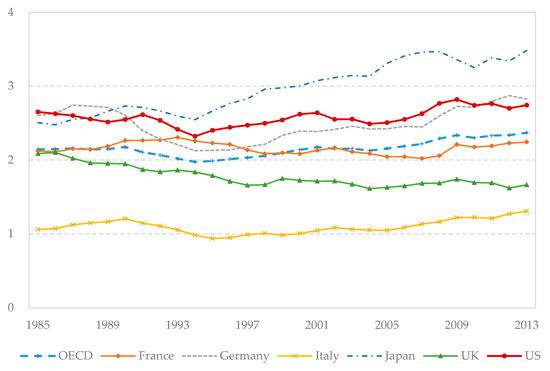
Figure 1.
Research & Development (R&D) Intensity in Major Organization for Economic Cooperation and Development (OECD) Countries (OECD 2013).
The U.S. is well-known as the most innovative country in the world. Due to the interest in R&D, the U.S. spent about 433 billion dollars in 2013, which was over twice the 204 billion dollars spent in 1985. The R&D intensity remains the highest among the OECD countries, while it slightly increased from 2.65% to 2.74% over the period (Figure 1). The U.S. R&D was achieved by multiple performers, such as private businesses, universities and colleges, the federal government, nonfederal government agencies, and other nonprofit organizations. According to National Science Foundation (NSF), private businesses were the largest performer in 2013, accounting for about 70% of total R&D. The activities of private businesses have been dominant in the composition of national R&D. Academia such as university and colleges were the second-largest performer of total R&D, which accounted for about 15% in 2013. The rest of total R&D was conducted by the federal government, nonfederal government agencies, and other nonprofit organizations.
Many studies in the literature highlighted the positive spillover effects of R&D expenditure. The government expenditure for R&D contributes to the economic growth (Sylwester 2001), while policy incentives for R&D also led to an increase in business R&D spending (Falk 2006). The R&D conducted by universities, in particular, have raised business R&D spending, showing that public and private R&D activities are complements (Falk 2006). Moreover, the R&D intensity is typically related to technological progress and its increase contributes to industrial linkages (Wolff and Nadiri 1993; Wolff 1997). The R&D activities improve firms’ productivity and generate innovate knowledge linked to technological improvement (Los and Verspagen 2000; O’Mahony and Vecchi 2009).
However, the literature has paid little attention to the linkages and supply effects of the R&D sector itself. It is questionable how much the activities of the U.S. R&D sector are related to the productivity growth in other industrial sectors. Along with the public R&D expenditure, it is requisite that the R&D sector be linked strongly with other industrial sector to stimulate innovative activities and creative knowledge. Unless there is little linkage between the R&D sector and other relevant sectors, only the public R&D expenditures or activities may not be enough for increasing the use of creative knowledge for the sustainable growth in the economy.
To examine the U.S. R&D sector itself, this study investigates the industrial linkages and supply effects of the U.S. R&D sector using the input-output (I-O) approach. Specifically, the I-O model identifies the extent to which the R&D sector is linked to other sectors and examines the supply investment and shortage effects of R&D products on the production of other industrial sectors. In addition, this study compares these linkages and supply effects with those of major OECD countries leading global economy in order to understand the relative strength of the U.S. R&D sector. As Hauknes and Knell (2009) highlighted the importance of the direct and indirect spillovers of knowledge between different industries for economic growth, this study contributes to understanding the extent to which the R&D sector itself is associated well with other industrial sectors for production, diffusion, and use of advanced technology.
This paper is organized as follows. Section 2 provides a brief description about the I-O model such as the demand-driven and supply-driven models. In Section 3, data description is provided to understand the R&D sector defined by the OECD, and empirical results are provided to examine the industrial linkages and supply effects of the U.S. R&D sector on other sector in major OECD countries. Finally, a discussion and conclusion are given in Section 4.
2. Methods: Input-Output Model
This section introduces the demand-driven and supply-driven models (Rasmussen 1956; Ghosh 1958; Jones 1976; Miller and Blair 2009; Leontief 1996; Han et al. 2004; Reis and Rua 2009).
2.1. Demand-Driven Model
The basic balance equation for the demand-driven model is written as
for sectors where is the total gross outputs of sector , and is the final demands for products of sector for . In Equation (1), represents the inter-industrial purchases of sector from sector . Dividing by , we obtain indicating the technical coefficients. Equation (1) can be written in a matrix form as where , , and indicate the matrices for the total gross outputs, the technical coefficients, and the final demands, respectively. In addition, is the identity matrix, and is the Leontief or input inverse matrix that shows the direct and indirect output requirements of sector per one unit of final demand of sector (Leontief 1996).
By summing up the elements in the column of the input inverse matrix, measures the total outputs generated from one-unit final demand for sector where is the th element of . This is the output multiplier that shows backward linkage of sector (Rasmussen 1956). The output multiplier measures how a unit-change in the final demand for each sector affects total outputs of all sectors. Also, dividing the average of elements in column of the output inverse matrix by the average of all elements yields
which is the normalized backward linkage. If is greater than unity, then a unit-increase in final demand for the output of sector will result in an above-average increase in the relevant activities in the economy.
In order to examine the influence of new production activity in the R&D sector on other sectors, the R&D sector has to be considered exogenous and separated into the final demand (Miller and Blair 2009). When we consider that and are related to the R&D sector, the new balance equation is written as where the matrices with subscript are obtained by subtracting the R&D sector from the original matrix. Assuming there is no change in the final demand yields
which identifies the production-inducing effects of a change in the supply investment of the R&D sector on the outputs of other sectors. This is referred to as the supply investment effect of the R&D sector on other sectors.
2.2. Supply-Driven Model
For sectors, the basic balance equation for supply-driven model is given by
where is the total gross outputs of sector , and is the final value added by sector for . Dividing by , we obtain indicating the allocation coefficients. Equation (4) can be written in a matrix form as where , , and indicate the matrices for the total gross outputs, the allocation coefficients, and the final values added, respectively. In addition is the Ghoshian or output inverse matrix that shows the direct and indirect requirements in sector per unit of final value added in sector (Ghosh 1958).
Summing up the elements in the row of the output inverse matrix yields that is the input multiplier reflecting the forward linkage of sector (Jones 1976). The input multiplier measures how a unit-change in primary inputs of each sector influences the total outputs of all sectors. Dividing the average of elements in row of the matrix by the average of all elements yields
which is the normalized forward linkage. If is greater than unity, then a unit-decrease in the available inputs to sector will result in an above-average decrease in the associated economic activities.
In the similar way used in the demand-driven model, treating the R&D sector as yields
which evaluates the effects of a unit shortage in the R&D sector on the output of other sectors. This is referred to as the supply shortage effect of the R&D sector on other sectors.
3. Data and Results
Data are collected from the I-O database published by the OECD. The OECD I-O database covers 37 industrial sectors of 37 countries, 28 OECD countries, and nine non-OECD countries (Yamano and Ahmad 2006). The OECD designates seven countries as major OECD countries: France, Germany, Italy, the U.K., the U.S., and Canada. For the purpose of concordance with industry classification, Canada is excluded in this analysis because the I-O table for Canada does not separate the R&D sector from the sectoral list. Accordingly, the aggregate I-O tables of six major OECD countries are selected for the mid-2000s to compare the industrial linkages of the R&D sector in the OECD countries.
According to OECD (2013), the R&D sector covers research and development in natural sciences and engineering, which includes creative work in the various types of activities in natural sciences, medical sciences, agriculture, and engineering and technology. The main three types of activities include basic research, applied research, and experimental development. The basic research is related to the achievement of basic, experimental or theoretical knowledge without empirical applications, and the applied research is relevant to obtaining new practical knowledge. The experimental development is associated with producing and improving new materials, products, devices, etc. In addition to natural sciences and engineering, the sector also includes research and development in social sciences and humanities.
Based on the selected database, Table 1 and Table 2 present two types of linkages of the R&D sector of the selected countries. In Table 1, all the backward linkages are less than unity, which implies a unit-increase in final demand for the R&D sector generates a below-average increase in activity in the economy. Specifically, the backward linkage of the U.S. R&D sector is about 0.88. Although the R&D sector is linked strongly with the sector related to motor vehicles, trailers and semi-trailers (1.41), it is linked weakly with private households with employed persons (0.49). The U.S. R&D sector’s backward linkage is comparable with those of the other countries. The backward linkage of the R&D sector of France (0.99) is higher than the other countries, whereas that of Japan is the lowest (0.77). The backward linkage of the U.S. R&D sector is lower than those of France and Germany, but it is higher than Italy, Japan, and U.K.

Table 1.
Normalized Backward Linkage in Major OECD Countries.
Table 2.
Normalized Forward Linkage in Major OECD Countries.
On the other hand, in Table 2, all the forward linkages of the R&D sector are greater than unity, showing that a unit-decrease in the input availability in the R&D sector leads to an above-average decrease in economic activities. For the U.S. R&D sector, the forward linkage is about 1.26. The R&D sector is linked strongly with the sector related to basic metals (1.63), but it is linked weakly with private households with employed persons (0.49). However, the U.S. has the least value, whereas Japan has the greatest value of the forward linkage (1.52). Though the forward linkage of the U.S. R&D sector is greater than unity, the extent to which the sector is connected to the other sectors is less than the other major OECD countries. Overall, in all major OECD countries, the R&D sector is the forward-linkage oriented sector because it shows relatively low backward linkage but high forward linkage with the other sectors. The U.S. R&D sector is also the forward-linkage oriented sector but has the weakest connection to the other sectors compared with the other countries.
Table 3 presents the effects of R&D supply investments on the other sectors. The supply investment effect of the U.S. R&D sector varies with the sectoral characteristics. For the U.S. R&D sector, the highly ranked impact is on the sector related to renting of machinery and equipment (0.10), followed by the sector related to medical, precision and optical instruments (0.09). The least impact occurs in the sector related to real estate activities (0.001), followed by the sector related to finance and insurance (0.003). However, the U.S. R&D sector has the least total impact (the sum of the individual supply investment effects) on the other sectors. Its total impact is 0.69, which means that the U.S. has the least production-inducing effects on the outputs of the other sectors. The total impact is particularly crucial because it determines whether R&D activities generate significant effects on the other R&D consuming sectors. The supply investment effect of the U.S. R&D sector is less than those of the other major OECD countries, showing that the U.S. R&D sector is the relatively weak production-inducing sector. The R&D sector in France shows the greatest total impact on the outputs of the other sectors with 1.18, followed by Germany.
Table 3.
Supply Investment Effects of R&D Sector in Major OECD Countries.
Furthermore, Table 4 reports the supply shortage effects of the R&D sector on the other sectors, showing how much a unit shortage in the R&D sector affect the other sectors’ outputs. The sum of the individual supply shortage effects is 2.93 in France, 3.02 in Germany, 3.11 in Italy, 3.90 in Japan, 3.02 in the U.K., and 1.81 in the U.S., respectively. The greatest value is in Germany and the lowest value is in the U.S. Specifically, in the U.S., the greatest impact occurs on the sector related to public administration and defense including compulsory social security (0.27), whereas the least impact occurs on the sector related to private households with employed persons (0.00). The supply shortage effect of the U.S. R&D sector is the least among the OECD countries, which indicates that the effect of a unit shortage in the R&D sector on the other sectors’ outputs is relatively low in the economy. This result is also attributable to the low linkages of the U.S. R&D sector to the other sectors.
Table 4.
Supply Shortage Effects of R&D Sector in Major OECD Countries.
4. Discussion and Conclusions
This study is motivated by the importance of the R&D sector because it leads to the sustainable productivity growth through innovative knowledge accumulation. Due to the largest R&D expenditure of the U.S., it is usually expected that the U.S. R&D sector will be connected to the productivity of other industrial sectors. However, unlike the public R&D expenditure, the R&D sector’s contribution to innovation may depend on its linkages with relevant sectors. In other words, it is requisite that the industrial linkages between the R&D sector and other industrial sectors be guaranteed to stimulate innovative achievement in the economy. With strong connectivity of the R&D sector to other sector, the R&D sector can contribute to improving the productivity of other industrial sectors. For the analyses of the linkages, the I-O model is employed to identify the extent to which the U.S. R&D sector is linked to other sectors and its supply investment and shortage effects on the other industrial sectors.
The findings are interesting because they show that the spillover effects of the R&D sector may contradict our expectation. The U.S. R&D sector has relatively low backward and forward linkages with the other sectors compared with OECD countries. In particular, the forward linkage is the lowest. Moreover, the supply investment effect of the U.S. R&D sector is much less than those of the other countries, showing that the R&D sector is not likely to generate the production of the other sectors. The supply shortage effect of the U.S. R&D sector is the least among the countries, which implies that the shortage or failure of R&D production may not restrict the production of the other sectors. The findings reveal that the U.S. R&D sector has relatively weak strength to simulate the innovative activities of the other industrial sectors compared with the OECD countries due to the low linkages.
The findings obtained from the I-O model provide policymakers with the comprehensive overview of the R&D sector’s performance and its linkages and supply effects. They imply that improving the linkages and supply effects may be more important than simply increasing the amount of R&D expenditure in the U.S. The linkages and supply effects may increase positively if policy incentives are provided to improve the industrial access to the R&D sector’s achievement. The relevant industries can benefit from the R&D sector if they manage innovative knowledge with a lower barrier to R&D. Supportive legal environment and mechanism for the industrial investment in R&D may also contribute to the spillovers of the R&D sector’s innovative activities.
Admittedly, there exists weakness in applying the I-O model to fully investigate the sectoral performance and linkage. Although the I-O model helps policymakers understand the industrial linkages and supply effects, the results obtained from the I-O model are static with fixed technical allocation coefficients, and, in turn, are sensitive to coefficient changes (Aroche Reyes and Márquez Mendoza 2013). A promising research may employ dynamic I-O analysis (Raa 1986) or incorporate the sensitivity analysis into the traditional I-O model (Bullard and Sebald 1988).
Author Contributions
J.O. analyzed the data, conducted the empirical analysis, and wrote the manuscript. D.H.S. developed the conceptual framework and assisted with analysis and writing of the manuscript.
Funding
This research received no external funding.
Conflicts of Interest
The author declares no conflict of interest.
References
- Bayoumia, Tamim, David T. Coea, and Elhanan Helpmanb. 1999. R&D spillovers and global growth. Journal of International Economics 47: 399–428. [Google Scholar]
- Bullard, Clark W., and Anthony V. Sebald. 1988. Monte Carlo sensitivity analysis of input-output models. The Review of Economics and Statistics 70: 708–12. [Google Scholar] [CrossRef]
- Falk, Martin. 2006. What drives business Research and Development (R&D) intensity across Organisation for Economic Co-operation and Development (OECD) countries? Applied Economics 38: 533–47. [Google Scholar]
- Ghosh, Ambica. 1958. Input-output approach to an allocative system. Economica 25: 58–64. [Google Scholar] [CrossRef]
- Griffith, Rachel, Stephen Redding, and John Van Reenen. 2004. Mapping the two faces of R&D: Productivity growth in a panel of OECD industries. Review of Economics and Statistics 86: 883–95. [Google Scholar]
- Han, Sang-Yong, Seung-Hoon Yoo, and Seung-Jun Kwak. 2004. The role of the four electric power sectors in the Korean national economy: An input-output analysis. Energy Policy 32: 1531–43. [Google Scholar] [CrossRef]
- Hauknes, Johan, and Mark Knell. 2009. Embodied knowledge and sectoral linkages: An input-output approach to the interaction of high- and low-tech industries. Research Policy 38: 459–69. [Google Scholar] [CrossRef]
- Jones, Leroy P. 1976. The measurement of Hirschmanian linkages. The Quarterly Journal of Economics 90: 323–33. [Google Scholar] [CrossRef]
- Leontief, Wassily. 1996. Input-Output Economics. New York: Oxford University Press. [Google Scholar]
- Los, Bart, and Bart Verspagen. 2000. R&D spillovers and productivity: evidence from US manufacturing microdata. Empirical Economics 25: 127–48. [Google Scholar]
- Miller, Ronald E., and Peter D. Blair. 2009. Input-Output Analysis: Foundations and Extensions. New York: Cambridge University Press. [Google Scholar]
- OECD. 2013. OECD Factbook 2013: Economic, Environmental and Social Statistics. Paris: The Organization for Economic Cooperation and Development. [Google Scholar]
- O’Mahony, Mary, and Michela Vecchi. 2009. R&D, knowledge spillovers and company productivity performance. Research Policy 38: 35–44. [Google Scholar]
- Raa, Thijs T. 1986. Dynamic input-output analysis with distributed activities. The Review of Economics and Statistics 68: 300–10. [Google Scholar]
- Rasmussen, Poul N. 1956. Studies in Inter-Sectoral Relations. Amsterdam: North-Holland. [Google Scholar]
- Reis, Hugo, and António Rua. 2009. An input-output analysis: Linkages versus leakages. International Economic Journal 23: 527–44. [Google Scholar] [CrossRef]
- Aroche Reyes, Fidel, and Marco Antonio Márquez Mendoza. 2013. The Demand Driven and the Supply-Sided Input-Output Models. Notes for the Debate. MPRA Paper No. 61132. Munich: University Library of Munich. [Google Scholar]
- Sveikauskas, Leo. 2007. R&D and Productivity Growth: A Review of the Literature; BLS Working Papers 408; Washington: U.S. Bureau of Labor Statistics.
- Sylwester, Kevin. 2001. R&D and economic growth. Knowledge, Technology & Policy 13: 71–84. [Google Scholar]
- Wolff, Edward N. 1997. Spillovers, linkages and technical change. Economic Systems Research 9: 9–23. [Google Scholar] [CrossRef]
- Wolff, Edward N., and M. Ishaq Nadiri. 1993. Spillover effects, linkage structure, and research and development. Structural Change and Economic Dynamics 4: 315–31. [Google Scholar] [CrossRef]
- Yamano, Norihiko, and Nadim Ahmad. 2006. The OECD Input-Output Database: 2006 Edition. Paris: Organization for Economic Cooperation and Development (OECD). [Google Scholar]

© 2019 by the authors. Licensee MDPI, Basel, Switzerland. This article is an open access article distributed under the terms and conditions of the Creative Commons Attribution (CC BY) license (http://creativecommons.org/licenses/by/4.0/).