Views on Public Transport and How Personal Experiences Can Contribute to a More Positive Attitude and Behavioural Change

Abstract
:1. Introduction
1.1. Attitudes Towards Driving
1.2. Attitudes Towards Public Transport
1.3. Theoretical Framework
The Prediction of Intention
1.4. Aims
2. Method
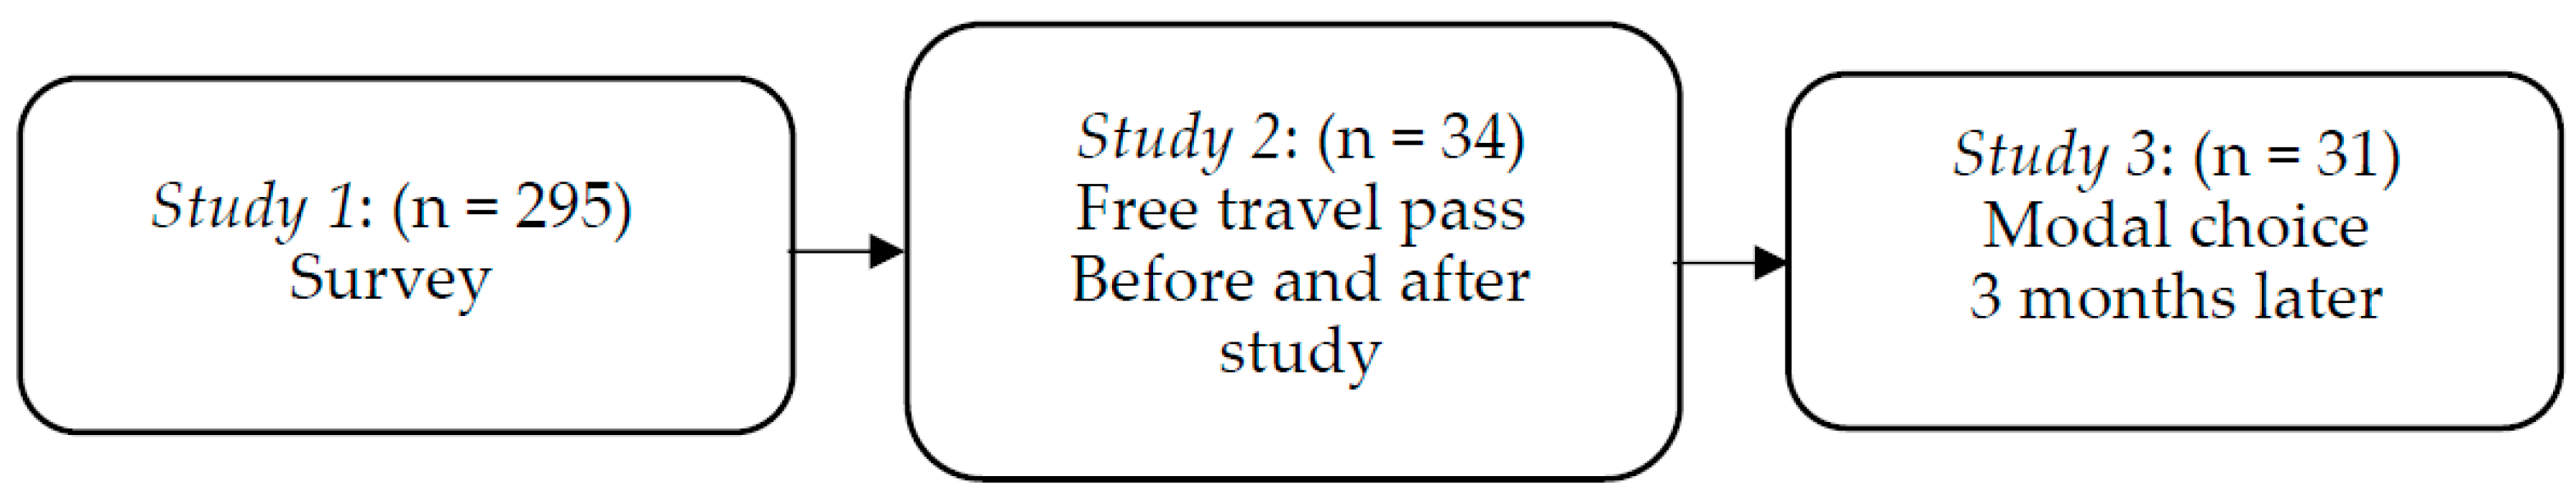
2.1. Procedure
2.2. Participants
3. Results
3.1. Study 1
3.1.1. Prediction of the Intention to Travel by Bus
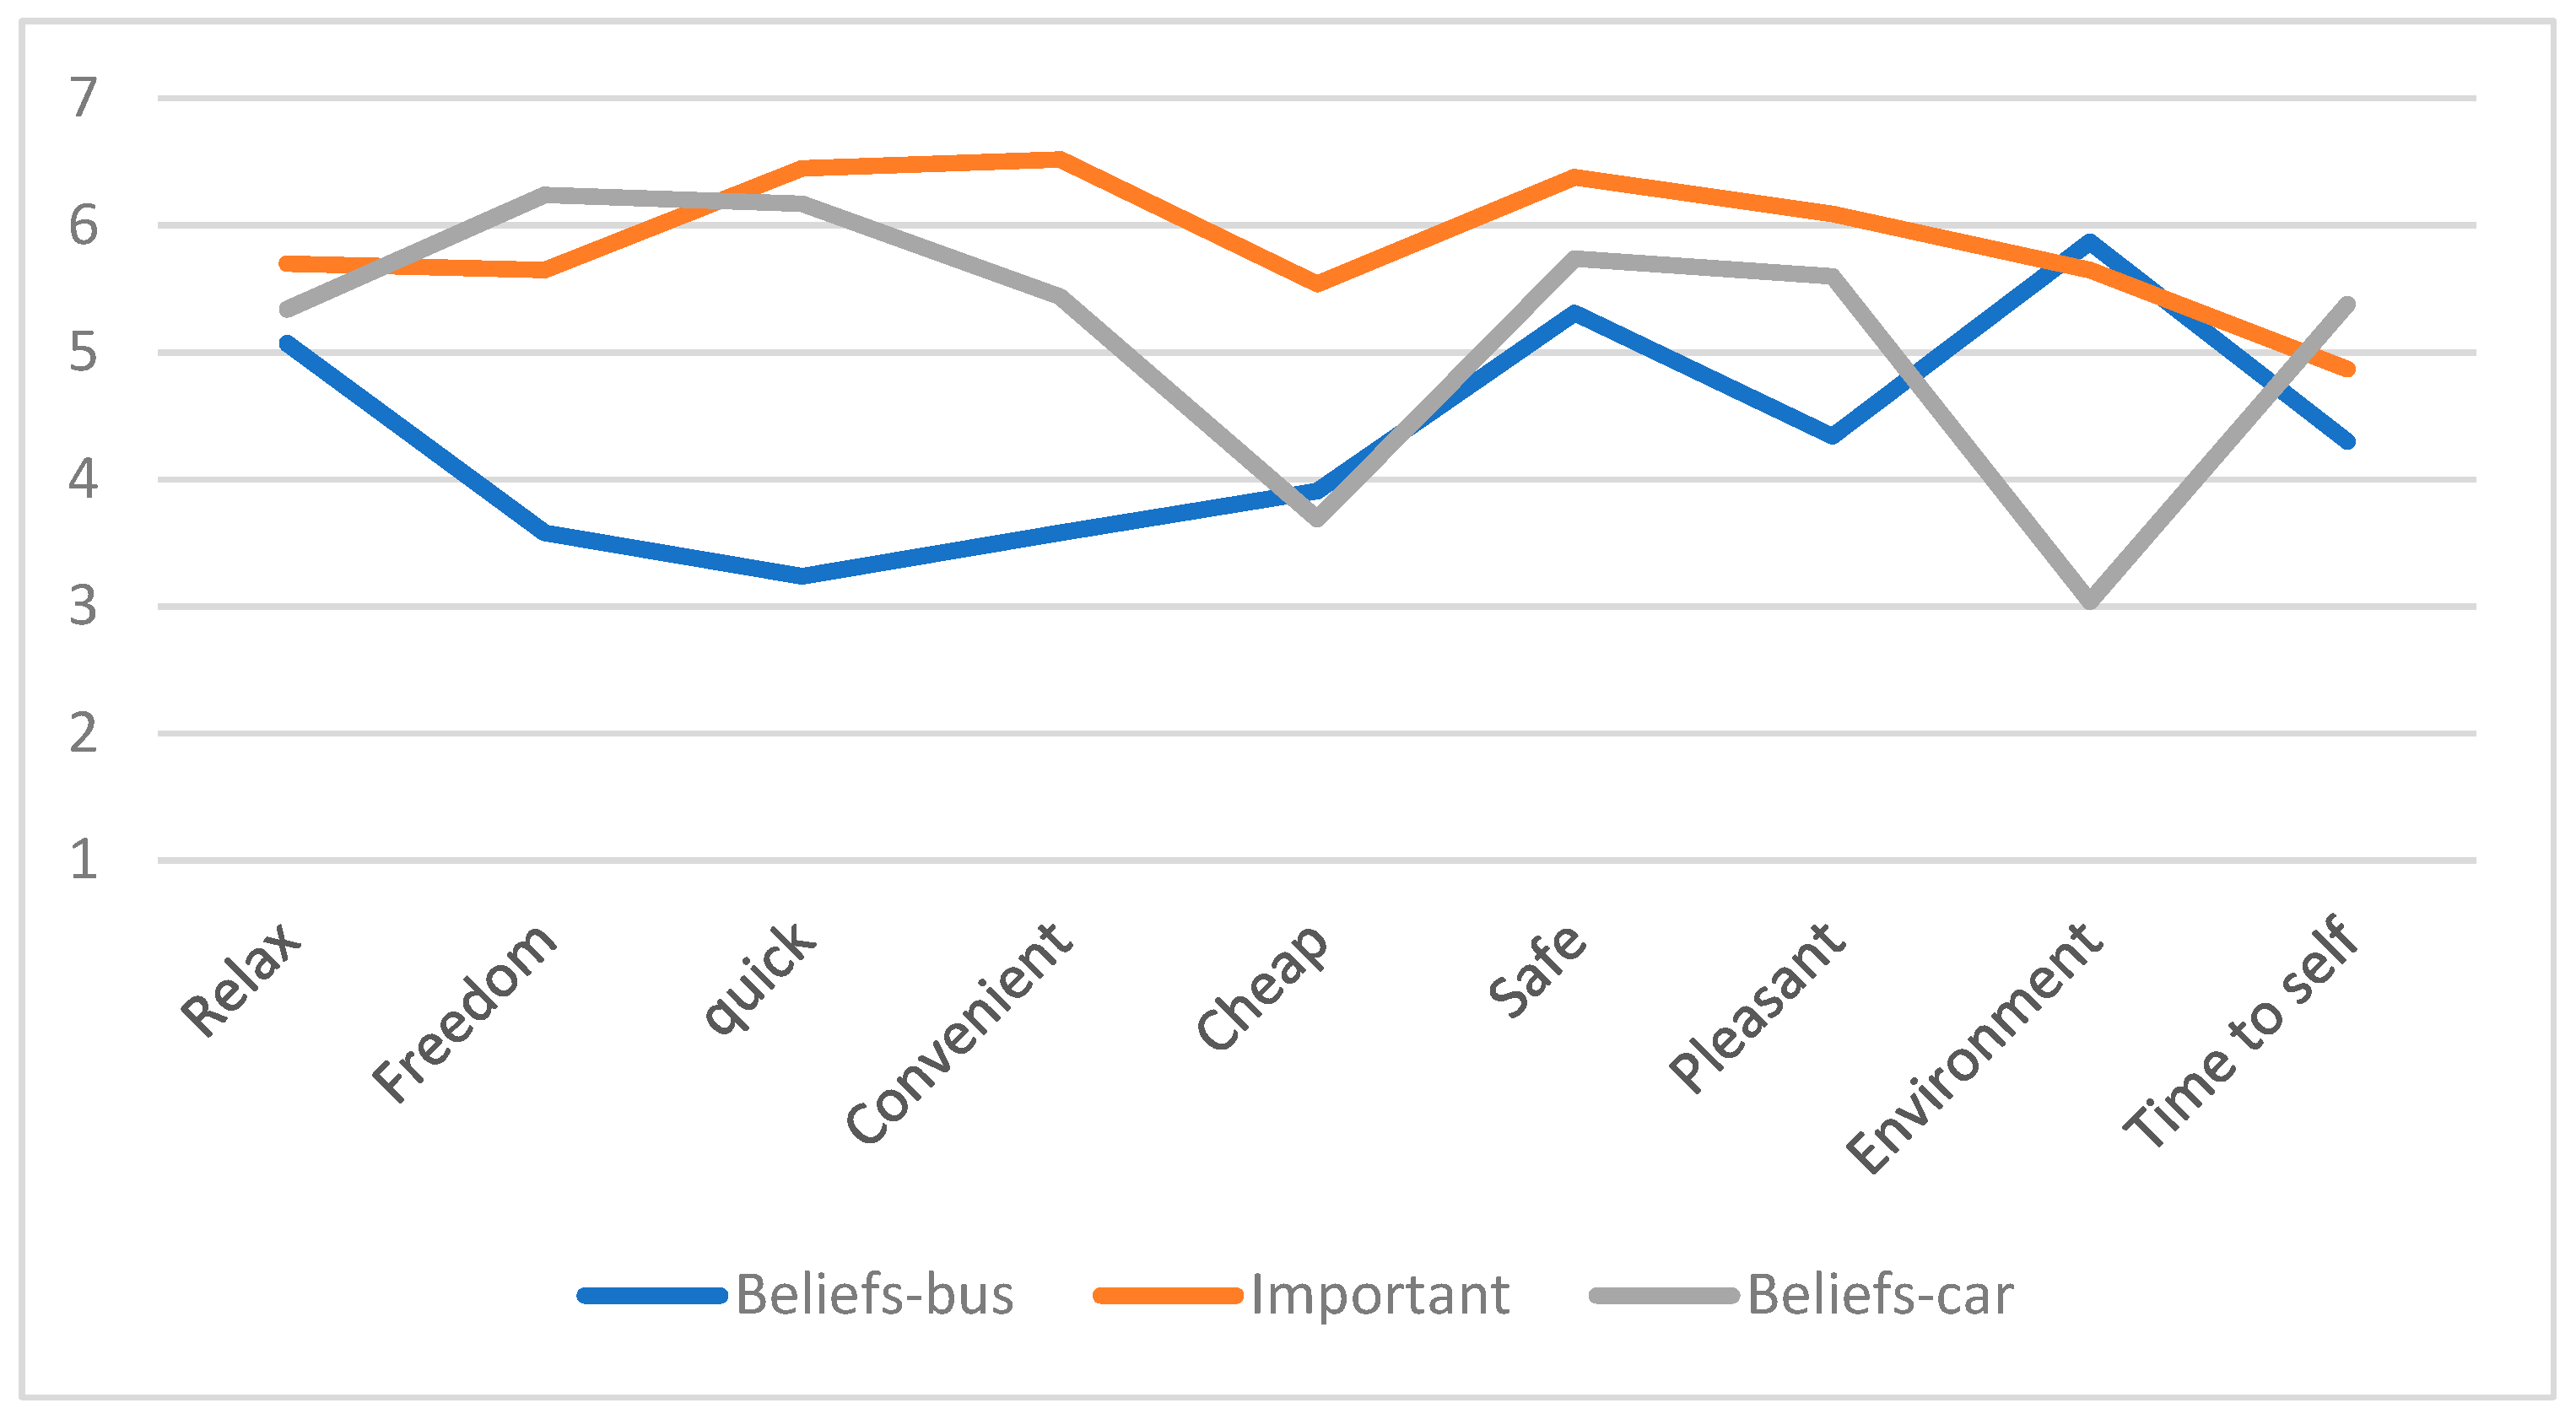
3.1.2. Assessment of Regular Bus Users and Car Drivers and Indirect Measures
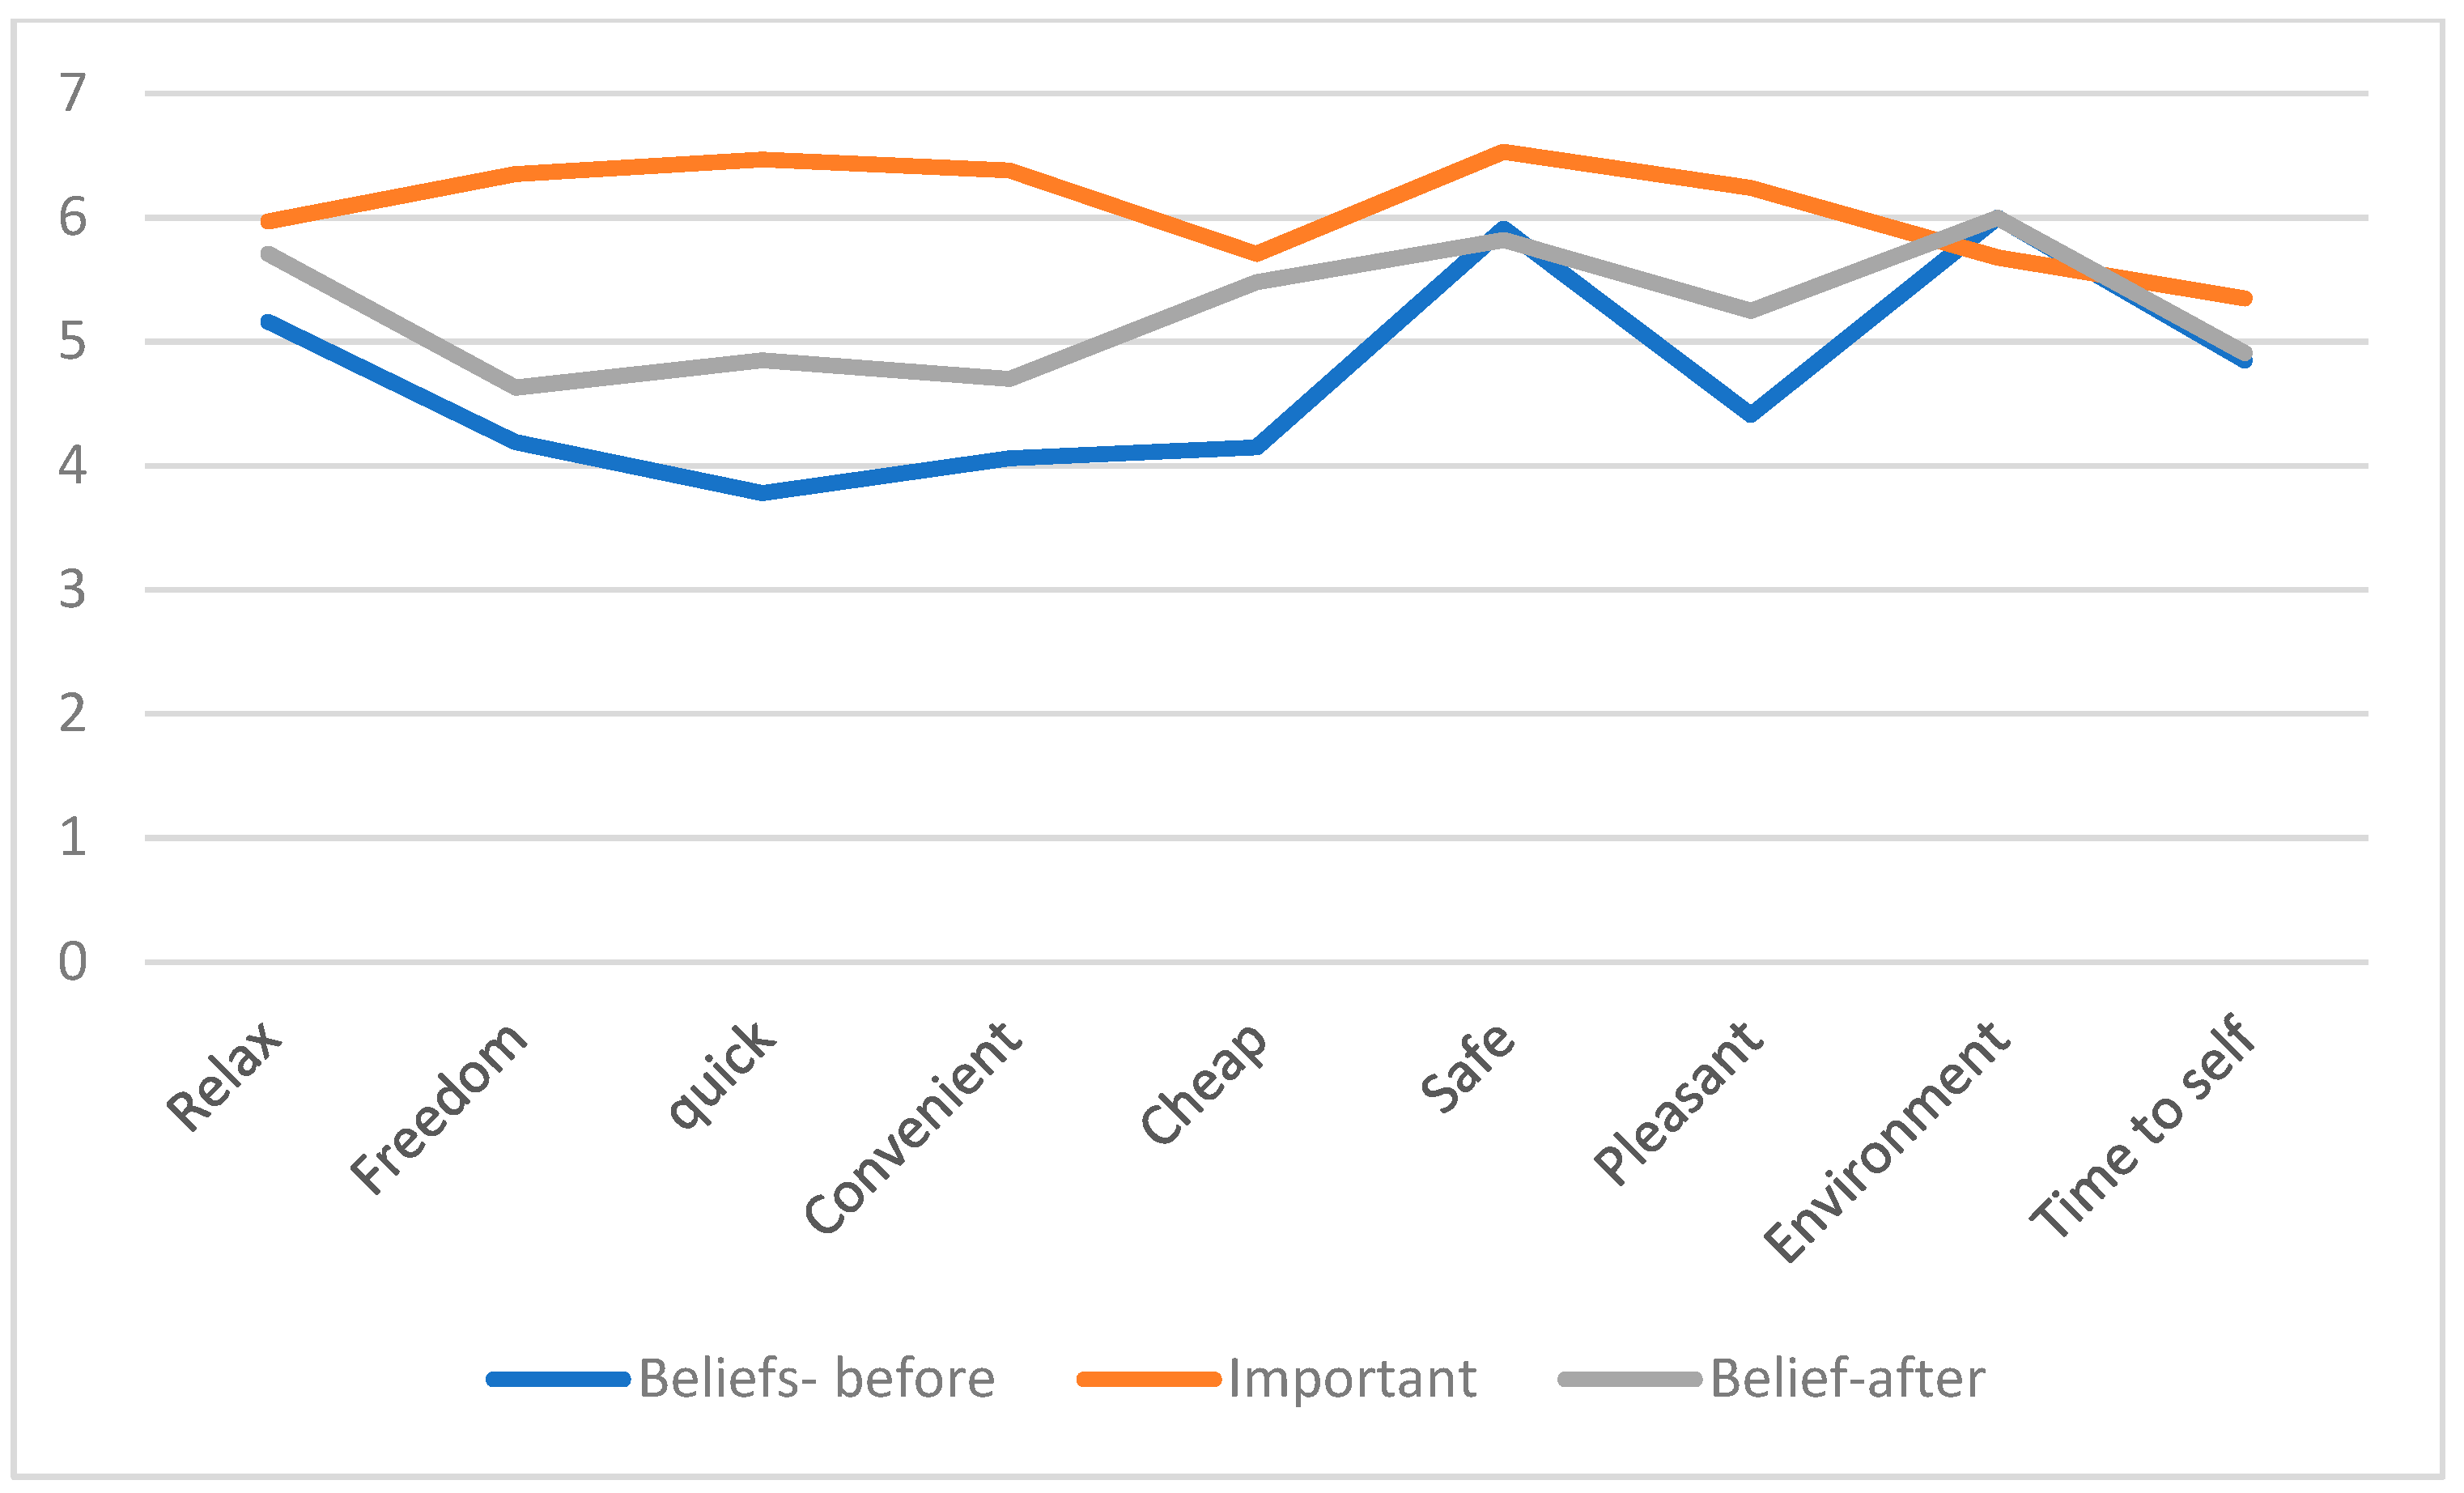
3.2. Study 2
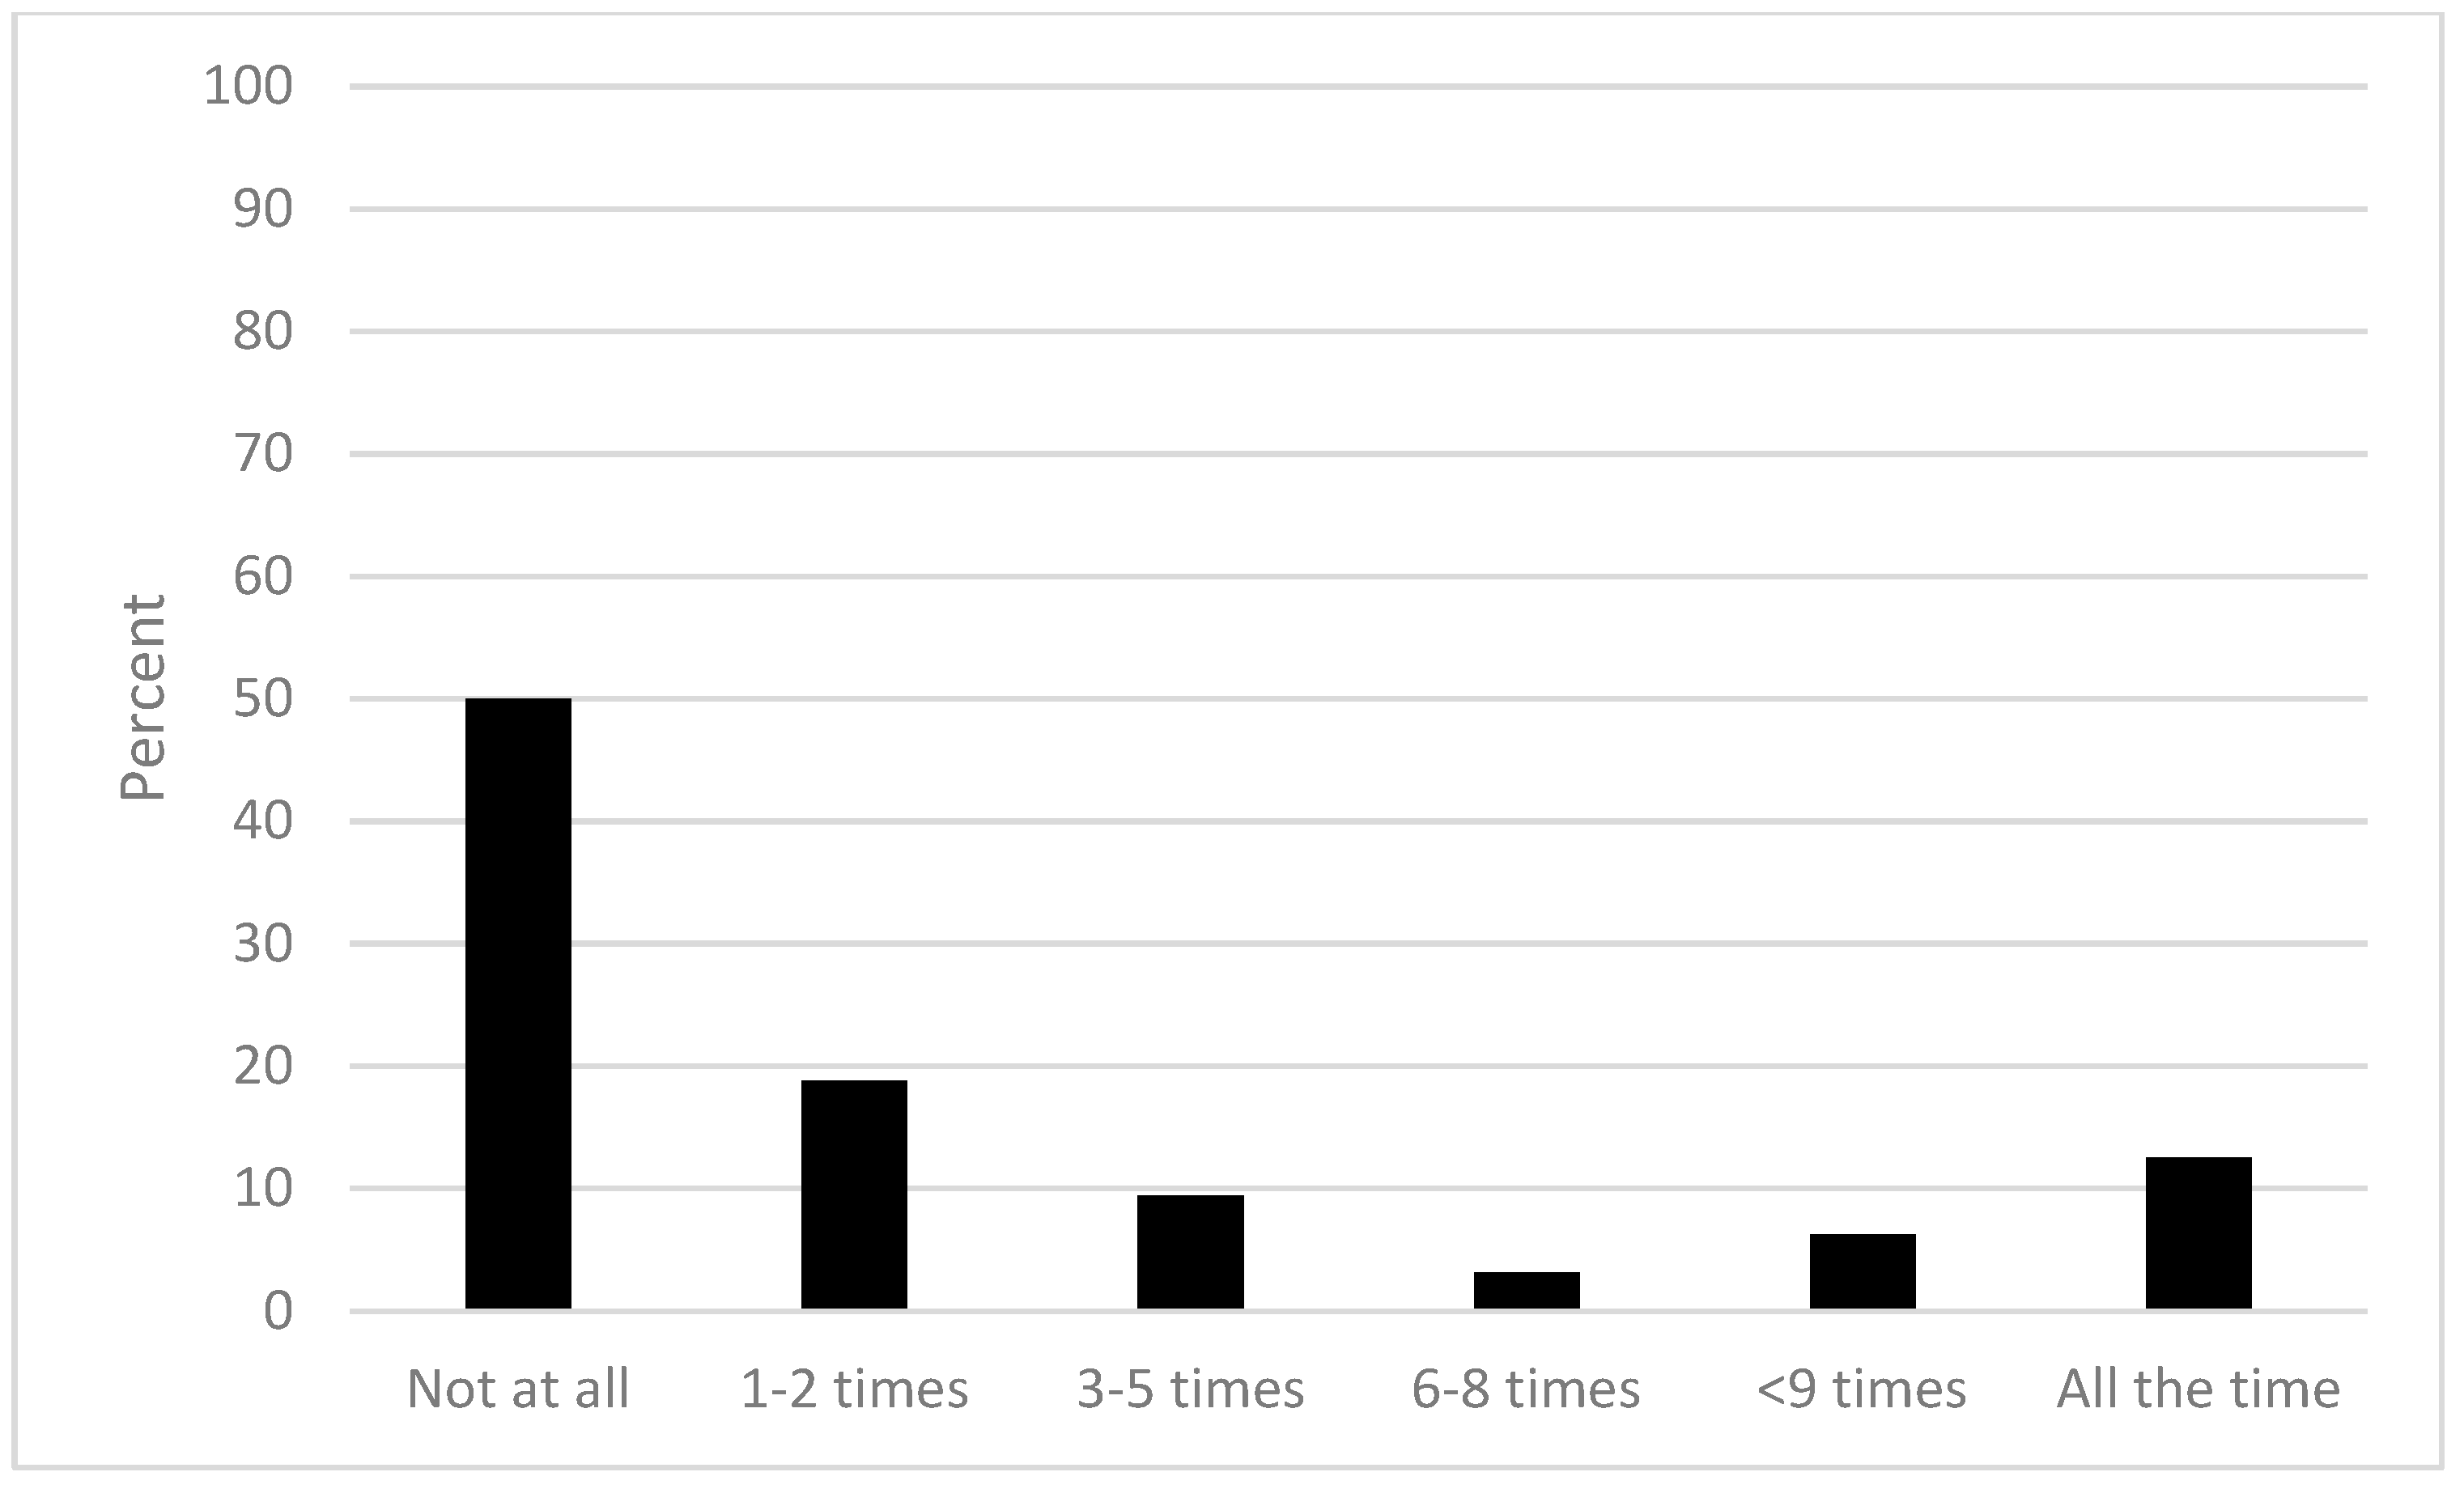
3.3. Study 3—Questionnaire and the Use of PT Three Months Later
4. Discussion
5. Conclusions
Funding
Conflicts of Interest
References
- Abou-Zeid, Maya, Regina Witter, Michel Bierlaire, Vincent Kaufmann, and Moshe Ben-Akiva. 2012. Happiness and travel mode switching: Findings from a Swiss public transportation experiment. Transport Policy 19: 93–104. [Google Scholar] [CrossRef]
- ACEA. 2018. Report: Vehicles in Use—Europe 2018. European Automobile Manufacturers Association. Available online: https://www.acea.be/statistics/tag/category/vehicles-per-capita-by-country/ (accessed on 10 October 2018).
- Ajzen, Icek. 1991. The theory of planned behavior. Organizational Behavior and Human Decision Processes 50: 179–211. [Google Scholar] [CrossRef]
- Ajzen, Icek. 2006. Construction of a TPB Questionnaire: Conceptual and Methodological Considerations. Available online: http://www.people.umass.edu/aizen/pdf/tpb.measurement.pdf (accessed on 4 October 2018).
- Ajzen, Icek, and B. L. Driver. 1991. Prediction of leisure participation from behavioural, normative, and control beliefs: An application of the theory of planned behaviour. Leisure Sciences 13: 185–204. [Google Scholar] [CrossRef]
- Ajzen, Icek, and Martin Fishbein. 2005. The influence of attitudes on behaviour. In The Handbook of Attitudes. Edited by Dolores Albarracin, Blair T. Johnson and Mark P. Zanna. Mahwah: Lawrence Erlbaum, pp. 173–221. [Google Scholar]
- Ajzen, Icek, and Martin Fishbein. 2008. Scaling and testing multiplicative combinations in the expectancy-value model of attitudes. Journal of Applied Social Psychology 38: 2222–47. [Google Scholar] [CrossRef]
- Anable, Jillian, and Birgitta Gatersleben. 2015. All work and no play? The role of instrumental and affective factors in work and leisure journeys by different travel modes. Transportation Research. Part A, Policy and Practice 39: 163–81. [Google Scholar] [CrossRef]
- Arden, Madelynne A., and Christopher J. Armitage. 2008. Predicting and explaining transtheoretical model stage transitions in relation to condom-carrying behaviour. British Journal of Health Psychology 13: 719–35. [Google Scholar] [CrossRef]
- Bamberg, Sebastian. 2007. Is a stage model a useful approach to explain car drivers’ willingness to use public transportation? Journal of Applied Social Psychology 37: 1757–83. [Google Scholar] [CrossRef]
- Bamberg, Sebastian, and Peter Schmidt. 2003. Incentives, morality, or habit? Predicting students’ car use for university routes with the models of Ajzen, Schwartz, and Triandis. Environment and Behavior 35: 264–85. [Google Scholar] [CrossRef]
- Bamberg, Sebastian, Icek Ajzen, and Peter Schmidt. 2003. Choice of travel mode in the theory of planned behavior: The roles of past behavior, habit, and reasoned action. Basic and Applied Social Psychology 25: 175–87. [Google Scholar] [CrossRef]
- Banister, David, and Stephen Marshall. 2008. Land Use and Transport: European Research towards Integrated Policies. Bingley: Emerald. [Google Scholar]
- Bhattacharya, Torsha, Jeffrey Brown, Michal Jaroszynski, and Tuna Batuhan. 2014. The Effects of Perception vs. “Reality” on Travel Behavior after a Major Transit Service Change: The Case of Tallahassee, Florida. Journal of Public Transportation 17: 1–26. [Google Scholar] [CrossRef]
- Burian, Jaroslav, Lenka Zajíčková, Igor Ivan, and Karel Mack. 2018. Attitudes and Motivation to Use Public or Individual Transport: A Case Study of Two Middle-Sized Cities. Social Sciences 7: 83. [Google Scholar] [CrossRef]
- Buys, Laurie, Stephen Snow, Kimberley van Megen, and Evonne Miller. 2012. Transportation behaviours of older adults: An investigation into car dependency in urban Australia. Australasian Journal of Ageing 31: 181–86. [Google Scholar] [CrossRef]
- Callaghan, Patrick, Elizabeth Khalil, and Ioannis Morres. 2010. A prospective evaluation of the Transtheoretical Model of Change applied to exercise in young people. International Journal of Nursing Studies 47: 3–12. [Google Scholar] [CrossRef]
- Car Sales Statistics. 2017. (Full Year) Europe: Car Sales per EU and EFTA Country. Available online: https://www.best-selling-cars.com/europe/2017-full-year-europe-car-sales-per-eu-efta-country/ (accessed on 10 October 2018).
- Caralampo, Focas, and Christidis Panayotis. 2017. Peak car in Europe. Transportation Research Procedia 25: 531–50. [Google Scholar]
- Cervero, Robert. 2004. Transit-Oriented Development in the United States: Experiences, Challenges, and Prospects. Transit Cooperative Research Program, 102. Washington: National Research Council, Transportation Research Board. [Google Scholar]
- Chowdhury, Subeh, Kasey Zhai, and Asif Khan. 2016. The Effects of Access and Accessibility on Public Transport Users’ Attitudes. Journal of Public Transportation 19: 97–113. [Google Scholar] [CrossRef]
- Cialdini, Robert B, Raymond R. Reno, and Carl A. Kallgren. 1990. A focus theory of normative conduct: Recycling the concept of norms to reduce littering in public places. Journal of Personality and Social Psychology 58: 1015–26. [Google Scholar] [CrossRef]
- Cohen, Maurie J. 2012. The future of automobile society: A socio-technical transitions perspective. Technology Analysis and Strategic Management 24: 377–90. [Google Scholar] [CrossRef]
- Conner, Mark, and Brian McMillan. 1999. Interaction effects in the theory of planned behaviour: Studying cannabis use. British Journal of Social Psychology 38: 195–22. [Google Scholar] [CrossRef]
- Courneya, Kerry S. 1995. Understanding readiness for regular physical activity in older individuals: an application of the theory of planned behavior. Health Psychology 14: 80–87. [Google Scholar] [CrossRef]
- Courneya, Kerry S, Ronald C. Plotnikoff, Stephen B. Hotz, and Nicholas J. Birkett. 2001. Predicting exercise stage transition over two consecutive 6-month periods: A test of the theory of planned behavior in a population-based sample. British Journal of Health Psychology 6: 135–50. [Google Scholar] [CrossRef]
- De Vos, Jonas. 2018. Do people travel with their preferred travel mode? Analyzing the extent of travel mode dissonance and its effect on travel satisfaction. Transportation Research Part A 117: 261–74. [Google Scholar]
- Delhomme, Patricia, Werner De Dobbeleer, Sonja E. Forward, and Anabela Simões, eds. 2009. Manual for Designing, Implementing, and Evaluating Road Safety Communication Campaigns. Cast Project. Brussels: Belgian Road Safety Institute (IBSR-BIVV). [Google Scholar]
- Donald, Ian J., Simon R. Cooper, and Stacey M. Conchie. 2014. An extended theory of planned behaviour model of the psychological factors affecting commuters’ transport mode use. Journal of Environmental Psychology 40: 39–48. [Google Scholar] [CrossRef]
- Eriksson, Louise, and Sonja E. Forward. 2009. Resvanor och inställning till färdmedel i Falu kommun (Travel Behaviour and Attitudes towards Different Modes of Transport in the Municipality of Falun). VTI Report 678. Linköping: Swedish National Road and Transport Research Institute. [Google Scholar]
- Eriksson, Louise, and Sonja E. Forward. 2011. Is the intention to travel in a pro-environmental manner and the intention to use the car determined by different factors? Transportation Research Part D 16: 372–76. [Google Scholar] [CrossRef]
- European Environment Agency. 2016. Transport in Europe Key Facts and Trends. Available online: https://www.eea.europa.eu/signals/signals-2016/articles/transport-in-europe-key-facts-trends (accessed on 6 October 2018).
- Eurostat. 2018. Passenger Cars in the EU. Available online: https://ec.europa.eu/eurostat/statistics-explained/index.php/Passenger_cars_in_the_EU#New_passenger_car_registration (accessed on 6 October 2018).
- Forward, Sonja E. 1998a. Behavioural Factors Affecting Modal Choice. Project ADONIS UR-96-SC.326. European Commission under the Transport RTD Programme of the 4th Framework Programme. Linköping: Publ. Swedish National Road and Transport Research Institute. [Google Scholar]
- Forward, Sonja E. 1998b. Modes of Transport on Short Journeys: Attitudes and Behaviour of the Inhabitants of Gothenburg. VTI Report 437. Linköping: Swedish National Road and Transport Research Institute. [Google Scholar]
- Forward, Sonja E. 2003. Attitudes to walking and cycling. In Sustaining Sustainable Transport Planning for Walking and Cycling in Urban Environments. Edited by Rodney Tolley. Cambridge: Woodhead-Publishing. [Google Scholar]
- Forward, Sonja E. 2004. The prediction of travel behaviour using the Theory of Planned Behaviour. In Traffic and Transport Psychology: Theory and Application. Edited by Talib Rothengatter and Raphael D E. Huguenin. New York: Elsevier. [Google Scholar]
- Forward, Sonja E. 2008. Driving Violations: Investigating Forms of Irrational Rationality. Doctoral thesis, Department of Psychology, Uppsala University, Uppsala, Sweden. [Google Scholar]
- Forward, Sonja E. 2009. The theory of planned behaviour: The role of descriptive norms and past behaviour in the prediction of drivers’ intentions to violate. Transportation Research Part F 12: 198–207. [Google Scholar] [CrossRef]
- Forward, Sonja E. 2014. Exploring people’s willingness to bike using a combination of the theory of planned behavioural and the transtheoretical model. European Journal of Applied Psychology. Special Issue Psychology of Transport 64: 151–59. [Google Scholar] [CrossRef]
- Fredricks, Arlene J, and Dennis L. Dossett. 1983. Attitude-behavior relations: A comparison of the Fishbein-Ajzen and the Bentler-Speckart models. Journal of Personality and Social Psychology 45: 501–12. [Google Scholar] [CrossRef]
- Fu, Xuemei, and Zhicai Juan. 2017. Understanding public transit use behavior: integration of the theory of planned behavior and the customer satisfaction theory. Transportation 44: 1021–42. [Google Scholar] [CrossRef]
- Fujii, Satoshi, and Ryuichi Kitamura. 2003. What does a one-month free bus ticket do to habitual drivers? An experimental analysis of habit and attitude change. Transportation 30: 81–95. [Google Scholar] [CrossRef]
- Fujii, Satoshi, Tommy Gärling, and Ryuichi Kitamura. 2001. Changes in drivers’ perceptions and use of public transport during a freeway closure: Effects of temporary structural change on cooperation in a real-life social dilemma. Environment and Behavior 33: 796–808. [Google Scholar] [CrossRef]
- Gagné, Camille, and Gaston Godin. 2000. The Theory of Planned Behavior: Some Measurement Issues Concerning Belief-Based Variables. Journal of Applied Social Psychology 30: 2173–93. [Google Scholar] [CrossRef]
- Gardner, Benjamin, and Charles Abraham. 2007. What Drives Car Use? A Grounded Theory Analysis of Commuters’ Reasons for Driving. Transportation Research Part F: Traffic Psychology and Behaviour 10: 187–200. [Google Scholar] [CrossRef]
- Gärling, Tommy, Daniel Eek, Peter Loukopoulos, Satoshi Fujii, Olof Johansson-Stenman, Ryuichi Kitamura, Ram Pendyala, and Bertil Vilhelmson. 2002. A conceptual analysis of the impact of travel demand management on private car use. Transport Policy 9: 59–70. [Google Scholar] [CrossRef]
- Gatersleben, Birgitta, and Katherine M. Appleton. 2007. Contemplating cycling to work: Attitudes and perception in different stages of change. Transportation Research Part A 41: 302–12. [Google Scholar] [CrossRef]
- Gatersleben, Birgitta, and David Uzzel. 2007. Affective appraisals of the daily commute: Comparing perceptions of drivers, cyclists, walkers, and users of public transport. Environmental Behaviour 39: 416–31. [Google Scholar] [CrossRef]
- Goodwin, Phil, and Kurt Van Dender. 2013. ‘Peak Car’—Themes and Issues. Transport Rev 33: 243–54. [Google Scholar] [CrossRef]
- Haas, Stefanie, and Claudio R. Nigg. 2009. Construct validation of the stages of change with strenuous, moderate, and mild physical activity and sedentary behaviour among children. Journal of Science and Medicine in Sport 12: 586–91. [Google Scholar] [CrossRef]
- Hardeman, Wendy, Andrew T. Prevost, Richard A. Parker, and Stephen Sutton. 2013. Constructing multiplicative measures of beliefs in the theory of planned behaviour. British Journal of Health Psychology 18: 122–38. [Google Scholar] [CrossRef]
- Heath, Yuko, and Robert Gifford. 2002. Extending the theory of planned behavior: Predicting the use of public transportation. Journal of Applied Social Psychology 32: 2154–89. [Google Scholar] [CrossRef]
- Jain, Juliet, and Glenn Lyons. 2008. The gift of travel time. Journal of Transport Geography 16: 81–89. [Google Scholar] [CrossRef]
- Lally, Phillippa, Cornelia H. M. van Jaarsveld, Henry W. W. Potts, and Jane Wardle. 2010. How are habits formed: Modelling habit formation in the real world. European Journal of Social Psychology 40: 998–1009. [Google Scholar] [CrossRef]
- Legrain, Alexander, Naveen Eluru, and Ahmed M. El-Geneidy. 2015. Am stressed, must travel: The relationship between mode choice and commuting stress. Transportation Research Part F: Psychology and Behaviour 34: 141–51. [Google Scholar] [CrossRef]
- Line, Tilly, Kiron Chatterjee, and Glenn Lyons. 2010. The travel behaviour intentions of young people in the context of climate change. Journal of Transport Geography 18: 238–46. [Google Scholar] [CrossRef]
- Linköpings kommun. 2015. RU-2014, Resvaneundersökning i Linköpings kommun. Available online: https://docplayer.se/10697161-Rvu-2014-resvaneundersokningen-i-linkoping-kommun-2014.html (accessed on 3 September 2018).
- Lippke, Sonia, and Ronald C. Plotnikoff. 2009. The protection motivation theory within the stages of the transtheoretical model—Stage-specific interplay of variables and prediction of exercise stage transitions. British Journal of Health Psychology 14: 211–29. [Google Scholar] [CrossRef]
- Lyons, Glenn, Juliet Jain, Yusak Susilo, and Stephen Atkins. 2013. Comparing Rail Passengers’ Travel Time Use in Great Britain between 2004 and 2010. Mobilities 8: 560–79. [Google Scholar] [CrossRef]
- Madden, Thomas J, Pamela Scholder Ellen, and Icek Ajzen. 1992. A comparison of the theory of planned behavior and the theory of reasoned action. Personality and Social Psychology Bulletin 18: 3–9. [Google Scholar] [CrossRef]
- Metz, David. 2015. Peak Car in the Big City: Reducing London’s transport greenhouse gas emissions. Case Studies on Transport Policy 3: 367–71. [Google Scholar] [CrossRef]
- Millard-Ball, Adam, and Lee Schipper. 2011. Are we reaching peak travel? Trends in passenger transport in eight industrialized countries. Transport Rev 31: 357–78. [Google Scholar] [CrossRef]
- Murray, Stephen J., Darren Walton, and Jared A. Thomas. 2010. Attitudes towards public transport in New Zealand. Transportation 37: 915–29. [Google Scholar] [CrossRef]
- Murtagh, N, Birgitta Gatersleben, and David Uzzell. 2012. Multiple identities and travel mode choice for regular journeys. Transportation Research F 15: 514–24. [Google Scholar] [CrossRef]
- Nilsson, Maria, and Rikard Küller. 2000. Travel Behaviour and Environmental Concern. Transportation Research Part D: Transport and Environment 5: 211–34. [Google Scholar] [CrossRef]
- Nolan, Anne. 2010. A Dynamic Analysis of Household Car Ownership. Transportation Research Part A: Policy and Practice 44: 446–55. [Google Scholar] [CrossRef]
- O’Sullivan, Bernadette, Hannah McGee, and Orla Keegan. 2008. Comparing solutions to the ‘expectancy-value muddle’ in the theory of planned behaviour. British Journal of Health Psychology 13: 789–802. [Google Scholar] [CrossRef]
- Prochaska, James O., and Carlo C. DiClemente. 1983. Stages and processes of self change in smoking: Towards an integrative model of change. Journal of Consulting and Clinical Psychology 51: 390–95. [Google Scholar] [CrossRef]
- Rasmussen, Charles, Terry J. Knapp, and Laura Garner. 2000. Driving-induced stress in urban college students. Perceptual and Motor Skills 90: 437–43. [Google Scholar] [CrossRef]
- Region Östergötland. 2016. Regionalt trafikförsörjningsprogram för Östergötland -> 2030. Available online: https://www.regionostergotland.se/PageFiles/2353/BeslutadRTPkompl2016-12-06.pdf (accessed on 19 October 2018).
- Rimal, Rajiv N, Maria K. Lapinski, Rachel J. Cook, and Kevin Real. 2002. Moving toward a theory of normative influences: How perceived benefit and similarity moderate the impact of descriptive norms on behaviors. Journal of Health Communication 10: 433–50. [Google Scholar] [CrossRef]
- Rivis, Amanda, and Paschal Sheeran. 2003. Descriptive norms as an additional predictor in the theory of planned behaviour: A meta-analysis. Current Psychology: Developmental, Learning, Personality, Social 22: 218–33. [Google Scholar] [CrossRef]
- Simsekoglu, Özlem, Trond Nordfjærn, and Torbjørn Rundmo. 2015. The role of attitudes, transport priorities, and car use habit for travel mode use in an urban Norwegian public. Transport Policy 42: 113–20. [Google Scholar] [CrossRef]
- Sutton, Stephen. 2001. Back to the drawing board? A review of applications of the transtheoretical model to substance use. Addiction 96: 175–86. [Google Scholar] [CrossRef]
- Tertoolen, Gerard, Dik van Kreveld, and Ben Verstraten. 1998. Psychological resistance against attempts to reduce private car use. Transportation Research 32A: 171–81. [Google Scholar] [CrossRef]
- Thøgersen, John. 2006. Understanding repetitive travel mode choices in a stable context: A panel study approach. Transportation Research Part A 40: 621–38. [Google Scholar] [CrossRef]
- Thøgersen, John. 2009. Promoting public transport as a subscription service: Effects of a free month travel card. Transport Policy 16: 335–43. [Google Scholar] [CrossRef]
- Varela, Juan Manuel L., Maria Börjesson, and Andrew Daly. 2018. Public transport: One mode or several? Transportation Research Part A—Policy and Practice 113: 137–56. [Google Scholar] [CrossRef]
- Verplanken, Bas, Henk Aarts, Ad van Knippenberg, and Anja Moonen. 1998. Habit versus planned behaviour: A field experiment. British Journal of Social Psychology 37: 111–28. [Google Scholar] [CrossRef]
| 1 | Separate analysis was carried out to test for multicollinearity. The results showed that the level of tolerance was around 0.7 and VIF around 1, indicating that this was not a problem. |


| % | |
|---|---|
| Age distribution | |
| 18–30 | 0.7 |
| 31–45 | 10.9 |
| 45–60 | 23.2 |
| >60 | 65.2 |
| Gender | |
| Female | 57.0 |
| Household net income per month | |
| Low (<2400 euro) | 42.6 |
| Medium (2401–4800 euro) | 33.0 |
| High (<4800 euro) | 24.4 |
| Education | |
| Low (secondary school and/or college) | 39.2 |
| High (further education) | 59.4 |
| Working hours | |
| <20 | 15.5 |
| 21–39 | 18.4 |
| 40–50 | 63.5 |
| >50 | 2.5 |
| Access to a car | |
| Always | 81.9 |
| Sometimes | 11.3 |
| Never | 6.8 |
| Study Variable | M | SD | 1 | 2 | 3 | 4 | 5 |
|---|---|---|---|---|---|---|---|
| 1. Behavioural beliefs (∑b) | 4.71 | (1.28) | - | ||||
| 2. Outcome evaluation (∑e) | 5.08 | (0.77) | 0.17 | - | |||
| 3. Subjective norm | 6.00 | (1.65) | 0.39 | 0.11 n.s. | - | ||
| 4. Descriptive norm | 2.88 | (1.58) | 0.29 | 0.17 | 0.30 | - | |
| 5. Perceived behavioural control | 4.95 | (2.09) | 0.47 | 0.11 n.s. | 0.19 | 0.13 | - |
| 6. Intention to use the bus | 2.65 | (2.21) | 0.49 | 0.07 n.s. | 0.25 | 0.22 | 0.41 |
| Step 1 | Step 2 | Step 3 | |||||||
|---|---|---|---|---|---|---|---|---|---|
| B | SE B | β | B | SE B | β | B | SE B | β | |
| BB | 0.48 | 0.12 | 0.29 ** | 0.48 | 0.12 | 0.29 ** | 0.23 | 0.09 | 0.14 * |
| SN | 0.05 | 0.08 | 0.04 | 0.05 | 0.09 | 0.04 | 0.05 | 0.06 | 0.04 |
| DN | 0.16 | 0.09 | 0.11 | 0.15 | 0.09 | 0.11 | 0.01 | 0.07 | 0.01 |
| PBC | 0.26 | 0.06 | 0.28 ** | 0.27 | 0.07 | 0.28 ** | 0.10 | 0.05 | 0.10 * |
| Adj R2 | 0.26 | ||||||||
| Gender | 0.08 | 0.26 | 0.02 | 0.20 | 0.19 | 0.05 | |||
| Age | 0.13 | 0.22 | 0.04 | 0.20 | 0.16 | 0.06 | |||
| Income | 0.01 | 0.13 | 0.01 | 0.21 | 0.09 | 0.11 * | |||
| Adj R2 | 0.25 | ||||||||
| PB | 0.94 | 0.07 | 0.67 ** | ||||||
| Adj R2 | 0.59 |
| Bus (n = 58) | Car (n = 193) | |
|---|---|---|
| Age distribution (%) | ||
| 18–30 | 14.0 | 3.1 |
| 31–45 | 24.6 | 40.1 |
| 45–60 | 35.1 | 37.0 |
| >60 | 26.3 | 19.8 |
| Gender *** | ||
| Female | 77.2 | 50.8 |
| Male | 22.8 | 49.2 |
| Children under the age of 10 (% yes) | 31.4 | 37.3 |
| Children between 11 to 15 (% yes) * | 15.2 | 27.7 |
| Household net income per month | ||
| Low (<2400 euro) | 48.2 | 42.0 |
| Medium (2401–4800 euro) | 30.4 | 34.7 |
| High (<4800 euro) | 21.4 | 23.3 |
| Education | ||
| Low (lower than bachelor’s degree) | 38.6 | 33.9 |
| High (bachelor’s degree or higher) | 61.4 | 59.9 |
| Working hours | ||
| <20 | 13.7 | 12.3 |
| 21–39 | 19.6 | 18.2 |
| 40–50 | 64.7 | 66.8 |
| >50 | 2.0 | 2.7 |
| Access to a car *** | ||
| Always | 47.4 | 97.9 |
| Sometimes | 22.8 | 2.0 |
| Never | 29.8 | 0 |
| Distance travelled most frequently (km) ** | 32.3 | 21.1 |
| Behavioural Beliefs | Bus (n = 58) M (SD) | Car (n = 193) M (SD) | p | d | Intention r (n = 295) |
|---|---|---|---|---|---|
| Be able to relax | 6.56 (0.76) | 5.07 (1.91) | *** | 1.02 | 0.30 ** |
| Feel free | 5.55 (1.42) | 3.58 (1.99) | *** | 1.14 | 0.42 ** |
| Get to the destination quickly | 5.25 (1.56) | 3.24 (1.92) | *** | 1.15 | 0.49 ** |
| Believe that it is inconvenient | 2.67 (1.54) | 4.42 (1.87) | *** | 1.02 | −0.36 ** |
| Travel in a cheap way | 5.41 (1.78) | 3.91 (1.78) | *** | 0.88 | 0.41 ** |
| Feel unsafe | 1.74 (1.22) | 2.69 (1.69) | ** | 0.64 | −0.21 ** |
| Get a pleasant journey | 5.92 (1.08) | 4.34 (1.66) | *** | 1.12 | 0.41 ** |
| Contribute to a better environment | 6.49 (0.92) | 5.87 (1.42) | ** | 0.52 | 0.15 * |
| Get some time for myself | 5.83 (1.42) | 4.30 (2.06) | *** | 0.86 | 0.39 ** |
| Outcome Evaluation | Bus (n = 51) M (SD) | Car (n = 188) M (SD) | p | d | Intention r (n = 295) |
|---|---|---|---|---|---|
| Feel free | 5.65 (1.59) | 6.19 (1.29) | * | 0.37 | n.s |
| Get to the destination quickly | 5.90 (1.28) | 6.45 (0.93) | ** | 0.49 | −0.16 * |
| That the journey is convenient | 5.76 (1.70) | 6.52 (0.79) | *** | 0.57 | −0.21 * |
| Travel in a cheap way | 6.32 (0.91) | 5.54 (1.57) | *** | 0.61 | 0.16 * |
| Contribute to a better environment | 6.26 (1.01) | 5.65 (1.49) | *** | 0.48 | 0.16 * |
| Descriptive Norm | Bus (n = 58) M (SD) | Car (n = 193) M (SD) | p | d | Intention r (n = 295) |
|---|---|---|---|---|---|
| Friends | 3.70 (1.94) | 2.73 (1.58) | *** | 0.55 | 0.22 ** |
| Family | 3.37 (2.25) | 2.49 (1.85) | * | 0.43 | 0.22 ** |
| Perceived Behavioural Control | Bus (n = 58) M (SD) | Car (n = 193) M (SD) | p | d | Intention r (n = 295) |
|---|---|---|---|---|---|
| Easy to travel by bus | 6.24 (1.11) | 4.31 (2.17) | * | 1.12 | 0.41 * |
| Behavioural Beliefs | Before M (SD) | After M (SD) | p | d |
|---|---|---|---|---|
| Get to the destination quickly a | 3.68 (1.70) | 4.77 (1.78) | *** | 0.63 |
| Travel in a cheap way a | 4.25 (1.91) | 5.44 (1.70) | ** | 0.70 |
| Get a pleasant journey a | 4.33 (1.48) | 5.17 (1.53) | ** | 0.53 |
| Easy to travel by bus b | 5.30 (1.86) | 5.94 (1.43) | * | 0.39 |
| PC (%) | C (%) | P (%) | A (%) | M (%) | |
|---|---|---|---|---|---|
| Before | 17.6 | 82.4 | - | - | - |
| After | 8.8 | 17.6 | 58.8 | 14.7 | - |
© 2019 by the author. Licensee MDPI, Basel, Switzerland. This article is an open access article distributed under the terms and conditions of the Creative Commons Attribution (CC BY) license (http://creativecommons.org/licenses/by/4.0/).
Share and Cite
Forward, S.E. Views on Public Transport and How Personal Experiences Can Contribute to a More Positive Attitude and Behavioural Change. Soc. Sci. 2019, 8, 47. https://doi.org/10.3390/socsci8020047
Forward SE. Views on Public Transport and How Personal Experiences Can Contribute to a More Positive Attitude and Behavioural Change. Social Sciences. 2019; 8(2):47. https://doi.org/10.3390/socsci8020047
Chicago/Turabian StyleForward, Sonja E. 2019. "Views on Public Transport and How Personal Experiences Can Contribute to a More Positive Attitude and Behavioural Change" Social Sciences 8, no. 2: 47. https://doi.org/10.3390/socsci8020047
APA StyleForward, S. E. (2019). Views on Public Transport and How Personal Experiences Can Contribute to a More Positive Attitude and Behavioural Change. Social Sciences, 8(2), 47. https://doi.org/10.3390/socsci8020047