1. Introduction: Sources and Methodology
This study focuses on
ʿavārıżhane tax surveys and surety registers as its primary historical sources. Like other cadastral/property and tax surveys (such as the
tapu-taḥrīr and
temettuat surveys), these contain a huge amount of quantitative and nominal (categorical) data about Ottoman cities, in this case Edirne. The big data these kinds of sources contain require sophisticated analytical methods over and above those already necessary in approaching cities and urban studies in general. Here, I propose a new way of analyzing and interpreting the data recorded in tax and surety registers by using advanced statistical methods and by displaying the results in tables and maps.
1These
ʿavārıżhāne tax and surety records, thousands of which are housed in the Ottoman archives, are a very significant and detailed source of information on Ottoman cities and the people who lived in them for the period from 1600 to 1700. They differ from other sorts of records, like
tapu-taḥrīr surveys, in that they employ
ʿavārıż households instead of real households as their basic unit. The
ʿavārıż household was a tax unit used to indicate how many real households could pay one set of
ʿavārıż taxes of 300
akçes/year according to the values of their properties and their economic capacities. The
ʿavārıż households generally comprise between four and 20 real households, or seven households on average, and the variation in the number of real households they contain offers significant clues about the economic capacity of Ottoman cities. These surveys also include every kind of person there (even tax-exempt individuals) and mention their attributes, such as religion, gender, marriage status, titles and occupation. But, unlike other tax surveys, they do not include information about lands, agricultural production or the built environment.
2Some of the data in these primary sources is numerical, but the majority of it is categorical. While some categorical data, like religion and gender, can be analyzed without further classification, it is not possible to analyze information like occupation without clustering, since there are hundreds of varieties of such data. We can perform initial analyses of these data with conventional statistical methods, and the distribution of each attribute in the city and its density in a city space (scaling) can be presented in the form of ratios.
3 However, I try here for the first time to perform two new types of analysis: connecting the data types with each other, and highlighting the distinguishing differences among the
mahalles (neighborhoods). It is not possible to do either using conventional methods, so I instead employ other methods: hierarchical clustering, correspondence analysis, and maps created by geographic information systems (GIS) applications. Such an exploration suits both my relational approach—that all elements in the city must be understood as related to each other—and my effort to lay out the general features of the Ottoman city. With the guidance of the big data in the sources, these new analyses offer researchers the opportunity to see how these attributes differed in space in line. Thus, beyond the topographical vicinities, I explore the socio-spatial vicinities of the
mahalles in the city via the scale of their “corresponding distances.”
In short, I use a twofold methodology here: the conventional method, which is to classify the data according to a priori categorizations and interpret them on the basis of their proportions within the total; and also the relational approach and its methodologies, which are to let the data assemble themselves (
Gould 1981) on the basis of city space by using the methods of hierarchical clustering and correspondence analysis.
One of the most original aspects of this study is that it approaches Ottoman urban studies with the relational approach
4 and that it offers a correspondence analysis, which will reveal this relationality, on the data available for Edirne. Instead of using a priori and usually ahistorical identifications and categorizations, as in the positivist approach, the relational approach defines and groups the available historical data through a dynamic process of mutual correspondence. This approach reconstructs the examined system of object relationships as a social space, an area with diverse attribute patterns that is reproduced through the daily actions and statements of actors. This necessitates a shift from a substantialist approach, which regards the city as a spatial association in which every element of the city exists by itself, to a complexity approach, which presumes that all elements construct and reproduce the city in constant relation with one another.
5The Edirne data available for the late 17th century and the early 18th century offer information about the religion, ethnicity, status, occupation, and property of thousands of household heads (more than 8000) living in hundreds of mahalles (more than 150). By identifying and grouping this information in juxtaposition with the spatial information of the city, it is possible to produce a detailed map of the city’s spatial organization that is of great potential value to urban historians. To do this, I use hierarchical clustering and correspondence analysis to connect hundreds of attributes (more than 400) of mahalle residents with the mahalles/neighborhoods of this city. This reveals how the concentration of different attributes varied across different areas of the city, how different mahalles were distinguished by their different attributes, and which mahalles were qualitative “neighbors” through their shared attributes.
In order to accomplish this and to display my results in the form of tables and maps, I followed the steps below:
All data on place names and attributes was coded numerically and assigned cross-tabs in Microsoft Excel.
Clustering analysis and correspondence analysis were conducted using SPSS software.
The results were initially presented in the form of tables. The table columns were used for the attributes and the rows were used for spatial groupings. Four types of tables—absolute values, signed chi-square values, and sums of the columns and rows—emerged in this stage.
Lastly, the results were displayed as maps. Information was collected from a wide range of sources, including everything from Ottoman chronicles and archival sources to histories of Edirne, and a GIS map program called ArcGIS was used to determine mahalle locations. A map of Edirne’s mahalles was formed on the GIS virtual map of Edirne by drawing the approximate borders of these mahalles based on their population size. The mahalle groupings, which are shown in the aforementioned tables, were marked on the map in the same color. These groups were given names referring to over-represented groupings. An attempt was made to show the distribution of the results on the space more clearly.
In short, this approach suggests a new way of interpreting and visualizing the data contained in historical archives, especially in sources like tax and property surveys. This differs from the methods used in existing studies, in which researchers use the conventional, a priori categorizations of the attributes (or qualities) of people that are given in the sources, and then analyze them by calculating the percentage of people with a given attribute, determining the spatial distribution of that attribute, and identifying the places where it is over- and under-represented. For instance, a researcher using this traditional approach might calculate that barbers account for 6% of all people with a listed occupation, determine that they exist in 60% of all mahalles, and identify that they reside the most in mahalle A and the least in mahalle B. Alternatively, again using a traditional approach, one might study a particular mahalle and list the number of occupations represented there, noting which are overrepresented and which are underrepresented. Neither approach can simultaneously take all occupations and all neighborhoods into account, and neither can offer a profile of the distinctions and similarities among a particular group of mahalles. These traditional approaches are about establishing the proportion of a single datum within the entire pool of data. In order to take all of the data into account in all its complexity, attributes and places have to grouped in accordance with the shared similarities that connect them and the distinctive features that mark them off as a separate group. This is the approach employed here, with the similar and distinctive features presented in tables.
Before moving on to examine the case of Edirne, I will first discuss the methodological issues involved in greater detail.
2. Interpreting Nominal (Categorical) Data: A New Turn?
The use of statistical methods in the social sciences, particularly in historical research, provides numerous benefits and offers a source of reference for conceptualization and modeling, provided that satisfactory answers are given to certain epistemological and methodological questions.
6Many techniques have been developed in the field of statistical research for the analysis of ratio and interval variables. This area of conventional statistics is frequently used by researchers in such fields as psychology and economics, which have reached advanced stages in the application of these techniques. As for fields like archaeology, history and anthropology, the use of such techniques usually speaks little to either the researcher or the reader. This is because scholars in these fields try to explain categorical data and relationship data, which they constantly come across in their texts, fields, or numerical platforms, in a meaningful context. In categorical (or nominal) data, as seen in the tax and surety registers used in this study, the number of observation units takes the form of contingency tables that change according to the scope and content of the subject matter. Therefore, these tables include data that is difficult to analyze or represent with the explanatory models that have been developed for ratio and interval variables and that draw linear-causal relationships between dependent and independent variables. Since social change does not follow a linear model, a conceptual language of analysis that will reveal non-linear causal mechanisms is needed to explain the complexities of the social world.
7 As discussed below, this requires a research design that will present relationships among categorical units in circumstances where the number of observations goes beyond the capacity of the human mind for simultaneous processing and that will represent structures and actors within the examined system of object relationships in their analytical relationality.
Researchers in the field of history are often reluctant to use statistics. Quantitative analysis, which was widely used in the field of history in the 1960s, was seriously criticized in later periods and its use has been minimized today, except for some particular fields such as economic history and demographic studies.
8 The problems of representation seen in fields like history and archeology have led researchers to concentrate on either micro or macro issues. Work based on archival sources has tended to study people, subjects, or their attributes in isolation from one another. Other work has tended to study issues on a macro scale and to reach macro conclusions. It may be possible to overcome this dilemma through new ways of analyzing historical quantitative data.
The main problem in the literature concerns the fact that quantitative analysis relies heavily on numbers without taking narrative sources into consideration. Furthermore, quantitative analysis is considered effective in identifying the details of a given situation, but it is somewhat insufficient in determining its causes. Historiography today prioritizes micro-studies and narrativity. It lacks sufficient methods for analyzing quantitative data and, having been drawn toward postmodern approaches as a result of disillusionment with positivism, seems to have abandoned quantitative analysis, which is marked by its macro-descriptive aspect. However, this disillusionment is valid for the postmodern approach as well. Consider the themes or topics studied on the basis of this approach. Why and how, for instance, does a postmodern historian select his or her micro theme, and where does this theme stands among the many other historical themes? The magic word here seems to be a “conjunction”. However, this cannot be justified without bringing out new exploratory research and conclusions from the archival sources.
In my opinion, the fact that quantitative methods have not been appropriately adapted for the analysis of categorical or qualitative data, which is particularly important in the field of history, has been a significant factor in this problem.
9 Nevertheless, the ways of analyzing quantitative data have developed significantly since the 1960s. On the one hand, contingency-table matrices have been used to interpret huge sets of nominal data in archival sources and, on the other hand, methodologies of semiology have been developed by J. Bertin (
Bertin [1967] 1983) and of correspondence analysis by J. P. Benzecri (
Benzécri [1973] 1992). These different paths and methodologies in pursuit of analyzing categorical data came into contact with one another only in the 1980s. After this date, the visualization of data became an international research program that started developing satisfactory ways of analyzing nominal data. The main problem at this point was the reduction of big or massive amounts of atomistic data in order to visualize them by using, for instance, correspondence analysis. Some scholars suggested a conceptual solution for this reduction process, whereas L. Lebart explored hierarchical clustering, which I have opted to use here (
Lebart et al. 1997). In short, the new methodologies have led historians in the direction of exploratory research that goes beyond both positivist and postmodernist approaches in their historical and archival studies.
The methods used both in clustering and in subsequent processes for this reduction of contingency tables should both be sensitive to the scale and complexity of the big data, and be of sufficiently high quality to measure relationships and mutual dependencies among total and singular observation units. This classification and reduction process must also be performed with minimum data loss and in such a way as to overlook only insignificant differences. Here, a two-stage procedure is required for data analysis. Large contingency-table matrices composed of atomistic data in which there are many observation units must be reduced to a category range of 7–10 (the amount the human mind can simultaneously process) in order to be legible via a taxonomic process that is sensitive to non-a priori scale and complexity. This is a clustering process that gathers the same type of data profiles in the same clusters and remains sensitive to the scale and complexity required by the data. Hierarchical cluster analysis is among the most advanced models for clustering categorical data via the language of relational classification. Data profiles, which are composed of many observation units (for instance, a contingency table that shows the distribution of 500 occupational groups from 200 neighborhoods or people from 500 occupational groups in 10 ethno-religious groups), are subjected to an iterative numerical classification process by rows and columns in the 7–10 range. Data in the contingency table should first be transformed into signed chi-square representations in order to perform this process in such a way as to be sensitive to scale and differences. Otherwise, it will not be possible to reduce the data, which is composed of numerous observation units, to relational cluster units. This representation is the most sensitive point of the process.
Considered the primary method among the most advanced representations of relational analysis, correspondence analysis is applied to data clusters in the second stage. In this analysis, not only are observation units assigned to clusters, which include the ones that most resemble each other, but the relationships established by these cluster groups in the social space can also be identified in a multidimensional distance scale (topological social maps). These operations are quite useful for developing a generative structural model of socio-spatial patterns of relationships. These relationships are reproduced in structures that can be transferred from generation to generation in a certain division of labor by individuals, groups and classes in the social world that have been established in flexible, but stable, forms in their own historical context. These research methods may help in multiple ways to design a productive research agenda in both history and other fields within the social sciences. In particular, they promise new avenues of analysis in the case of cities, which constantly evolve with the ongoing reorganization of social relationships over their complex spatial structures.
10The representation terminology offered here allows for the effective, valid, relevant and distinctive examination of large data sets in a way that is sensitive to complexity and is rooted in my epistemological position on how city space should be understood, which rests on the notion of “relational representation and categorization.” This terminology requires (re)presenting the structures in which social relationships are established as patterns to be examined, and analyzing changes in these patterns over time. Therefore, this process allows us to detect structural continuities and discontinuities among relationship systems, which is not possible with a chronological and linear research design that is not sensitive to the scale of the differences seen in and transformations undergone by socio-spatial structures with the passage of time. It thus allows us to shift from the abstract level to a concrete analysis of the question of “is it discontinuity, continuity, or both that prevails in the historical process?” The ability of relational representation languages to present the relationship systems of the past through an image of a living society is made possible by a careful approach toward the methodological questions concerning the validity of scientific representation.
3. Application of the Relational Approach to the Big Data on an Ottoman City
It may be useful to summarize the process as it relates specifically to the historical researcher. Endless amounts of information on different subjects are preserved in archives in a disorganized or semi-organized form. The information we find there may well be categorical data that are not enumerated or organized. Take, for example, a tax survey (tahrir) that contains data on the number of people from different religions, ethnicities, occupations, statuses, genders, etc. and the mahalles in which these people reside. If the data included in this register book involve too many attributes to analyze by hand, the process of using it may become a bit complicated. However, this data can be arranged, enumerated and made ready for statistical analysis with a taxonomic process based on a relational methodological perspective. Here, all information related to the individuals in the documents can be enumerated in reference to occupation, religion, ethnicity, status and gender based on the actual form in the archival text. (For instance, 1 for Muslims, 2 for Jews, 3 for Gypsies [kıpti], etc. in the Religion section; 1 for water bearers, 2 for tailors, 3 for butchers, etc. in the Occupation section; and 1 for the Muradiye mahalle, 2 for the Gazi Mihal mahalle, 3 for the Hadım Firuz mahalle, 4 for the Altunî mahalle, etc. in the Mahalle section). The data used in historical research is particularly complicated and contains a great deal of attributes; it also exists in the archival records in a disorganized manner, and thus requires a meticulous preparation process for investigation. All registered data can be transformed into contingency tables after this enumeration process. Following this stage, other processes can be performed with the methods described above, i.e. hierarchical clustering, correspondence analysis and mapping.
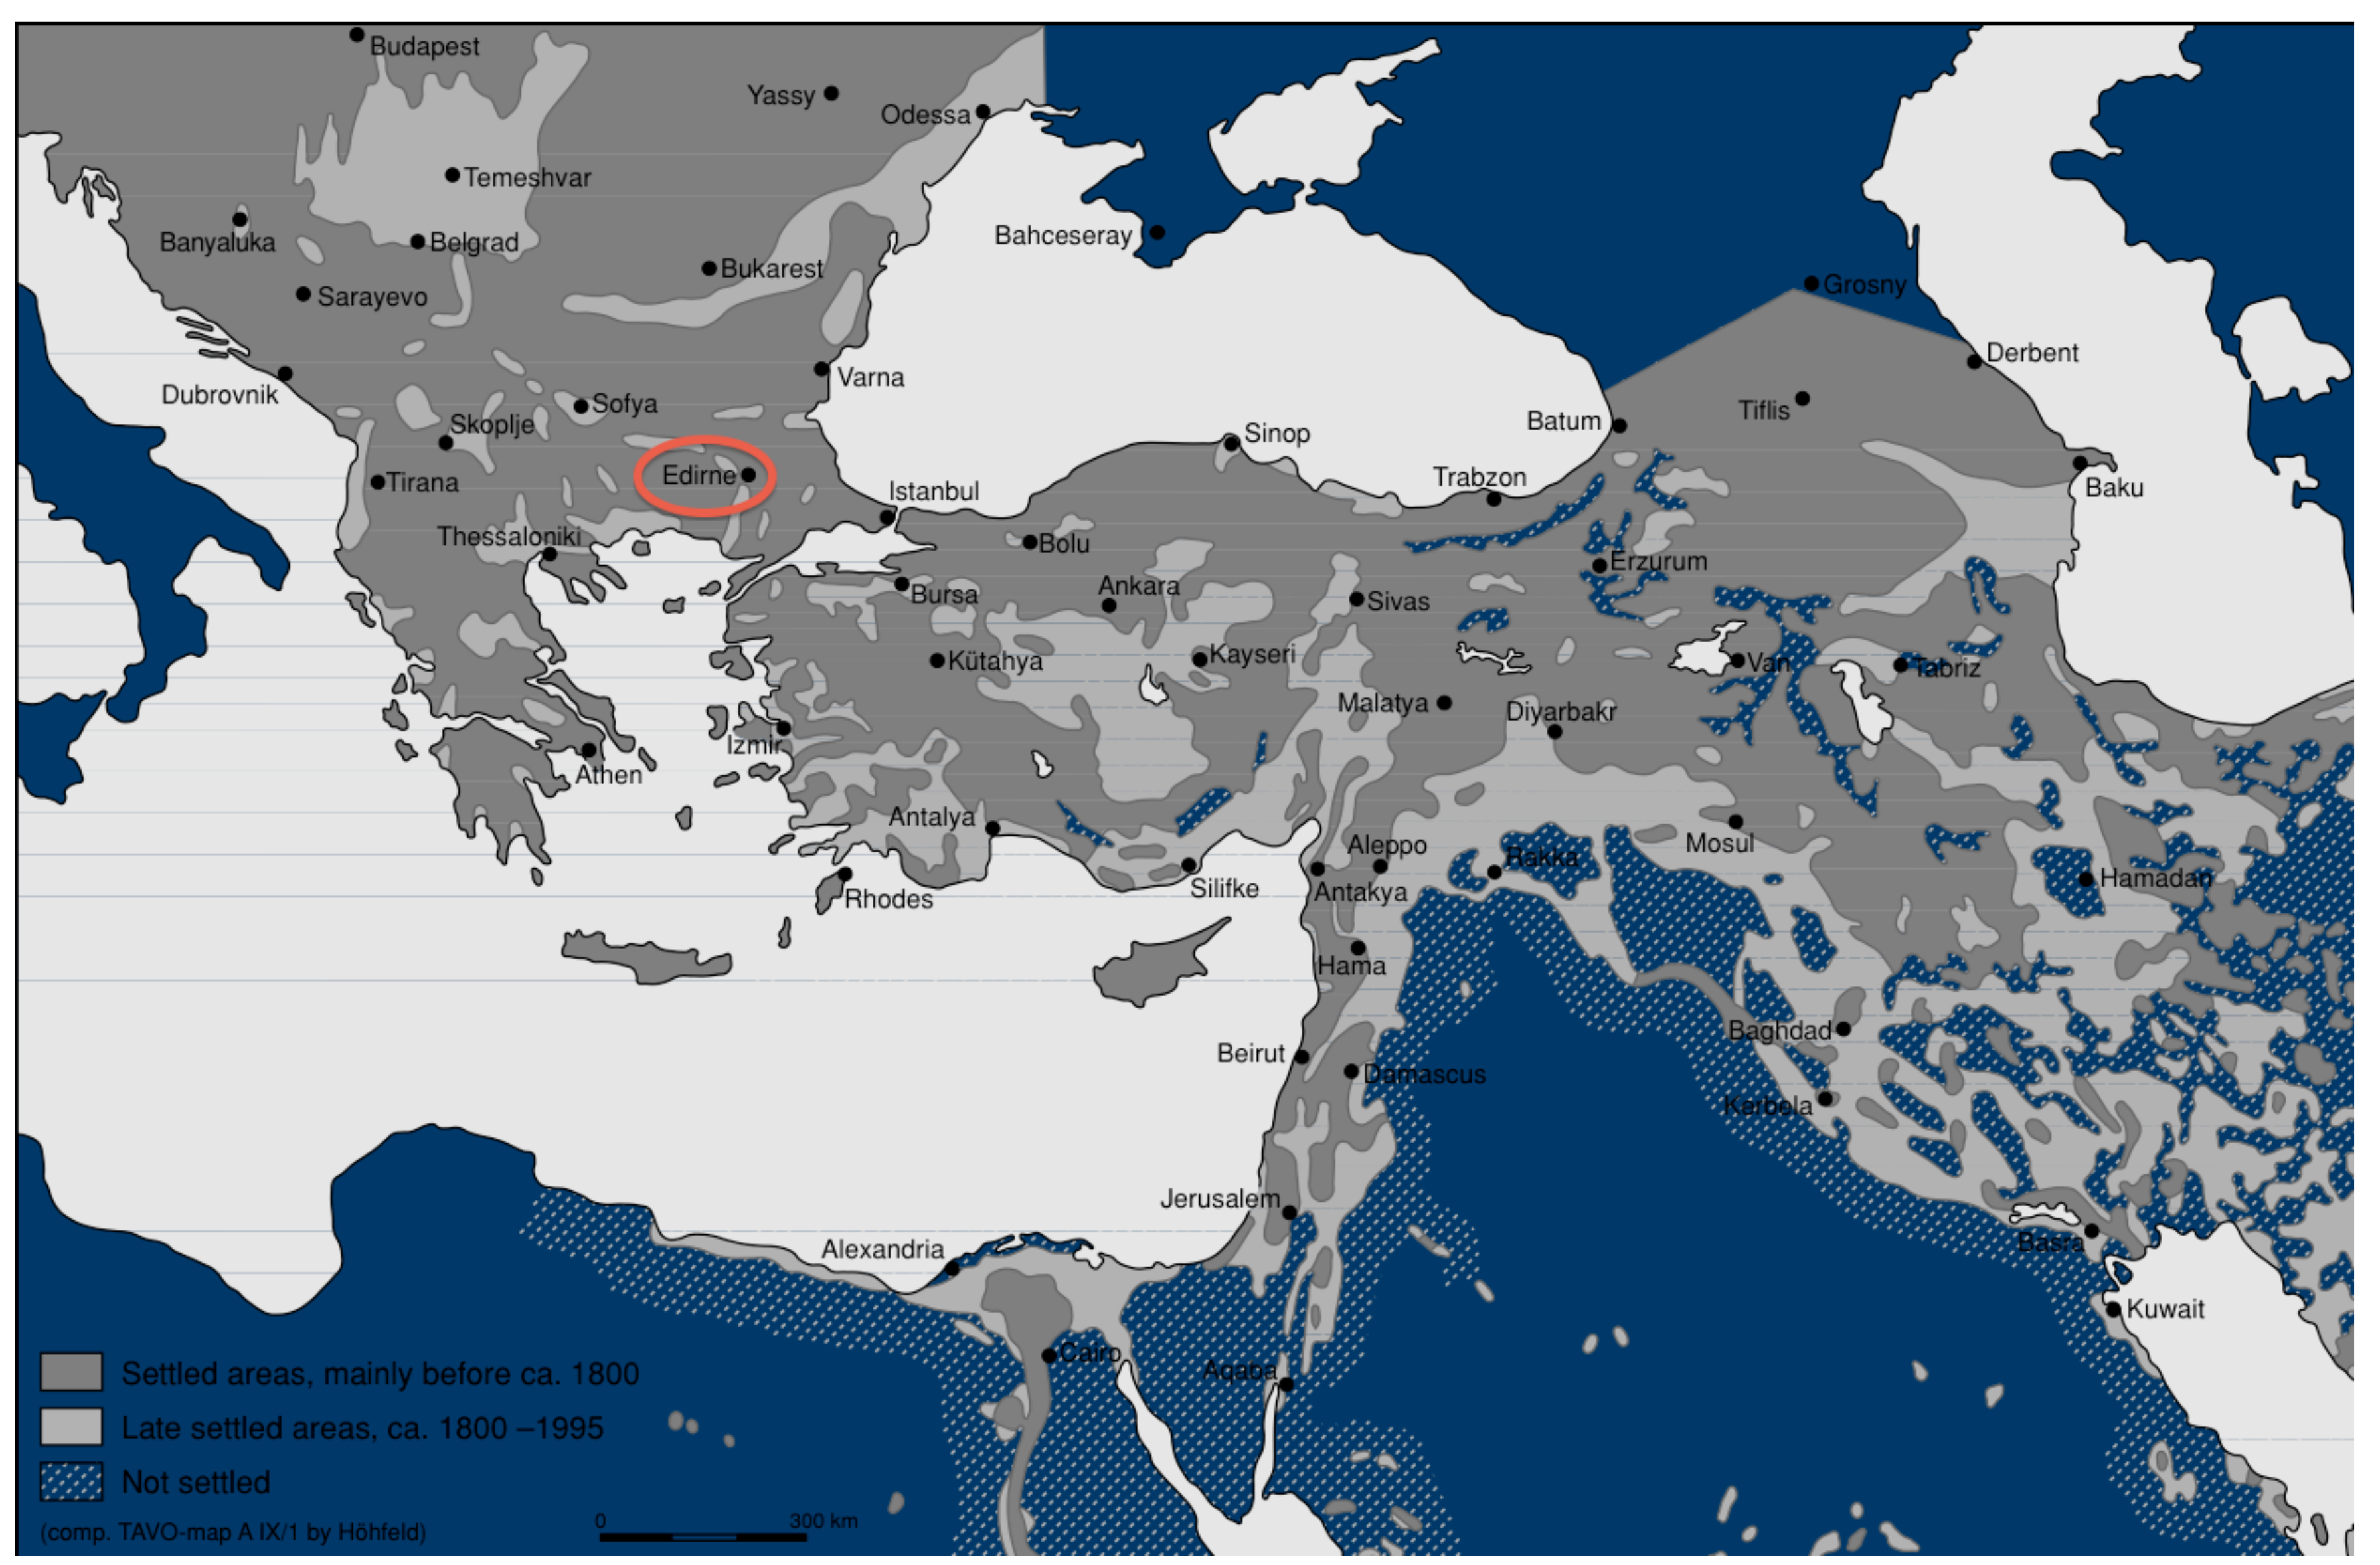
Let me now try to test the methodological discussion with a concrete sample of the tax and surety surveys of Edirne. These records include information on the people who lived in Edirne, a capital city of the Ottoman Empire with a population of about 40,000, in 1686 and in 1703 (See
Figure 1).
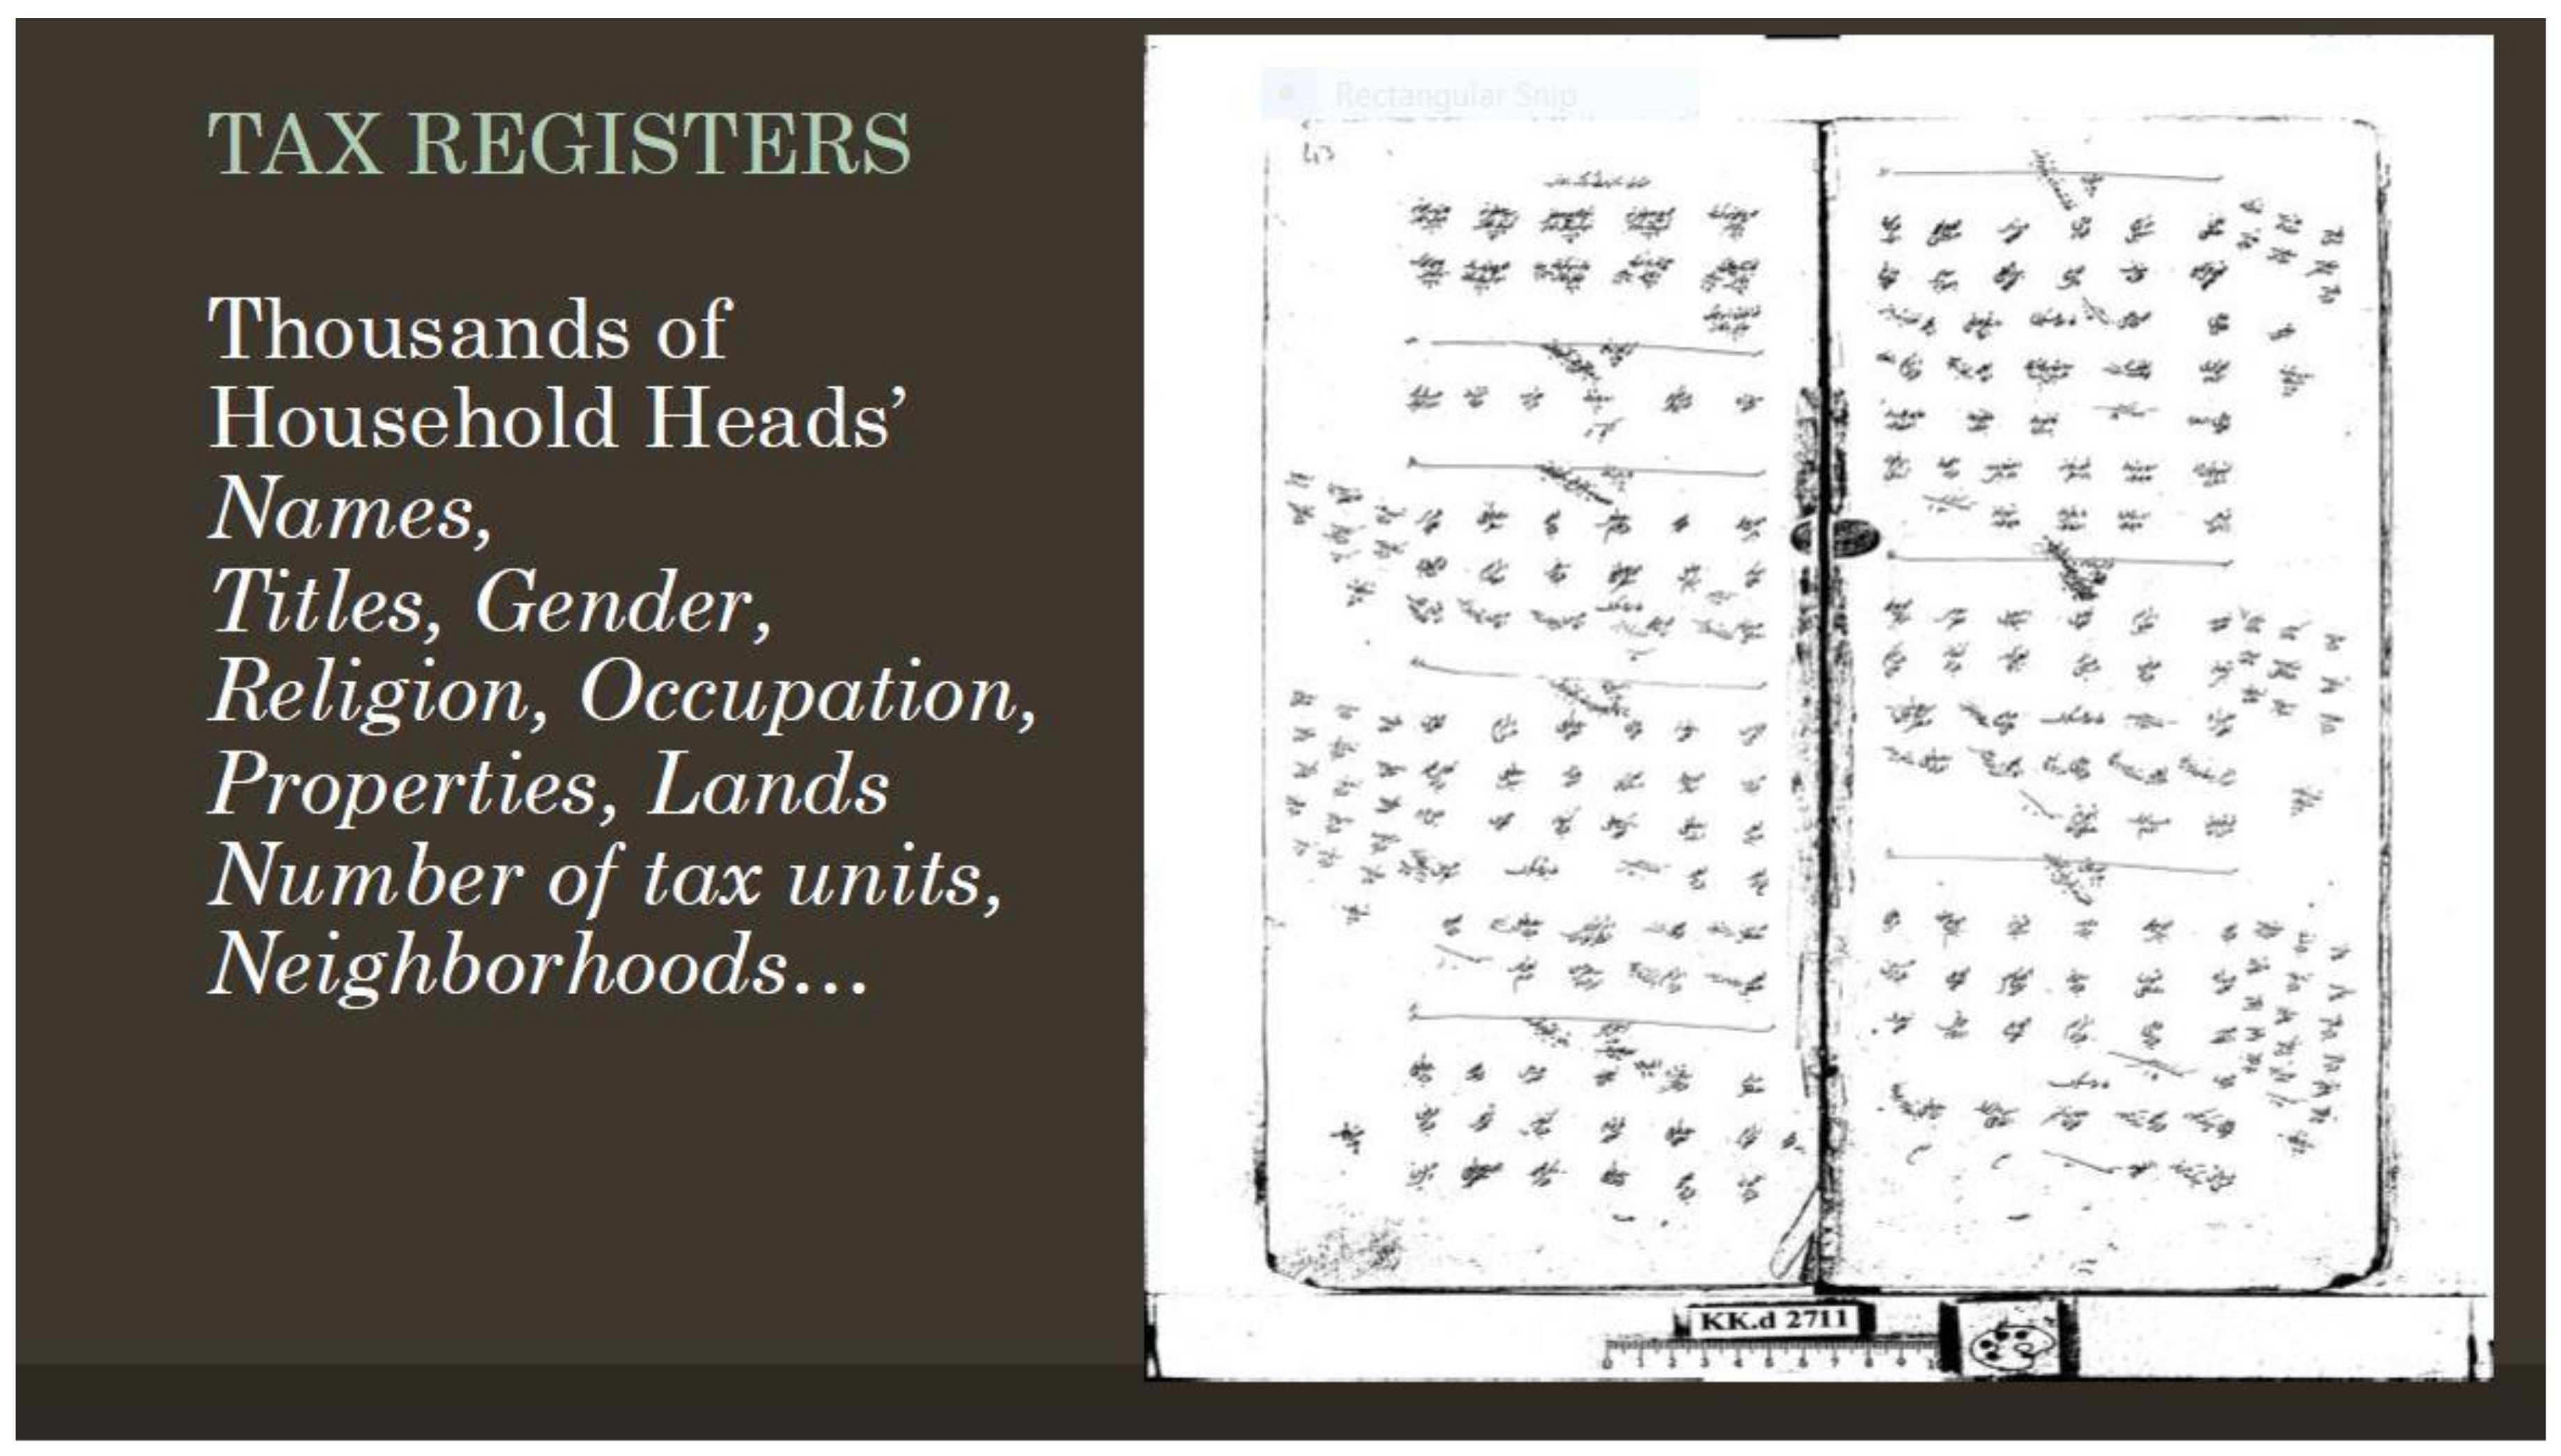
Names, titles, occupation, gender, religion, property status, and numbers of tax units (
avârızhane) are included in this information (See
Figure 2). All this information is given on the basis of the
mahalle/neighborhood, and this should encourage us to read the city by taking the neighborhoods or spaces as our point of departure. Now the picture drawn from this is as follows: There are about 10,000 household heads at either date, and there are about 10 different attributes listed for each household head. Some of this information is numerical (e.g., number of tax units), but a majority of it is nominal. As mentioned before, while some categorical data, like religion and gender, can be analyzed without further classification, it is not possible to analyze information like occupation without clustering, since there are hundreds of varieties of such data. We can perform these analyses in the first stage with conventional statistical methods. However, when we try to explore two more basic issues—namely, connecting the data types with each other and highlighting the distinguishing differences among the neighborhoods—we are not able to do either using conventional methods. We must, therefore, turn to another method: correspondence analysis. This method allows us to treat all the elements in the city in relation to one another and helps us to lay out the general features of the Ottoman city in a more comprehensive fashion.
I conducted the first analysis with the help of averages, medians and percentages. For the second analysis, I used correspondence analysis. For this, as discussed above, I first reduced a large number of observation units, 100–150 × 10–200 matrices, to a 7–10 row/column range using hierarchical clustering analysis.
11 Minimal data loss (effectiveness), valid results, and ease of readability are only possible in a 7–10 row/column
12 configuration during correspondence analysis. Following this process, I included signed chi-square
13 and percentage tables in the analysis in order to make the accumulation and differentiation of the data more clearly visible.
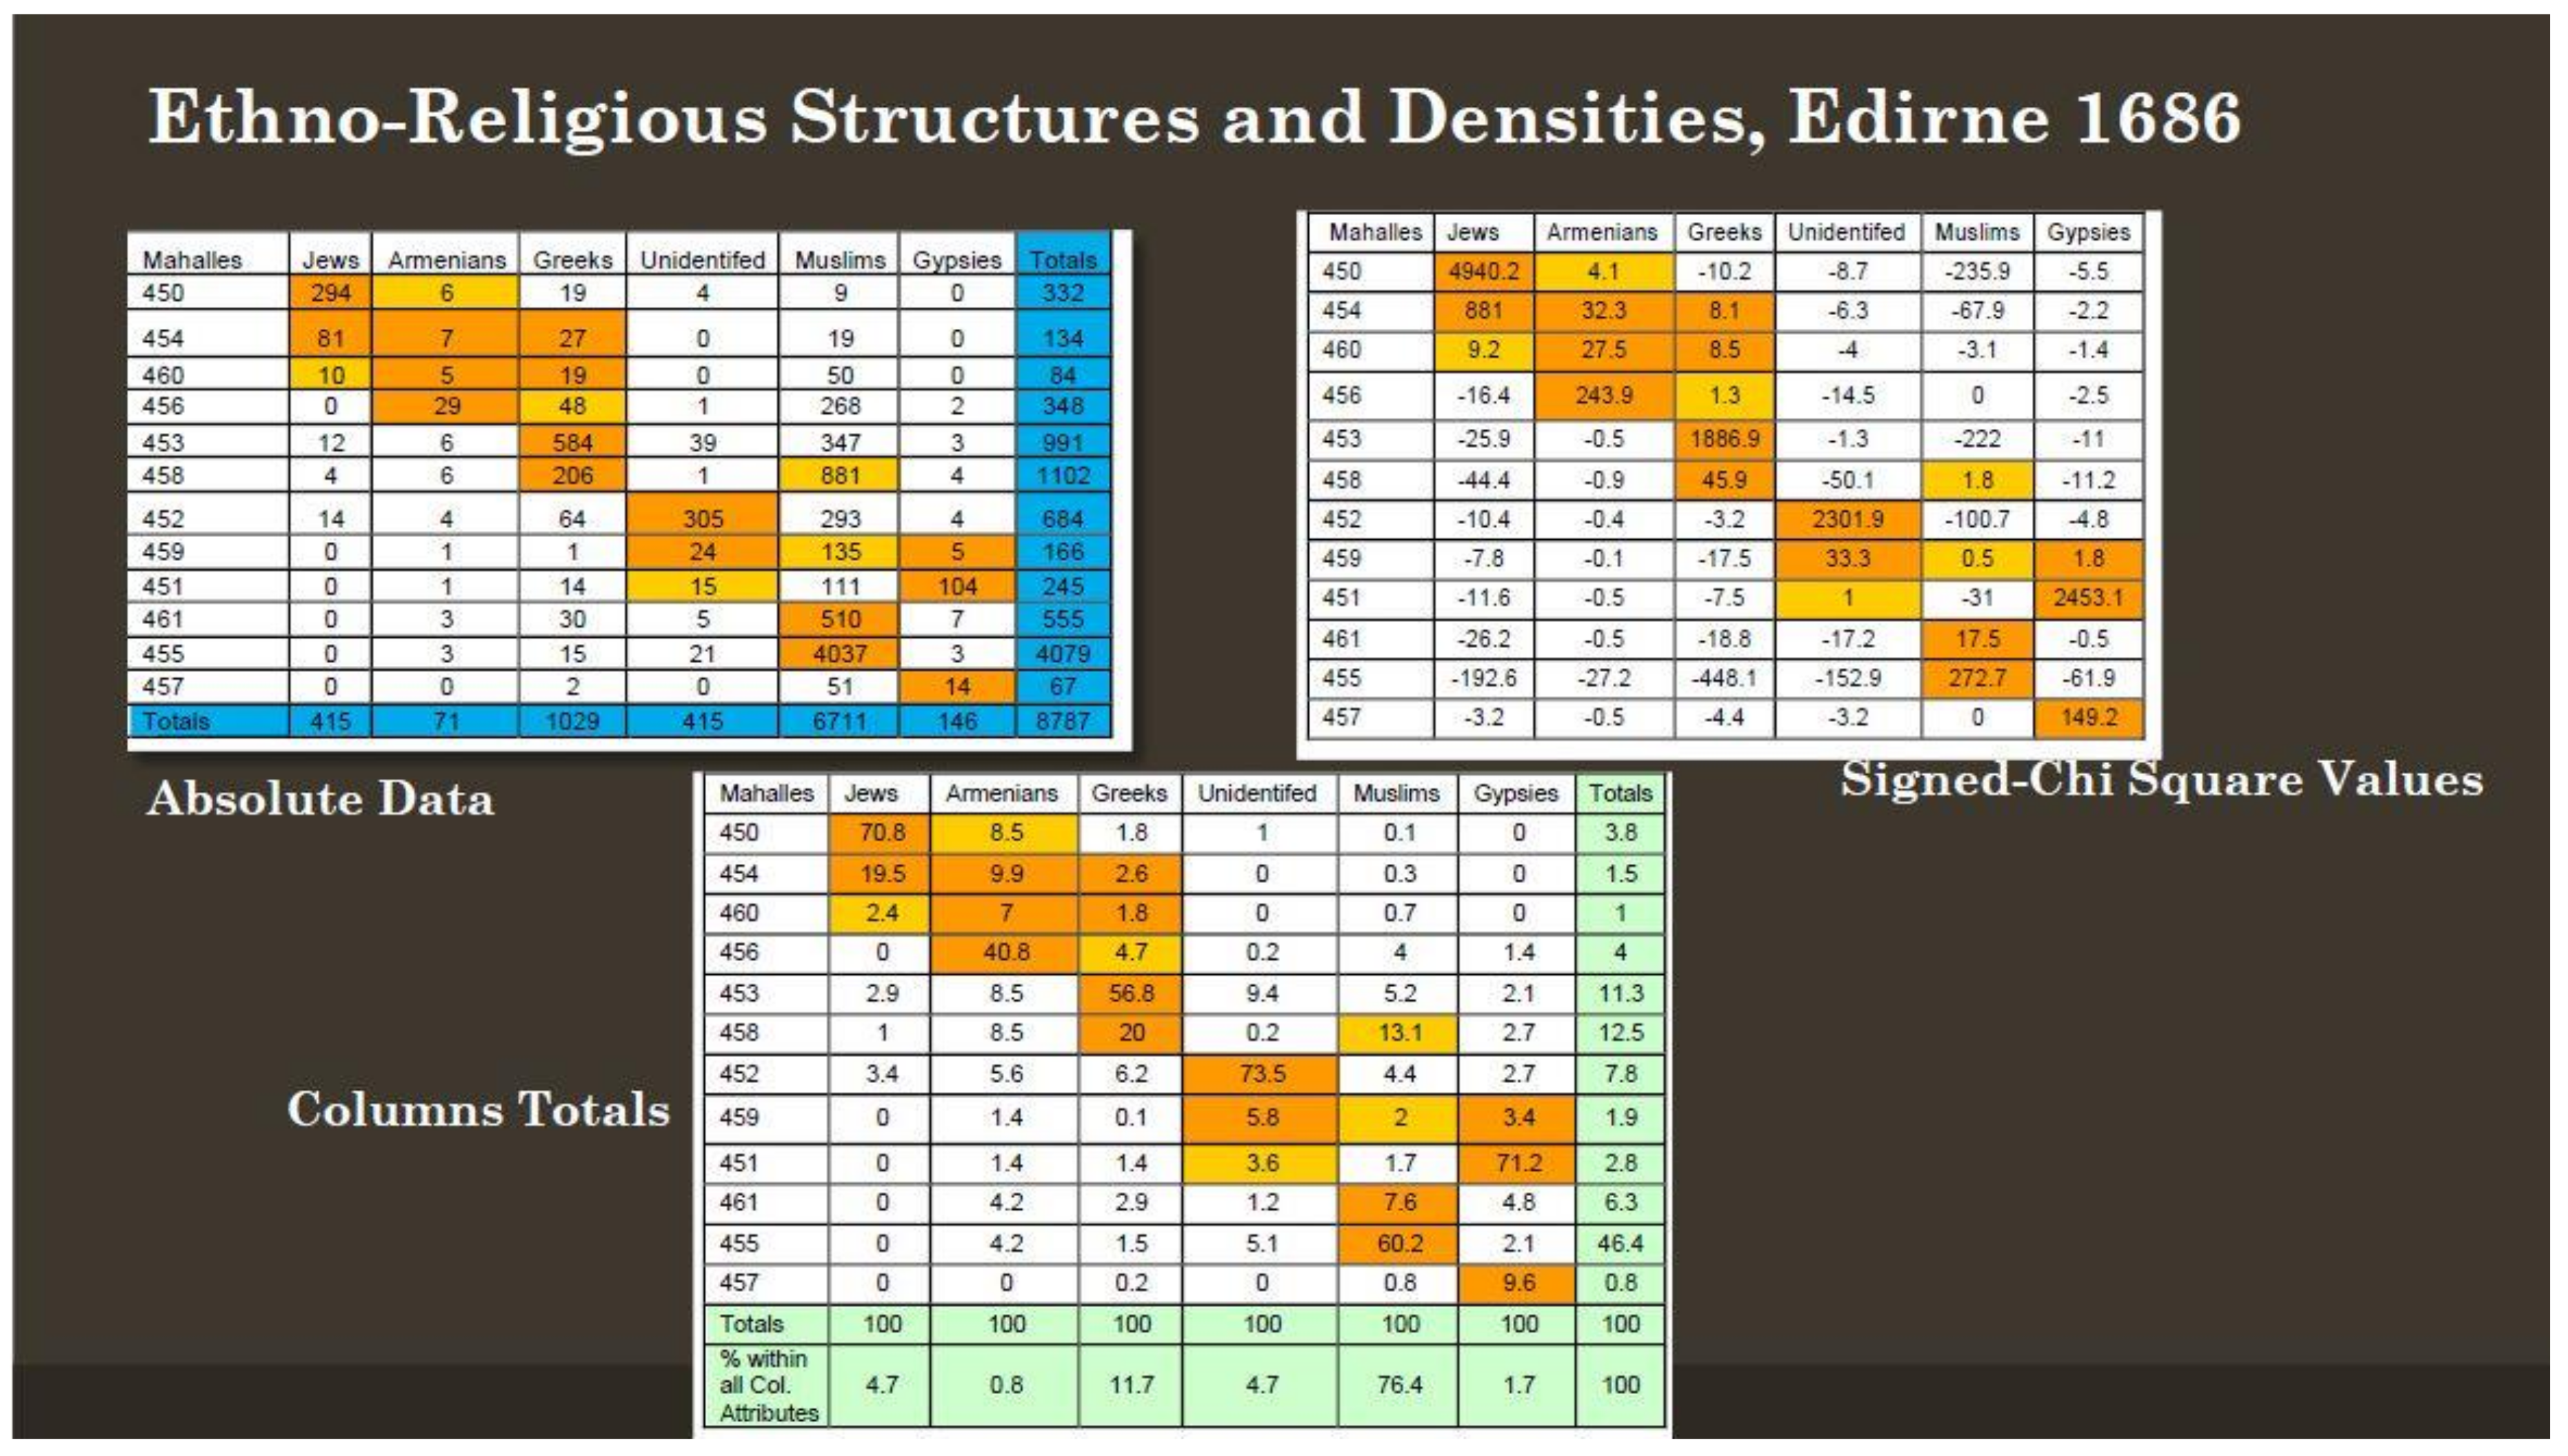
As an outcome of this second analysis in the case of ethno-religious differentiation in Edirne, the column section of the tables in
Figure 3 shows the attribute groupings, whereas the row section shows the spatial groupings. Four types of table emerged. The first one shows the real, that is, the absolute values of the groups. The second one measures the spatial representation of the attributes as indicated by the signed chi-square values. By taking all of the data into account, the ones that are over-represented compared to the expected value in a space are signified with a “+” sign whereas the under-represented ones are signified with a “−” sign. Over-represented ones signify distinctive ones and show the groups, the specialized spaces, and the spatial neighbors that are identified in that attribute, ethno-religious identities. All the
mahalles of Edirne were classified into 12 clusters according to the resemblance (
dispositions) among them in terms of six types of identities. The cells colored with bold orange in the tables signify the over-representation or full concentration of ethno-religious attributes. In the signed chi-square table, which is created by the correspondence analysis, the more the figure increases positively in cells, the more over-represented or predominant this attribute is (meaning that the observed value is above the expected value). The minus sign indicates the under-representation of the attributes (meaning that the observed value is under the expected value). The third and the fourth (not in
Figure 3) tables show the sums of columns and rows, respectively; that is to say, they are percentage maps. The sums of columns show the structural differentiations of Edirne with respect to ethno-religious attributes and its density, whereas the sums of rows show the local specializations in the
mahalle scale.
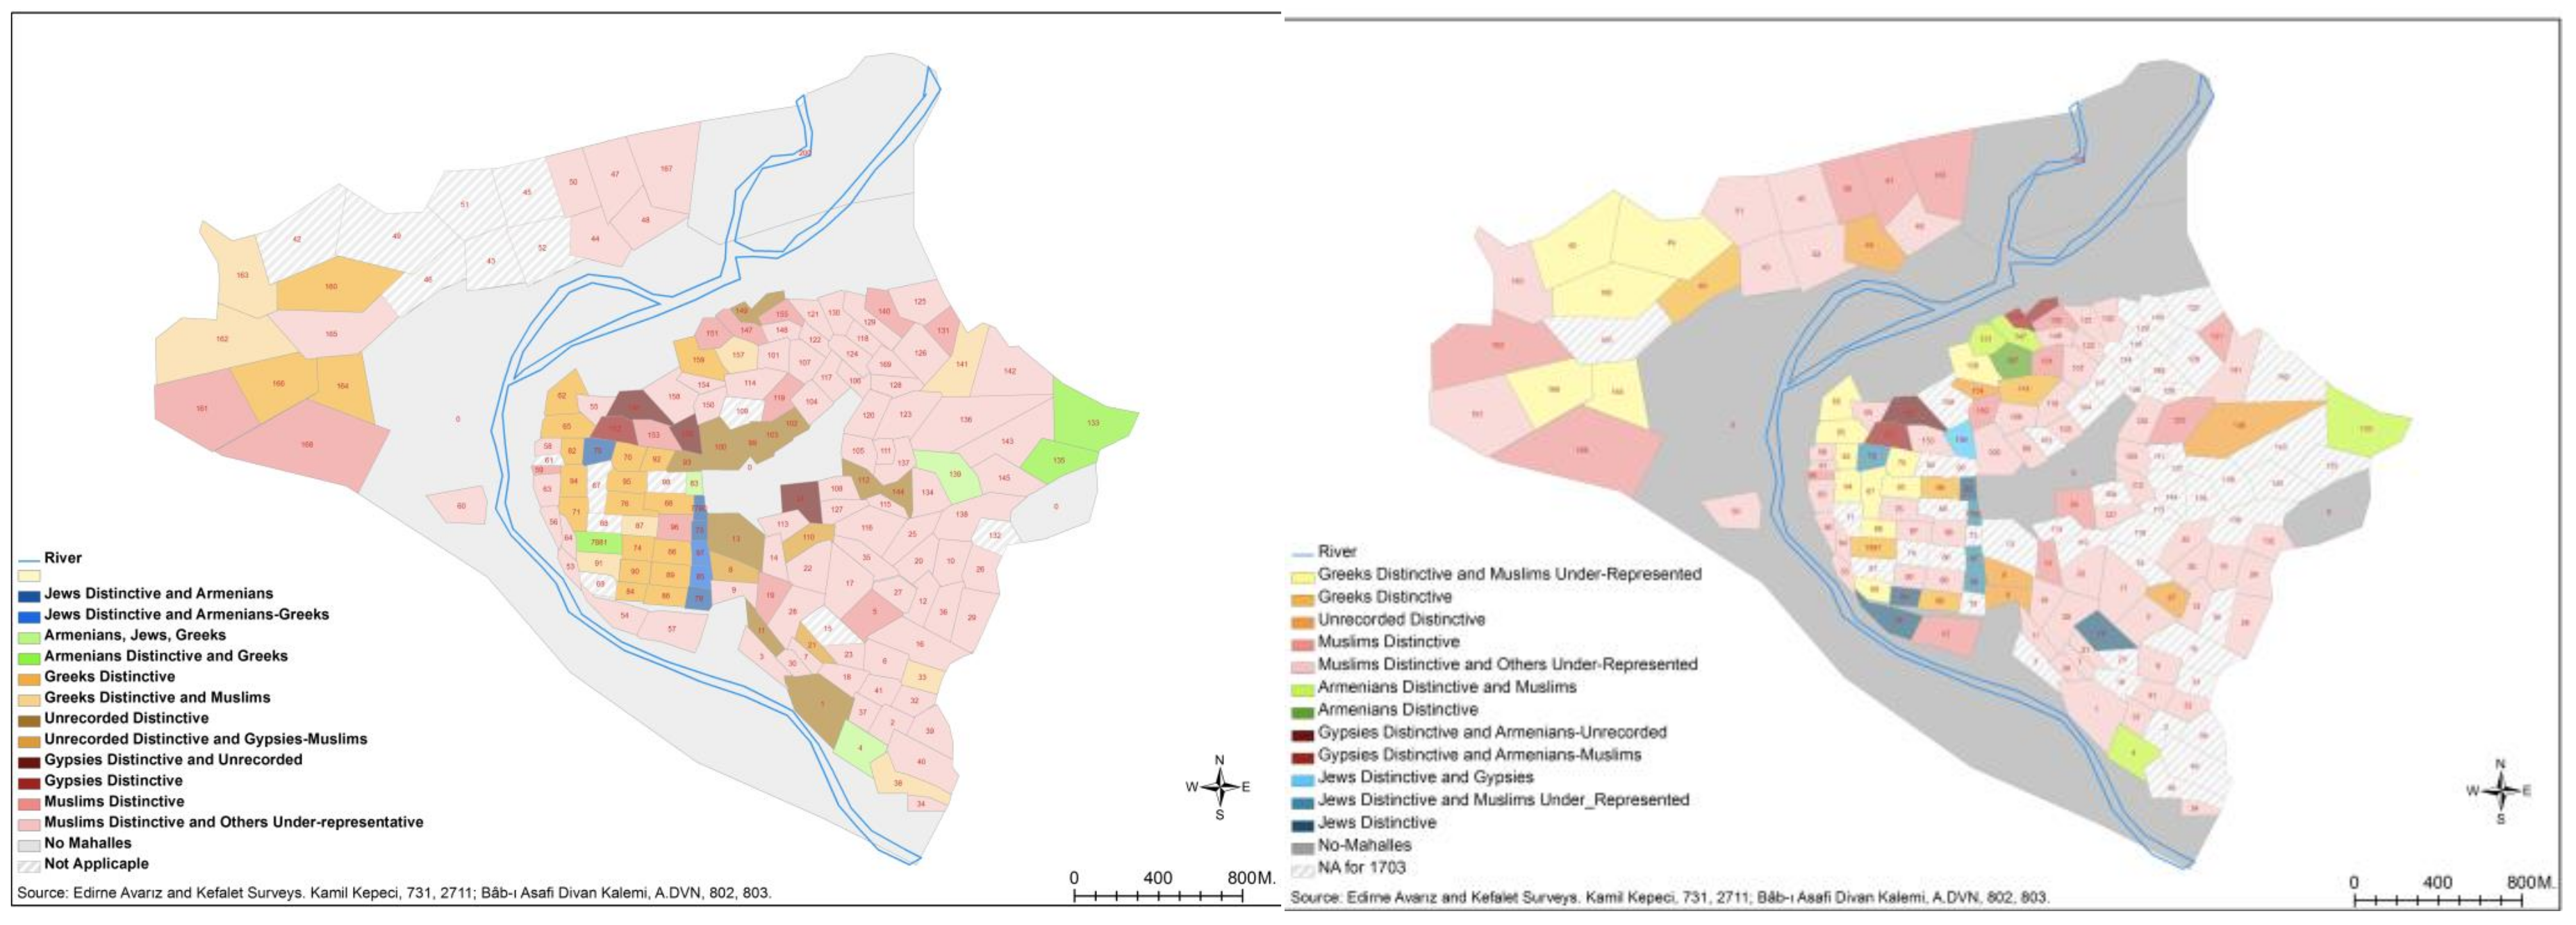
For instance, the Jews lived distinctively in the mahalle group numbered 450—i.e., the four mahalles Çelebi Emir Ali, Devlet İslam, Hac Bedreddin and Hacı (Hoca) Bayezid in the Kaleiçi district near Saraçlar Street. Armenians also lived together with Jews there, but Greeks and Muslims were very under-represented. The Kahtalu and Yahşi Fakih mahalles were also Jewish areas with little Armenian or Greek presence. The mahalles where the Jews were under-represented the most were also the mahalles where Muslims were over-represented. It seems that Jews and Muslims did not have a tendency to live together in the mahalles. Armenians settled distinctively in the Çokalca and İbrahim Paşa mahalles in the Kıyık district and the Hac Doğan mahalle in Kaleiçi. They lived together with people of other religions. Greeks were over-represented in 20 mahalles of Kaleiçi and its surrounding districts of Gazimihal, Saraçhane and Yıldırım. They did not mix with the Muslims, especially in the mahalles of Kaleiçi. Muslims, on the other hand, distinctively dominated in the 80 mahalles outside of Kaleiçi, and they did not reside together with Gypsies, unidentified people (no information in the sources), Greeks, or Jews. In short, Jews, Greeks, Gypsies and unidentified people had a strong tendency to live by themselves and separately from others. Muslims and Armenians did not concentrate strongly in certain mahalles. While Armenians lived throughout the city, they had a tendency to live in particular places, especially in the periphery of the city.
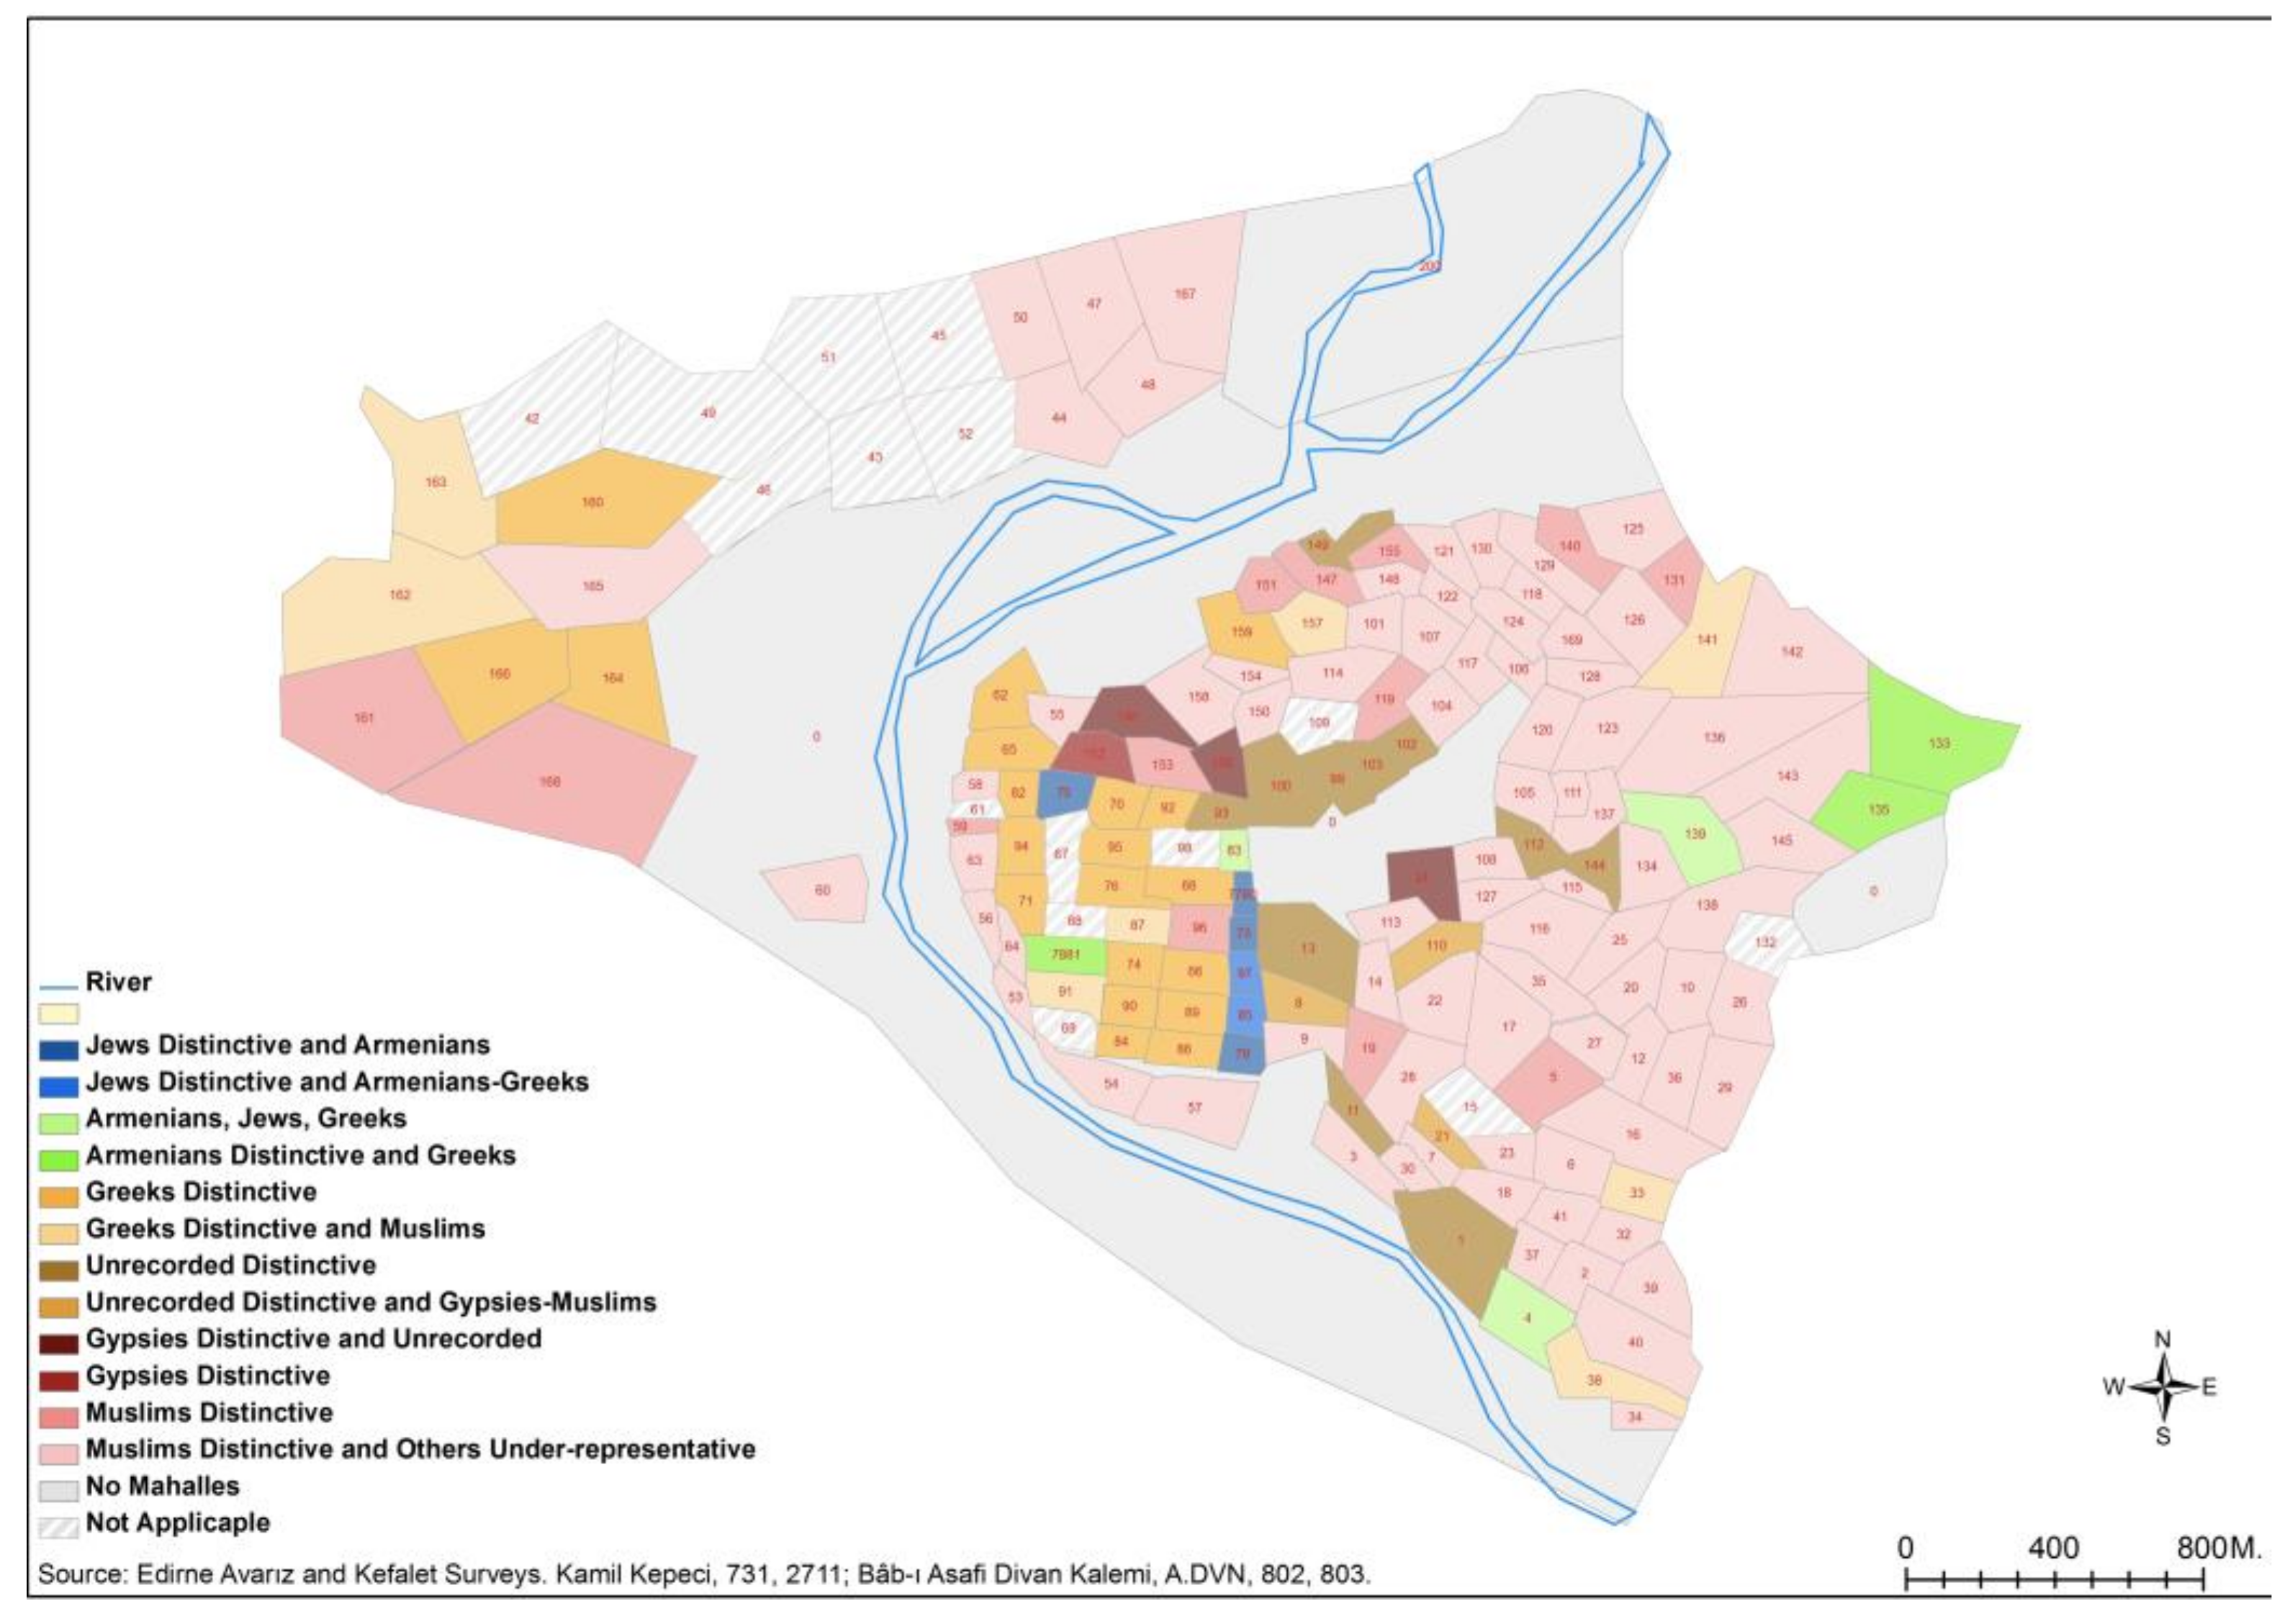
For the third analysis, I produced a map of the city showing the groupings that occurred in the tables. In
Figure 4, the clues and information supplied by various kinds of sources, from Ottoman chronicles and archival sources to histories of Edirne, were collected and a GIS map program called ArcGIS was used in order to determine neighborhood locations. A map of the neighborhoods of Edirne was formed on the GIS virtual map of Edirne by drawing the approximate borders of these neighborhoods, estimated on the basis of their population size. The neighborhood groupings, which are shown in the tables above, were marked on the map in different colors. These groups were given names referring to the over-represented groupings they contain. An attempt was made to show the distribution of the results on the space as clearly as possible.
Data on the city can be depicted via the first analysis. Thanks to the second analysis, and in line with the guidance of the sources, I had the opportunity to see how these attributes differed across the space of the city. In addition to the topographical vicinities of the mahalles, I explored socio-spatial neighbors via the scale of the attributes’ mutual correspondence. I found that certain attributes of people and groups of neighborhoods located in different topographical regions resembled each other; these groups, which are not physically neighbors, are parts of disposition systems with respect to their social characteristics, and they are shown on the map with the same color. Identifying such “neighborhoods” in the social space of the city offers important clues about the establishment mechanisms, diversification principles and qualities of the Ottoman city. These neighborhoods were clustered without making any hypothetical or a priori grouping and without leaving out any data by recording the information in the records exactly and via correspondence representations. I have thus avoided anachronism by representing these neighborhoods with their original attributes. “The data spoke by themselves” and the uniqueness and groupings of that period were presented via a relational representation language. In short, this methodology makes it possible, here in the case of Edirne, to explore the distinctive ethno-religious character of a city’s neighborhoods rather than simply describing them as either homogeneous or heterogeneous on the basis of the ethno-religious proportions in a neighborhood. In terms of ethno-religious spatial proximity, for instance, there were similar trends in 1686 and 1703. Armenians co-existed with all other groups, whereas Greeks and Jews preferred to live by themselves in their own neighborhoods. A similar pattern was present for Gypsies (kıpti) and the “unidentified” people (most probably the unmarried people living in hostels), who both had a tendency to settle in an area by themselves.
In this analysis, I also found the opportunity to follow up and interpret the changes the city underwent at a significant conjuncture in two critical time periods (see
Figure 5). Comparing the map and tables of 1703 with those of 1686 confirmed that this short period between 1686 and 1703 witnessed some interesting intra-city movements of groups. The historical context of the period and catastrophic natural events (i.e., the fires of 1701 in Kaleiçi and its vicinity) seem to have resulted in a spatial reorganization of the city. The Kaleiçi district transformed from one dominated by non-Muslims, especially
zimmi-Greeks, into one where Muslims and non-Muslims co-existed, although in different
mahalles. Prior to 1703, the only major Muslim groups to reside there were state officials and Sufis. The fires and the restoration or reconstruction works that followed them might have given Muslims this opportunity to move to the district. The Greeks in this process moved not to the inner sides of central Edirne but to the other side of the river, to the site of their old settlement area of Aina in the Yıldırım district. It is significant that Greeks did not inhabit specific
mahalles in different districts spread throughout the city; instead, they preferred
mahalles in two specific regions. This reflected the nature of their mobility; these locations were not randomly chosen, but were a conscious strategy on the basis of group dynamics. Armenians, on the other hand, continued to live on the edges of the city, even replacing Greeks in some
mahalles in the Kirişhane and Saraçhane districts. Saraçhane was important at that time because it was home to the palaces of the grand vizier and Sinan Pasha and was also close to the sultan’s palace. It was likely a strategic preference for Armenians to dominate the
mahalles near the palace, in addition to maintaining their already-settled places on the edges or gateways of Edirne. This was probably because of their daily commercial and financial activities, both with the palace and with merchants and traders. The edges, or corners, of the city were good locations, since there was a small commercial center around the İbrahim Paşa mahalle on the eastern corner and the Mezid Bey hospice in the southern corner of the city. It should also be noted here that the distinctive locations of the non-Muslims were mostly next to the Muslim-dominated
mahalles but were not completely surrounded by them. One or two sides of their settlement areas were non-residential areas, as in the case of the
mahalles in Yıldırım, Saraçhane, Kirişhane, and Kıyık, and even those in the Kaleiçi district.
In conclusion, in this study, I have offered an example of an innovative approach toward the quantitative analysis of urban history as applied to the particular case of the Ottoman city of Edirne. By this approach, attributes and places are grouped in accordance with their shared similarities; and their distinctive features, which distinguish these groups from one another, are presented with tables. All tables were presented by means of the mutual relationships among the observation units found in the archives. This integrative-relational approach is radically different from the language of positivist representation, which analyzes attribute profiles in isolation and stripped of their contexts. Using this approach, I was able to show how attributes like occupation, property, religion, gender, workplace and title concentrate at the neighborhood level and how neighborhoods differ in terms of these attributes. I was also able to visually represent the change undergone by the city of Edirne in two different periods—1686 and 1703—via its different attribute profiles in two successive phases. This was an opportunity to see what changed in the city and what did not. In terms of its method, this study has also made an important contribution by applying relational methodology to the problem of following continuity, discontinuity and change over different time series (sequences), which is among the most important methodological problems of historical studies (
Müller-Schneider 1994, pp. 267–79).


