Abstract
The article addresses the question of how successful the European natural gas reforms of 1998, 2003, and 2009 have been in terms of increasing competition in the sector. We argue that regulatory provisions are policy output variables, which as such do not affect competition directly. However, successful reforms can have an impact on the market structure, which might lead to increased competition and price reductions. Thus, it is pivotal to differentiate between policy output and outcome variables. Therefore, we first conduct a cross-sectional analysis of the regulatory impact on the market structure. Second, we apply error-correction models to test whether changes in the market structure affected the price development. Our findings suggest that the market reforms were successful in terms of liberalizing the sector, whereas the market structure did not affect the natural gas prices. Thus, we see a “successful failure” of the European natural gas market reforms.
1. Introduction
The European Union’s (EU) energy policy aims at fulfilling three objectives in a balanced way: security of supply, competitiveness, and environmental sustainability (European Commission 1988b, 2007). Since this makes energy policy a multi-dimensional issue (Prontera 2009, pp. 3–9; Tosun et al. 2015, pp. 4–6), evaluating its success is a challenging endeavor. This might explain why research has focused on the subject of regulation but neglected to analyze “the governance factors behind successful or effective regulatory regimes” (Sovacool 2014, p. 22) so far. We aim at addressing this research gap by analyzing how successful the EU’s internal energy market program has been regarding the creation of a competitive energy market exemplified by the natural gas market regulation. We concentrate on the objective of competitiveness for two reasons: First, although creating an internal energy market (IEM) has been high on the European Commission’s (Commission) agenda for decades, it still is not completed. For instance, in 1968, the Commission presented the first guidelines for a community energy policy to the Council of Ministers. The Commission stressed that “there are still serious obstacles to trade within the Community as regards energy products” (European Commission 1968, recital 4). However, this did not trigger a regulatory activity aiming at dismantling these obstacles to trade. To the contrary, EU’s energy policy ranked between being “the perennial underachiever of Europeanization” (Eberlein 2012, p. 147) and “one of the Community’s major failures” (Padgett 1992, p. 55). This started to change with the IEM program, which the Commission initiated in 1988 (European Commission 1988b). As a result of this program, EU policy-makers (inter alia) agreed upon three energy packages between 1996 and 2009, which introduced provisions regarding the removal of barriers to trade in the EU’s electricity and natural gas sector (for an overview, see Cameron 2005, 2007; Grunwald 2003; Johnston and Block 2012). Nonetheless, the above-quoted Commission’s assessment of 1968 is still topical today. In late-February 2015, the Commission released a Communication entitled “Energy Union Package”, in which it stated that “Europe’s energy system is still underperforming” (European Commission 2015, p. 7). Put differently, although achieving an IEM has moved from the periphery to the center of the political agenda1 (for a similar assessment, see Sandoval and Morata 2012), it has not resulted in a single energy market, but in 28 related energy markets with as many national regulatory frameworks (European Commission 2015, p. 3). Consequently, the question arises whether the regulatory provisions stipulated by the EU have been appropriate with regards to the creation of a competitive IEM. Second, the IEM was part of broader, widely supported policy programs (Herweg 2015; Nylander 2001), namely the single market project (from 1988 to 1999) and the Lisbon strategy (from 2000 to 2010). Pivotal for both projects was the idea to create a single market, which should boost Europe’s competitiveness (European Council 2000, p. 1; European Commission 1988a, p. 7). Thus, policy-makers’ success regarding the creation and completion of a competitive IEM directly affects policy goals in related policy areas. For instance, high energy prices yield a competitive disadvantage for energy-intense industries located in the EU. Consequently, gaining insights about the regulatory success in terms of creating a competitive IEM is also relevant for related policy areas.
We focus on natural gas regulation instead of electricity regulation for three reasons. First, the importance of natural gas in the European energy mix has increased tremendously in the last decades as can be seen in Figure 1.2 Second, natural gas is an important source of electricity generation3 and as such it also has an impact on the electricity price development; and third, the EU is highly dependent on natural gas imports, in particular from Russia (see Figure 2).4 The latter is particularly delicate, because it adds an energy security dimension to natural gas regulation, which might complicate strengthening market mechanisms in this sector.
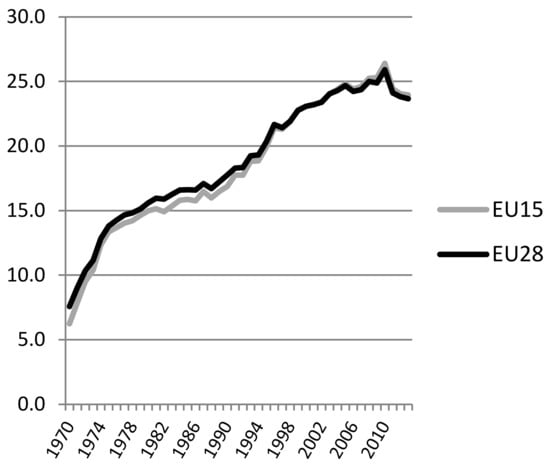
Figure 1.
Importance of natural gas in the European energy mix.
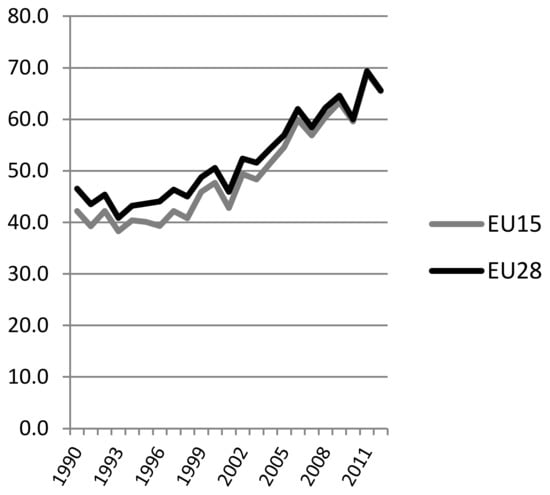
Figure 2.
Europe’s natural gas import dependency.
If we look at the development of mean gas prices for industrial and private consumers in the EU15 between 1998 and 2013, Figure 3 and Figure 4 show an upward trend, especially since 2004. This needs explanation since it contradicts the expectations that were associated with the European gas market reform. If the EU natural gas reforms had been successful, this should have gone down along with: (1) price reductions (resulting from increased competition); and (2) price convergence resulting from the creation of one common market (cf. Jamasb and Pollitt 2005). However, a price reduction did not take place. On the contrary, the gas market reform did not prevent a price increase since the beginning of the 2000s, following a phase of relative price stability in the 1990s.
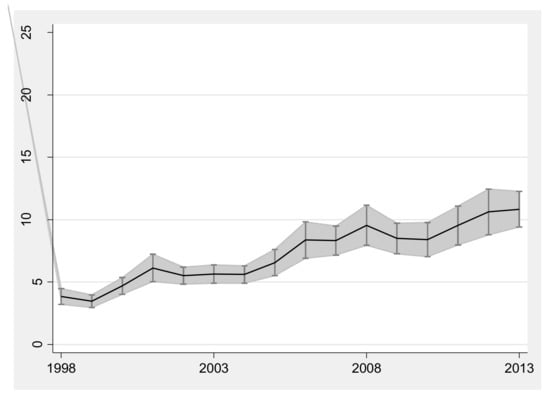
Figure 3.
The development of gas prices for industrial consumers, EU-15, 1998–2013. The bold lines show the mean of EU-15 gas prices, whereas the development of the standard deviation is represented by the grey hatched areas. Source: Eurostat Database.
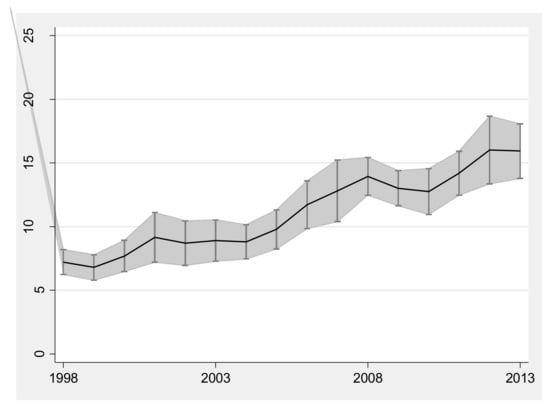
Figure 4.
The development of gas prices for households, EU-15, 1998–2013. The bold lines show the mean of EU-15 gas prices, whereas the development of the standard deviation is represented by the grey hatched areas. Source: Eurostat Database.
Regarding the natural gas regulation, we take the three gas directives introducing common rules adopted in 1998 (European Parliament and Council of Ministers 1998), 2003 (European Parliament and Council of Ministers 2003), and 2009 (European Parliament and Council of Ministers 2009) as a reference point. In a nutshell, we argue that the directives do not have a direct impact on the natural gas price but on the market structure, provided they are implemented properly. Properly implemented these directives should increase competition on the natural gas market, which leads to price reductions and (assuming the directives are evenly implemented across the EU) price convergence. By strictly differentiating between policy output variables (member states’ policies implementing the EU gas directives) and policy impact variables (capturing the market structure), we assess systematically first, whether the gas directives have an effect on the market structure, and second, whether the market structure has an effect on the natural gas price (policy outcome). Although other studies also addressed the question of how successful the European natural gas regulation has been in terms of its policy outcome (in particular, price reductions), they did not differentiate between policy output and impact variables. This is the research gap we seek to fill with the present contribution.
The plan of the article is straightforward. In the next section, we briefly summarize contributions that assess the EU’s gas market regulation in terms of its effect on the natural gas price. Then, we introduce our model and our research design. This is followed by the presentation of our empirical analysis and the last section summarizes our main findings.
2. Assessing the European Gas Market Regulation: A Brief Literature Review
Although many countries have passed and implemented regulatory reforms that aimed at increasing competition on their natural gas markets, only few studies actually assess how successful these reforms have been in terms of price reductions (Growitsch and Stronzik 2014, p. 210). This limited scientific interest is particularly striking regarding EU natural gas regulation, because the reduction of energy prices was one pivotal objective of the IEM project in 1988 (European Commission 1988b, p. 15). To the best of our knowledge, only the contributions delivered by Brau et al. (2010), Growitsch and Stronzik (2014), and Copenhagen Economics (2005a, 2005b) explicitly dealt with EU natural gas market regulation and its effect on price development. Therefore, we focus on these contributions in our literature review.
The contributions of Growitsch and Stronzik (2014) and Brau et al. (2010) both addressed the question of how regulatory provisions affected the natural gas price. While Growitsch and Stronzik (2014) were particularly interested in whether ownership separation of gas transmission networks led to lower end-user prices, Brau et al. (2010) asked more generally how the regulatory environment affected these prices. Both studies constructed a panel consisting of 18 EU member states for the period of 1989 to 2007 (Growitsch and Stronzik 2014) and 12 EU member states for the period of 1991 to 2007 (Brau et al. 2010). Although the authors did not differentiate the variables accordingly, the panels consisted of policy output variables (capturing the regulatory provisions), impact variables (capturing the market structure, such as the market share of the incumbents and public ownership), and control variables (for instance, macroeconomic data). The vast majority of policy output and impact variables considered in these studies are provided by the OECD Sector Regulation Database, more precisely the indicators for regulation in energy, transport, and communications (Conway and Nicoletti 2006). The natural gas indicator consists of four sub-indicators, which measure entry regulation, public ownership, vertical integration, and market structure. The variables are coded on a 0 to 6 scale, where 0 indicates full deregulation and 6 the most restrictive conditions for competition. Brau et al. (2010, p. 170) and Growitsch and Stronzik (2014, p. 217) criticized this coding and the weighting of the variables in the (sub-)indicator(s) to be arbitrary, which was why they opted for using at least the sub-indicators and where possible their constituting variables. Applying econometric methods, both analyses found that the price development cannot (or can only partially) be explained by regulatory reforms. More precisely, Brau et al. (2010, p. 180) concluded that “until now European consumers have not yet cashed a dividend from the [natural gas] reforms.” Growitsch and Stronzik (2014, p. 223), who focused particularly on the effect of unbundling provisions, found that ownership unbundling did not influence the natural gas end-user price, while legal unbundling resulted in price reductions. This finding is delicate from the point of view of policy-makers, because they expected ownership unbundling to have the most favorable effect on price development. Furthermore, they found that third-party access and the market structure were statistically significant and influenced the gas price as expected. Although EU provisions did not touch that issue, Growitsch and Stronzik (2014) also tested whether privatization influenced the gas prices and found that privatization led to higher prices. Both studies included independent variables capturing regulatory provisions and the market structure in the same regression equation. From a methodological point of view, this is unproblematic, given that these variables do not correlate with each other very strongly5. However, this does not allow answering the question of how successful the regulatory reforms have been, only which factors actually drive the natural gas price. Both are legitimate questions, but from the point of view of policy-makers, it is more important to know whether the policy instruments they have at their disposal work as expected. Since EU policy-makers did not (and cannot) regulate the natural gas price directly, they aim at increasing competition in the natural gas market, which should lead to lower prices. Thus, to capture these causal mechanisms, the empirical analysis requires a different set-up. In Section 3, we return to this issue.
The pioneer regarding measuring “the impact on overall economic performance due to market opening in network industries” was Copenhagen Economics (2005a, p. 6). It developed the so-called Market Opening Index (MOI) for seven network industries in the EU15 between 1993 and 2003. For each network industry, Copenhagen Economics (2005a, 2005b) constructed a MOI for each year on the member state level. These indices were aggregated indicators, which were composed of five to twelve weighted, sector-specific market opening milestones (MOM). Regarding natural gas regulation, nine MOM were considered in the study6. Unfortunately, the study did not summarize how these MOM were measured and weighted in the MOI. The study mainly dealt with the question of whether there existed a statistical significant link between changes in the MOI, one of its market opening milestones, or latent factors and changes in performance, whereby performance referred to prices and productivity. Regarding the natural gas industry, two market opening milestones were negatively correlated with the natural gas price for industrial users and statistically significant (namely, ownership of the supply companies and tariff structure in transmission pricing), while a third one did not have the expected negative sign (namely, regulation of end-user price) (Copenhagen Economics 2005b, p. 240). This brief summary reveals a weakness of the study: It lacked transparency. In particular, it did not provide information about how the milestones that compose the MOI for the natural gas industry had been measured. Therefore, it seems that this indicator was based at least partially on individual judgments (Growitsch and Stronzik 2014, p. 210). Furthermore, neither the methodology nor the database as such is publicly available (Pelkmans 2010, p. 7). These shortcomings make it impossible to follow and replicate the findings of this study. This is particularly unfortunate because Copenhagen Economics (2005a, pp. 42–43; 2005b, pp. 237–40) also tested how the (not further defined) market structure effected the price development. More precisely, they tested two rival hypotheses. According to hypothesis one, the market structure must change to affect the natural gas price. The rival hypothesis was that it is sufficient if incumbents believe the regulatory environment could encourage potential competitors to enter the market, which they fend off by price reductions and, consequently, the market structure remains stable. They find statistical evidence for the latter hypothesis.
In a nutshell, we adopt from these contributions the following ideas: Inspired by Brau et al. (2010) and Growitsch and Stronzik (2014), we consider component variables and only include aggregated variables if it makes sense from a theoretical point of view. Although it was not at the core of the study, we adopt from Copenhagen Economics (2005a, 2005b) the idea to test whether the market structure affects the price development. The next section specifies our theoretical considerations and the resulting model in more detail.
3. Materials and Methods
We argue that regulatory provisions as such do not have a direct effect on the price. Instead, we argue that successful reforms have an impact on the market structure and that price reductions might result from changes in the same. Differentiating between policy output and impact variables enables us to, first, analyze whether the reforms affected the market structure at all, and, second, whether changes in the market structure affected the price development as expected by the legislators (cf. Knill et al. 2012 regarding the relationship between regulatory output and impacts). Section 3.1 introduces a model which differentiates between policy output, impact, and outcome variables. Section 3.2 summarizes our research design, particularly emphasizing on methodological questions and data availability issues.
3.1. Our Model
To assess how successful the European natural gas market reforms of 1998, 2003, and 2009 have been in terms of price reduction, we conducted a two-stage analysis: First, we analyzed how the member states implemented the gas directives’ provisions and how this affected their respective natural gas market. To capture how the member states transposed the gas directives into national law, we focused on how they implemented the gas directives’ most important provisions regarding the introduction of competition. These provisions stipulated: (1) the degree of market opening; (2) how to introduce third-party-access (TPA) to networks and infrastructure; (3) how to unbundle vertically-integrated companies; and (4) how to grant regulatory oversight (see Table 1 for a summary)7.

Table 1.
Summary of the EU directives introducing common rules for the natural gas sector.
We tested whether these four (policy output) variables had an impact on the market structure (policy impact). Since the directives (inter alia) aimed at reducing the prevailing high market concentration, we measured whether there is a correlation between the way member states implemented the gas directives and the number and market share of gas importing companies and retailers active in the member states’ natural gas markets. If the natural gas market reforms have been successful in terms of introducing competition in this sector, the market structure should have changed accordingly.
Second, we analyzed whether there exists a correlation between the market structure (the policy impact) and the gas price (policy outcome). More precisely, we took the number and market share of gas importing companies and retailers active in the member states’ natural gas markets as independent variables and tested whether they affect the natural gas price. Furthermore, we also analyzed the impact of the oil price, natural gas import dependency, gross domestic product per capita, and inflation. The oil price is important, because it has been an established practice to link the natural gas price to the oil price. By including lagged prices for natural gas, we considered that time series price data tend to be correlated. Regarding the degree of a member state’s natural gas import dependency, we took this as a proxy for measuring security of supply concerns, since they might lead a member state to trade less competition in exchange for a secure gas supply. Finally, the gross domestic product and inflation capture a member state’s economic development: The former is important because energy demand should be positively correlated with the development of the gross domestic product. Provided that energy supply remains stable, this should lead to higher energy prices. Inflation, in turn, captures price increases which do not originate from the scarcity of natural gas but an increased quantity of money in the economic system. Figure 5 summarizes our model.
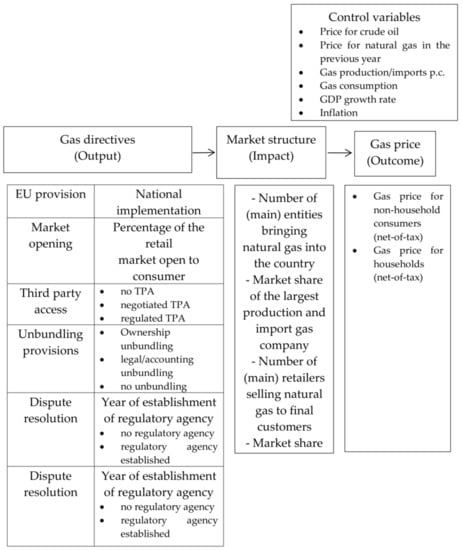
Figure 5.
Assumed relationship between regulation.
3.2. Data and Method
Due to data restrictions, we focused on the EU15. However, since the EU15 consumed 86.5% of the EU28 gross inland consumption of natural gas in 2013, our findings are relevant for the entire EU. Figure 5 provides an overview of the central concepts underlying our analysis of the relationship between regulatory provisions, gas market structure, and gas prices for industrial and private consumers. As indicated in the literature review, the OECD Sector Regulation Database offers one (of very few) openly accessible databases that quantifies the restrictiveness of product market regulation, covering a long time series and a multitude of countries. To measure how the EU15 member states implemented the given regulatory provisions, we took the variables market opening, third party access (TPA), and unbundling from this database. Market opening is defined as the percentage of the retail market open to consumers. To avoid missing values, we supplemented this indicator with figures from various reports of the European Commission (cf. Appendix A for details). The variable third party access (TPA) captures the terms and conditions of TPA to the gas transmission system and differentiates between regulated, negotiated, and no TPA, whereby higher values represent a lower level of regulation. Our measure of unbundling provisions for vertically-integrated companies is an aggregated index measuring the degree of vertical separation between gas production/import and gas supply, and other segments of the industry as well as between gas distribution and gas supply. Higher values indicate a lower level of separation. The regulation of dispute resolution is operationalized by a dummy variable taken from Jordana et al. (2011) with 1 indicating the year when the regulatory agency was established. The structure of the natural gas market is operationalized by three different indicators, all of which differentiate between the import and/or production level on the one hand and the retail level on the other hand. To improve the reading flow, we summarized this distinction in the labels “upstream sector” and “downstream sector”. The former consists of companies that either produce natural gas by indigenous production or bring natural gas into the country, and the latter consists of companies that sell natural gas to final customers. The number of (main) companies and the market share of the largest company are taken from Eurostat, whereas “main companies” are entities dealing with or selling at least 5% of the natural gas production and imports, and at least 5% of total gas consumption. In more liberalized and regulated markets, the number of (main) companies should be larger and the market share of the major company should be lower than in less regulated markets. We used gas price data excluding taxes, taken from Eurostat. Finally, our analysis included the following control variables (see Figure 5): First, we controlled for the effects of overall economic performance by considering economic growth rate and inflation. Furthermore, peculiarities of the national gas market were taken into account by using total gas imports and gas production (per capita) as well as a country’s gas import dependency rate. As mentioned above, we also controlled for the oil price and the natural gas price of the previous year.
Our main argument is that regulatory provisions as such do not have a direct effect on gas prices but on certain characteristics of the national natural gas markets. Therefore, the first step of our analysis consisted of figuring out whether the implemented regulatory reforms changed the structure of the gas markets. Since data regarding market structure characteristics are only available for 2003, 2008, and 2013, our analysis is constrained to cross-section regression analyses for these years. We considered three different gas market characteristics as dependent variables—the number of companies, the number of main companies and the market share of the largest company—each of them for the upstream and the downstream sector. As independent variables, we used the above reported measures capturing the nationally implemented regulation (cf. Figure 5 and Appendix A for further details): market opening in percent, an index of third party access (TPA), an index of unbundling provisions for vertically-integrated companies, and finally a dummy variable for the establishment of a regulatory agency. Due to the limited number of observations in our research design comprising EU15 countries, only bivariate correlation coefficients are shown. Since data restrictions forced us to limit our analysis to bivariate cross-section regression analyses, our results should not be interpreted as strong evidence for a general causal relationship. However, they allow revealing a certain pattern of the relationship between regulatory provisions and market structure characteristics in the EU15.
In the second step of our analysis, we tried to figure out whether changes in the market structure affected the gas price development. To address this question, we conducted two separated pooled regression analysis using annual data between 2003 and 2013: one with gas prices for industrial consumers and the other one with prices for households as dependent variables. To capture potential short- and long-term price dynamics initiated by changing regulatory provisions, we used error-correction models as applied, for example, by Iversen and Cusack (2000) with changes of the dependent variables on the left-hand side of the regression equation and the lag of levels and changes of each independent variable on the right-hand side. To control for unobserved (and time-invariant) unit heterogeneity, our models were estimated using country fixed-effects and year dummies. By focusing on the over-time variation within countries, this estimation procedure allowed us to test the assumption that changes in the market structure can induce lower gas prices. Furthermore, since models with time series price data are often characterized by serial autocorrelation, we included a lagged dependent variable on the right side of the regression equation (Beck and Katz 1995). Finally, robust standard errors were used to control for heteroscedasticity.
4. Results
Mirroring the two stages of our model, Section 4.2 summarizes how the regulatory provisions impacted the market structure and Section 4.3 how the market structure affected the natural gas price. To get a first impression of how successful the natural gas market reforms have been, we briefly summarize whether the natural gas price converged in the EU15 (Section 4.1)8.
4.1. Natural Gas Price Convergence between 1998 and 2013
Since one rational behind energy liberalization has been to allow the free play of market forces, which was expected to result in lower prices, the price development in the EU15 between 1998 and 2013 (see Figure 3 and Figure 4) could be interpreted as an indication that this rational has not worked out. This would not be surprising, since the “vast majority of international gas trade outside North America is still conducted on the basis of 10–30 year contracts with complex price clauses” (Stern 2014, p. 43), most importantly with a linkage to (mainly) oil prices in the preceding six to nine months. Given the rise of the oil price during the period of investigation, much of the natural gas price development can be explained by this oil-gas price linkage.
Similarly, the increased standard deviation suggests that the IEM is far from being completed. More precisely, there is no sign of sigma-convergence in terms of equalizing gas prices within the EU15. In contrast, we can even observe a slightly higher level of variance since the mid-2000s. Although his study was limited to six EU member states, this finding corroborates Robinson’s (Robinson 2007) study, who found that gas prices diverged after 1999 (for a critique on Robinson 2007 see Haase and Bressers 2010). Thus, the development of the gas price suggests that the natural gas market reforms have not been successful9. The next two sections validate this finding quantitatively.
4.2. Effects of Natural Gas Regulation on the Market Structure
In the first step of our empirical analysis, we concentrate on the relationship between different instruments of natural gas regulation (market opening, TPA, vertical integration, and dispute regulation) and their impact on certain market structure characteristics (namely, the number of (main) companies and the market share of the largest company). We conducted this analysis separately for the upstream sector (Table 2) and the downstream sector (Table 3). The results of bivariate correlation analysis show that, regardless of the market sector, there tend to be more companies in member states with a higher degree of effective market opening than in member states where only smaller parts of the respective market sector are liberalized. Similarly, the number of main companies in the upstream sector is positively correlated with the degree of market opening, while in the downstream sector this only holds true for 2008. Furthermore, the market share of the largest company decreases with increasing market opening.
Table 2.
The Effect of Regulation on Market Structure—bivariate correlation analysis.
Table 3.
The Effect of Regulation on Market Structure—bivariate correlation analysis.
The regulation of third party access does not seem to have an effect on market structure characteristics regarding the upstream sector, as we can see in Table 2. Nevertheless, a more market-friendly regulation of TPA is associated with a higher number of gas retailers, a more decentralized market structure, and a smaller market share of the largest gas retailer (see Table 3).
The data provide also some evidence for a pro-competitive effect of strict unbundling provisions regarding vertically integrated companies. The number of main companies seems to increase if unbundling requirements come into place, which applies in particular to the downstream sector. Surprisingly, regarding the total number of companies, the relationship differs in the upstream and downstream sector: While strict unbundling provisions tend to increase the amount of companies active in the upstream sector, they reduce the number of companies in the downstream sector. Finally, the existence of public regulatory agencies correlates with a higher number of companies in both sectors and with a more decentralized market structure regarding natural gas retail.
However, the results of bivariate correlation analysis must be interpreted with caution, especially because not all indicators of market structure characteristics could be analyzed for the whole period of investigation. This is not only due to data constraints but also to insufficient variance: Regarding dispute settlement, for example, all EU countries were obliged to designate a competent authority responsible for this task by August 2000 (98/30/EC, art. 21). Since this provision became more detailed from directive to directive (cf. European Parliament and Council of Ministers 2003, art. 25; European Parliament and Council of Ministers 2009, art. 39–41), there were only two member states in our sample without a regulatory agency between 2002 and 2004 (namely Germany and Greece), and by 2005 all member states had established one (Jordana et al. 2011). Nevertheless, the results of our analysis indicate that an (over-)implementation of the European gas market directives seems to be (at least partially) associated with more suppliers in the gas market and increased competition in the retail market.
4.3. Effects of the Market Structure on the Natural Gas Price
In a second step, we concentrate on the linkage between market structure and natural gas prices. We do not find a linkage between market structure characteristics and gas prices for industrial consumers (Table 4) or for households (Table 5). Our Basic Model (both Table 4 and Table 5) only considers the following variables to explain the development of natural gas prices (Table 4 for industrial consumers, Table 5 for households): crude oil prices (also ∆), (per capita) gas imports (also ∆) (only for Table 4), and the gas price in the previous year. Models I to IV consist of the Basic Model and one characteristic of the market structure. In Model I, we include the total number of gas companies (import/production) in the previous year (also ∆) and in, Model II, we include the number of main gas companies related to import/production (also ∆). In Model III, we do the same regarding the total number of retail companies (also ∆), and, finally, in Model IV, we include the main retail companies (also ∆) all with a time lack of one year. However, Model III in Table 4 shows a significant, albeit small, long-term negative effect of the number of gas companies (regarding retail) on gas prices for industrial consumers. The same holds true for households, as we can see in Model III in Table 5. Additionally, the number of companies is positively correlated with gas prices for households in the short term. Apart from this, the development of gas prices (unsurprisingly) can best be explained by crude oil prices, (per capita) gas imports, and the gas price in the previous year10. Regarding crude oil prices, an increase is associated with higher gas prices in the short term. However, in the long run, the prices for oil and gas seem to be unrelated (Table 4 and Table 5). The effect of per capita gas imports on gas prices for industrial consumers is reversed: According to our models in Table 4, higher gas imports lead to lower gas prices only in the long run. For households, gas imports do not play a significant role in explaining gas prices, we therefore do not report them in Table 5. Finally, the effect of higher gas prices in the previous year is negative for industrial consumers and households.
Table 4.
The Effect of Market Structure on gas prices for industrial consumers, 2003–2013.
Table 5.
The Effect of Market Structure on gas prices for households, 2003–2013.
Summing up, gas prices for industrial and private consumers tend to be essentially unaffected by the analyzed market structure characteristics. Thus, there does not seem to be evidence that the implementation of the European gas directives has led to lower gas prices so far. However, this finding is to be taken with a grain of salt, because: (1) there does not exist one natural gas price, but numerous ones, which are generated on different markets and market levels (Wright 2006); and (2) EU natural gas markets are yet to be interconnected fully.
5. Conclusions
Summarizing the main findings of this study, we can initially state a “successful failure” of the European natural gas market reforms. Contrary to their objective, the regulatory measures (designed to open and liberalize markets) hardly have had a positive effect in terms of reducing gas prices for industry and households. Although they have increased the number of suppliers active in the market, this barely affected the gas prices.
The missing link between liberalized markets and decreasing natural gas prices calls on questioning whether the one-size-fits-all approach of EU’s liberalization policy is appropriate for this policy sector. One might ask, for instance, whether it is attributable to the specific characteristics of the natural gas sector that liberalization does not result in lower gas prices. Banks (2015) argued along these lines and highlighted that regulatory restructuring of the natural gas sector creates a climate of uncertainty, which leads to a reduction of (necessary) investments in the physical infrastructure. According to him, this even leads to higher gas prices instead of lower ones in the long run.
An issue not covered by our analysis due to its focus on the EU15 is that, with eastern enlargement in 2004, the EU’s space in general (Zielonka 2007) and its energy landscape in particular has become even more diversified than it has been before. This diversity makes it difficult for the EU to find policies that fits all its by now 28 member states. This holds particularly true for its central and eastern European member states (for a similar assessment with regards to the Common Agricultural Policy, see Gorton et al. 2009) given their dependence on Russian natural gas. In 2015, for instance, central and eastern European member states had pushed for including the idea of EU joint gas purchasing in the Commission’s communication “Energy Union Package” (European Commission 2015; cf. Crisp 2015). Basically, they argued that joint gas purchases are a means to protect Europe from any “threats of diktat” (Donald Tusk, Polish Prime Minister, quoted in European Parliament 2014) from Russia. The rationale behind bundling EU member states’ natural gas demand is to recover bargaining power vis-à-vis energy suppliers in international trade negotiations, which energy companies had lost due to unbundling their different activities. Thus far, the majority of EU policy makers do not support this argument and therefore do not consider joint purchases as a viable option (Buchan and Keay 2016).
Since the liberalization of the European natural gas market is still an ongoing project, we suggest not taking for granted that liberalization measures which are successful in other product markets can be transferred one to one to the natural gas market. Instead, we see a need for further research regarding effective natural gas regulation given the specific features of this sector and the diversity of member states’ energy landscape.
Regarding the appropriate research design to empirically test whether a regulatory policy output leads to the desired policy outcomes, our analysis documents that it is recommendable to conduct a two-stage analysis—regardless of the policy sector analyzed. Per definition, regulatory policies provide legal norms for behavior or interaction (Lowi 1972; Heinelt 2007). Therefore, the first stage must assess whether legal norms (policy output) have affected the behavior of the subject of regulation (for instance, producers, consumers or citizens), which in turn has led to changes on the macro level (policy impact, for instance, regarding the market structure, switching rate of gas users, or adherence of smoking bans). Only if empirical analysis reveals that a relationship between these variables exists, policy-makers might be able to observe the desired policy outcome (for instance, lower natural gas prices or reduce deaths resulting from exposure to tobacco smoke). If empirical analysis does not reveal such a relationship, policy makers get the opportunity to ask whether they have chosen the right instruments to realize the respective regulatory goals and whether they have been implemented correctly.
Acknowledgments
No specific funding sources were used for the article.
Author Contributions
N.H. and S.W. designed the research; N.H. and K.D. collected the data; K.D. and S.W. analyzed the data; and all authors wrote the paper.
Conflicts of Interest
The authors declare no conflict of interest.
Appendix A
Table A1.
Operationalization and data sources.
Table A1.
Operationalization and data sources.
| Variable | Operationalization | Source |
|---|---|---|
| Regulation—The Implementation of the Gas Directives: | ||
| market opening | Percentage of the retail market open to consumers | OECD Sector Regulation Database NMR; Conway and Nicoletti 2006; SEC(2003) 448, SEC(2004)1720, SEC(2009)287, CEER (2008) |
| third party access | 0: regulated TPA, 3: negotiated TPA, 6: no TPA | OECD Sector Regulation Database NMR; Conway and Nicoletti 2006 |
| unbundling provisions | 0: ownership unbundling, 3: legal unbundling, 4.5: accounting unbundling, 6: no separation; unweighted mean of five sectors (production, import, transmission, distribution, supply of natural gas) | OECD Sector Regulation Database NMR; Conway and Nicoletti 2006 |
| dispute settlement | Year of establishment of a regulatory agency; 0: no regulatory agency, 1: regulatory agency exists | Jordana et al. 2011 |
| Market Structure Characteristics | ||
| import and production: number of (main) entities bringing natural gas into the country | Entities are considered as “main” if they deal with at least 5% of the natural gas indigenous production or imports. | Eurostat 2015: Natural gas market indicators. |
| import and production: market share of the largest entity | Market share of the largest entity bringing natural gas into the country, in % | Eurostat 2015: Natural gas market indicators. |
| retail: number of (main) natural gas retailers. | Retailers are considered as “main” if they sell at least 5% of the total natural gas consumed by final customers. | Eurostat 2015: Natural gas market indicators. |
| retail: market share of the largest natural gas retailer. | Market share of the largest natural gas retailer, in % | Eurostat 2015: Natural gas market indicators. |
| Price Data | ||
| gas price for industrial consumers | Gas prices for industrial consumers excluding taxes, in Euro | Eurostat Database |
| gas price for households | Gas prices for households excluding taxes, in Euro | Eurostat Database |
| Control Variables | ||
| economic growth | Change of real GDP, in % | OECD Economic Outlook |
| crude oil price | Crude oil price in US-Dollars per barrel | BP 2014: Statistical Review of World Energy |
| gas imports p.c. | Gas imports per capita, in Gross calorific value(GCV) | Eurostat Database |
| gas production p.c. | Gas production per capita, in Gross calorific value(GCV) | Eurostat Database |
| import dependency | Share of total gas imports on total gas consumption | Eurostat Database |
| inflation | Change of consumer price index, in % | Eurostat Database |
| gas consumption | Gas consumption in % of total energy consumption | Eurostat Database |
References
- Banks, Ferdinand E. 2015. Energy and Economic Theory. Hackensack: World Scientific Publishing Company. ISBN 978-981-4366-10-6. [Google Scholar]
- Baumgartner, Frank R. 2001. Agendas: Political. In International Encyclopedia of the Social & Behavioral Sciences. Edited by Neil J. Smelser and Paul B. Baltes. Amsterdam: Elsevier, pp. 288–90. ISBN 978-0-08-043076-8. [Google Scholar]
- Beck, Nathaniel, and Jonathan N. Katz. 1995. What To Do (and Not to Do) with Time-Series Cross-Section Data. American Political Science Review 89: 634–47. [Google Scholar] [CrossRef]
- Brau, Rinaldo, Raffaele Doronzo, Carlo V. Fiorio, and Massimo Florio. 2010. EU Gas Industry Reforms and Consumers’ Prices. The Energy Journal 31: 167–82. [Google Scholar] [CrossRef]
- British Petroleum. 2014. Statistical Review of World Energy. Available online: https://www.bp.com/content/dam/bp-country/de_de/PDFs/brochures/BP-statistical-review-of-world-energy-2014-full-report.pdf (accessed on 6 March 2017).
- Buchan, David, and Malcolm Keay. 2016. Europe’s Long Energy Journey: Towards an Energy Union? Oxford: Oxford University Press. ISBN 978-0-19-875330-8. [Google Scholar]
- Cameron, Peter D. 2005. Legal Aspects of EU Energy Regulation: Implementing the New Directives on Electricity and Gas across Europe. Oxford: Oxford University Press, ISBN-13: 978-019927963. [Google Scholar]
- Cameron, Peter D. 2007. Competition in Energy Markets: Law and Regulation in the European Union. Oxford: Oxford University Press, ISBN-13: 978-019928297. [Google Scholar]
- Conway, Paul, and Giuseppe Nicoletti. 2006. Product Market Regulation in the Non-Manufacturing Sectors of OECD Countries: Measurements and Highlights; OECD Economics Department Working Paper no. 530. Paris: OECD. Available online: http://www.oecd.org/officialdocuments/publicdisplaydocumentpdf/?doclanguage=en&cote=eco/wkp(2006)58 (accessed on 6 March 2017).
- Copenhagen Economics. 2005a. Market Opening in Network Industries. Part I: Final Report. Report for European Commission DG Internal Market. Luxembourg: European Commission, September. [Google Scholar]
- Copenhagen Economics. 2005b. Market Opening in Network Industries. Part II: Sectoral Analyses. Report for European Commission DG Internal Market. Luxembourg: European Commission, September. [Google Scholar]
- Crisp, James. 2015. Joint Gas Buying on EU leaders’ Summit Agenda. EURACTIV. March 4. Available online: http://www.euractiv.com/section/europe-s-east/news/joint-gas-buying-on-eu-leaders-summit-agenda/ (accessed on 6 March 2017).
- Eberlein, Burkard. 2012. Inching Towards a Common Energy Policy: Entrepreneurship, Incrementalism, and Windows of Opportunity. In Constructing a Policy-Making State? Policy Dynamics in the EU. Edited by Jeremy Richardson. Oxford: Oxford University Press, pp. 147–69, ISBN-13: 978-0199604104. [Google Scholar]
- European Commission. 1968. First Guidelines for a Community Energy Policy. Memorandum Presented by the Commission to the Council on 18 December 1968. COM(68)1040. Available online: http://aei.pitt.edu/5134/1/5134.pdf (accessed on 28 February 2018).
- European Commission. 1988a. Europe 1992. The Overall Challenge. SEC(88)524 final. Available online: http://aei.pitt.edu/3813/1/3813.pdf (accessed on 28 February 2018).
- European Commission. 1988b. The Internal Energy Market. Commission Working Document. COM(88)238 final. Available online: http://aei.pitt.edu/4037/1/4037.pdf (accessed on 28 February 2018).
- European Commission. 2007. An Energy Policy for Europe. Communication from the Commission to the European Council and the European Parliament. COM(2007)1 final. Available online: http://eur-lex.europa.eu/legal-content/EN/TXT/?uri=CELEX%3A52007DC0001 (accessed on 28 February 2018).
- European Commission. 2015. A Framework Strategy for a Resilient Energy Union with a Forward-Looking Climate Change Policy. Communication from the Commission to the European Parliament, the Council, the Economic and Social Committee, The Committee of the Regions and the European Investment Bank. COM(2015)80 final. Available online: http://eur-lex.europa.eu/legal-content/en/TXT/?uri=COM%3A2015%3A80%3AFIN (accessed on 28 February 2018).
- European Council. 2000. Lisbon European Council 23 and 24 March 2000. Presidency Conclusions. Available online: http://www.europarl.europa.eu/summits/lis1_en.htm (accessed on 28 February 2018).
- European Parliament. 2014. Written Questions by Members of the European Parliament and their Answers Given by a European Union Institution, E-003796/14 by Gaston Franco to the Commission, Official Journal 57, 2 October 2014. Available online: http://eur-lex.europa.eu/legal-content/EN/TXT/?uri=OJ%3AJOC_2014_346_R_0001 (accessed on 28 February 2018).
- European Parliament and Council of Ministers. 1998. Directive 98/30/EC of the European Parliament and of the Council of 22 June 1998 concerning common rules for the internal market in natural gas. Official Journal L 204, 21/07/1998. 1–12. [Google Scholar]
- European Parliament and Council of Ministers. 2003. Directive 2003/55/EC of the European Parliament and of the Council of 26 June 2003 concerning common Rules for the Internal Market in Natural Gas and Repealing Directive 98/30/EC. Official Journal L 176, 15/07/2003. 57–78. [Google Scholar]
- European Parliament and Council of Ministers. 2009. Directive 2009/73/EC of the European Parliament and of the Council of 13 July 2009 Concerning Common Rules for the Internal Market in Natural Gas and Repealing Directive 2003/55/EC. Official Journal L 211, 14/08/2009. 94–136. [Google Scholar]
- Eurostat. 2014. European Energy Statistics: Quantities. Available online: http://ec.europa.eu/eurostat/web/energy/data/main-tables (accessed on 12 February 2014).
- Eurostat. 2015. EuropeanEnergy Statistics: Quantities. Available online: http://ec.europa.eu/eurostat/web/%20energy/data/main-tables (accessed on 10 June 2015).
- Gorton, Matthew, Carmen Hubbard, and Lionel Hubbard. 2009. The folly of European Union policy transfer: why the Common Agricultural Policy (CAP) does not fit Central and Eastern Europe. Regional Studies 43: 1305–17. [Google Scholar] [CrossRef]
- Growitsch, Christian, and Marcus Stronzik. 2014. Ownership Unbundling of Natural Gas Transmission Networks: Empirical Evidence. Journal of Regulatory Economics 46: 207–25. [Google Scholar] [CrossRef]
- Grunwald, Jürgen. 2003. Das Energierecht der Europäischen Gemeinschaften: EGKS-EURATOM-EG. Grundlagen-Geschichte-Geltende Regelungen. Berlin: Walter de Gruyter, ISBN-13: 978-3899490787. [Google Scholar]
- Haase, Nadine, and Hans Bressers. 2010. New Market Designs and their Effect on Economic Performance in European Union’s Natural Gas Markets. Competition and Regulation in Network Industries 11: 176–206. [Google Scholar] [CrossRef]
- Heinelt, Hubert. 2007. Do Policies Determine Politics? In Handbook of Public Policy Analysis: Theory, Politics, and Methods. Edited by Frank Fischer, Gerald J. Miller and Mara S. Sidney. Boca Raton: CRC Press, pp. 109–19, ISBN-13: 978-1574445619. [Google Scholar]
- Herweg, Nicole. 2015. Against All Odds: The Liberalisation of the European Natural Gas Market. A Multiple Streams Perspective. In Energy Policy Making in the EU. Edited by Tosun Jale, Sophie Biesenbender and Kai Schulze. London: Springer, pp. 87–105. ISBN 9781447166443. [Google Scholar]
- Iversen, Torben, and Thomas R. Cusack. 2000. The Causes of Welfare State Expansion: Deindustrialization or Globalization? World Politics 52: 313–49. [Google Scholar] [CrossRef]
- Jamasb, Tooraj, and Michael Pollitt. 2005. Electricity Market Reform in the European Union: Review of Progress toward Liberalization & Integration. The Energy Journal 26: 11–41. [Google Scholar]
- Johnston, Angus, and Guy Block. 2012. EU Energy Law. Oxford: Oxford University Press. ISBN 9780199665242. [Google Scholar]
- Jordana, Jacint, David Levi-Faur, and Xavier Fernández i Marín. 2011. The Global Diffusion of Regulatory Agencies: Channels of Transfer and Stages of Diffusion. Comparative Political Studies 44: 1343–69. [Google Scholar] [CrossRef]
- Knill, Christoph, Kai Schulze, and Jale Tosun. 2012. Regulatory Policy Outputs and Impacts: Exploring a Complex Relationship. Regulation & Governance 6: 427–44. [Google Scholar] [CrossRef]
- Lowi, Theodore J. 1972. Four Systems of Policy, Politics, and Choice. Public Administration Review 32: 298–310. [Google Scholar] [CrossRef]
- Neumann, Anne, Boriss Siliverstovs, and Christian von Hirschhausen. 2006. Convergence of European Spot Market Prices for Natural Gas? A Real-Time Analysis of Market Integration using the Kalman Filter. Applied Economics Letters 13: 727–32. [Google Scholar] [CrossRef]
- Nylander, Johan. 2001. The Construction of a Market. A Frame Analysis of the Liberalization of the Electricity Market in the European Union. European Societies 3: 289–314. [Google Scholar] [CrossRef]
- Padgett, Stephen. 1992. The Single European Energy Market: The Politics of Realization. Journal of Common Market Studies 30: 53–76. [Google Scholar] [CrossRef]
- Pelkmans, Jacques. 2010. Product Market Reforms in EU Countries: Are the Methodology and Evidence Sufficiently Robust? Brussels: CEPS Working Document. ISBN 978-94-6138-040-1. [Google Scholar]
- Prontera, Andrea. 2009. Energy Policy: Concepts, Actors, Instruments and Recent Developments. World Political Science Review 5: 1–30. [Google Scholar] [CrossRef][Green Version]
- Robinson, Terry. 2007. Have European Gas Prices Converged? Energy Policy 35: 2347–51. [Google Scholar] [CrossRef]
- Sandoval, Israel S., and Francesc Morata. 2012. Introduction: The Re-Evolution of Energy Policy in Europe. In European Energy Policy: An Environmental Approach. Edited by Sandoval I.S. and Francesc Morata. Cheltenham and Northampton: Edward Elgar, pp. 1–22. [Google Scholar] [CrossRef]
- Sovacool, Benjamin K. 2014. What Are We Doing Here? Analyzing Fifteen Years of Energy Scholarship and Proposing a Social Science Research Agenda. Energy Research & Social Science 1: 1–29. [Google Scholar] [CrossRef]
- Stern, Jonathan. 2014. International Gas Pricing in Europe and Asia: A Crisis of Fundamentals. Energy Policy 64: 43–48. [Google Scholar] [CrossRef]
- Tosun, Jale, Sophie Biesenbender, and Kai Schulze. 2015. Building the EU’s Energy Policy Agenda: An Introduction. In Energy Policy Making in the EU. Edited by Tosun Jale, Sophie Biesenbender and Kai Schulze. London: Springer, pp. 1–17. ISBN 9781447166443. [Google Scholar]
- Wright, Philip. 2006. Gas Prices in the UK: Markets and Insecurity of Supply. Oxford: Oxford University Press. ISBN 0-19-929965-X. [Google Scholar]
- Zielonka, Jan. 2007. Plurilateral Governance in the Enlarged European Union. Journal of Common Market Studies 45: 187–209. [Google Scholar] [CrossRef]
| 1 | The political agenda is defined as “the set of issues that are the subject of decision making and debate within a given political system at any one time” (Baumgartner 2001, p. 288). |
| 2 | Figure 1 shows the share of natural gas consumption at the gross inland energy consumption in percent. Note that there are missing data for EU15 (regarding Luxembourg) and for EU28 (regarding Estonia, Croatia, Cyprus, Latvia, Luxembourg, Slovenia, and Malta). However, since these member states’ share of natural gas consumption on the EU15’s and EU28’s natural gas consumption can be neglected with on average 0.3% (EU15) and 1.6% (EU28), respectively, for the time span between 1990 to 2012, this has no impact on the reported consumption trend (percentage calculated Eurostat 2014). Source: Own calculation based on British Petroleum (2014). |
| 3 | Overall, 18.6% of the electricity was produced by gas (including natural gas and derived gases) in 2012 (see Eurostat 2015). |
| 4 | Figure 2 shows the natural gas import dependency in percent. It is calculated as the ratio of net natural gas imports to gross inland consumption of natural gas, whereby the net natural gas imports are the difference of natural gas imports minus exports minus stock changes. Due to data restrictions, the numbers reported cover only the time frame from 1990 to 2012. However, since the natural gas era started in the 1960s, the reported shares must have a positive slope for the time before the 1990s. Source: Own calculation based on Eurostat (2014). |
| 5 | Regarding our research design, Pearson correlation coefficients between the regulation and market structure variables do not exceed 0.6. |
| 6 | The analysis included as MOM: (1) unbundling of transmission system operators; (2) unbundling of distribution system operators; (3) ownership of supply companies; (4) third party access to transmission networks; (5) third party access to distribution networks; (6) third party access to gas storage capacity; (7) tariff structure in transmission pricing; (8) regulation of end-user price; and (9) degree of free choice of supplier in the retail market (Copenhagen Economics 2005b, pp. 245–46). |
| 7 | The gas directives cover more aspects than these (for instance, regarding public service obligation). However, a detailed analysis of their contents goes beyond the scope of this article. |
| 8 | Descriptive statistics of the regulation and market structure variables are available on demand. |
| 9 | Note that, apart from a pro-competitive regulation, converged natural gas prices also require that sufficient transport capacity between all regional markets is available. However, natural gas markets in the EU are still not fully interconnected (COM(2015)89 final). Thus, the high and increasing standard deviation can only partially be explained by the uncompetitive state of these markets. Put differently, for natural gas prices to fully converge, interconnectedness, transport capacity, and a pro-competitive regulation must be given (Neumann et al. 2006, who showed that the spot market prices for natural gas at the United Kingdom’s Natural Balance Point converged with those at Belgium’s spot market in Zeebrugge due to the Interconnector). |
| 10 | We also tested for the impact of economic growth, inflation, domestic per capita gas production, and natural gas consumption compared to other energy sources, but these control variables were insignificant in all models. Furthermore, the models shown in this article only use the number of (main) companies as independent variables because the third indicator of market structure characteristics—the market share of the largest company—would halve the number of observation. However, models using market share data do not yield significantly differing results. |
© 2018 by the authors. Licensee MDPI, Basel, Switzerland. This article is an open access article distributed under the terms and conditions of the Creative Commons Attribution (CC BY) license (http://creativecommons.org/licenses/by/4.0/).