1. Introduction
Neuroticism (N) refers to emotional instability which is characterized by high levels of negative affect such as depression, anxiety, worry and tenseness (
Eysenck and Eysenck 1975). People scoring high in neuroticism exhibit overly strong emotional reactions and do not simmer down quickly. Although the international studies of the EPQ factor structure have generally supported the homogeneity of the scales (
Barrett and Eysenck 1984;
Eysenck 1983;
Goh et al. 1982), some studies have suggested that the N scale could actually measure two identifiable components of neuroticism. One of the first studies proposing that the EPQ N scale is bi-dimensional, was carried out by
Loo (
1979). According to
Loo (
1979), the N scale has two components which refer to anxiety and emotionality. In their study of the internal structure of the EPQ,
Roger and Morris (
1991) extracted two independent N factors in a sample of British adults. They interpreted the first factor as reflecting “social sensitivity” while the second factor referred to “moodiness.” This distinction into two separate components was later supported by
Loo (
Loo 1995) in his cross-cultural examination of the EPQ. In
Loo’s (
1995) study, a factor analysis of the EPQ responses of 246 Japanese students identified two factors which he interpreted as “social sensitivity” and “moodiness” components supporting the study by
Roger and Morris (
1991).
According to the EPQ literature, women tend to score higher on N than men. This sex difference has been reported in large number of studies conducted in different countries among both adults and children (
Costa et al. 2001;
Francis 1993;
Jorm 1987;
Lynn and Martin 1997;
Munafò et al. 2004;
Ormel et al. 2013;
Schmitt et al. 2008). As noted by
Francis (
1993), these findings might be accounted for by three different explanations. First, sex difference on the N scores may represent a real phenomenon that neurotic tendencies are more common among women than men. Women might score higher on neuroticism than men because of hormonal differences, especially related to cortisol (
Costa et al. 2001;
DeSoto and Salinas 2015;
Ormel et al. 2013), or because of different gender roles in the society for men and women (
Eagly 1987). As early as in 1970, Broverman and colleagues showed that clinical judgments about the characteristics of healthy individuals differed as a function of the sex of the person judged and that these differences paralleled stereotypic sex-role differences (
Broverman et al. 1970). Second, it has been suggested that the observed sex difference simply reflects the fact that women are readier to recognize and/or express neurotic tendencies than men (
Feingold 1994). In this case, the general finding of differences between sexes on N scores would be more likely to be a socio-cultural artefact than a genuine phenomenon. Third, neuroticism might manifest itself somewhat differently among males and females (
Jorm 1987). If the neuroticism scales contain more items appropriate for females than for males, the sex difference on scale scores could be caused by the selection of items (
Jorm 1987) and not by a true difference in neuroticism.
Francis (
1993) addressed this possible in-built sex bias in neuroticism scales in a study among Canadian, US and UK samples. According to this study, the Eysenckian neuroticism scales contain both a sex-related (N-S) and a sex-free (N-A) component. The general finding of women scoring high on the N scores was reported to apply to the N-S but not to the N-A scale (
Francis 1993). This result did not get strong support from
Loo (
1995) in his study among Japanese students. The aim of the present study was to test the suggested sex dependent bi-factorial model (
Francis 1993) of the EPQ N scale in a sample of Finnish and Turkish university students.
The original aim of the cross-cultural project on the EPQ by
Eysenck and Eysenck (
1982) was to study the appropriateness of the four-factor structure of the EPQ and to construct valid scoring keys for cultures other than British (
Eysenck and Eysenck 1982;
Eysenck 1983). Hence, the main objective of Eysenckian cross-cultural studies on personality was to investigate the cross-cultural validity of the EPQ factor structure, not to compare different countries on P, E, N and L scales. Despite this theoretical starting point, the comparisons between national scores on the EPQ scales have proved fruitful (see
Barrett and Eysenck 1984) and provide information not only about the culture involved but also about neuroticism itself as a personality construct. For example, Lynn and Martin reported a positive correlation between national neuroticism scores, alcoholism and suicide (
Lynn and Martin 1995).
The final aim of the present study was to compare the EPQ N, N-A and N-S scores of Finnish and Turkish university students. The comparison of these two countries on neuroticism is of particular interest for several reasons. First, Turkey is undergoing a rapid social change that has repercussions on almost every aspect of life. Finland underwent such an extensive social change (urbanization and emigration) in the 1960s and early 1970s. These differences in social realities may be reflected in the level of neuroticism (
Lynn and Hampson 1977). Second, it can be said that Turkish culture exhibits a high proportion of the collectivist pattern (
Göregenli 1997), whereas Finnish culture can largely be defined as individualistic (about collectivism, see
Triandis et al. 1990). According to Hofstede’s cultural dimension measures, Finland scores much higher in individualism than Turkey (score 63 for Finland vs. 37 for Turkey) while Turkey scores higher in masculinity than Finland (score 45 for Turkey vs. 26 for Finland) (
Hofstede 2010). The more collectivist nature of the Turkish culture may be reflected in sex differences on the different types of neuroticism. Differences between men and women on neuroticism—particularly on different types of neuroticism—should mirror differences in sex roles in Turkey and Finland.
3. Results and Discussions
3.1. The bi-Dimensional Model of Neuroticism: Sex-Related and Sex-Free Components
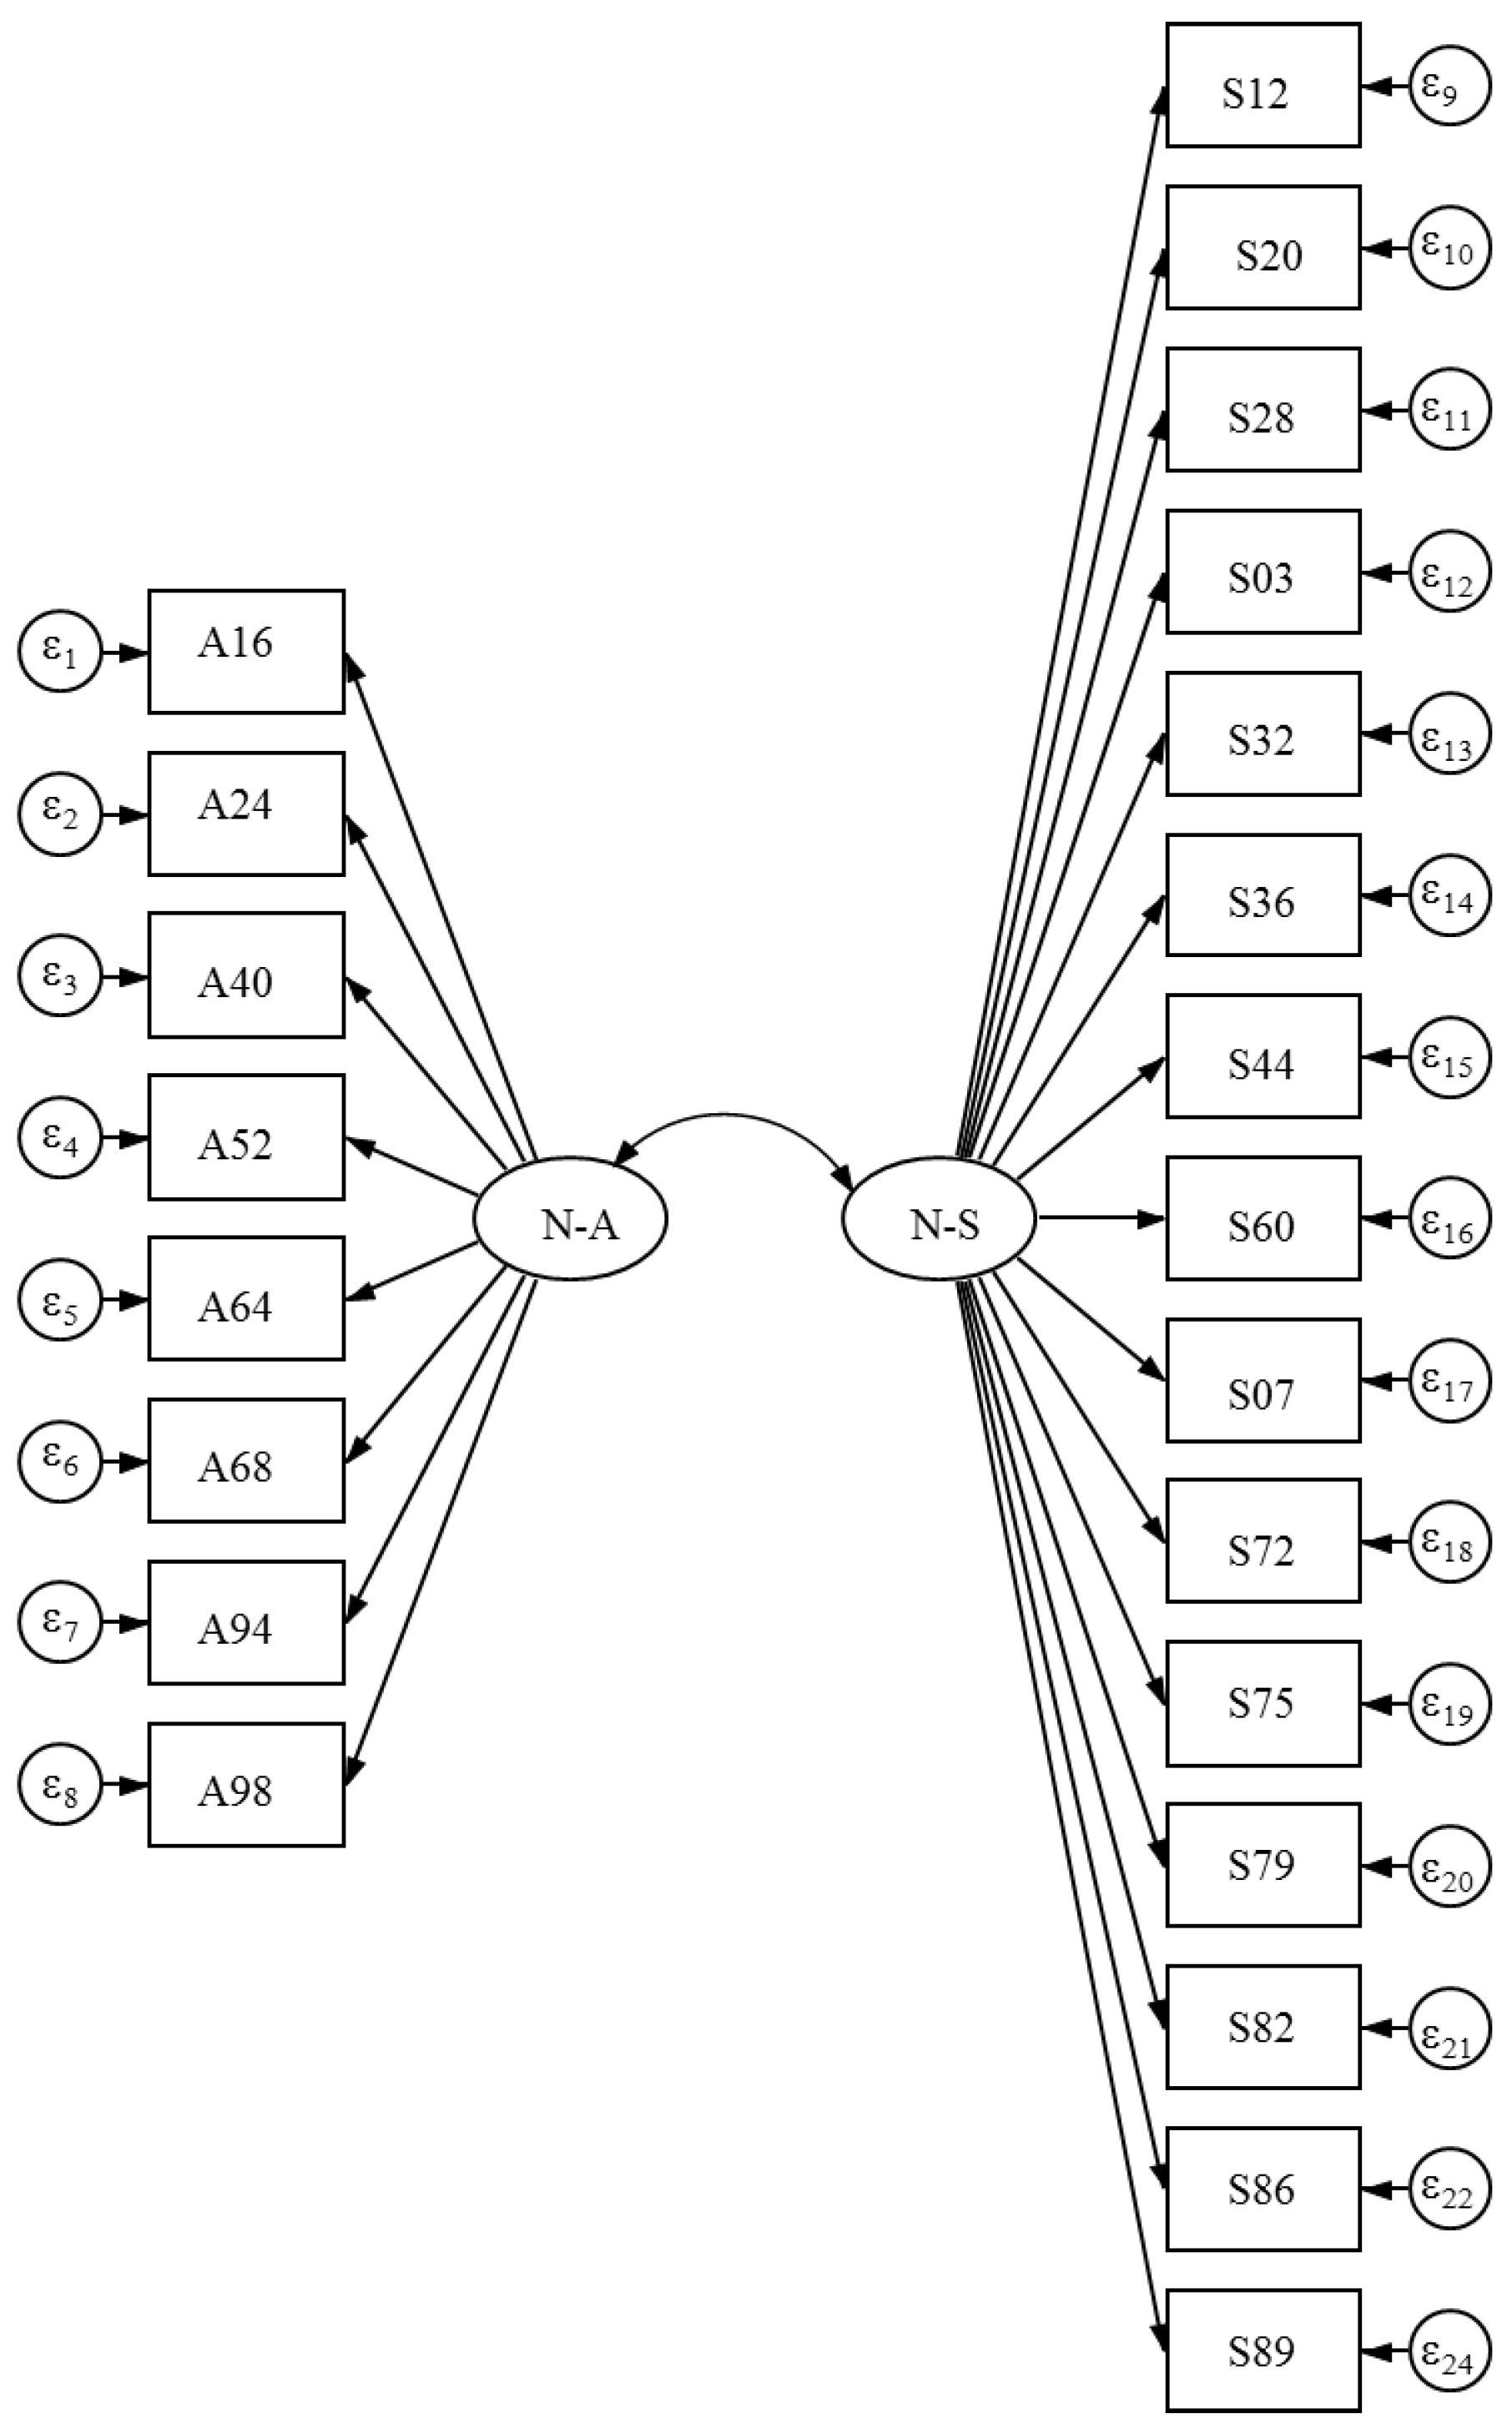
The two-factor structure based on N-S and N-A components (
Francis 1993) was tested with confirmatory factor analysis (CFA) by using the structural equation modelling tool of the STATA 12 software package. The CFAs were performed separately for the Finnish and Turkish datasets. In the first analyses, no modification indexes were allowed. In the second set of analyses, covariance relationships were added within the components so that errors within N-S and N-A variables were allowed. Covariances between N-S and N-A variables or added relationships in measurement model (e.g., relationships between N-S latent variable and N-A variables or N-A latent variable and N-S variables) were not allowed even if suggested by modification indexes since they are theoretically not justified. The basic CFA model tested in Finnish and Turkish data is shown in
Figure 1.
The basic CFA models without added covariances or any other modifications showed low fit in both Finnish and Turkish data: χ2 likelihood ratio values were 564.21 (df = 229) for the Finnish and 1707.76 (df = 229) for the Turkish data; RMSEA values were 0.07 for Finnish and 0.10 for Turkish data; CFI values were 0.76 for Finnish and 0.55 for Turkish data; TLI values were 0.734 for the Finnish and 0.51 for the Turkish data.
The modification indexes were calculated but the only the modifications related to covariances within the scale (N-S or N-A) were allowed and, hence, relationships between N-S and N-A items were not allowed. Consequently, four covariances were added between N-A items (A16 to A64; A24 to A68 & A98; A40 to A52) and 17 covariances between N-S items (S12 to S79 & S86; S20 to S03 & S32 & S89; S28 to S44 & S79; S03 to S32; S32 to S44 & S07 & S82; S44 to S72 & S86 & S89; S07 to S72 & S75 & S86) in the CFA of the Finnish data. In the Turkish data CFA, five covariances between A-S items (A16 to A64; A24 to A64 & A68; A64 to A98; A94 to A98) and 32 covariances between N-S items (S12 to S20 & S28 & S36 & S44 & S79 & S82 & S89; S20 to S79 & S89; S28 to S32 & S44 & S72 & S82; S03 to S07 & S79 & S82; S32 to S44 & S07 & S72 & S79 & S82 & S89; S36 to S79; S44 to S79 & S82 & S89; S60 to S07 & S72 & S89; S79 to S89; S82 to S89) were added.
Adding suggested and theoretically justified covariances to the models improved the fit significantly. The new
χ2 likelihood ratio values were 336.87 (
df = 208) for the Finnish and 824.70 (
df = 222) for the Turkish data;
RMSEA values were 0.04 for the Finnish and 0.11 for the Turkish data;
CFI values were 0.91 for Finnish and 0.92 for Turkish data;
TLI values were 0.89 for the Finnish and 0.90 for the Turkish data. Except the
RMSEA value for the Turkish data, the fit indexes indicated acceptable fit to the data and, thus, the model can be used in the further analyses. The fit indexes also show that the two-factor model of N suggested by
Francis (
1993) fits better to the Finnish than to the Turkish data.
3.2. Reliabilities and Inter-Correlations of the Sex-Related and Sex-Free Components of N
The calculation of N-S and N-A components was based on
Francis (
1993). Alpha reliability coefficients of the N-S, N-A and N scales are listed in
Table 1. In all studies, the N-A component has had low reliabilities compared to the N-S component, which might reflect unbalance between N-S and N-A scale. The N scale has shown higher alphas than the N-S scale. However, this may be caused by a larger number of items in the N scale and, therefore, more precise measurement. In addition,
Table 1 shows that the alpha reliability coefficients gained in the present study for N, N-S and N-A scales were as high as in studies conducted in English-speaking countries (
Francis 1993) and higher than those gained in Japan (
Loo 1995). This might indicate that the Finnish and Turkish translations of the N scale are accurate enough.
Table 1 shows that the N-S component correlated with sex in the Turkish but not in the Finnish data. The N-A scale did not correlate significantly with sex in Finland or in Turkey. It should be noted, however, that in the Turkish data the N, N-S and N-A scales shared a stronger relationship with sex than in any other study listed in
Table 1. This might indicate that neuroticism in general is more strongly related to sex in Turkey than, for example, in Finland.
N-S and N-A indexes had high inter-correlations in both samples (
r = 0.96 in the Finnish and
r = 0.68 in the Turkish sample). In
Francis’s (
1993) study the correlation between sex-related and sex-free neuroticism was as high as 0.65. The N-S and N-A scales also correlated very strongly with the 23-item N scale, correlations being 0.96 and 0.88 in the Finnish and 0.96 and 0.86 in the Turkish sample.
Ferrando et al. (
1997) and later
Lajunen and Scherler (
1999) used the disattenuated correlation, i.e. correlation corrected with reliability coefficients, in order to study the bi-dimensionality of the Lie scale (
Ferrando et al. 1997;
Lajunen and Scherler 1999). In the present study, the disattenuated correlation coefficient between N-S and N-A was 0.99 in the Finnish and 1.00 in the Turkish data. Thus, these analyses based on disattenuated correlations suggest that N-S and N-A indexes essentially measure the same trait. This means that the EPQ N scales can be used as intended as a one scale and the sex-related and sex-free component have finally strong interdependency forming one single measure of neuroticism.
3.3. Effects of Sex and Culture on Sex-Free and Sex-Related Component of Neuroticism
After confirming the two-factor structure (N-S and N-A) of the EPQ N scale and investigating the reliability of the scales, two-way analysis of variance (sex x nationality) was computed to investigate the effects of sex and nationality (and the interaction) on the N, N-S and N-A scores. Both sex,
F(1, 541) = 6.95,
p < 0.01,
η2 = 0.013, and nationality,
F(1, 541) = 4.25,
p < 0.05,
η2 = 0.008, had a statistically significant effect on N score. As expected, sex had no effect on the sex-free component of N,
F(1, 541) = 1.59,
p = NS,
η2 = 0.003, while nationality had an effect on N-A,
F(1, 541) = 21.81,
p < 0.05,
η2 = 0.039. In the same vein, the main effect of sex on N-S scores was found,
F(1, 541) = 9.77,
p < 0.01,
η2 = 0.018, while nationality had no effect on the N-S component,
F(1, 541) = 0.14,
p = NS,
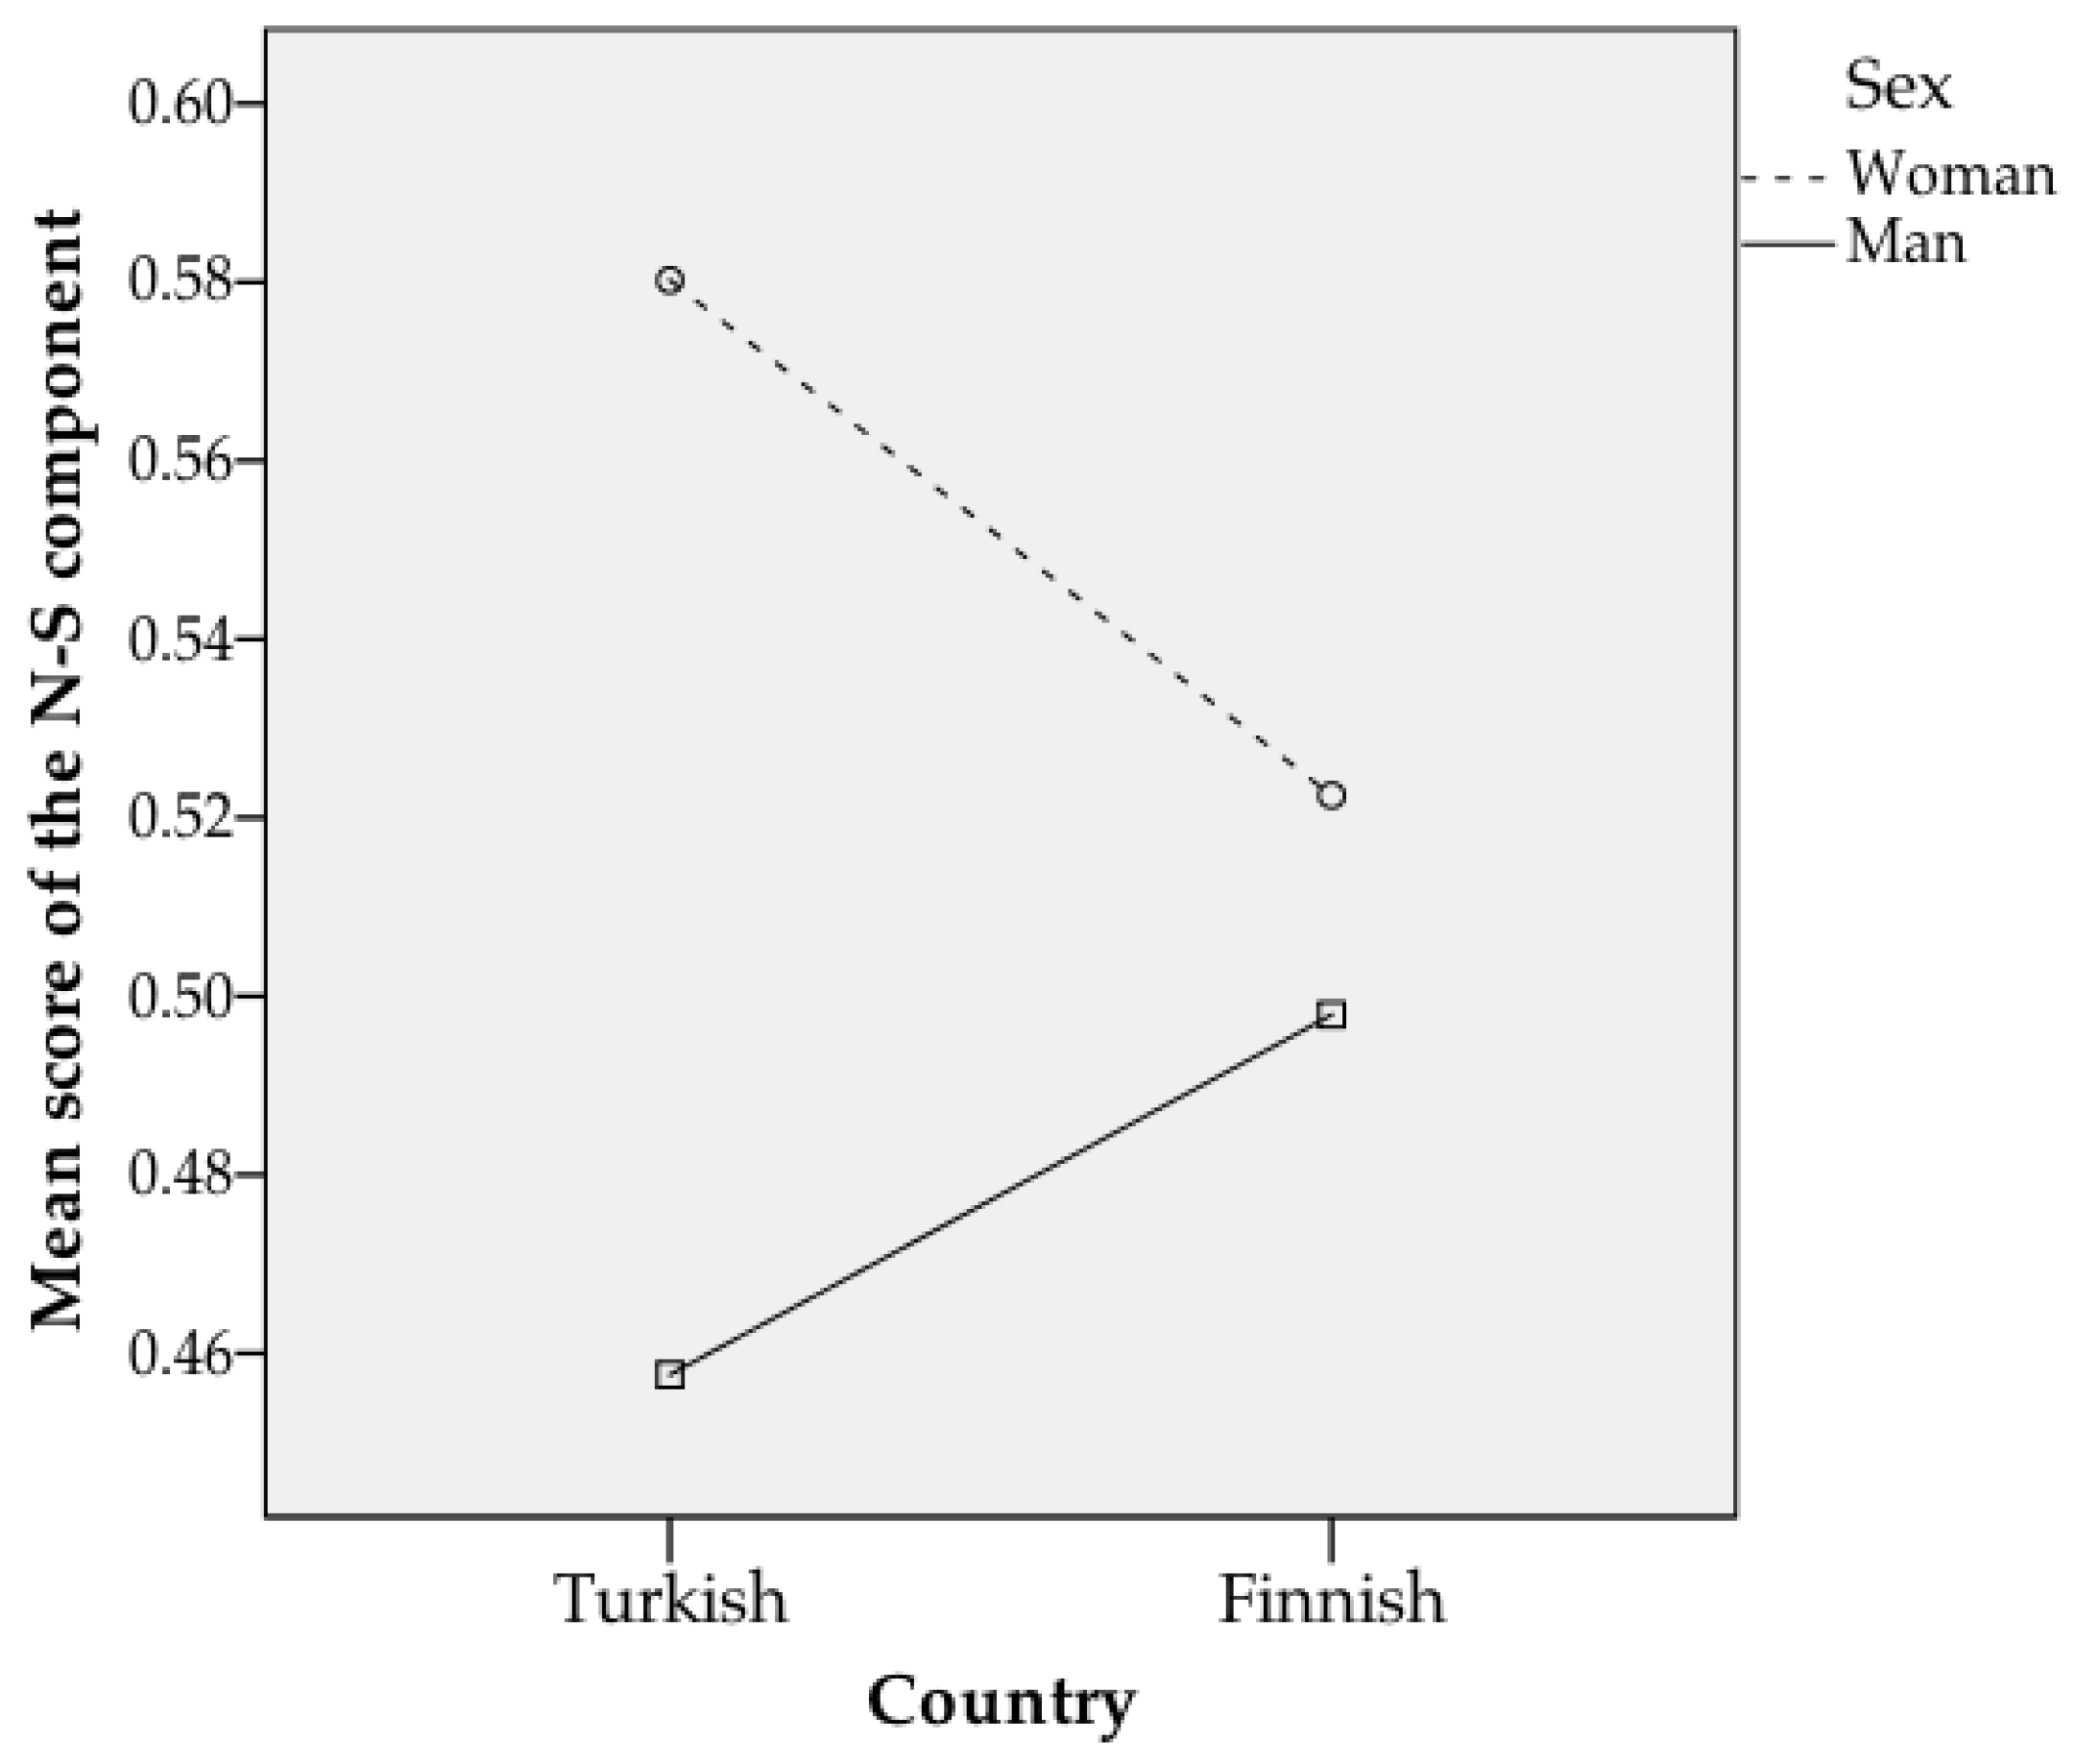
η2 = 0.000. Interestingly, there seems to be not only the sex-related component (N-S) but also the culture-related component of N—at least when comparing Finns and Turks. In addition to main effects of sex and nationality, a sex x nationality interaction effect on N-S scores was found,
F(1,541) = 4.34,
p < 0.05,
η2 = 0.008, while there were no statistically significant interaction effects on N or N-A scores. The sex x nationality interaction effect on N-S scores can be seen in
Figure 2.
In terms of EPQ N mean scores, the only difference observed between the four groups (Turkish women, Turkish men, Finnish women, Finnish men) was between Turkish women and other groups; Turkish women (M = 0.60) scored higher in N than Turkish men (M = 0.50; t225 = 3.312, p < 0.01), Finnish women (M = 0.52; t413 = 4.18, p < 0.001) and Finnish men (M = 0.50; t205 = 3.13, p < 0.05).
The Turkish women scored higher than the in the sex-free (N-A) component of neuroticism (M = 0.64) than Finnish women (M = 0.50; t413 = 5.98, p < 0.001) and Finnish men (M = 0.50; t205 = 3.89, p < 0.001) but there was no statistically significant difference between to Turkish women and men (M = 0.59; t225 = 1.65, p = 0.10). Turkish men scored higher in N-A than Finnish women (t336 = 2.65, p < 0.05) but there was not mean difference between Turkish men and Finnish men (t128 = 1.84, p = 0.68). Finnish women did not differ from Finnish men in the N-A mean score (t316 = 0.22, p = 82).
Turkish women had the highest mean score (M = 0.58) in the sex-dependent (N-S) component of N and, thus, scored higher than Turkish men (M = 0.46; t225 = 3.86, p < 0.001), Finnish women (M = 0.52; t413 = 2.64, p < 0.01) and Finnish men (M = 0.50; t205 = 2.33, p < 0.05). Turkish men scored lower than Finnish women (t336 = −2.125, p < 0.05) but no statistically significant difference was found between Turkish men and Finnish men (t128 = −0.83, p = 0.41). Finnish women did not differ from Finnish men in terms of the N-S score (t316 = 0.71, p = 48).
4. Discussion
One of the aims of this study was to examine the suggested sex-related bi-factorial model of the EPQ Neuroticism as posited by
Francis (
1993) in a sample of Finnish and Turkish university students. Results of the CFA analyses, reliability coefficients and correlations gave partly support for the bi-factorial model based on sex-related and sex-free components of EPQ N. While the suggested bi-factorial model had acceptable fit to empirical data in Finland and Turkey, the fit indexes were far from good. In addition, the reliability coefficients of the sex-free component (N-A) were low both in Finnish and Turkish data, although this can be due to smaller number of items in N-A scale. In the Turkish data, N-S correlate significantly with sex while neither N-A or N-S scale correlated with sex among Finns. While the bi-factorial structure got support from CFA, correlations seem to indicate that the sex-related component of EPQ is related to sex only in Turkey but not in Finland.
Earlier studies conducted in different countries show that women score higher on neuroticism than men (see
Eysenck 1983;
Francis 1993).
Francis (
1993) suggested that this sex difference in neuroticism might be explained to some extent by an artifact of sex bias in the measuring instrument—in the EPQ N scale in the present case. According to
Francis (
1993), the sex-related items of the N scale would, therefore, account for most of the overall difference on the N scores. The present study supported this notion by
Francis (
1993), although the sex-related and sex-free components were not identified in the Finnish data.
The sex-free (N-A) component of neuroticism is characterized by being irritable (item 16 in EPQ-R) or touchy (item 98), feeling fed-up (item 24) or feeling life as dull (item 68). In addition, it includes items related to worry about health (item 52) and “awful thing which might happen” (item 40) as well as feeling oneself as “listless or tired” (item 64) or “sluggish” (item 94). These items refer to “moodiness,” i.e. irritability and dissatisfaction with life but not to social sensitivity (
Roger and Morris 1991). The second factor (N-S) refers to the social anxiety, over-reactivity and hyper-sensitivity component of neuroticism including items about quilt (item 28) and worry related to social settings (item 12 and item 79), being hurt (item 20 and 89), feeling lonely (item 86) and nervous (item 82). In the present study, both nationality (culture) and sex were related to N score while sex (but not nationality) was related on N-S scores and nationality (but not sex) to N-A scores. The total EPQ N score seems to be in this data a composite of a sex sensitive N-A component and a culture sensitive N-A component. While this result should be taken as tentative and needs to be tested in larger multicultural samples, this finding about a sex-related and culture-sensitive component of EPQ N scale might explain some of the sex and cultural differences in neuroticism (
Schmitt et al. 2008).
Comparisons between sexes in the Turkish data confirmed the common finding that women score higher on neuroticism (both N-S and N scores) than men. This was not found, however, in the Finnish data: the Finnish women did not differ on the N or N-S scores from Finnish men. This lack of difference between Finnish men and women is even more surprising, since
Eysenck and Haapasalo (
1989) found the usual differences between sexes in a study based on a large random sample drawn from a national register in Finland. In that study respondents ranged from 18 to 70 years and represented various professions (
Eysenck and Haapasalo 1989). In the present study, however, the Finnish sample consisted of young university students. The result might indicate that the social norms and sex roles for educated women living in the capital city are less traditional and more tolerant and, therefore, do not result in higher scores on neuroticism than among a similar group of men.
In addition, Turkish men did not differ from Finnish men in any of the neuroticism scales but Turkish women scored higher in all N scales than Finnish women. Turkish women scored higher than Turkish men in the sex-related N scale and N scale but not in sex-free N scale. These results might show again that more traditional sex roles are related to higher scores on neuroticism. According to a study conducted in Turkey, women express negative feelings more easily than men (
Fisek 1994). The different functioning of N scales between Finnish and Turkish women in relation to men’s scores might be explained by stricter feminine sex-roles and higher gender inequality in Turkey. According to the recent Human Development Report by UNDP, Turkey’s rank in gender equality is 71 while Finland ranks the 11th (
UNDP 2015). It should be noted, however, that in the present study such cultural dimensions as traditionalism-modernism, masculinity-femininity or collectivism-individualism were not measured and, therefore, the speculations about causes behind the present results should be considered tentative. It can be claimed that one reason for the indistinctness of the EPQ N scale factor structure is the concept of neuroticism itself.
Eysenck and Eysenck (
1975) defined a neurotic person as a “worrier” whose “main characteristic is a constant preoccupation with things that might go wrong and a strong emotional reaction of anxiety to these thoughts.” On the other hand, a neurotic person has been characterized as being “tense and moody” (
Eysenck and Gudjonsson 1989) and over-reacting to stress, finding it difficult to calm down afterwards (
Eysenck 1983). Also, more general emotions, like depression and shyness, are included in the definition of a neurotic person (
Eysenck and Gudjonsson 1989;
Eysenck 1983). Since the concept of neuroticism actually marries different and maybe empirically separable aspects, it is not surprising that different factors may occur in different countries. Results of the present study suggest that culture (Finnish and Turkish in this case) influences the expressions of neuroticism differently. This finding stresses the importance of cross-cultural studies on neuroticism.
This study as well as the previous studies on the factor structure of N scale (
Francis 1993;
Loo 1995;
Roger and Morris 1991) raises the question of whether the original N scale should be replaced by sub-scales found in different studies, e.g. N-A and N-S. In their study about factor structure of EPQ-R neuroticism scale among adolescents,
Mor et al. (
2008) found that the suggested three-factor structure (depression, social concerns and worry) varied across ethnicity and sex while the general N factor accounted for more than 60% of the variance in EPQ–R–N total scores and was invariant across sex and ethnicity (
Mor et al. 2008). In the present study, suggested sex-related component was related to sex only among Turks but not among Finns and, therefore, could not be used in Finland as a sex-related indicator as intended. While the use of various often culture-specific subscales can be informative within culture (e.g. N-S and N-A in Turkey), comparisons between countries may be almost impossible if national sub-scales had been applied. It can therefore be concluded that the different (national) dimensions of neuroticism can be used within a culture but that the original N score should be applied when samples from different cultures are compared and the national structures and content of N are not identical.
This study has certain limitations, which should be taken into account when applying the results in personality assessment or designing future studies about the structure of EPQ N scale. Firstly, there were only two countries included in the study while the results may reflect larger regional differences. Larger samples from several countries would allow better validation of the factor structure (e.g., bi-factorial structure). More detailed confirmatory factor analysis techniques like multi-group analysis could be used to detect the level of possible invariance. Similarly, the differences between sexes and countries observed in this study may just reflect differences between Turkey and Finland and, thus, the cross-cultural generalizability of the findings is limited. It should be noted, though, that Finland and Turkey provide a good basis for comparisons since the cultures differ significantly in terms of sex roles reflected in gender equality scores as well as in terms of such cultural values as collectivism, masculinity and power distance (
Hofstede 2010). Secondly, the samples in both countries consisted of psychology undergraduate students who were predominantly women. While psychology students hardly represent the general population, these samples are fully comparable and assumingly reflect cultural values and “personality” (N in this case) of their nation. We can assume, therefore, that the observed differences in N score between Finnish and Turkish psychology students should especially reflect the true differences in scores and not, for example, literacy rate, familiarity with surveys or other crude technical factors, which might distort the answers in nationally representative samples. The samples in both countries included more women than men which reflect the gender distribution among psychology students. In future studies, other student (or other comparable samples) samples with more equal gender distribution should be collected.


