Abstract
In the context of strong geopolitical tensions worldwide, this paper aims to present a brief illustrative analysis of Portuguese military spending within the NATO context. It was concluded that over the past decades, this variable has consistently remained below 2% of the GDP, with Portugal recording one of the lowest values in NATO in 2024. When broken down by component, personnel expenses represented the largest share of Portugal’s military spending and ranked among the highest in NATO. This seems to be mainly because other categories show very low levels of expenditure, possibly due to budgetary constraints. When assessed on a per capita basis or in relation to the size of the territory, personnel expenses were found to be close to the NATO average, despite Portugal having one of the lowest numbers of military personnel per 100,000 inhabitants. In contrast, equipment expenses were well below the NATO average. Thus, considering the Portuguese government’s intention to increase defense spending, it is expected that the coming years will bring greater investment in the production and/or acquisition of equipment, along with policy measures aimed at increasing the number of military personnel.
1. Introduction
Military expenditure is commonly associated with a state’s power (Fontanel 2022). The importance of this component of public spending—which directly reflects the cost of defending a nation’s sovereignty—has been the subject of extensive analysis, reflection, and debate by institutions and public authorities. It is worth highlighting that from an academic standpoint, numerous studies have emerged over the past decades. This work has not only provided estimates of military spending across various countries and historical periods—allowing for international comparisons—but also offered empirical findings on its impact on a range of political, social, and economic variables.
Recently, Alsmadi et al. (2024) provided an important structured review of the most significant studies related to military expenditure through a bibliometric review and content analysis.1 Based on this structured review, and focusing only on studies with more than one hundred citations in the Scopus database, it is possible to observe that most of these studies have focused on the economic effects of military expenditure (an issue that will also be discussed in Section 4).2 In this regard, it is worth starting by highlighting the work of Smith (1980), who, based on a sample of 14 OECD countries during the period of 1954 to 1973, concluded that investment constitutes an opportunity cost of military expenditure, evidenced by a negative relationship between the two variables. Similarly, Deger and Smith (1983) found that military expenditure has a negative impact on the economic growth of Least Developed Countries (LDC), delaying their development. On the other hand, accepting the idea that military spending can generate significant and positive effects in the form of technological progress, R&D, skill creation, and increased demand, Deger and Sen (1983) concluded, for the case of less developed countries, that the economic spin-off from defense to development is weak.
Dunne et al. (2005) conducted a literature review on theoretical and econometric issues related to growth models that included military expenditures. The authors concluded that while the traditional economic growth literature did not identify military spending as a relevant determinant, much of the defense economics literature did find significant effects—something that seems to be due to specific model specifications, such as the Feder–Ram model, which has been used in the defense economics literature but not in the traditional literature.3
Contrary to the studies already mentioned, Alptekin and Levine (2012) found that the hypothesis of a negative military expenditure–growth relationship is not supported for LDCs, while a positive effect of military expenditure on economic growth is supported for developed countries. In fact, the literature shows the existence of more recent studies that also identified a positive relationship between military spending and economic growth (see, for example, Yildirim et al. 2005; Kollias et al. 2007; Yildirim and Ocal 2016; Utrero-González et al. 2017). In the specific case of Portugal, it is worth highlighting Ferraz (2022c). In this study, a long-term series—spanning more than 150 years—of Portuguese military expenditure was presented for the first time. By estimating a dynamic model, both positive and negative effects of this variable on economic growth were identified.
However, it is important not to lose sight of the fact that, above all, military expenditure has the fundamental objective of enhancing a state’s ability to defend itself against potential threats (Hartley 2010; Torres 2020). In this regard, it is worth highlighting that recent years have been marked by geopolitical tensions that have resurfaced, with military strength, unconventional threats, and economic leverage serving as key means of exerting strategic influence (Marek et al. 2025). These recent tensions—particularly between the Russian Federation and the West, due to the 2022 invasion of Ukraine—have introduced new challenges, placing pressure on various North Atlantic Treaty Organization (NATO) members to increase their military spending (Ferraz, forthcoming). This culminated in what is already being regarded as the historic Hague Summit, in which the Allies committed to investing 5% of their GDP annually into core defense requirements, as well as in defense and security related spending by 2035 (NATO 2025c).4
In today’s challenging world, this short paper presents a brief illustrative analysis of Portuguese military spending in the context of NATO—a strategic political and military alliance that is now one of the largest international institutions and which Portugal co-founded in 1949. Accordingly, and drawing on a range of primary and secondary sources, this article seeks to answer the following questions:
- (1)
- How has Portuguese military spending evolved in recent history? Is Portugal spending more or less than in the past, and why?
- (2)
- Since 1949, how does Portuguese military spending compare with that of other NATO countries?
- (3)
- And, in comparable terms, does Portugal currently spend more or less than the average among those countries?
- (4)
- Regarding the breakdown of that spending by category—namely, equipment, infrastructure, and personnel—what is Portugal’s position within the NATO context?
- (5)
- Regarding these categories, what stands out in the Portuguese case? What might explain any possible differences compared to the majority of other NATO countries?
- (6)
- What political decisions can be expected in the coming years?
This article is structured as follows: after this section, Section 2 presents the materials and methods used. Section 3 provides the analysis addressing the research questions and presents the main results. Section 4 briefly discusses what can be expected in terms of Portuguese defense expenditure in the coming years. Finally, Section 5 outlines the main conclusions.
2. Materials and Methods
The standardized reporting of data by countries to both the United Nations (UN) and NATO, with the aim of creating and disseminating a common database of comparable military expenditure, contributes to transparency. The positive effects of this procedure include reducing mistrust between states and discouraging an arms race, thereby promoting a reduction in military budgets and, consequently, the reallocation of resources to fostering economic and social development (Rauch et al. 2014).
However, we must keep in mind that these data may present issues, as some states may have an incentive to report partial or even manipulated information.5 Recently, in light of the new commitments made by NATO members, this discussion has resurfaced in the public debate, with warnings that some countries have sought to boost their defense figures by including potentially questionable items. The issue of “creative accounting” thus emerged in the media, with the example of the United Kingdom, which since 2016 has included war pensions and intelligence gathering as part of its 2 percent commitment to NATO. Meanwhile, Spain appears to have included costs related to border control, coastal surveillance, and contributions to EU security missions (Newsweek 2025). Also, in the Portuguese case, some voices within the military sector have questioned the reported figures, arguing that they may be artificially inflated, particularly concerning personnel expenditures. More specifically, Major-General Isidro Morais Pereira, former Portuguese representative to NATO, stated in an interview that Portugal’s figures also include expenditures related to the National Republican Guard (a security force) and military pensions, which inflate the reported value of military spending (CNN Portugal 2025).
In any case, acknowledging this limitation, which is apparently related to a high degree of discretion in terms of including expenses in military spending and the absence of auditing by official institutions, this short paper focuses on working with the available data to draw conclusions. More concretely, a descriptive analysis approach is primarily used, based on the construction of indicators illustrated through figures and tables. To build these indicators, official data from NATO and the World Bank were utilized. This information was complemented with reputable secondary sources, such as the Stockholm International Peace Research Institute (SIPRI), as well as more specific sources directly related to the Portuguese case from a long-term perspective (such as Mata 1993; Valério 2008; Ferraz 2020a).
3. Analysis and Results
By combining different data—historical official statistics with secondary sources—it is possible to start by constructing a long-term series of Portugal’s defense spending, that is, the Portuguese State’s expenditures on its armed forces. Figure 1 thus illustrates the evolution of this series as a percentage of the GDP since the mid-19th century.6
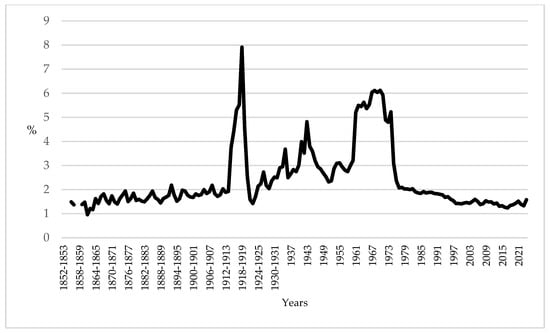
Figure 1.
Portugal’s defense expenditure as a percentage of GDP, 1852–1853 to 2024. Sources and notes: See Table A1 in Appendix A.
What stands out immediately is the very significant increase in defense spending during the economic years 1914–1915 to 1918–1919, which correspond to the period of the Great War (1914–1918). Indeed, although Portugal officially became a belligerent only in March 1916, at the very beginning of the war it mobilized additional forces to Angola and Mozambique to counter German incursions; this naturally entailed a financial burden on the Portuguese public coffers. This effort intensified in the following years when Portugal fought on the Western European front.7 It is worth noting that the average Portuguese military expenditure during the economic years 1914–1915 to 1918–1919 was 5% of the GDP.
There is also a notable increase in military expenditures between 1926 and the early years of the 1940s, which can be explained by a combination of factors.8 First of all, it is important to highlight the characteristics of the regime itself—the Military Dictatorship (1926–1933)—which was established by the coup d’état of 28 May 1926. The Spanish Civil War (1936–1939) also necessitated military reinforcement along the Portuguese borders, while the implementation of the Economic Reconstruction Law (1935–1950) entailed various military investments.9 On the other hand, Portugal felt the need to strengthen the security of its territory during World War II, despite maintaining neutrality (Ferraz 2022c).
Military spending surged once again during the Colonial War (1961–1974), which pitted the Portuguese Armed Forces against independence movements in the overseas provinces of Angola, Guinea, and Mozambique.10 At that time, the average value of these expenditures rose to around 6% of the GDP. It is also possible to see in Figure 1 that the 1970s marked a sharp downward trend in military spending. Existing statistics even show that from 1983 onwards, Portugal’s military expenditure consistently remained below 2% of the GDP, that is, at a level below the NATO commitment. This demonstrates that in times of peace, military spending ended up falling behind. In Portugal, the advent of democracy in 1974 led to the rapid development of the Portuguese welfare state in a context of strong growth of social spending (see Ferraz 2022c; Ferraz et al. 2024). The necessity for policymakers to make decisions within the context of limited resources (budgetary constraints) seems to have dictated this.
To contextualize the Portuguese case within the international landscape, average values for military expenditure of various NATO members were calculated over different sub-periods from 1949—the year the Alliance was founded—up to the recent year of 2024.11 These values are documented in Table 1. It is clear that in only one of these sub-periods (1961–1970), which covers most of the years during the Colonial War, did Portugal present a value above the average of this group of countries. In the other sub-periods, the Portuguese value was always lower. However, there are other interesting conclusions that can be drawn from the analysis of Table 1. For example, it can be observed that the average defense expenditures of NATO countries decreased from one sub-period to the next. This fact can certainly be explained by the context of relative peace experienced by many countries after World War II—a sentiment that intensified with the collapse of the Soviet Union and the end of the Cold War.12 In Portugal’s case, however, and for obvious reasons, that reduction only occurred after the 1961–1970 sub-period.

Table 1.
Defence expenditures in NATO countries as a percentage of GDP, 1949–2024.
A complementary exercise consists of analyzing the evolution of Portuguese military expenditure as a percentage of the GDP in comparison to the average of NATO’s founding members.13 Figure 2 illustrates this reality since the founding of the Alliance.

Figure 2.
Portugal’s defense expenditure as a percentage of GDP (NATO founding members’ average = 100), 1949 to 2024. Sources and note: See Table A1 in Appendix A.
As it can be seen, only during the time of the Colonial War did Portugal’s military expenditure as a percentage of the GDP exceed that of the mentioned average. However, it is noteworthy that there was a trend toward convergence starting in the second half of the 1980s. Indeed, while in 1985 Portugal’s military expenditure as a percentage of the GDP represented only 63% of the average of NATO’s founding members, by 2021 it had reached 94%. It should be noted, however, that this convergence occurred because the downward trend in Portuguese military spending during that period was less pronounced than the decline observed in the NATO average. The divergence seen in the more recent period of 2022–2023—marked by Russia’s invasion of Ukraine—was explained by the increase in average NATO spending outpacing that of Portugal.14 It is, however, worth noting that according to the provisional figures reported by the Portuguese government to NATO, the year 2024 meant convergence for Portugal, with the country reaching 82%.
Figure 3 places Portuguese military expenditures within the NATO context for the recent year of 2024.
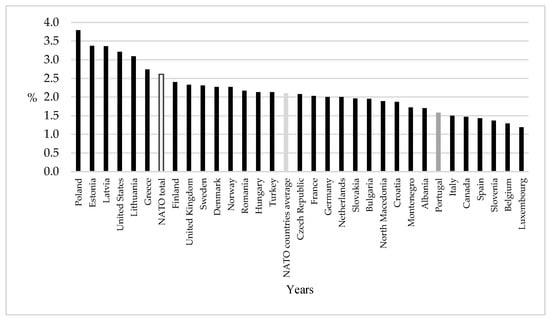
Figure 3.
Defence expenditure as a percentage of GDP in NATO countries, 2024. Sources: See Table A1 in Appendix A.
It is thus evident that Portuguese military expenditures as a percentage of the GDP were below both the overall NATO value (the official criterion) and the average of those countries’ values.15 Portugal was thus the seventh country with the lowest expenditure ratio, specifically 1.6%. This value was therefore still far from the 2% of GDP that the Portuguese Government aims to reach as early as this year,16 an important target that may pose a new challenge for Portuguese public finances.17 The fact that Poland, Estonia, and Latvia were the countries that spent the most on defense as a percentage of GDP in 2024 is certainly related to Russia’s invasion of Ukraine.18
NATO statistics also provide data on military expenditures broken down into four categories (equipment, infrastructure, personnel, and others) as a percentage of total defense spending. Table 2 documents these values for the different countries.19
Table 2.
Defence expenditures in NATO countries broken down by category as a percentage of total defense spending, 2024.
As it can be seen, in 2024, Portugal was one of the five countries where personnel expenses accounted for the largest share of defense spending. On the other hand, the weight of military equipment expenditure was the third lowest among NATO countries. It is worth exploring this issue a bit further. To do so, we start by calculating personnel expenses per capita—an indicator that allows for comparison of military personnel costs per citizen—and also the number of military personnel per 100,000 inhabitants—an indicator useful for comparing troop numbers considering the population size of each country.
Figure 4 shows that Norway was the highest spender on military personnel in 2024, specifically USD 681 (at constant prices) per inhabitant. It is also possible to observe that Portugal’s spending was close to the NATO countries’ average, standing at USD 233 per inhabitant. Nonetheless, as it can also be seen in the figure, Portugal had only 224 military personnel per 100,000 inhabitants—a figure below the NATO average and, in fact, the eighth lowest. In the case of this indicator, Greece stands out with over 1000 military personnel per 100,000 inhabitants, which is certainly related to the ongoing tensions and rivalries with Turkey.

Figure 4.
Personnel expenditure per capita (in constant 2021 prices and exchange rates, US dollars) and military personnel per 100,000 inhabitants, 2024. Sources: See Table A1 in Appendix A.
We also calculated equipment expenditures on a per capita basis. The results of this exercise are illustrated in Figure 5.
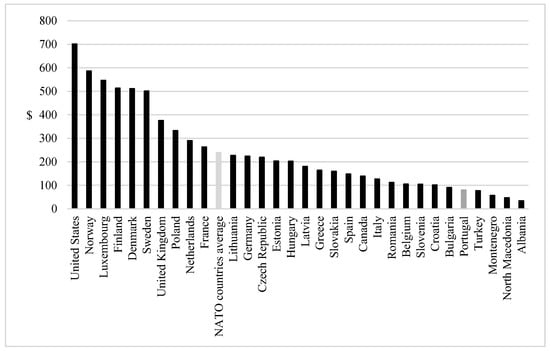
Figure 5.
Equipment expenditure per capita (in constant 2021 prices and exchange rates, US dollars), 2024. Sources: See Table A1 in Appendix A.
In this case, the United States was the highest per capita spender (USD 702). Portugal, having spent only USD 80 (at constant prices), was in the “rear group” (only ahead of Turkey, Montenegro, North Macedonia, and Albania).
Finally, to strengthen the robustness of our results, we also calculated both personnel and equipment expenditure relative to the territorial surface of each NATO member country. This reinforces the contextualization of the Portuguese case within the international landscape. Accordingly, we turn to Figure 6.
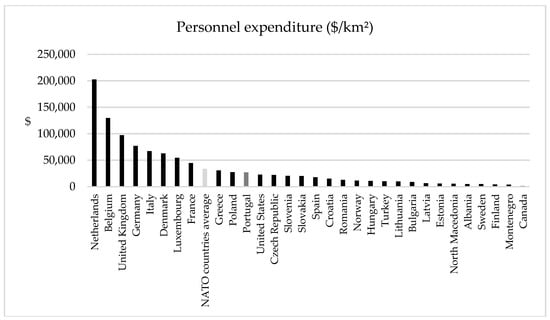
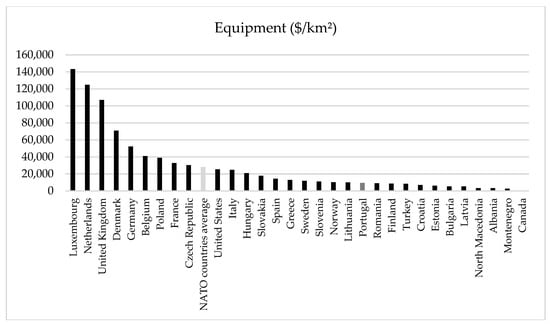
Figure 6.
Personnel and equipment expenditure (in constant 2021 prices and exchange rates, US dollars) per square kilometer, 2024. Sources: See Table A1 in Appendix A.
Although the ordering of personnel expenses and equipment expenses per km2 presents a very different picture from when they are assessed on a per capita basis, there is an obvious conclusion that this analysis allows us to draw. In this case, as well, Portugal’s personnel expenses were close to the NATO average. On the other hand, in the case of equipment expenses, the Portuguese value remained far below the NATO average (approximately USD 9 thousand versus USD 28 thousand per km2).
4. Discussion
By combining the results presented in this paper with the information that Portugal intends to increase its defense spending in light of the new NATO commitments20 due to the heightened tensions caused by Russia’s invasion of Ukraine, it is expected that in the coming years, this will materialize as greater investment in the production and/or acquisition of equipment, as well as policy measures aimed at increasing the number of military personnel. This may eventually produce positive effects that go beyond security and defense themselves, potentially stimulating Portuguese economic growth, as shown in Ferraz (2022c); this also appears to be the expectation of the Portuguese government.21
In fact, the literature shows that there are several channels through which military expenditure can be related to economic growth (for a detailed literature review of this subject, see, for example, Ilzetzki 2025). On the one hand, recalling the Keynesian effect of public spending—that is, the idea that if the state increases its expenditure, this may generate a positive multiplier effect in the economy—it is possible to consider, for example, that if the state purchases goods and services, then the companies selling them will receive additional resources, which may in turn stimulate investment and employment (European Commission 2025). It is also possible to consider that part of these investments in the military sector correspond to R&D and may therefore stimulate technological progress in the economy, thereby contributing to the overall development of the economy as a whole. On the contrary, it is also possible to acknowledge the existence of negative effects resulting from the increase in these expenditures. That is, if the state raises its military spending, this may also lead to reduced investment in other important sectors of the economy and, depending on the level of such expenditure, crowding-out effects (European Commission 2025).
We can link this discussion to two additional aspects. The first relates to the different categories of such spending—analyzed in the previous section—which include items like salaries, weapon systems, and infrastructure and may have distinct impacts on growth. For example, Becker and Dunne (2023) concluded that the negative correlation identified in some studies between military spending and growth was primarily explained by personnel expenditures. In this regard, it should be noted that a high percentage of Portuguese military spending (more than 50%) is, precisely, on personnel, which is one of the highest within NATO. The explanation seems to lie primarily in the fact that the other categories show very low levels of expenditure, which is possibly related to the budgetary constraints to which Portugal is subject. In fact, because most of the available resources are allocated to maintaining existing personnel, it is more difficult to increase spending on physical capital. On the other hand, as noted earlier, there are also some voices in Portuguese society suggesting that personnel costs may be artificially inflated. In this context, it seems reasonable to question whether military spending with such a high proportion allocated to personnel costs—and a comparatively lower share devoted to investments in equipment and operational capabilities—might, in practice, represent a constraint on the country’s contribution to the collective defense system. Nevertheless, Portugal’s low levels of equipment expenditure appear to reflect a low investment in modernization within a context of budgetary constraints.
The second aspect is related to the destination of military spending. That is, whether military expenditures, such as those for equipment, are directed toward acquisitions made abroad or within the national territory. It is easy to understand that if a state opts for domestic production, for example, by investing in infrastructure to produce its own equipment or by purchasing from private companies located within its borders, then the positive effects on industry, innovation, and employment are clear. Such production can generate indirect benefits for the business sector, technological innovation, and job creation. In contrast, if a country purchases this equipment from abroad—that is, if it merely imports finished products and their components—the multiplier effects of this spending on the national economy will naturally be much more limited. Portugal should therefore also take this aspect into account when making its investments.
5. Conclusions
Over the past decades, Portuguese military spending has consistently remained below 2% of its GDP—a level lower than NATO countries’ average. Indeed, in 2024, Portugal recorded the seventh lowest military spending ratio within the organization. By breaking down military expenditures into their different categories, it was possible to observe that in that same year, personnel expenses represented the largest share of Portugal’s total defense spending and one of the highest among NATO countries. The underlying explanation appears to stem from the notably low levels of expenditure observed in other categories—with the share of equipment expenses in total defense spending being the third lowest among NATO members. This seems to be associated with the budgetary constraints faced by Portugal, which require allocating a significant portion of available resources to the maintenance of existing personnel. Consequently, this may be a constraint to the country’s contribution to the collective defense system itself.
Exploring this issue further to better contextualize the Portuguese case within the international landscape, we calculated a few indicators for the year 2024: (1) military personnel expenditure per capita; (2) number of military personnel per 100,000 inhabitants; (3) military equipment expenditure per capita; and (4) personnel and equipment expenditure (in constant 2021 prices and exchange rates, US dollars) per square kilometer. Based on these indicators, we concluded that Portugal’s personnel expenditure was close to the NATO countries’ average, despite Portugal being the eighth country with the lowest number of military personnel per 100,000 inhabitants. Finally, we also found that Portugal was one of the NATO countries that spent the least on military equipment, both per capita and per square kilometer.
Combining these results with the information that Portugal intends to increase defense spending to reach 5% of its GDP by 2035, in light of the commitments made to NATO, and in response to heightened geopolitical tensions, it is expected that in the coming years this will materialize in policy measures aimed at increasing the number of military personnel as well as greater investment in the production and/or acquisition of equipment—a category of military expenditure that may generate multiplier effects on the Portuguese economy. However, it is important to consider that the scale and significance of these effects may depend on the destination of that spending (the choice between domestic production and imports).
Relevant aspects like this should be taken into account by Portuguese decision makers when planning investments for the coming years, especially in a context of tight budgetary constraints. In fact, Portugal is expected to be able to make these investments while continuing on the path of public finance sustainability that has been followed over recent years.
Finally, it is important to emphasize that with this paper, we hope to encourage further research on the ever-relevant topic of military expenditure.
Funding
This work was supported by FCT, I.P., the Portuguese national funding agency for science, research and technology, under Project UIDB/06522/2023.
Data Availability Statement
The data used in this paper are available in various different sources, all of which are identified in Table A1, under the section entitled “Appendix A”.
Conflicts of Interest
The author declares no conflicts of interest.
Abbreviations
The following abbreviations are used in this manuscript:
| NATO | North Atlantic Treaty Organization |
| GDP | Gross Domestic Product |
Appendix A
Table A1.
Sources and notes for figures and tables.
Table A1.
Sources and notes for figures and tables.
| Figure 1 | Sources: Own calculations, Mata (1993), Valério (2008), Ferraz (2020a), NATO (2025a), and World Bank (2025). Note: Until 1935, for public accounting purposes, the fiscal year of the Portuguese Central Government began on 1 July of a given calendar year and ended on 30 June of the following calendar year. However, Decree-Law No. 25,299 of 6 May 1935 changed this, ordering that from 1 January 1936, the fiscal year of the Central Administration should coincide with the calendar year (see Diário do Governo [Official Journal of the Government] 1935). |
| Figure 2 and Table 1 | Sources for Portugal: Those used to construct Figure 1. Sources for the other countries: Own calculations, SIPRI (2023), NATO (2025a), Our World in Data (2024), and World Bank (2025). Note 1: When Iceland joined NATO in 1949, it had no armed forces and, by its own choice, it continues to have none (NATO 2024b). Therefore, both Figure 2 and Table 1 do not contain information about this country. Note 2: Until 1959, there are no data for Luxembourg |
| Figure 3 | Source: Own calculations and NATO (2025a). |
| Figure 4 and Figure 5 | Sources: Own calculations, NATO (2025a), and World Bank (2025). |
| Figure 6 | Sources: Own calculations, NATO (2025a), and Worlddometer (2025). |
| Table 2 | Source: NATO (2025a). The meaning of the categories presented according to NATO: 1. Equipment: expenses related to major equipment, including R&D associated with that equipment; 2. Infrastructure: expenses related to NATO common infrastructure and national military construction; 3. Personnel: expenses related to personnel, including military, civilian, and pension costs; 4. Others: other operating and maintenance expenses, other R&D expenses, and expenses not included in the previous categories. |
Notes
| 1 | I thank an anonymous reviewer for the important comments that helped me improve the literature review on military expenditure. |
| 2 | The only exception was the work of Murdoch and Sandler (1984), who sought to understand how a NATO country’s military expenditure is influenced by the spending of its allies. The core message of this line of research is that changes in NATO’s strategic doctrine, weapons technology, membership, and perceived threats affect the mix of public and private benefits derived from the allies’ military expenditure, thereby influencing burden sharing (Kim and Sandler 2020). |
| 3 | The Feder–Ram model uses an aggregate production function approach to estimate the transmission mechanism from defense spending to economic growth (Wijeweera and Webb 2012). |
| 4 | Chronological context of NATO’s commitment regarding defense spending: In 2006, NATO Defence Ministers committed to spending a minimum of 2% of the GDP on defense in order to ensure the Alliance’s military readiness. Moreover, according to NATO itself, this figure also serves as an indicator of a country’s political will to contribute its share to the common defense, as the defense capability of each member is considered to impact the overall perception of the credibility of the Alliance as a political–military organization (NATO 2024a). It should be noted that in 2014, the Allies set the goal of reaching the 2% of GDP target within a decade (see NATO 2014). As explained above, this target was recently raised to 5% of the GDP (NATO 2025b). |
| 5 | As precisely warned by Rauch et al. (2014), who suggest the application of data auditing techniques to detect potential issues related to manipulation and falsification. I thank an anonymous reviewer for bringing this issue to my attention. |
| 6 | This figure updates the one presented in Ferraz (2022c). |
| 7 | For information on the economic and financial effects of the First World War, see Ferraz (2020a, 2023). |
| 8 | As detailed in Valério (1994). |
| 9 | Regarding this law, see, for example, Nunes and Valério (1983) and Ferraz (2020b, 2022a). |
| 10 | For the budgetary impact of this war, see Ferraz (2022b). |
| 11 | It is important to note that the quantitative information provided by NATO for this year is provisional and may still be subject to revision. Although NATO also provides figures for the year 2025, this information is merely a projection based on the commitments made by the various member states. |
| 12 | Feinstein et al. (2008) specifically draw attention to the fact that the reduction of the threat of global war led to a decreased demand for armaments by various capitalist economies, which in turn had an impact on their military expenditures. |
| 13 | Note: In addition to Portugal, the co-founders are Belgium, Canada, Denmark, the United States, France, Iceland, Italy, Luxembourg, Norway, the Netherlands, and the United Kingdom. |
| 14 | This new geopolitical reality is driving the countries of the European Union—which do not have an independent military structure separate from NATO (Violakis 2023)—to invest more in their own defense. On the other hand, the pressure exerted by U.S. President Donald Trump on his NATO allies (on this subject, see, for example, Samuels 2024) also seems to be pushing in that direction. |
| 15 | NATO total: Total NATO expenditure in relation to its GDP (official criterion). Average of NATO countries: corresponds to the arithmetic mean of expenditures as a percentage of the GDP of the various NATO countries (value calculated within the scope of this paper). |
| 16 | As stated by the Portuguese Prime Minister, Luís Montenegro, during the presentation of the Program of the XXV Constitutional Government in the Portuguese Parliament (see Governo [Government of Portugal] 2025b), and as reflected in NATO’s own projections for the current year (see NATO 2025a). |
| 17 | On this subject see, for example, the Public Finance Council (see Conselho das Finanças Públicas [Portuguese Public Finance Council] 2023). |
| 18 | For example, at the beginning of 2025, the Polish Minister of Defence stated precisely that “there is no issue more important than spending on security.” See Euronews (2025). |
| 19 | For information on the meaning of each, see Table A1 in Appendix A. |
| 20 | Regarding the new developments agreed upon in defense spending, see NATO (2025b, 2025c) and Governo [Government of Portugal] (2025a). |
| 21 | Recently, the Portuguese Minister of Defence, Nuno Melo, stated that increasing the defense budget represents an investment and that allocating funds to national defense has a positive impact on the economy. He further noted that these investments could even improve citizens’ lives, given the services that the Armed Forces provide to the country (see ECO 2025). |
References
- Alptekin, A., and P. Levine. 2012. Military expenditure and economic growth: A meta-analysis. European Journal of Political Economy 28: 636–50. [Google Scholar] [CrossRef]
- Alsmadi, Ayan Abdalmajeed, Anwar Al-Gasaymeh, Ala’a Fouad Al-Dweik, Najed Alrawashdeh, Manaf Al-Okaily, and Abdalmuttaled Al-Sartawi. 2024. Military Expenditure and Economic Growth: A Bibliometric Analysis During 1921–2022. In Artificial Intelligence and Economic Sustainability in the Era of Industrial Revolution 5.0. Edited by Abdalmuttaleb Musley Al-Sartawi and Abdulnaser Ibrahum Nour. Studies in Systems, Decision and Control. Gewerbestrasse: Springer, vol. 528, pp. 809–33. [Google Scholar]
- Becker, Jordan, and John Paul Dunne. 2023. Military Spending Composition and Economic Growth. Defence and Peace Economics 34: 259–71. [Google Scholar] [CrossRef]
- CNN Portugal. 2025. “Fui Representante de Portugal na NATO e o que ouvia de outros países não era agradável”: Portugal faz “uma chico-espertice” para evitar gastar mais em Defesa. Available online: https://cnnportugal.iol.pt/defesa/portugal/fui-representante-de-portugal-na-nato-e-o-que-ouvia-de-outros-paises-nao-era-agradavel-portugal-faz-uma-chico-espertice-para-evitar-gastar-mais-em-defesa/20250327/67e4405cd34e3f0bae9c28d1 (accessed on 4 September 2025).
- Conselho das Finanças Públicas [Portuguese Public Finance Council]. 2023. Riscos orçamentais e Sustentabilidade das Finanças Públicas 2023. Report No. 11/2023 of Portuguese Public Finance Council. Lisboa: Portuguese Public Finance Council. [Google Scholar]
- Deger, Saadet, and Ron Smith. 1983. Military Expenditure and Growth in Less Developed Countries. The Journal of Conflict Resolution 27: 335–53. [Google Scholar] [CrossRef]
- Deger, Saadet, and Sammath Sen. 1983. Military expenditure, spin-off and economic development. Journal of Development Economics 13: 67–83. [Google Scholar] [CrossRef]
- Diário do Governo [Official Journal of the Government]. 1935. Decreto-lei n.º 25.299, de 6 de Maio de 1935: Determina que, a partir de 1 de Janeiro de 1936, os anos económicos a que é referida a contabilidade pública coincidam com os anos civis. Lisbon: Imprensa Nacional. [Google Scholar]
- Dunne, John P., Ron Smith, and Dirk Willenbockel. 2005. Models of Military Expenditure and Growth: A Critical Review. Defence and Peace Economics 16: 449–61. [Google Scholar] [CrossRef]
- ECO. 2025. Defesa? “Não é despesa, é Investimento”, diz Nuno Melo. Available online: https://eco.sapo.pt/2025/03/26/defesa-nao-e-despesa-e-investimento-diz-nuno-melo/ (accessed on 5 September 2025).
- Euronews. 2025. Não há questão mais Importante do que a despesa com a segurança”, alerta Ministro polaco da Defesa. Available online: https://pt.euronews.com/2025/01/13/nao-ha-questao-mais-importante-do-que-a-despesa-com-a-seguranca-alerta-ministro-polaco-da- (accessed on 24 January 2025).
- European Commission. 2025. The Economic Impacto of Higher Defence Spending. Available online: https://economy-finance.ec.europa.eu/economic-forecast-and-surveys/economic-forecasts/spring-2025-economic-forecast-moderate-growth-amid-global-economic-uncertainty/economic-impact-higher-defence-spending_en (accessed on 4 September 2025).
- Feinstein, Charles, Peter Temin, and Gianni Toniolo, eds. 2008. Epilogue: The Past and the Present. In The World Economy Between the World Wars. Oxford: Oxford University Press, pp. 179–93. [Google Scholar]
- Ferraz, Ricardo. 2020a. Grande Guerra e Guerra Colonial: Custos para os Cofres Portugueses. Lisbon: Edições Sílabo. [Google Scholar]
- Ferraz, Ricardo. 2020b. The Portuguese development plans in the postwar period: How much was spent and where? Investigaciones de Historia Económica 16: 45–55. [Google Scholar]
- Ferraz, Ricardo. 2022a. Os Planos de Fomento do Estado Novo—Quantificação e Análise. Lisboa: Edições Sílabo. [Google Scholar]
- Ferraz, Ricardo. 2022b. The Financial Costs of the Portuguese Colonial War, 1961–1974: Analysis and Applied Study. Journal of Iberian and Latin American Economic History 40: 243–72. [Google Scholar] [CrossRef]
- Ferraz, Ricardo. 2022c. The Portuguese Military Expenditure from a Historical Perspective. Defence and Peace Economics 33: 347–65. [Google Scholar] [CrossRef]
- Ferraz, Ricardo. 2023. The Portuguese budgetary costs with First World War: A comparative perspective. European Review of Economic History 27: 278–301. [Google Scholar] [CrossRef]
- Ferraz, Ricardo. Forthcoming. Old question, new context: Is military spending a source of growth? Evidence from NATO countries. Unpublished paper.
- Ferraz, Ricardo, Joaquim Miranda Sarmento, and António Portugal Duarte. 2024. The Sustainability of Portuguese Fiscal Policy in Democracy, 1974–2020. Journal of Quantitative Economics 22: 749–72. [Google Scholar] [CrossRef]
- Fontanel, Jacques. 2022. Is Military Expenditure a Reliable Indicator of Victory in an Interstat War? Hal-03666719. Available online: https://shs.hal.science/hal-03616428/ (accessed on 20 December 2024).
- Governo [Government of Portugal]. 2025a. Apresentação do Programa do Governo—Discurso do Primeiro Ministro. Available online: https://www.portugal.gov.pt/pt/gc25/comunicacao/noticia?i=resolver-os-problemas-dos-portugueses-e-transformar-portugal (accessed on 23 July 2025).
- Governo [Government of Portugal]. 2025b. Portugal vai Investir 1300 milhões em Defesa este ano. Available online: https://www.portugal.gov.pt/pt/gc25/comunicacao/noticia?i=portugal-vai-investir-1-300-milhoes-em-defesa-este-ano (accessed on 22 July 2025).
- Hartley, Keith. 2010. The Case for Defence. Defence and Peace Economics 21: 409–26. [Google Scholar] [CrossRef]
- Ilzetzki, Ethan. 2025. Guns and Growth: The Economic Consequences of Defence Buildups. Kiel Report, 2. Kiel: Kiel Institute for the World Economy (IfW Kiel). [Google Scholar]
- Kim, Wukki, and Todd Sandler. 2020. NATO at 70: Pledges, Free Riding, and Benefit-Burden Concordance. Defence and Peace Economics 31: 400–13. [Google Scholar] [CrossRef]
- Kollias, Christos, Nikolaos Mylonis, and Suzanna-Maria Paleologou. 2007. A panel data analysis of the nexus between defence spending and growth in the European Union. Defence and Peace Economics 18: 75–85. [Google Scholar] [CrossRef]
- Marek, Grudniewski Tomasz, Dariusz Brążkiewicz, Marzena Kacprzak, Zbigniew Ciekanowski, and Leszek Elak. 2025. Efficiency of Defence Expenditure Management in the Context of Escalating Security Threats. European Research Studies Journal XXVIII: 665–75. [Google Scholar]
- Mata, Eugénia. 1993. As Finanças Públicas Portuguesas da Regeneração à Primeira Guerra Mundial. Lisboa: Banco de Portugal. [Google Scholar]
- Murdoch, James, and Todd Sandler. 1984. Complementarity, free riding, and the military expenditure of NATO allies. Journal of Public Economics 25: 83–101. [Google Scholar] [CrossRef]
- NATO. 2014. Wales Summit Declaration. Available online: https://www.nato.int/cps/cn/natohq/official_texts_112964.htm (accessed on 17 January 2025).
- NATO. 2024a. Funding NATO. Available online: https://www.nato.int/cps/uk/natohq/topics_67655.htm?selectedLocale=en (accessed on 20 January 2025).
- NATO. 2024b. NATO Member Countries. Available online: https://www.nato.int/cps/ie/natohq/topics_52044.htm (accessed on 12 January 2025).
- NATO. 2025a. Defence Expenditure of NATO countries (2014–2025). NATO—Public Diplomacy Division—Press & Media. Press Release, August 28. [Google Scholar]
- NATO. 2025b. NATO Concludes Historic Summit in The Hague. Available online: https://www.nato.int/cps/en/natohq/news_236516.htm (accessed on 22 July 2025).
- NATO. 2025c. The Hague Summit Declaration. Available online: https://www.nato.int/cps/en/natohq/official_texts_236705.htm (accessed on 3 September 2025).
- Newsweek. 2025. How NATO Is Using Creative Accouting to Meet Trump’s Spending Demands. Available online: https://www.newsweek.com/how-nato-using-creative-accounting-meet-trumps-spending-demands-2110969 (accessed on 4 September 2025).
- Nunes, Ana Bela, and Nuno Valério. 1983. A Lei de Reconstituição Económica e a sua execução: Um exemplo dos projectos e realizações da política económica do Estado Novo. Estudos de Economia 3: 1–27. [Google Scholar]
- Our World in Data. 2024. Military Expenditure (% of GDP). Available online: https://ourworldindata.org/grapher/military-spending-as-a-share-of-gdp-gmsd (accessed on 11 January 2025).
- Rauch, Bernhard, Max Göttsche, and Stephan Langenegger. 2014. Detecting Problems in Military Expenditure Data Using Digital Analysis. Defence and Peace Economics 25: 97–111. [Google Scholar] [CrossRef]
- Samuels, Albert. 2024. The Last Democratic Election. Social Sciences 13: 588. [Google Scholar] [CrossRef]
- SIPRI. 2023. SIPRI Military Expenditure Database. Stockholm International Peace Research Institute. Available online: https://www.sipri.org/databases/milex (accessed on 12 January 2025).
- Smith, Ronald. 1980. Military expenditure and investment in OECD countries, 1954–1973. Journal of Comparative Economics 4: 19–32. [Google Scholar] [CrossRef]
- Torres, José. 2020. The production of national defence and the macroeconomy. PLoS ONE 15: e0240299. [Google Scholar] [CrossRef] [PubMed]
- Utrero-González, Natalia, Jana Hromcova, and Francisco Callado-Munoz. 2017. Defence Spending, Institutional Environment and Economic Growth: Case of NATO. Defence and Peace Economics 30: 525–48. [Google Scholar] [CrossRef]
- Valério, Nuno. 1994. As Finanças Públicas Portuguesas Entre as Duas Guerras Mundiais. Lisboa: Edições Cosmos. [Google Scholar]
- Valério, Nuno. 2008. Avaliação do produto interno bruto de Portugal. Centre of Research into Economic and Social History (GHES), Study No. 34. Lisbon: Lisbon School of Economics & Management (ISEG). [Google Scholar]
- Violakis, Petros. 2023. Putting the Common Security and Defence Policy in the Eastern Mediterranean under Scrutiny: Türkiye’s Conflicting Role. Social Sciences 12: 481. [Google Scholar] [CrossRef]
- Wijeweera, Albert, and Matthew Webb. 2012. Using the Feder-Ram and military keynesian models to examine the link between defence spending and economic growth in Srilanka. Defence and Peace Economics 23: 303–11. [Google Scholar] [CrossRef]
- World Bank. 2025. World Bank Open Data. Available online: https://data.worldbank.org/ (accessed on 11 January 2025).
- Worlddometer. 2025. Largest Countries in the World (by Area). Available online: https://www.worldometers.info/geography/largest-countries-in-the-world/ (accessed on 4 September 2025).
- Yildirim, Jülide, and Nadir Ocal. 2016. Military expenditure, economic growth and spatial spillovers. Defence and Peace Economics 27: 87–104. [Google Scholar] [CrossRef]
- Yildirim, Jülide, Selami Sezgin, and Nadir Ocal. 2005. Military expenditure and economic growth in middle eastern countries: A dynamic panel data analysis. Defence and Peace Economics 16: 283–95. [Google Scholar] [CrossRef]
Disclaimer/Publisher’s Note: The statements, opinions and data contained in all publications are solely those of the individual author(s) and contributor(s) and not of MDPI and/or the editor(s). MDPI and/or the editor(s) disclaim responsibility for any injury to people or property resulting from any ideas, methods, instructions or products referred to in the content. |
© 2025 by the author. Licensee MDPI, Basel, Switzerland. This article is an open access article distributed under the terms and conditions of the Creative Commons Attribution (CC BY) license (https://creativecommons.org/licenses/by/4.0/).