Article

Adaptation and Validation of a Child-Reported Measure of Parental School Involvement

University Research Center in Psychology (CUIP), University of Algarve, 8005-139 Faro, Portugal
*
Author to whom correspondence should be addressed.
Soc. Sci. 2025, 14(8), 475; https://doi.org/10.3390/socsci14080475
Submission received: 2 June 2025 / Revised: 20 July 2025 / Accepted: 24 July 2025 / Published: 30 July 2025
(This article belongs to the Section Childhood and Youth Studies)

Abstract

Parental school involvement (PSI) is an important contributor to children’s academic and overall positive development. Such activities as discussing schoolwork and tracking progress can boost children’s motivation and achievements. Although the multifaceted nature of PSI is widely recognized, there are limited reliable measures that comprehensively capture all its dimensions, particularly for children and adolescents. This study aims to develop a measure for assessing children and adolescents’ perceptions of parental involvement based on parent- and teacher-validated self-report measures—the Parental School Involvement Questionnaire—Children’s version (PSIQ-CV). A total of 537 children and adolescents (MAge = 9.64, SDAge = 2.43), mainly female (52.8%), from the south of Portugal participated in this study. An exploratory factor analysis (EFA, n = 150) and a confirmatory factor analysis (CFA, n = 387) were carried out. The EFA indicated a three-factor solution (i.e., support in learning activities, parent–school communication, and supervision), supported by the CFA, with good quality-of-fit indices (χ2 = 225; df = 101; χ2/df = 2.23; CFI = 0.91; TLI = 0.89; RMSEA = 0.060 [CI: 0.049–0.070]). Our data confirmed that the PSIQ-CV has robust psychometric properties, with acceptable reliability and validity. The PSIQ-CV can be considered a relevant and valid tool for measuring the perception of parental school involvement among children and adolescents, in line with Epstein’s theoretical model, and useful for both researchers and practitioners.

1. Introduction

Parental school involvement (PSI) is a multidimensional construct that can play an important role in children’s academic adjustment and overall positive development (Barger et al. 2019; Boonk et al. 2018; Epstein et al. 2018; Mocho et al. 2025). PSI can be defined as parents’ efforts to contribute to their children’s academic and social/emotional development (Erdem and Kaya 2020) and involves a set of practices that parents do with their children to promote their motivation and academic success, such as discussing school with their children and monitoring their progress (Otani 2020). In the extant literature, the conceptual complexity of the PSI construct is widely acknowledged, alongside a notable diversity of definitions that hinder the precise delineation and operationalization of its dimensions (Addi-Raccah et al. 2023; Barger et al. 2019; Boonk et al. 2018; Choi et al. 2015). Various scholars have proposed typologies to capture the breadth of PSI, including Epstein (1987, p. 19), Grolnick and Slowiaczek (1994), Jeynes (2018), Li et al. (2024), Hoover-Dempsey and Sandler (1997), and Pomerantz et al. (2007). Furthermore, PSI patterns are context-sensitive and can vary significantly due to cultural influences, thereby complicating the generalization of their definition and operationalization (Liu and Zhang 2023). Parents’ involvement in children’s learning can have an important influence on behavior, school attendance, achievement, and future success (Goodall 2018; Hill et al. 2004; Mocho et al. 2025).
Generally, PSI can be conceptualized in three broad dimensions: (a) home/school communication, which involves the communication between family members and stakeholders in the school context (e.g., meetings, telephone contacts, written messages, etc.); (b) parental involvement in the learning context at home, which includes various activities conducted by family members that encourage learning, manage routines, develop activities at home, cultural visits in the community, and dialogues with children about personal school experiences; and (c) parental involvement in activities at school, which refers to conventional activities such as meetings, volunteering, participation in workshops or events (e.g., Mata and Pedro 2021). Joyce Epstein (2010) defined a framework with six key types of PSI, developed through extensive research conducted across elementary, middle, and high schools, and in collaboration with educators and families. Her framework was composed of the following: (1) Parenting, involving the families’ help to establish a supportive home environment for their children as students; (2) Communicating, related to effective communication that connects schools, families, students and respective communities; (3) Volunteering, which involves the recruitment and coordination of parental support; (4) Learning at Home, providing information and ideas to the families on how they can help their children with homework and other curriculum-related activities, decisions, and planning; (5) Decision Making, related to the inclusion of parents in school decisions, the promotion of a partnership with parents to share their views and actions regarding their common goals; and (6) Collaborating with Community, comprising the identification and integration of resources and services from the community to strengthen school programs, family practices, and student learning and development. According to Epstein (2010), each component of the external structure of the overlapping spheres can both act and interact with others, and these actions impact students’ learning and their development. In this study, Epstein’s typology (Epstein 1995, 2010) was adopted as the guiding framework. The dimensions measured by the PSIQ-CV instrument—namely, support in learning activities, parent–school communication, and supervision—align with four of Epstein’s six categories: type 1 “Parenting,” type 2 “Communicating,” type 3 “Volunteering,” and type 4 “Learning at home.” While Epstein (2010) delineated six distinct types, parental activities often interconnect, underscoring the inherently multifaceted nature of parental involvement. The proposed dimensions were operationalized through specific items within the PSIQ-CV instrument, which capture parents’ actions and perceptions related to each of these categories.
Research has highlighted the importance of involving all stakeholders in the educational process to increase overall educational outcomes and reduce the gap between children from different backgrounds (Goodall 2018). However, not everyone who has a role to play in children’s schooling is aware that parental support or involvement affects their success in many ways (Salac and Florida 2022).
Beyond parental perceptions, a comprehensive assessment of PSI should also incorporate the perspectives of teachers and children. This approach enables a more complete and holistic understanding of the phenomenon, leading to more accurate estimates of parental behaviors and their participation in children’s school life (Berkowitz et al. 2021). Moreover, multi-informant assessment is consistently supported in the literature for its relevance, especially for its capacity to analyze informant discrepancies. These discrepancies can be modeled as they may signify behavioral variability in children across situations or contexts, diverse evaluator perspectives (i.e., parents, children, and teachers), differing attributions for behavior, and informant characteristics (Martel et al. 2017). Ultimately, multi-informant assessments are crucial for obtaining unique and valid insights, enabling a comprehensive and contextualized understanding (De Los Reyes et al. 2015).
Although parental involvement is widely acknowledged as a multidimensional construct, few existing measures adequately cover its various dimensions with robust reliability—especially for populations aged 6–15 years. Overall, there is a significantly greater number of PSI instruments validated for parents than for professionals, teachers, or children (Mocho et al. 2025). Consistent with the increasing focus on children’s perspectives, this study highlights their incremental value and unique position to observe certain manifestations of their concerns (De Los Reyes et al. 2015).
Therefore, the aim of the present study was to develop a psychometrically validated instrument to assess perceived parental involvement from the perspective of children and adolescents aged 6–15 years, that is, of those attending primary and elementary school, based on parent- and teacher-validated self-report measures.

PSI Measures

A recent systematic review aimed at identifying and characterizing PSI instruments found fourteen measures available for assessing children’s and adolescents’ perceptions of parental school involvement (Mocho et al. 2025). Among them are the Family Involvement Questionnaire—Elementary (FIQ-E; Manz et al. 2004; Fantuzzo et al. 2000), the Parents’ Report of Parental Involvement (PRPI; Hoover-Dempsey and Sandler 1997), the Parents’ Involvement in Children’s Learning (PICL; Cheung and Pomerantz 2011; Oswald et al. 2018), and, more recently, the Summer Family Involvement Questionnaire (Nathans and Guha 2025).
These instruments vary considerably in length—from extensive scales with 67 items (e.g., PRPI) to more concise formats with only 10 items (e.g., PICL; Students’ Parental Involvement Questionnaire, Olatoye and Ogunkola 2008). Their structural complexity also differs, ranging from multifactorial models (e.g., FIQ, Fantuzzo et al. 2000; Student-Rated Parental School Involvement Questionnaire, Goulet et al. 2023) to unifactorial structures (e.g., PICL, Cheung and Pomerantz 2011). While most instruments report acceptable to excellent reliability coefficients (ranging from α = 0.65 to 0.96), only a minority include more comprehensive psychometric evaluations, such as exploratory or confirmatory factor analyses or evidence of construct validity.
Despite the availability of various psychometrically tested instruments, gaps remain in their scope and applicability. Yampolskaya and Payne (2025) highlight the limited number of PSI measures, emphasizing the need to evaluate their impact on children’s educational outcomes and to evaluate their factors. To quantify the multidimensionality of the construct and understand the factor structure of its items, it is crucial to ensure score interpretability and meaningful comparisons. While research on PSI has been extensive, rigorously validated measures assessing different dimensions of involvement, particularly those that focus on children’s perceptions, remain scarce (Goulet et al. 2023). Consequently, researchers often need to develop new measurement tools to address unexplored phenomena or adapt them to specific contexts and populations (El-Den et al. 2020).
Attending to this gap, this study intended to develop an instrument—the Parental Involvement in School Questionnaire—Children’s version (PSIQ-CV)—based on previously adapted measures for teachers (Parental Involvement in School Questionnaire—Teachers’ version (PSIQ-TV; Pereira et al. 2003)) and parents (Parental Involvement in School Questionnaire—Parents’ version (PSIQ-PV; Pereira et al. 2008)). We intended to assess the psychometric properties of an instrument designed to measure parental school involvement from the children’s perspective. Specifically, we intended to examine (1) the internal structure of the PSIQ-CV using exploratory and confirmatory factor analyses, (2) its internal consistency and discriminant validity, and (3) its convergent validity with related constructs, such as children’s quality of life and well-being.

2. Materials and Methods

2.1. Study Design

This study employed a cross-sectional design to conduct the psychometric validation of the Parental School Involvement Questionnaire—Children’s version (PSIQ-CV) among children and adolescents. This approach allowed for the assessment of the scale’s psychometric properties, including its validity and reliability, at a single point in time.

2.2. Participants

A total of 595 participants (MAge = 9.64; SDAge = 2.43; RangeAge = 6–15 years), mainly females (f = 314; 52.8%), were authorized and agreed to voluntarily participate in the study.

2.3. Instruments

2.3.1. Sociodemographic Questionnaire

A sociodemographic questionnaire was developed to gather information regarding children and adolescents’ characteristics (e.g., sex, age, school year).

2.3.2. Parental School Involvement Questionnaire—Children’s Version (PSIQ-CV)

The Parental School Involvement Questionnaire—Children’s version (PSIQ-CV) was developed to assess children and adolescents’ perceptions of their parents’ involvement. An opening question (i.e., “Who helps you most with things at school?”) is presented with the possibility to mark one of three options (i.e., mum, dad, or someone else). The initial version was composed of 24 items that assessed four dimensions of PSI: (1) activities at school and volunteering (6 items, e.g., “Give ideas for organizing activities at school”); (2) learning activities at home (8 items, e.g., “Try to find out what I need to learn, so you can help me at home”); (3) family–school communication (6 items, e.g., “When there’s a problem with me at school, speaks to my teacher”); and (4) involvement in school activities and participation in parents’ meetings (4 items, e.g., “Goes to meetings that my teacher organizes”). The answers were made according to a four-point Likert-type scale (from 1 = “not true at all” to 4 = “very true”). The administration of this instrument typically requires ca. fifteen minutes. The reliability analysis is reported in the results of this study.

2.3.3. KIDSCREEN-10

KIDSCREEN-10 (Gaspar and Matos 2008; Gaspar et al. 2009) is a unidimensional short-version instrument that assesses the perception of children’s well-being and quality of life (e.g., “Did you feel good and fit?”; α = 0.63) and is composed of 10 items, answered on a 5-point Likert scale (from 1 = “not at all” to 5 = “totally”). Higher values indicate a feeling of happiness, perceived adequacy, and satisfaction, while lower values reflect feelings of unhappiness, dissatisfaction, and inadequacy with respect to the various contexts of children’s lives.
KIDSCREEN-10 was included as a measure of convergent validity because, while it assesses child quality of life and well-being, PSI (measured by the PSIQ-CV) is theoretically linked to a child’s overall well-being. Active parental participation can create a supportive environment, enhance academic achievement, and contribute to a positive school climate (Barger et al. 2019; Berkowitz et al. 2021; Thomas et al. 2020). Therefore, we expected greater parental involvement to correlate with higher well-being, demonstrating the PSIQ-CV’s convergent validity.

2.4. Procedure

Authorization to adapt and validate a children’s version of the PSIQ-PV was previously obtained from the first authors of the scales. The original versions of the instrument were analyzed (i.e., PSIQ-TV, Pereira et al. 2003; and PSIQ-PV, Pereira et al. 2008), and 24 items were selected and adapted (language and context). This step was carried out by three researchers who are experts in the field through a consensus process.

Ethics Approval and Consent Process

Before initiating data collection, approval was requested and obtained from the Data Protection Officer and the Ethics Committee of the University of the Algarve, Portugal (CEUAlg Pnº 1/2024). Following school principals’ authorization, information letters detailing the study’s aims, procedures, and assurance of confidentiality were distributed to parents/legal guardians. Only children who provided their assent and whose parents/legal guardians provided written informed consent participated in the study.

2.5. Pilot Study

The 24 original items of the PSIQ-CV were initially selected based on the theoretical and empirical relevance of two pre-existing instruments (PSIQ-TV and PSIQ-PV). The adaptation aimed to ensure the comprehension and relevance of the items for the child and adolescent population. To ensure its suitability, a pilot study was conducted prior to the main data collection to refine the adapted items and evaluate the comprehensibility of the items and the administration protocol. Each of the items was tested with five children (aged between 6 and 13) from a school not included in the main study, who gave individual feedback, providing their interpretations and suggestions on how to make them clearer. They were questioned about their understanding of each of the items, possible difficulties in interpretation, and exhaustion from completing the instrument. This was completed to make sure the younger group would be able to properly understand the meaning of the items (i.e., that the wording of the items was adequate to the comprehension and reading level of the youths). None of them pointed out any difficulties in understanding the items, nor did they complain about the time it took to complete them. This group of children was not included in the following analysis.
Considering the aim of this study—to adapt an instrument accessible to school-aged children—the chosen method was to have an adult read out the statements one at a time to the groups of children, followed by their response either by pressing a button in the electronic version or circling their answer in the paper form.

2.6. Data Collection

After the pilot study was completed, data were collected.
The sampling of schools was conducted using a convenience sampling approach, based on their accessibility and willingness to participate in the study. Afterward, contacts were made with educational establishments (i.e., with classes between Grades 1 and 9), and children’s participation was also authorized by school principals and parents. Public and private schools in the southern region of Portugal were contacted, with school principals determining the number of classes and school years involved.
Considering the children’s age, two distinct administration procedures were used, tailored to the children’s age and literacy skills: (1) for younger students (between 6 and 9 years), an adult read out the statements one at a time and they responded, collectively in a group setting, in the paper form; (2) for older students (from 10 to 15 years), they answered individually on a digital platform, always with a researcher present to clarify any possible questions. To maximize homogeneity among the participants regarding gender and school years, a snowball sampling strategy was employed in the second phase, and other educational institutions were contacted to participate in the study.
Exclusion criteria for the sample included children outside the established age and schooling range, as well as those who did not provide consent or whose data were incomplete/outliers.
The sample was recruited from the selected public and private schools from seventeen Portuguese municipalities, from regions south of Portugal.

2.7. Data Analysis

Data were analyzed using IBM SPSS Statistics (Version 30) and Jamovi (2.6.26; Love et al. 2022). Initially, outliers were identified and removed using univariate (i.e., z-scores higher than 3 were removed) and multivariate procedures (i.e., the Mahalanobis distance was computed, and scores higher than the critical score were removed). Following this analysis, of the 595 questionnaires administered, 58 were excluded due to outlier identification, resulting in the final sample of 537 participants. The data distribution was analyzed through measures of central tendency and dispersion (mean, standard deviation, skewness, and kurtosis), boxplot visualization to identify ceiling or floor effects, and items’ dispersion (Field 2024).
The internal structure analysis was tested with two factor analyses—exploratory factor analysis (EFA) and confirmatory factor analysis (CFA). For this purpose, the total sample (N = 537) was divided into two groups—one for the EFA (n = 150) and the other for the CFA (n = 387), ensuring the robustness of the data in both analyses (Kline 2023).
EFA is a technique that allows for the description and grouping of intercorrelated variables into latent factors, ensuring that the latent factors obtained are relatively independent of each other (Tabachnick and Fidell 2018). The factorability of the data was determined using the Kaiser–Meyer–Olkin (KMO) index (with 0.70 ≤ KMO < 0.80 indicating a moderate value; Kaiser 1974) and Bartlett’s test of sphericity (p ≤ 0.01). The principal component method and an orthogonal Varimax rotation were applied for factor extraction, considering four criteria in the decision regarding the factorial solution: (1) Kaiser’s criterion (eigenvalues > 1); (2) analysis of the scree plot (retaining factors up to the point of inflection); (3) the Monte Carlo parallel a nalysis method (comparing random eigenvalues with the actual eigenvalues); and (4) the interpretability of the factors (Field 2024). Subsequently, the loadings of the items on each factor (r > 0.40) and communalities (h2 > 0.60) were analyzed.
To empirically test whether the proposed model fit our data, and to test whether the covariance structure implicit in the model reproduced the empirical covariance matrix or closely resembled it (Goretzko et al. 2023), a confirmatory factor analysis (CFA) was conducted. Various goodness-of-fit indices were analyzed, namely the chi-squared test (χ2, the lower scores presenting the best fit), the degrees of freedom (df), the χ2/df ratio (considering less than 5 as acceptable), the Steiger–Lind root mean square error of approximation (RMSEA) and its 90% confidence interval (preferably scores lower than 0.05), the comparative fit index (CFI), and the Tucker–Lewis index (TLI) were used to compare the tested model with a null model (good fit assumed when score indices > 0.90) (Kline 2023).
The internal validity (i.e., item–total correlations) and reliability analysis (estimated with Cronbach’s alpha (α > 0.70 considered adequate) and McDonald’s omega (ϖ > 0.70 considered acceptable)) were calculated. The convergent and divergent validities were also computed using Pearson correlations to assess them (scores between 0.30 and 0.59 were considered moderate, between 0.60 and 0.80—large; negative values were interpreted similarly in terms of strength, but in the opposite direction), with an α < 5% (Field 2024; Tabachnick and Fidell 2018). The average variance extracted (AVE) was calculated to corroborate the convergent validity and the discriminant validity of the instrument, and scores above 0.50 were considered good (Kline 2023).

3. Results

3.1. Descriptive Analysis

The descriptive analysis of the initial 24 items (Table 1) showed mean scores between 2.56 and 3.73 (RangeSD = 0.51–1.08). The analysis of the distribution’s normality showed that, although some items presented skewness and kurtosis values close to or slightly above 1, none exceeded the commonly accepted thresholds (2 for skewness and 7 for kurtosis), indicating no serious deviations from normality. In terms of response dispersion, all items covered the full scale range (1 to 4), suggesting an adequate distribution of responses and the absence of floor or ceiling effects.

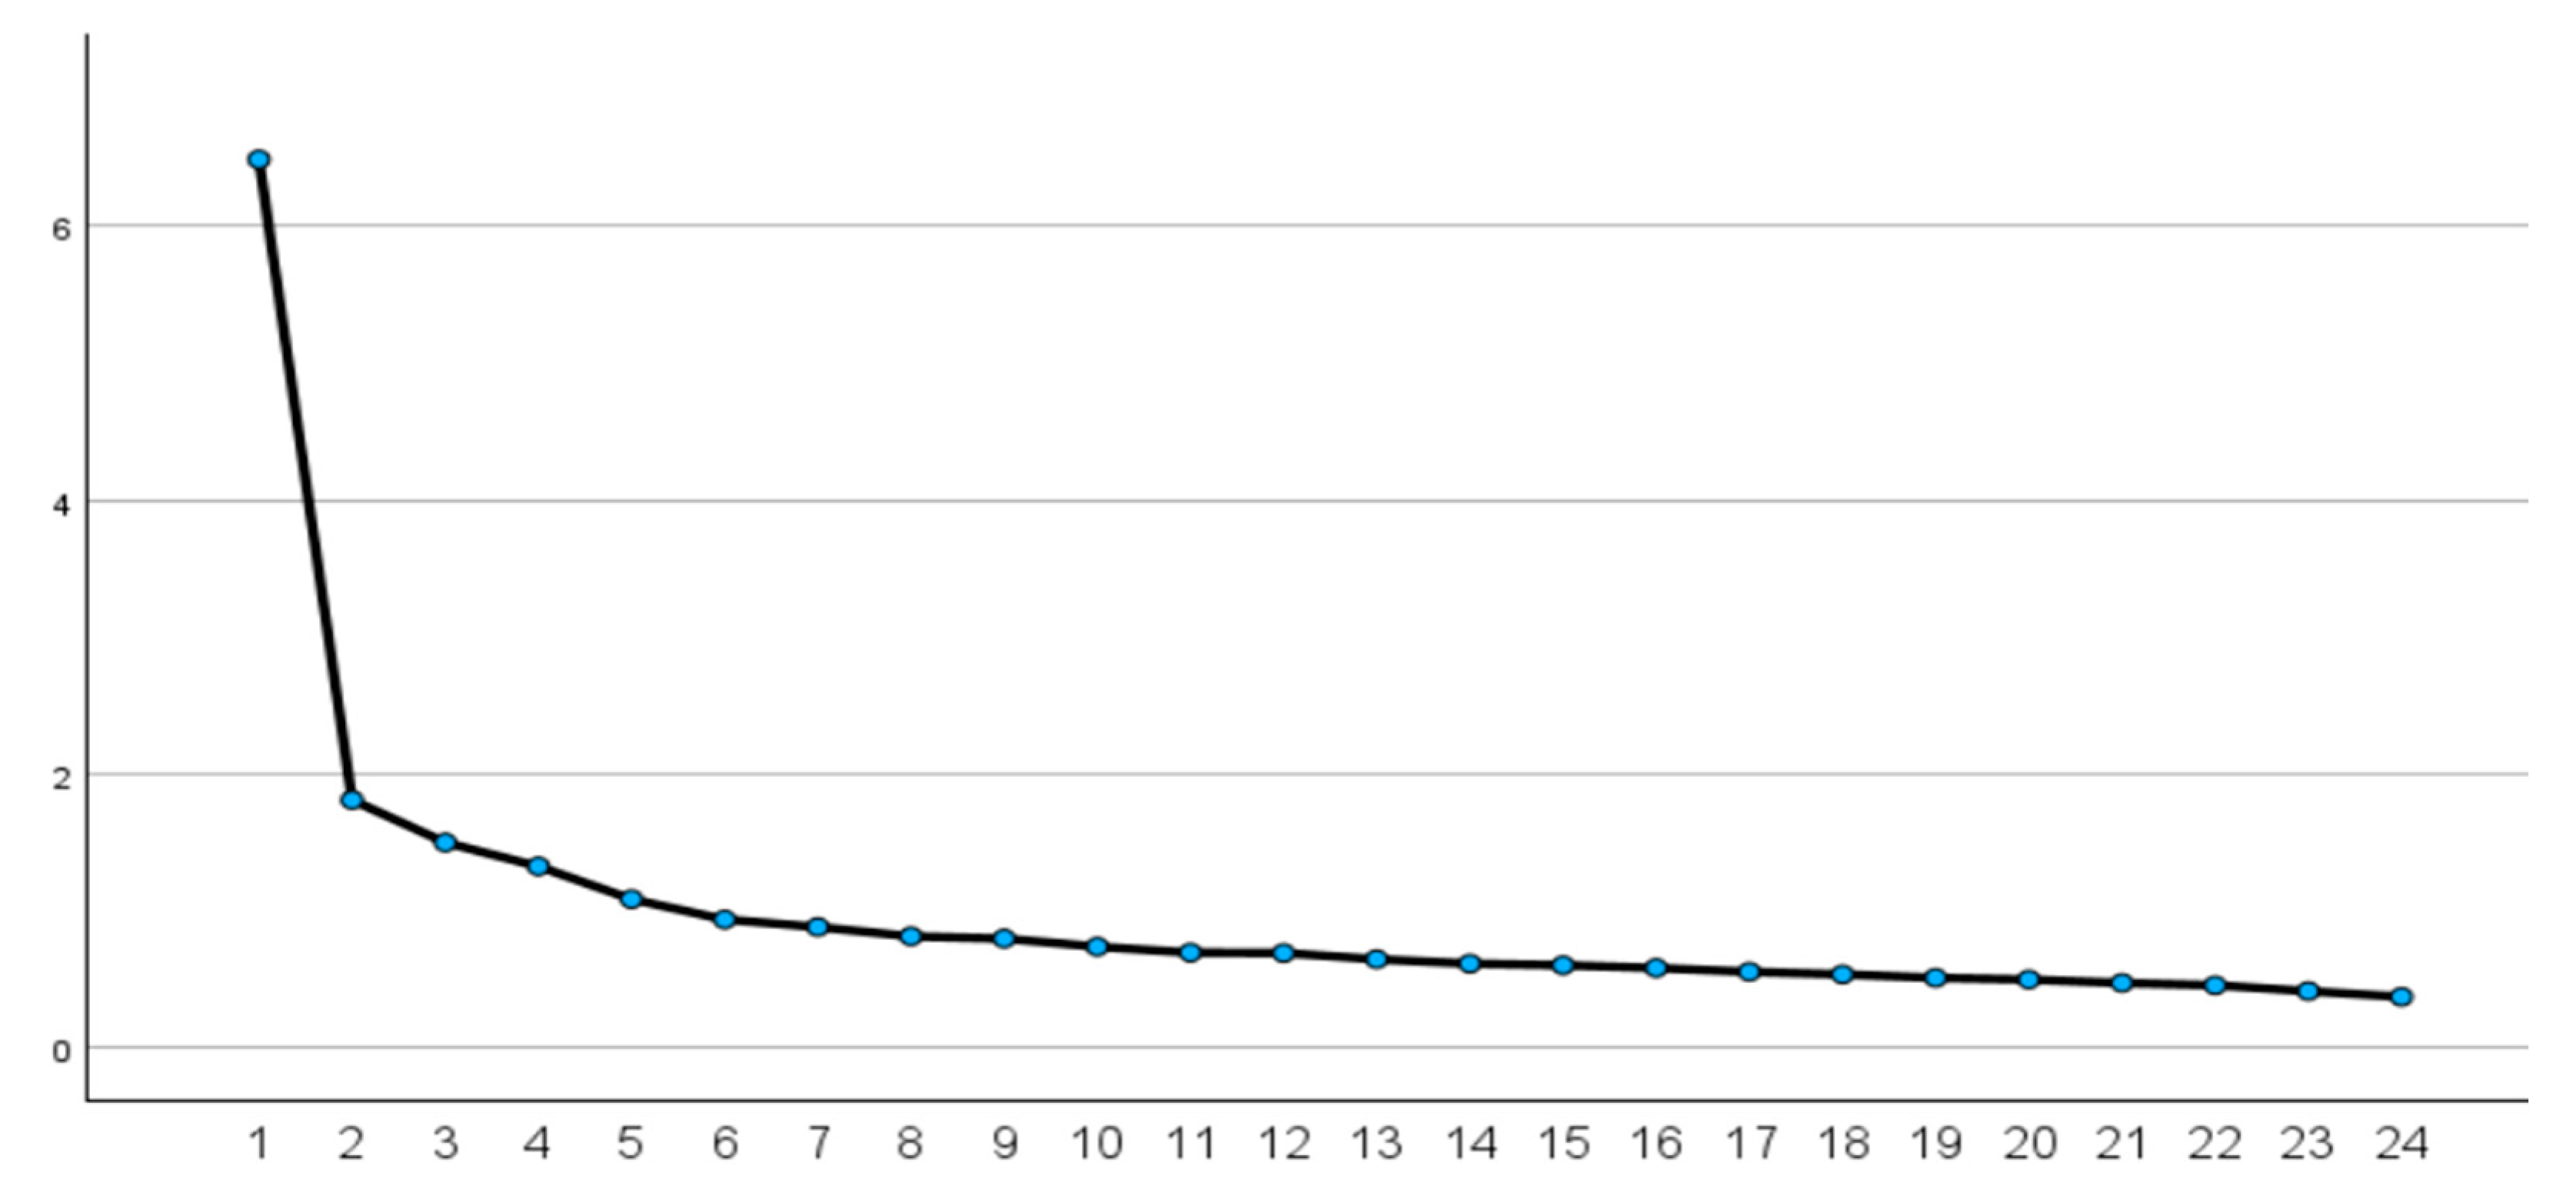
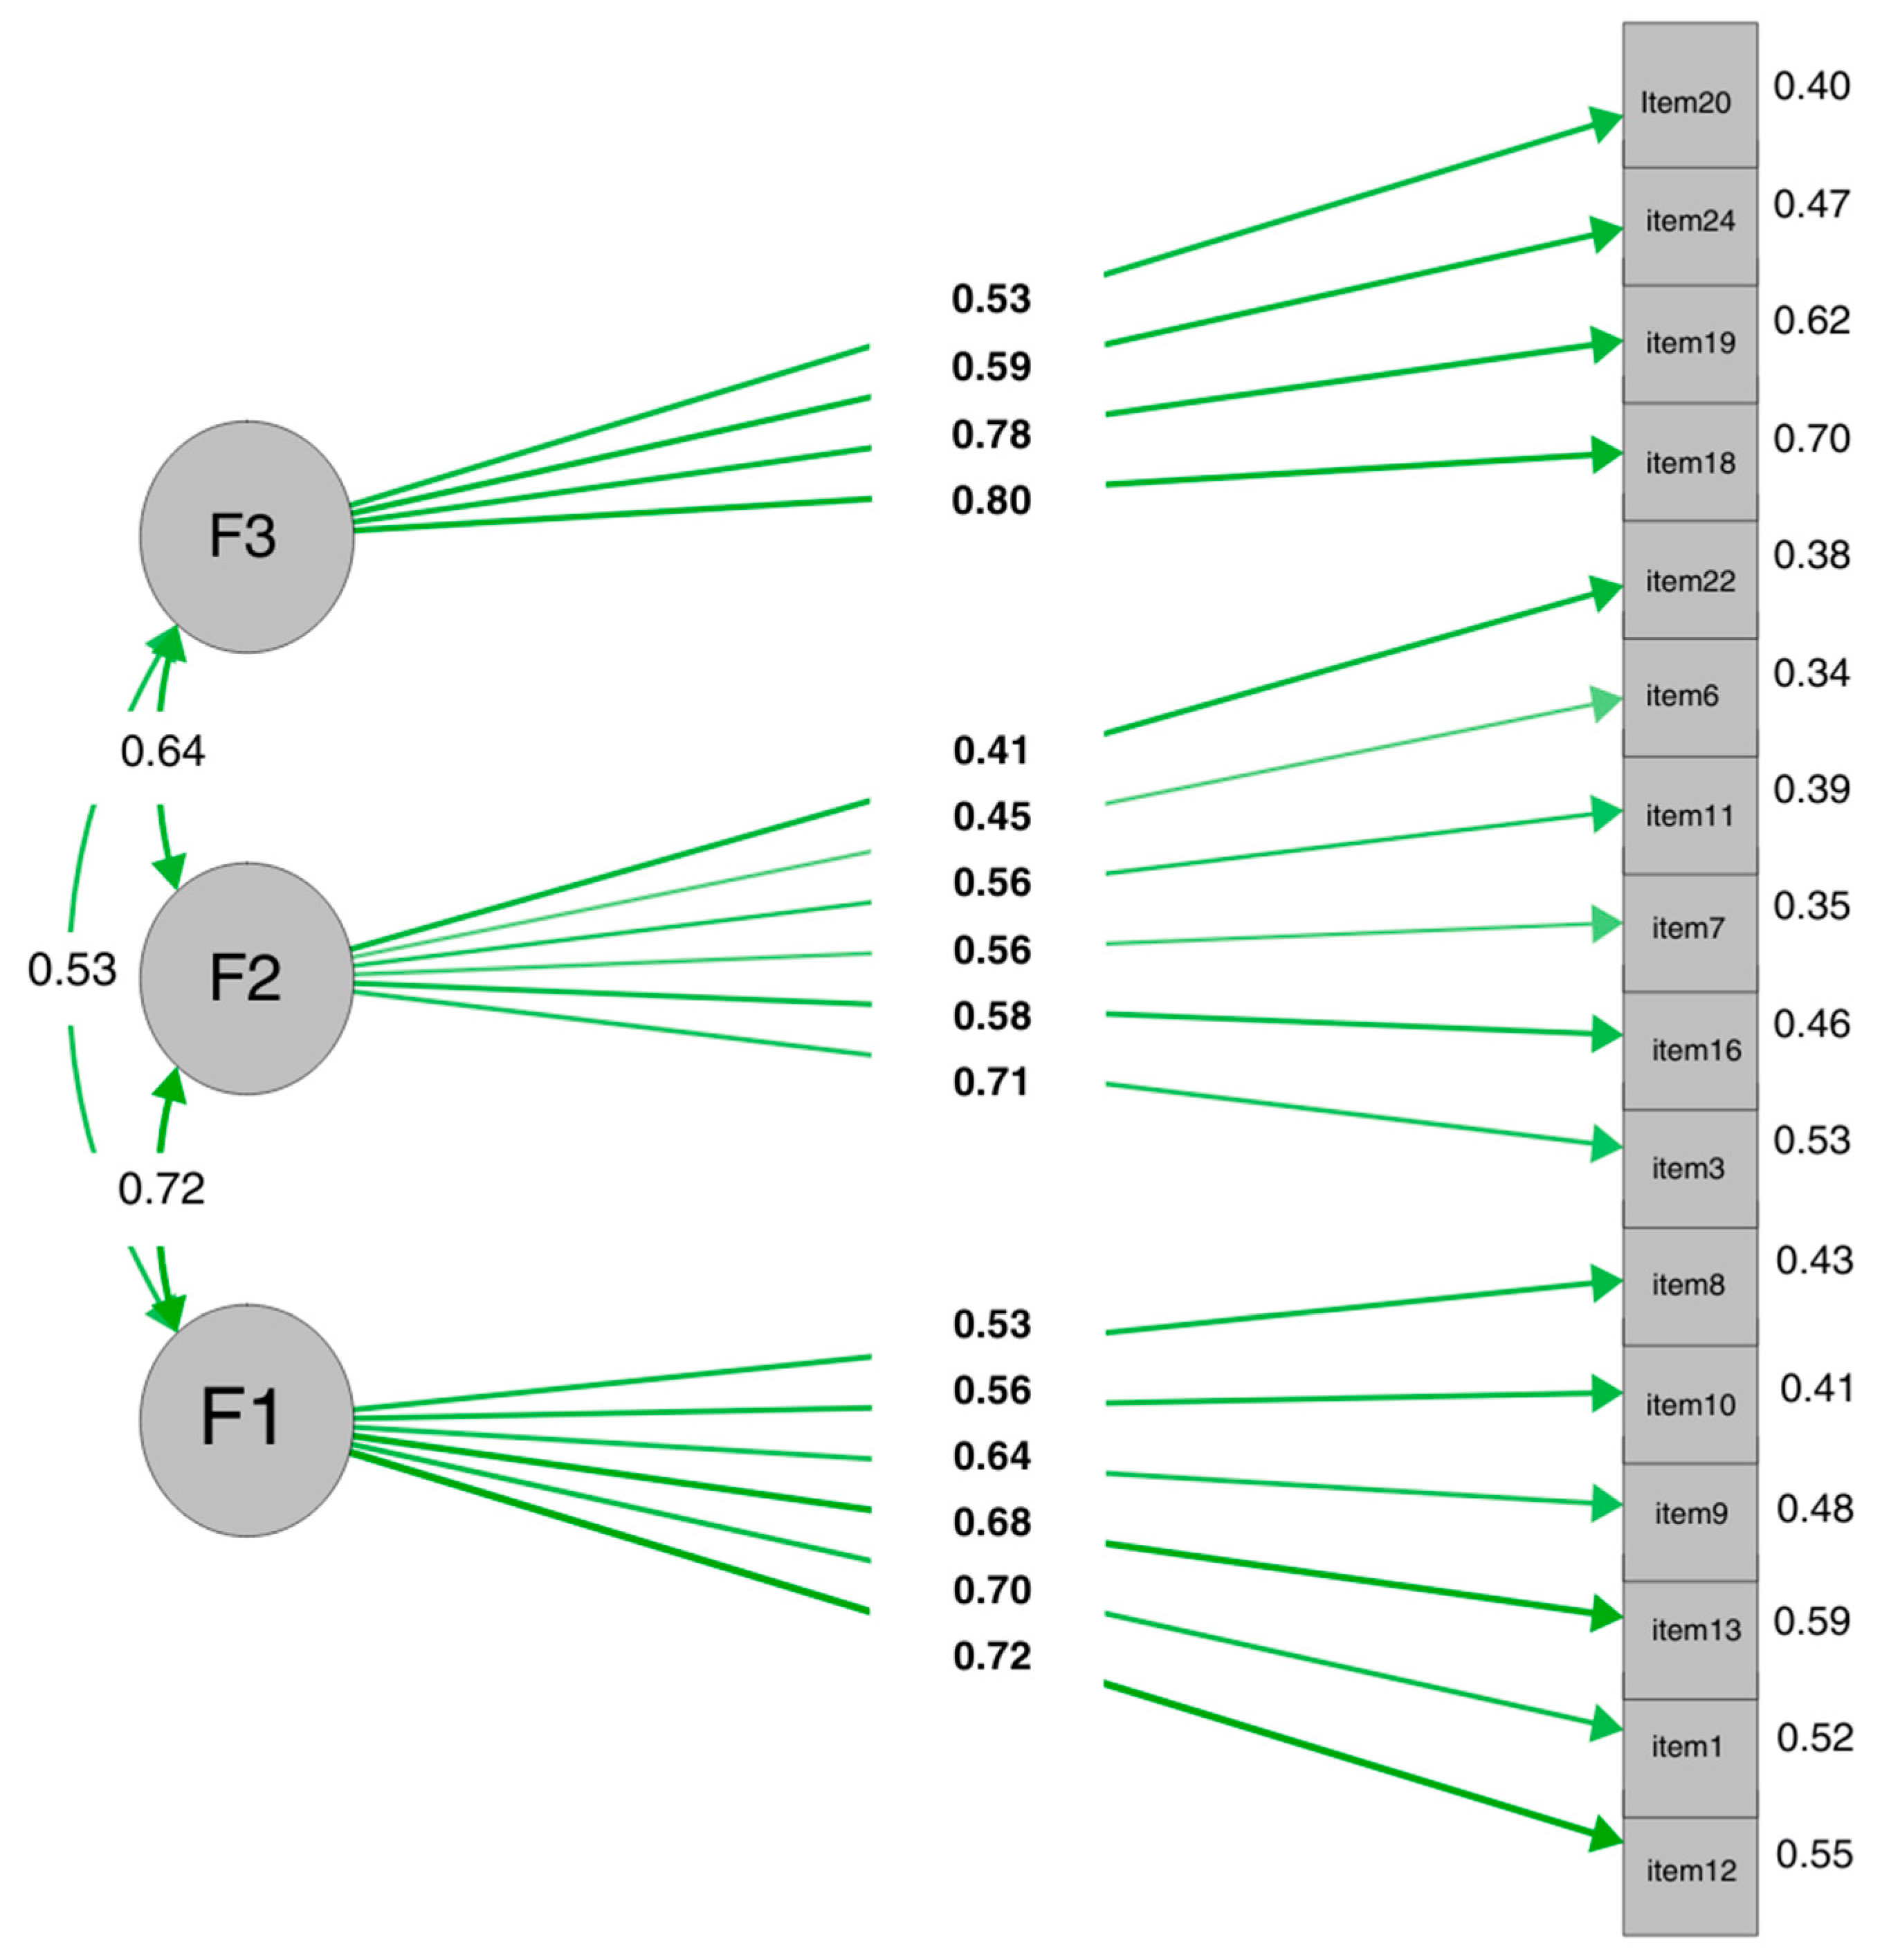
3.2. Internal Structure Analysis

The factorability analysis revealed adequate values (KMO = 0.82), and Bartlett’s test of sphericity indicated that in the population from which the sample was taken, the correlations between the 24 items were non-zero (χ2 = 847.25, df = 171, p < 0.001), supporting the EFA.
To achieve a factorial solution, several methods were considered (Boateng et al. 2018; Braeken and Van Assen 2017). The Kaiser criterion, the Monte Carlo parallel analysis, and the scree plot analysis (Figure 1) supported a four-factor solution.
The initial EFA suggested a solution with more than three factors. However, the item interpretability of such solutions failed to validate the factorial distinction, given that some factors converged on a single conceptual dimension or lacked clear theoretical meaning. The decision to retain a three-factor solution was then based on the theoretical interpretability and conceptual clarity of the items loading onto each factor, demonstrating a more parsimonious structure. In comparison, solutions with a greater number of factors exhibited less cohesion and increased ambiguity in item assignment; the additional factor, in particular, displayed diffuse factor loadings and was difficult to interpret substantively, with items that did not group cohesively or theoretically meaningfully. Thus, a more parsimonious and robustly interpretable solution was opted for.
Theoretically aligning our study’s three factors with Epstein’s typology reveals specific connections. Factor 1 (support in learning activities) primarily aligns with Epstein’s type 3 (Volunteering) through five items, which focus on active school participation. One additional item from this factor also connects to type 4 (Learning at Home), highlighting home-based academic support. Factor 2 (parent–school communication) shows a strong link to Epstein’s type 2 (Communicating), encompassing four items that emphasize bidirectional communication. One item from this factor also corresponds to type 3 (Volunteering), and another aligns with type 1 (Parenting), indicating broader parental practices. Finally, factor 3 (supervision) is substantially linked to Epstein’s type 4 (Learning at Home) across all its items, underscoring its connection to the home learning environment. Two of these items additionally relate to type 1 (Parenting), reinforcing supervision as a core parenting practice.
An EFA with three factors was run, and the solution supported this decision.
A principal component analysis (Table 2) revealed that factor 1 is composed of 6 items (λ2 = 29.49%), factor 2 of 6 items (λ2 = 9.23%), and factor 3 of 4 items (λ2 = 7.08%), and this factorial solution explained 45.78% of the total variance (Table 2). In this analysis, constraints were identified in different items (i.e., item 21 loading was below 0.40 in all the factors; items 2, 14, 15, 23, and 5 had low factor loadings; item 17 had cross-loadings), resulting in their removal and a final solution with 16 items.
The application of quantitative criteria (factor loadings and communalities) alongside qualitative considerations (theoretical relevance) for item retention and elimination process extends beyond rigid statistical thresholds, aligning with the common methodological practice in the exploratory phases of psychometric instrument development.
The analysis of the rotated factor loading matrix (Table 2) revealed that in the first factor, the item loadings ranged between 0.72 and 0.46; in the second factor, between 0.71 and 0.41; and in the third factor, between 0.80 and 0.53. The communalities ranged between 0.70 and 0.27. The interpretability of the 3-factor solution with the 16 items and according to Epstein’s model (Epstein 1987, 1991) supports the first factor as the “support in learning activities,” the second factor as the “parent–school communication,” and the third factor as “supervision.”
Given the factor structure of the original scale of the two versions developed by the authors (i.e., teachers: 2 factors; parents: 4 factors), and the 3-factor solution of the EFA, a CFA was carried out to test all the previous models (Table 3). A 1-factor model with the 16 items was also tested.
The 4-factor model did not reveal good fit indices, with a poor/sufferable fit (χ2 = 310; df = 98; χ2/df = 3.16; CFI = 0.85; TLI = 0.82; RMSEA = 0.075 [CI: 0.065–0.084]). The 3-factor solution showed good quality-of-fit indices (χ2 = 225; df = 101; χ2/df = 2.23; CFI = 0.91; TLI = 0.89; RMSEA = 0.060 [CI: 0.049–0.070]). The 2-factor model showed poor/sufferable quality-of-fit indices (χ2 = 433; df = 103; χ2/df = 4.20; CFI = 0.77; TLI = 0.73; RMSEA = 0.091 [CI: 0.082–0.100]). Finally, the 1-factor solution did not support this assumption, and a poor fit was obtained (χ2 = 452; df = 102; χ2/df = 4.35; CFI = 0.75; TLI = 0.72; RMSEA = 0.093 [CI: 0.084–0.10]). Considering the results (Table 3), the 3-factor model was the one with the best fit.

3.3. Reliability and Discriminant Validity

To determine the internal consistency of the factors obtained, Cronbach’s alpha and McDonald’s omega reliability coefficients were computed (Table 4). The results showed adequate reliability scores between 0.66 and 0.78 (α and ω) for the factors. These results prove the instrument’s high levels of internal consistency, estimating good reliability and accuracy of the scale.
The analysis of the item–total correlations (ITC) supports the validity of the 16 items, distributed over three factors (RangeF1_ITC = 0.64–0.48, RangeF2_ITC = 0.45–0.27, RangeF3_ITC = 0.50–0.46), and all scores were above the recommended. Item 6 had a reduced correlation value, but still contributed to the factor, so it was decided not to remove it. All the analyzed items contributed to the final reliability scores (Table 4).
The factor covariance analysis among the three factors (Table 5) showed estimated correlations of 0.77 between factors 1 and 2 (SE = 0.045; Z = 17.2; p < 0.001; λ = 0.77), 0.66 between factors 1 and 3 (SE = 0.052; Z = 12.7; p < 0.001; λ = 0.66), and 0.69 between factors 2 and 3 (SE = 0.055; Z = 12.5; p < 0.001; λ = 0.69). These high and statistically significant correlations suggest substantial relationships among the factors, potentially indicating overlap, the presence of a higher-order latent dimension, or conceptual redundancy between the constructs.
Therefore, we also assessed discriminant validity using the criterion proposed by Fornell and Larcker (1981), which recommends that the square root of the average variance extracted (√AVE) for each factor should exceed the correlations between that factor and the others (Table 5). The AVE values, estimated from correlations among the items within each factor, were approximately 0.45 for factor 1, 0.39 for factor 2, and 0.49 for factor 3. The corresponding square roots of the AVEs were 0.67, 0.62, and 0.70, respectively. The correlations between the factors ranged from 0.42 to 0.54, all below the respective √AVE values for each factor. These results support the discriminant validity of the constructs, indicating that each factor shares more variance with its own items than with items from the other factors.
In summary, considering the results from the exploratory factor analysis (EFA), confirmatory factor analysis (CFA), and the assessments of discriminant validity and reliability, the PSIQ-CV scale demonstrates sound psychometric properties supporting its adaptation as a three-factor, 16-item instrument (see Figure 2).

3.4. Sensitivity, Divergent and Convergent Validity

The sensitivity analysis of the three factors indicated values close to a normal distribution (F1: W = 0.97 (537), p < 0.001; F2: W = 0.94 (537), p < 0.001; F3: W = 0.89 (537), p < 0.001), with the skewness and kurtosis values remaining within acceptable ranges (F1: S = −0.37, K = −0.46; F2: S = −0.81, K = 0.54; F3: S = −0.99, K = 0.62). The correlations between the factors were analyzed, and significant moderate positive associations between the three factors were observed (F1–-F2: = 0.54, p < 0.001; F1–-F3: = 0.42, p < 0.001; F2F3: r = 0.45, p < 0.001; Table 5). These associations suggest a consistent and reliable relationship between the three factors.
Convergent validity was analyzed through the correlations between PSIQ-CV factors and the level of quality of life. This association showed significant positive correlations despite their low magnitude (F1: r = 0.19, p < 0.001; F2: r = 0.22, p < 0.001; F3: r = 0.23, p < 0.001). Overall, these results support an alignment between the PSI factors and children’s quality of life.
The correlation between the three factors and the sex variable was computed for the purposes of divergent validity, and the results revealed very weak correlations, with no statistical significance (F1: r = 0.04, p < 0.320; F2: r = 0.02, p < 0.702; F3: r = −0.08, p < 0.077; Table 5).

4. Discussion

This study aimed to develop and validate a psychometrically sound measure of perceived parental school involvement (PSI) for children and adolescents aged 6–15 years. The results support that the PSIQ-CV is a valid and reliable instrument to assess children’s perceptions of parental school involvement.
Recognizing PSI as a critical determinant of educational engagement and academic success, this work contributes to the field by centering the child’s perspective—an often-overlooked dimension in existing assessments. The new measure, the PSIQ-CV, strengthens efforts to evaluate parental participation and collaboration in students’ school experiences in a developmentally appropriate and empirically rigorous manner.
Initial data analysis identified outliers, which is expected in a diverse child and adolescent sample. Descriptive statistics indicated that item distributions were acceptable, with no severe violations of skewness or kurtosis. The participants’ responses were well-distributed across the available response options, suggesting item comprehension and variability.
The factorial structure of the scale was examined through both exploratory and confirmatory factor analyses (EFA and CFA). While the initial EFA suggested a four-factor solution, theoretical considerations and empirical refinements supported a three-factor model, which ultimately demonstrated a superior fit in the CFA when compared to unifactorial, two-, and four-factor alternatives. This structure differs from earlier iterations of PSI questionnaires (Pereira et al. 2003, 2008), reflecting a refinement aligned with both developmental theory and statistical evidence. The selection of the 3-factorial solution for the PSIQ-CV involved a critical balance between the variance explained by the factors and their theoretical and conceptual interpretability. While solutions with a greater number of factors may, at times, capture a marginally higher percentage of the total variance, their retention must be carefully weighed against the clarity, the cohesion of items within each factor, and the practical relevance of the resulting dimensions.
The final version of the PSIQ-CV (see Appendix A) includes 16 items across three dimensions: support in learning activities (6 items), parent–school communication (6 items), and supervision (4 items). These dimensions correspond well with structures found in comparable instruments (e.g., Goulet et al. 2023; Li et al. 2024; Rodríguez et al. 2018; Veas et al. 2019), while maintaining a concise and manageable format suitable for younger respondents. Reliability indices were satisfactory across dimensions, although the second factor yielded only acceptable internal consistency—likely due to its shorter length, a common challenge noted in psychometric literature (Almeida and Freire 2017; Marôco and Garcia-Marques 2013).
Furthermore, the empirical structure of these three factors found within the PSIQ-CV aligns well with Epstein’s comprehensive theoretical framework. This theoretical alignment strengthens our study’s conceptual foundation, providing a precise understanding of the investigated dimensions of PSI within Epstein’s multifaceted framework.
Beyond internal consistency, the PSIQ-CV demonstrated strong construct validity, evaluated in line with the AERA et al. (2014) guidelines. Specifically, convergent validity was supported by significant, albeit modest, associations between PSI and children’s perceived quality of life—an outcome consistent with previous research (e.g., Ramos-Díaz et al. 2016; Goulet et al. 2023). This finding, while seemingly modest on the surface, is conceptually consistent and expected, as PSI and well-being/QoL are distinct yet related constructs. While parental support and collaboration within the school sphere undeniably contribute to a child’s well-being, their isolated impact does not necessarily manifest as a high-magnitude correlation with a comprehensive measure of quality of life. This positive, albeit weak, correlation therefore provides initial and plausible evidence for the convergent validity of the PSIQ-CV, indicating that the scale measures an aspect of a child’s experience genuinely linked to their overall well-being without being redundant with other measures. As Flake et al. (2022) note, validity is an evolving process grounded in cumulative evidence, and the present findings provide a robust foundation for the continued use and refinement of the scale.
Developing instruments for younger populations presents particular challenges, as children may struggle to interpret abstract or evaluative statements. Similar issues were reported by Goulet et al. (2023), who emphasized the importance of careful item construction and testing when working with younger respondents. In this regard, the PSIQ-CV demonstrates strong potential, offering a clear and developmentally appropriate approach to assessing PSI. The concise design and simple structure of the PSIQ-CV, with its 16 items, are optimized for the child and adolescent population, as they minimize completion time and respondent fatigue and facilitate its administration without the need for extensive individualized intervention.
The instrument is theoretically grounded in Epstein’s framework of overlapping spheres of influence and six types of involvement (Epstein et al. 2018). Each of the PSIQ-CV’s three dimensions reflects this typology: support in learning activities aligns with Volunteering (type 3); parent–school communication draws from Parenting and Communicating (types 1 and 2); and supervision reflects Parenting and Learning at Home (types 1 and 4). Several items also capture other typological domains, such as managing, contributing, and problem-solving, illustrating the interrelated nature of Epstein’s categories and the multidimensionality of PSI in practice.
Similar to other established tools that focus on adult perceptions and have child versions—such as the Family Involvement Questionnaire (Fantuzzo et al. 2000), the Parents’ Report of Parental Involvement (Hoover-Dempsey and Sandler 1997), or the Parental Involvement Questionnaire (Yulianti et al. 2018)—the PSIQ-CV was specifically designed for and validated with children. However, it stands out by covering a broader age range (6–15 years), a feature that enhances its utility and helps address a gap identified in previous instruments (Mocho et al. 2025; Liu et al. 2022).
By integrating theoretical coherence with rigorous psychometric procedures, the PSIQ-CV can be a useful and robust instrument. It fills a documented empirical gap (Yampolskaya and Payne 2025; El-Den et al. 2020), while opening new avenues for longitudinal research, program evaluation, and targeted interventions aimed at enhancing family–school relationships from the child’s perspective.
The relevance of PSI evaluation is associated with its centrality in families’ daily life, namely with children in school, and is further emphasized in the current sociocultural context, where children and adolescents increasingly engage with digital technologies, often at the expense of face-to-face parental interaction. This shift presents new challenges for family–school partnerships, affecting both children’s perceptions of involvement and parents’ capacity to fulfill educational roles (Álamo-Bolaños et al. 2024; Andrisano Ruggieri et al. 2024). Moreover, valuing children’s voices in educational research and practice is aligned with broader efforts to promote their rights to participation, expression, and agency, as appropriate to their age and maturity.

4.1. Implications for Practice

This study can make a valuable contribution to triangulate PSI perceptions among children or adolescents, parents, and teachers and enrich the current versions of this instrument. The PSIQ-CV is a short and reliable instrument that is easy to apply (individually or in groups) and valuable for professionals (e.g., to assess PSI and draw strategies that can enhance children’s or adolescents’ academic adjustment or to design interventions or school programs to promote PSI) and for empirical PSI studies.
Specifically, at the psychopedagogical level, the PSIQ-CV enables the identification of misalignments in perception and potential areas of disconnection between the child and the school, mediated by PSI. This can signal the need for specific strategies to strengthen home–school communication, engage parents in ways more meaningful to the child, or offer direct support to the child to address perceived disinterest. As a screening tool, the PSIQ-CV allows teachers and school psychologists to implement proactive interventions, such as mentorship programs, support groups, or family counseling sessions tailored to the perceptions of children or adolescents, which can be more effective than approaches based solely on external indicators. From a systemic perspective, understanding students’ collective perceptions of parental involvement can help schools reformulate their communication strategies with families, develop more inclusive and student-centered support strategies and parent–school partnership programs, as well as create a school environment that actively promotes the perception of parental support among students. This can lead to a more positive school climate and overall improved educational outcomes.

4.2. Limitations and Suggestions

Despite the significance of its contribution to assessing children’s and adolescents’ perceptions of PSI, this study presents several limitations that should be considered. Firstly, a limitation of this study lies in its initial pre-test methodology, which, though useful for language verification, did not include standardized cognitive interviews. Additionally, the assisted administration of the questionnaire, adopted to ensure the accessibility and universal comprehension of items across all age groups, may have introduced a potential for bias. The absence of a comparison with autonomous administration limits the evaluation of this impact. Nevertheless, these methodological choices were crucial for broad participant inclusion and for the scope of this primary validation study. Future research should compare assisted and autonomous administration methods to further assess their impact on response comparability and internal validity, and could also incorporate more formal cognitive interviewing techniques. Despite the pilot study with five children allowing for an initial validation of the questionnaire’s clarity and language comprehension across the age range extremes, it is recognized that the robustness of the semantic validation could have benefited from a larger and more diverse sample. Next, the need to divide the sample into two sub-samples to carry out rigorous factor analyses reduced the effective sample size in each analysis, potentially affecting the statistical power and generalizability of the results. The sample consisted exclusively of Portuguese children, which limits the applicability of the findings to other cultural contexts. Researchers and practitioners should therefore be cautious when generalizing the use of the PSIQ-CV beyond the Portuguese population. Future research should focus on translating and culturally adapting the instrument into other languages and evaluating its validity among children and adolescents from different backgrounds.
Moreover, the exclusive reliance on self-report data may introduce response biases, such as social desirability or limited self-awareness. To strengthen the ecological validity of future studies, incorporating multi-informant data—such as reports from parents or teachers—would be beneficial. The study’s cross-sectional design also limits the ability to draw conclusions about developmental changes or causal relationships. Longitudinal research is thus recommended to examine the stability and predictive validity of the PSIQ-CV across time and developmental stages.
Although this construct has a well-established theoretical background, researchers have noted several inconsistencies regarding the definition and operationalization of PSI, as well as its various types and dimensions (e.g., Erdem and Kaya 2020; Wilder 2014). A systematic review aimed at identifying the relationship between PSI and students’ academic achievement (e.g., Boonk et al. 2018) highlighted that studies often yield divergent results due to multiple factors, including the variety of measures used to assess PSI (Otani 2020). While the present validation study offers robust evidence for the PSIQ-CV’s validity and reliability, future investigations should apply factorial invariance analyses (by sex and age groups) that will be crucial to confirm the instrument’s consistency across different subpopulations. Additionally, investigating the qualitative degrees of PSI via cluster analyses or clinically significant cut-off points could enrich the PSIQ-CV’s practical application in screening and intervention planning. Finally, although the present study explored the structure of the PSIQ-CV through EFA and CFA, the non-exploration of more complex hierarchical factorial models, such as second-order or bifactor models, is recognized as a limitation. This consideration is particularly relevant given the high correlations observed among the first-order factors and should be addressed in future investigations for a more in-depth understanding of the construct’s structure.

5. Conclusions

The adaptation and validation of the PSIQ-CV can represent a valuable contribution to the assessment of PSI as perceived by children and adolescents. The findings support the instrument’s strong potential and practical utility for measuring students’ perception of PSI within the Portuguese context. By addressing a critical instrumental gap, the PSIQ-CV offers a unique child’s perspective, essential for individualized psychopedagogical approaches and for formulating school strategies that actively foster the perception of parental support and involvement. Future research should focus on the PSIQ-CV’s cross-cultural validation, the exploration of its predictive power in longitudinal studies, and the integration of a multi-informant perspective of PSI, further solidifying its clinical and research utility.
As a brief, reliable, and psychometrically robust tool, PSIQ-CV offers meaningful support for researchers and professionals, facilitating the implementation of evidence-based practices and the promotion of positive school–family collaborations.

Author Contributions

Conceptualization, H.M., C.N. and C.M.; methodology, H.M., E.R., C.M. and C.N.; software, H.M. and E.R.; validation, H.M., E.R., C.N. and C.M.; formal analysis, H.M., E.R., C.N. and C.M.; investigation, H.M.; data curation, H.M.; writing—original draft preparation, H.M.; writing—review and editing, C.M. and C.N.; supervision, C.M. and C.N. All authors have read and agreed to the published version of the manuscript.

Funding

This research received no external funding.

Institutional Review Board Statement

The study was conducted in accordance with the Declaration of Helsinki and approved by the Institutional Review Board (or Ethics Committee) of University of Algarve (CEUAlg Pn° 1/2024, 23 February 2024).

Informed Consent Statement

Informed consent was obtained from all the subjects involved in the study.

Data Availability Statement

The data presented in this study are unavailable due to ethical restrictions protecting the confidentiality of our research participants.

Conflicts of Interest

The authors declare no conflicts of interest.

Abbreviations

The following abbreviations are used in this manuscript:
PSIParental school involvement
CFAConfirmatory factor analysis
EFAExploratory factor analysis

Appendix A

Parental School Involvement Questionnaire—Children’s version (PSIQ-CV).
Instructions: Below you will find a set of statements about your parents’ involvement with your school and your teacher. For each statement, there is a scale from 1 to 4. Mark with an X the number 4 if it is very true, 3 if it is true, 2 if it is somewhat true, or 1 if it is not true at all. There are no right or wrong answers, only answers about how you perceive your parents’ involvement with the school and the teacher. It is important that you answer all the questions.
Who helps you most with school things?
Dad___.
Mum___.
(Someone else___ Who? _________________).
Now think for yourself about the person who helps you the most with school subjects…
My dad…/My mum…
Item Not True at AllSomewhat TrueTrueVery True
Gives ideas for organizing activities at school (for example, parties, sports activities, or games).1234
When there is a problem with me at school, speaks to my teacher.1234
When there are problems at school, tries to help solve them (for example, gives ideas for dealing with children’s behavioral problems).1234
Goes to meetings that my teacher organizes.1234
If my teacher invites, takes part in activities in my classroom (for example, reads a story in my classroom, tells about their job).1234
Tries to do activities with me that help me to learn (for example, reads stories, talks to me about interesting things, goes to the library with me).1234
Offers help when knows that different activities are going to take place in my class (for example, a field trip or a party).1234
Often talks to my peers’ parents about school things.1234
Helps with activities organized at my school.1234
Gives ideas for organizing activities in my classroom (for example, field trips or parties).1234
Goes to parents‘ activities organized at my school (e.g., parents’ meetings, festive days such as Father’s or Mother’s Day, Christmas party).1234
Checks to see if I have any notes in my bag.1234
Checks to see if I have completed my homework.1234
Asks me what I have learned at school and talks to me about the subjects.1234
Informs the teacher about my problems with classmates.1234
Helps me organize my school things.1234

References

  1. Addi-Raccah, Audrey, Paola Dusi, and Noa Seeberger Tamir. 2023. What Can We Learn about Research on Parental Involvement in School? Bibliometric and Thematic Analyses of Academic Journals. Urban Education 58: 2276–307. [Google Scholar] [CrossRef]
  2. American Educational Research Association, American Psychological Association, and National Council on Measurement in Education. 2014. Standards for Educational and Psychological Testing. Washington, DC: American Educational Research Association. [Google Scholar]
  3. Almeida, Leandro S., and Teresa Freire. 2017. Metodologia da Investigação em Psicologia e Educação, 5.ª ed. Braga: Psiquilíbrios. [Google Scholar]
  4. Andrisano Ruggieri, Ruggero, Monica Mollo, and Grazia Marra. 2024. Smartphone and Tablet as Digital Babysitter. Social Sciences 13: 412. [Google Scholar] [CrossRef]
  5. Álamo-Bolaños, Arminda, Itahisa Mulero-Henríquez, and Leticia Morata Sampaio. 2024. Childhood, Education, and Citizen Participation: A Systematic Review. Social Sciences 13: 399. [Google Scholar] [CrossRef]
  6. Barger, Michael M., Elizabeth Moorman Kim, Nathan R. Kuncel, and Eva M. Pomerantz. 2019. The Relation Between Parents’ Involvement in Children’s Schooling and Children’s Adjustment: A Meta-Analysis. Psychological Bulletin 145: 855. [Google Scholar] [CrossRef]
  7. Berkowitz, Ruth, Ron Avi Astor, Diana Pineda, Kris Tunac DePedro, Eugenia L. Weiss, and Rami Benbenishty. 2021. Parental Involvement and Perceptions of School Climate in California. Urban Education 56: 393–423. [Google Scholar] [CrossRef]
  8. Boateng, Godfred O., Torsten B. Neilands, Edward A. Frongillo, Hugo R. Melgar-Quiñonez, and Sera L. Young. 2018. Best Practices for Developing and Validating Scales for Health, Social, and Behavioral Research: A Primer. Frontiers in Public Health 6: 149. [Google Scholar] [CrossRef]
  9. Boonk, Lisa, Hieronymus J. M. Gijselaers, Henk Ritzen, and Saskia Brand-Gruwel. 2018. A Review of the Relationship between Parental Involvement Indicators and Academic Achievement. Educational Research Review 24: 10–30. [Google Scholar] [CrossRef]
  10. Braeken, Johan, and Marcela L. M. Van Assen. 2017. An Empirical Kaiser Criterion. Psychological Methods 22: 450–66. [Google Scholar] [CrossRef]
  11. Cheung, Cecilia S. S., and Eva M. Pomerantz. 2011. Parents’ Involvement in Children’s Learning in the United States and China: Implications for Children’s Academic and Emotional Adjustment. Child Development 82: 932–50. [Google Scholar] [CrossRef]
  12. Choi, Namok, Mido Chang, Sunha Kim, and Thomas G. Reio, Jr. 2015. A Structural Model of Parent Involvement with Demographic and Academic Variables. Psychology in the Schools 52: 154–67. [Google Scholar] [CrossRef]
  13. De Los Reyes, Andres, Tara M. Augenstein, Mo Wang, Sarah A. Thomas, Deborah A.G. Drabick, Darcy E. Burgers, and Jill Rabinowitz. 2015. The Validity of the Multi-Informant Approach to Assessing Child and Adolescent Mental Health. Psychological Bulletin 141: 858–900. [Google Scholar] [CrossRef]
  14. El-Den, Sarira, Carl Schneider, Ardalan Mirzaei, and Stephen Carter. 2020. How to Measure a Latent Construct: Psychometric Principles for the Development and Validation of Measurement Instruments. International Journal of Pharmacy Practice 28: 326–36. [Google Scholar] [CrossRef] [PubMed]
  15. Epstein, Joyce L. 1987. Toward a Theory of Family-School Connections: Teacher Practices and Parent Involvement Across the School Years. In Social Intervention: Potential and Constraints. Edited by Klaus Hurrelmann, Franz-Xaver Kaufmann and Friedrich Losel. New York: DeGruyter, pp. 121–36. [Google Scholar]
  16. Epstein, Joyce L. 1991. Effect on Student Achievement of Teachers’ Practices of Parent Involvement. Advances in Reading/Language Research 5: 261–76. [Google Scholar]
  17. Epstein, Joyce L. 1995. School/Family/Community Partnerships: Caring for the Children We Share. Phi Delta Kappan 76: 701–12. [Google Scholar] [CrossRef]
  18. Epstein, Joyce L. 2010. School/family/community partnerships: Caring for the children we share. Phi Delta Kappan 92: 81–96. [Google Scholar] [CrossRef]
  19. Epstein, Joyce L., Mavis G. Sanders, Steven Sheldon, Beth S. Simon, Karen Clark Salinas, Natalie R. Jansorn, Frances L. VanVoorhis, Cecelia S. Martin, Brenda G. Thomas, and Marsha D. Greenfield. 2018. School, Family, and Community Partnerships: Your Handbook for Action. Thousand Oaks: Corwin. [Google Scholar]
  20. Erdem, Cahit, and Metin Kaya. 2020. A Meta-Analysis of the Effect of Parental Involvement on Students’ Academic Achievement. Journal of Learning for Development 7: 367–83. [Google Scholar] [CrossRef]
  21. Fantuzzo, John, Erin Tighe, and Stephanie Childs. 2000. Family Involvement Questionnaire: A Multivariate Assessment of Family Participation in Early Childhood Education. Journal of Educational Psychology 92: 367–76. [Google Scholar] [CrossRef]
  22. Field, Andy. 2024. Discovering Statistics Using IBM SPSS Statistics, 6th ed. London: SAGE. [Google Scholar]
  23. Flake, Jessica K., Ian J. Davidson, Octavia Wong, and Jolynn Pek. 2022. Construct Validity and the Validity of Replication Studies: A Systematic Review. American Psychologist 77: 576. [Google Scholar] [CrossRef]
  24. Fornell, Claes, and David F. Larcker. 1981. Evaluating Structural Equation Models with Unobservable Variables and Measurement Error. Journal of Marketing Research 18: 39–50. [Google Scholar] [CrossRef]
  25. Gaspar, Tânia, and Margarida Gaspar de Matos. 2008. Qualidade de Vida em Crianças e Adolescentes: Versão Portuguesa dos Instrumentos KIDSCREEN-52. Cruz Quebrada: Aventura Social e Saúde. [Google Scholar]
  26. Gaspar, Tânia, Margarida Gaspar de Matos, José Pais Ribeiro, Luís José, Isabel Leal, and Aristides Ferreira. 2009. Health-Related Quality of Life in Children and Adolescents and Associated Factors. Journal of Cognitive and Behavioral Psychotherapies 9: 33–48. Available online: https://www.researchgate.net/publication/233382008 (accessed on 6 March 2025).
  27. Goodall, Janet. 2018. Leading for Parental Engagement: Working Towards Partnership. School Leadership & Management 38: 143–46. [Google Scholar] [CrossRef]
  28. Goretzko, David, Karik Siemund, and Philipp Sterner. 2023. Evaluating Model Fit of Measurement Models in Confirmatory Factor Analysis. Educational and Psychological Measurement 84: 123–44. [Google Scholar] [CrossRef]
  29. Goulet, Julie, Isabelle Archambault, Julien Morizot, Elizabeth Olivier, and Kristel Tardif-Grenier. 2023. Validation of the Student-Rated Parental School Involvement Questionnaire: Factorial Validity and Invariance across Time and Sociodemographic Characteristics. Journal of Psychoeducational Assessment 41: 416–33. [Google Scholar] [CrossRef]
  30. Grolnick, Wendy S., and Maria L. Slowiaczek. 1994. Parents’ Involvement in Children’s Schooling: A Multidimensional Conceptualization and Motivational Model. Child Development 65: 237–52. [Google Scholar] [CrossRef] [PubMed]
  31. Hill, Nancy E., Dana R. Castellino, Jennifer E. Lansford, Patrick Nowlin, Kenneth A. Dodge, John E. Bates, and Gregory S. Pettit. 2004. Parent Academic Involvement as Related to School Behavior, Achievement, and Aspirations: Demographic Variations Across Adolescence. Child Development 75: 1491–509. [Google Scholar] [CrossRef]
  32. Hoover-Dempsey, Kathleen V., and Howard M. Sandler. 1997. Why Do Parents Become Involved in Their Children’s Education? Review of Educational Research 67: 3–42. [Google Scholar] [CrossRef]
  33. Jeynes, William H. 2018. A Practical Model for School Leaders to Encourage Parental Involvement and Parental Engagement. School Leadership & Management 38: 147–63. [Google Scholar] [CrossRef]
  34. Kaiser, Henry F. 1974. An Index of Factorial Simplicity. Psychometrika 39: 31–36. [Google Scholar] [CrossRef]
  35. Kline, Rex B. 2023. Principles and Practice of Structural Equation Modeling. New York: Guilford Publications. [Google Scholar]
  36. Li, Simeng, Xiaozhe Meng, Yuke Xiong, Ruiping Zhang, and Ping Ren. 2024. The Developmental Trajectory of Subjective Well-Being in Chinese Early Adolescents: The Role of Gender and Parental Involvement. Child Indicators Research 17: 731–52. [Google Scholar] [CrossRef]
  37. Liu, Keqiao, and Qiang Zhang. 2023. Parent–Child Perception Differences in Home-Based Parental Involvement and Children’s Mental Health in China: The Effects of Peer Support and Teacher Emotional Support. PsyCh Journal 12: 280–96. [Google Scholar] [CrossRef]
  38. Liu, Keqiao, Yong Zhao, Miao Li, Wenjing Li, and Yang Yang. 2022. Parents’ Perception or Children’s Perception? Parental Involvement and Student Engagement in Chinese Middle Schools. Frontiers in Psychology 13: 977678. [Google Scholar] [CrossRef]
  39. Love, Jonathon, Damian Dropmann, and Ravi Selker. 2022. Jamovi (Version 2.6.26) [Computer Software]. Available online: https://www.jamovi.org (accessed on 6 March 2025).
  40. Manz, Patricia H., John W. Fantuzzo, and Thomas J. Power. 2004. Multidimensional Assessment of Family Involvement among Urban Elementary Students. Journal of School Psychology 42: 461–75. [Google Scholar] [CrossRef]
  41. Marôco, João, and Teresa Garcia-Marques. 2013. Qual a Fiabilidade Do Alfa De Cronbach? Questões Antigas E Soluções Modernas? Laboratório de Psicologia 4: 65–90. [Google Scholar] [CrossRef]
  42. Martel, Michelle M., Kristian Markon, and Gregory T. Smith. 2017. Research Review: Multi-informant integration in child and adolescent psychopathology diagnosis. Journal of Child Psychology and Psychiatry 58: 116–28. [Google Scholar] [CrossRef]
  43. Mata, Liliana, and Isabel Pedro. 2021. Participação e Envolvimento das Famílias—Construção de Parcerias em Contextos de Educação de Infância. Lisboa: Ministério da Educação/Direção-Geral da Educação. [Google Scholar]
  44. Mocho, Helena, Cátia Martins, Rita dos Santos, Elias Ratinho, and Cristina Nunes. 2025. Measuring Parental School Involvement: A Systematic Review. European Journal of Investigation in Health, Psychology and Education 15: 96. [Google Scholar] [CrossRef] [PubMed]
  45. Nathans, Laura, and Smita Guha. 2025. Development and Test of a Summer Family Involvement Questionnaire. Social Sciences 14: 249. [Google Scholar] [CrossRef]
  46. Olatoye, Rafiu Ademola, and B. J. Ogunkola. 2008. Parental Involvement, Interest in Schooling and Science Achievement of Junior Secondary School Students in Ogun State, Nigeria. College Teaching Methods & Styles Journal 4: 33–40. [Google Scholar]
  47. Oswald, Donald P., Hiba B. Zaidi, D. Scott Cheatham, and Kayla G. Diggs Brody. 2018. Correlates of Parent Involvement in Students’ Learning: Examination of a National Data Set. Journal of Child and Family Studies 27: 316–23. [Google Scholar] [CrossRef]
  48. Otani, Midori. 2020. Parental Involvement and Academic Achievement Among Elementary and Middle School Students. Asia Pacific Education Review 21: 1–25. [Google Scholar] [CrossRef]
  49. Pereira, Ana I. F., José M. Canavarro, Maria F. Cardoso, and Diana V. Mendonça. 2003. Desenvolvimento da Versão para Professores do Questionário de Envolvimento Parental na Escola (QEPE-VPr). Revista Portuguesa de Pedagogia 2: 109–32. [Google Scholar]
  50. Pereira, Ana I. F., José M. P. Canavarro, Maria F. Cardoso, and Diana Mendonça. 2008. Envolvimento Parental na Escola e Ajustamento em Crianças do 1º Ciclo do Ensino Básico. Revista Portuguesa de Pedagogia 42: 91–110. Available online: https://impactum-journals.uc.pt/rppedagogia/article/view/1647-8614_42-1_5/677 (accessed on 6 March 2025). [CrossRef]
  51. Pomerantz, Eva M., Elizabeth A. Moorman, and Scott D. Litwack. 2007. The How, Whom, and Why of Parents’ Involvement in Children’s Academic Lives: More Is Not Always Better. Review of Educational Research 77: 373–410. [Google Scholar] [CrossRef]
  52. Ramos-Díaz, Estibaliz, Arantzazu Rodríguez-Fernández, Arantza Fernández-Zabala, Lorena Revuelta, and Ana Zuazagoitia. 2016. Adolescent Students’ Perceived Social Support, Self-Concept and School Engagement // Apoyo Social Percibido, Autoconcepto e Implicación Escolar de Estudiantes Adolescentes. Revista de Psicodidáctica 21: 339–56. [Google Scholar] [CrossRef]
  53. Rodríguez, Arantzazu Fernández, Lorena Revuelta Revuelta, Marta Sarasa Maya, and Oihane Fernández Lasarte. 2018. El Rol de Los Estilos de Socialización Parental Sobre La Implicación Escolar Y El Rendimiento Académico. European Journal of Education and Psychology 11: 123. [Google Scholar] [CrossRef]
  54. Salac, Ladylyn M., and Jonathan U. Florida. 2022. Epstein model of parental involvement and academic performance of learners. European Online Journal of Natural and Social Sciences 11: 379. [Google Scholar]
  55. Tabachnick, Barbara G., and Linda S Fidell. 2018. Using Multivariate Statistics. London: Pearson. [Google Scholar]
  56. Thomas, Valérie, Jaël Muls, Free De Backer, and Koen Lombaerts. 2020. Middle school student and parent perceptions of parental involvement: Unravelling the associations with school achievement and wellbeing. Educational Studies 46: 404–21. [Google Scholar] [CrossRef]
  57. Veas, Alejandro, Juan-Luis Castejón, Pablo Miñano, and Raquel Gilar-Corbí. 2019. Relationship between Parent Involvement and Academic Achievement through Metacognitive Strategies: A Multiple Multilevel Mediation Analysis. British Journal of Educational Psychology 89: 393–411. [Google Scholar] [CrossRef]
  58. Wilder, Sandra. 2014. Effects of Parental Involvement on Academic Achievement: A Meta-synthesis. Educational Review 66: 377–97. [Google Scholar] [CrossRef]
  59. Yampolskaya, Svetlana, and Tracy Payne. 2025. Assessing Parental Involvement in Children’s Learning: Initial Validation of the Parent Involvement Survey. Journal of Child and Family Studies 34: 141–49. [Google Scholar] [CrossRef]
  60. Yulianti, Kartika, Eddie J. P. G. Denessen, and Mienke Droop. 2018. The Effects of Parental Involvement on Children’s Education: A Study in Elementary Schools in Indonesia. International Journal about Parents in Education 10: 14–32. [Google Scholar] [CrossRef]
Figure 1. Scree plot.
Socsci 14 00475 g001
Figure 2. CFA diagram.
Socsci 14 00475 g002
Table 1. Descriptive statistics of the 24 items (N = 537).
ItemsM (SD)SKMinMax
1Gives ideas for organizing activities at school (for example, parties, sports activities, or games).2.69 (1.00)−0.36−0.9114
2Tries to find out what I need to learn so they can help me at home.3.48 (0.64)−0.84−0.3414
3When there is a problem with me at school, speaks to my teacher.3.30 (0.87)−1.130.5114
4Tries to get me to do activities that help me learn (for example, asks me to read).3.42 (0.73)−1.231.3514
5Helps me to do my homework.3.41 (0.78)−1.251.0314
6When there are problems at school, tries to help solve them (for example, gives ideas for dealing with children’s behavioral problems).3.22 (0.92)−0.970.0014
7Goes to meetings that my teacher organizes.3.50 (0.87)−1.762.0914
8If my teacher invites, takes part in activities in my classroom (for example, reads a story in my classroom, tells about their job).2.95 (1.04)−0.67−0.7214
9Tries to do activities with me that help me to learn (for example, reads stories, talks to me about interesting things, goes to the library with me).3.19 (0.85)−0.870.1114
10Offers help when knows that different activities are going to take place in my class (for example, a field trip or a party).3.15 (0.95)−0.88−0.2314
11Often talks to my peers’ parents about school things.3.06 (0.95)−0.72−0.4414
12Helps with activities organized at my school.2.87 (1.01)−0.50−0.8414
13Gives ideas for organizing activities in my classroom (for example, field trips or parties).2.56 (1.07)−0.13−1.2214
14Knows the rules of my school (for example, the school timetable, the materials I need for lessons).3.73 (0.51)−1.762.2424
15Talks to me about what is going on at school.3.58 (0.61)−1.160.2924
16Goes to parents‘ activities organized at my school (e.g., parents’ meetings, festive days such as Father’s or Mother’s Day, Christmas party).3.37 (0.84)−1.290.9314
17Ask my teacher if I am learning well or if I am having difficulties.3.12 (0.89)−0.74−0.03014
18Checks to see if I have any notes in my bag.2.99 (1.08)−0.68−0.8514
19Checks to see if I have completed my homework.3.41 (0.86)−1.461.3514
20Asks me what I have learned at school and talks to me about the subjects.3.45 (0.75)−1.250.9314
21Tries to teach me how to plan and organize my time better (for example, explains how I should study).3.37 (0.76)−1.060.6514
22Informs the teacher about my problems with classmates.2.95 (1.06)−0.61−0.8814
23Asks me when the assessment tests are to help me with studying.3.53 (0.78)−1.652.0314
24Helps me organize my school things.3.37 (0.82)−1.260.9614
Note: M = mean; SD = standard deviation; S = skewness; K = kurtosis; Min = minimum; Max = maximum.
Table 2. Rotated factor loading matrix (EFA, n = 150).
ItemsF1F2F3h2
120.72 0.55
10.70 0.52
130.68 0.59
90.64 0.48
100.56 0.41
80.53 0.43
40.47 0.27
21 0.28
3 0.71 0.53
16 0.58 0.46
7 0.56 0.35
11 0.56 0.39
6 0.45 0.34
22 0.41 0.38
18 0.800.70
19 0.780.62
24 0.590.47
17 0.470.560.53
20 0.530.40
Eigenvalue5.601.761.34
% explained variance29.499.237.08
Total explained variance45.78
Note: F1 = factor 1; F2 = factor 2; F3 = factor 3; h2 = communalities.
Table 3. Fit indices of the different tested models (CFA, n = 387).
Modelχ2dfχ2/dfCFITLIRMSEARMSEA (90%CI)
InferiorSuperior
Four-factor310983.160.850.820.0750.0650.084
Three-factor2251012.230.910.890.0600.0490.070
Two-factor4331034.200.770.730.0910.0820.100
One-factor4521024.350.750.720.0930.0840.100
Note: df = degrees of freedom; χ2 = chi-squared test; RMSEA = root mean square error of approximation; CFI = comparative fit index; TLI = Tucker–Lewis index; CI = confidence interval.
Table 4. Item–total correlations and reliability.
FactorItemsM (SD)ITCIf Item Deleted
αω
Factor 1 (F1)
Support in learning activities
122.94 (0.98)0.640.720.72
12.78 (0.98)0.480.760.76
132.62 (1.05)0.630.720.72
93.24 (0.80)0.440.770.77
103.19 (0.92)0.500.750.76
82.97 (1.02)0.480.760.76
Total2.96 (0.66)0.780.78
Factor 2 (F2)
Parent–school communication
33.32 (0.86)0.410.610.62
163.36 (0.86)0.440.590.60
73.50 (0.86)0.400.610.61
113.08 (0.94)0.360.620.63
63.27 (0.88)0.270.650.66
222.98 (1.04)0.450.590.60
Total3.25 (0.55)0.660.66
Factor 3 (F3)
Supervision
183.01 (1.08)0.500.630.64
193.40 (0.87)0.530.600.64
243.39 (0.79)0.460.650.66
203.45 (0.77)0.460.650.66
Total3.31 (0.64)0.700.70
Note: M = mean; SD = standard deviation; ITC = corrected item–total correlation; α = Cronbach’s alpha; ω = McDonald’s omega.
Table 5. Sensitivity, convergent and divergent validity (n = 387).
DimensionsFactor 1Factor 2Factor 3
Factor 1. Support in learning activities1
Factor 2. Parent–school communication0.54 **1
Factor 3. Supervision0.42 **0.45 **1
AVE0.450.390.49
√AVE0.670.620.70
Quality of life0.19 **0.22 **0.23 **
Sex0.040.02−0.08
M (SD)2.96 (0.66)3.25 (0.55)3.31 (0.64)
S−0.37−0.81−0.99
K−0.460.540.62
W (df)0.97 **0.94 **0.89 **
Note: AVE = average variance extracted; M = mean; SD = standard deviation; S = skewness; K = kurtosis; W = Shapiro–Wilk test; df = degrees of freedom; ** p < 0.001.
Disclaimer/Publisher’s Note: The statements, opinions and data contained in all publications are solely those of the individual author(s) and contributor(s) and not of MDPI and/or the editor(s). MDPI and/or the editor(s) disclaim responsibility for any injury to people or property resulting from any ideas, methods, instructions or products referred to in the content.

