Abstract
When individuals transition from homelessness into housing, their new home should serve as a place of healing and dignity. This paper presents empirical evidence on the impact of trauma-informed design (TID), an approach to designing affordable housing that supports the health and well-being of people with lived experience of homelessness. The study used a mixed-methods, quasi-experimental design across five permanent supportive housing (PSH) sites—three with TID features and two without. Residents completed surveys at two timepoints, and both the residents and the staff participated in semi-structured interviews. The quantitative results revealed a complex pattern: while some aspects of relationships and self-awareness improved at TID sites, measures of psychological safety and compassion declined. Additionally, conflict, psychological aggression, physical aggression, and mild violence increased over the same period. Qualitative findings highlight that safety is a nuanced, context-dependent experience that exists along a spectrum. The residents at the TID sites described opportunities to experience higher levels of safety. Together, the quantitative and qualitative data paint a complex picture of life in PSH. A key finding is that safety, conflict, and relationships are interwoven, evolving over time as the residents adapt to their environment.
1. Introduction
People experiencing homelessness often endure daily trauma on the streets, in shelters, or in other settings not intended for human habitation (Adler et al. 2023). They also report higher rates of lifetime trauma than individuals who have not experienced homelessness (Metro Denver Homelessness Initiative 2024; Perron et al. 2014). Research consistently links trauma exposure to adverse health and well-being outcomes (Evans et al. 2021; National Health Care for the Homeless Council 2019; Roncarati et al. 2018). When individuals transition from homelessness into housing, their new home should offer a foundation for healing and opportunity (Pable et al. 2021). However, the unique design needs of this population are often overlooked in favor of priorities such as cost efficiency, the speed of construction, and security (Swope and Hernández 2019). This paper presents empirical evidence on the impact of trauma-informed design (TID), a design approach intended to promote the health and well-being of formerly homeless residents in affordable housing.
TID is a design framework that centers on the physical, psychological, and emotional well-being of residents as they transition into stable housing (Brisson et al. 2023). It is increasingly being incorporated into the design and construction of permanent supportive housing (PSH) and shelters across the United States and internationally (Ajeen et al. 2023; Berens n.d.; Brisson et al. 2023; Design Resource for Homelessness, United Charitable n.d.; Owen and Crane 2022; Perkins & Will 2021; Preservation of Affordable Housing [POAH] 2023; Rollings and Bollo 2021). This study contributes some of the first empirical data on the relationship between TID and health and well-being outcomes among individuals transitioning from homelessness into PSH.
1.1. Homelessness and Permanent Supportive Housing
According to the 2024 HUD Point-in-Time (PIT) Count, more than 770,000 people experience homelessness on any given night in the United States (U.S. Department of Housing and Urban Development 2024). This figure is widely recognized as an undercount. Alternative methodologies estimate that 31% to 41% of unsheltered individuals sleep in locations that are hidden from view and, thus, are not captured by the PIT Count (Hopper et al. 2008). Additionally, individuals temporarily housed in hospitals or jails—who would otherwise be unhoused upon release—are excluded from official homelessness counts (National Law Center on Homelessness & Poverty 2017). These omissions suggest that the actual number of people in need of housing and support is significantly higher than that reported.
In response to this urgent need, the design and construction of permanent supportive housing (PSH) often prioritize maximizing the number of units and minimizing costs, rather than fostering environments that promote dignity, stability, and well-being for residents and staff (Ajeen et al. 2023; Faerden et al. 2023). Increasingly, stakeholders have raised concerns about the quality and effectiveness of conventional PSH, warning that standard design approaches may inadvertently perpetuate harm or retraumatize the very individuals they aim to support (Bittencourt and Amaro 2019; Gallagher 2004; Pable et al. 2021; Pless et al. 2017).
Trauma-informed design (TID) offers a contrasting framework that prioritizes health, healing, and human dignity over expediency, density, and regulatory minimums. Grounded in a human-scaled, human-centered philosophy, TID presents an alternative approach to PSH development. As interest in TID grows, there is a critical need for empirical research to evaluate its impact.
1.2. TID Conceptual Framework
The TID conceptual framework is a result of nearly ten years of housing pre-development and post-occupancy analyses and iterations. The TID conceptual framework is based on reviews of the extant literature with a focus on trauma-informed care (SAMHSA 2014) and years of research in the field, particularly with prospective and current residents, as well as staff, in affordable and supportive housing. The TID conceptual framework is presented in Figure 1. A complete description of the TID conceptual framework can be found in Designing for healing, dignity, & joy (v2): Iterating on the trauma-informed design framework (Brisson et al. 2023).
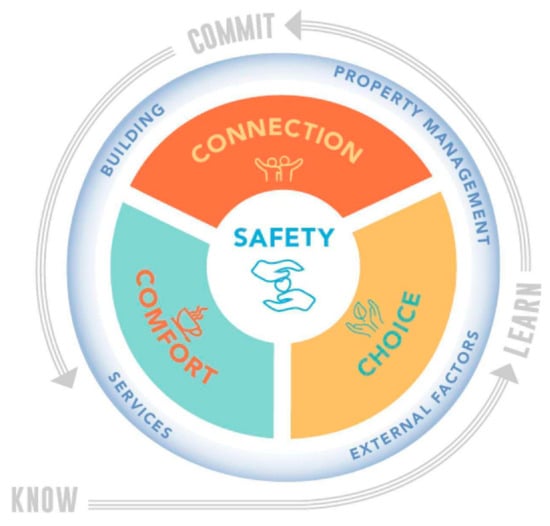
Figure 1.
Trauma-informed design conceptual framework.
As seen in Figure 1, at the center of the TID model is safety, surrounded by the core principles of comfort, connection, and choice. Safety is positioned at the center of the model as the foundational value within the TID framework. In the absence of a perceived sense of safety, it becomes challenging for individuals to fully experience comfort, connection, and choice. Conversely, the experience of safety is shaped by the degree to which these three principles are meaningfully supported within the built environment.
The quality of these four core principles—safety, comfort, connection, and choice—is contingent not only upon architectural and design characteristics but also on the presence and quality of onsite services and property management practices. Accordingly, the TID conceptual framework integrates both service provision and property management as central components of the realization of health and well-being for end users.
Moreover, the experience of the built environment is inherently situated within broader contextual factors, including the historical, ecological, and cultural conditions of the building’s physical and temporal setting. A comprehensive trauma-informed approach necessitates an interpretive lens that is both holistic and responsive—one that acknowledges the complex interdependence of these contextual influences on the health and well-being of end users.
This conceptual model is operationalized through an iterative process referred to as “know–learn–commit”, which articulates the evolving roles and ethical responsibilities of design professionals and other key stakeholders engaged in the development of the built environment. Using the TID model as a guide, professionals can create a built environment where individuals and communities can attend to their health and well-being.
1.3. Research Questions
This paper tests the impact of TID on health and well-being for people formerly experiencing homelessness and living in PSH by addressing the following research question:
Do residents living in TID PSH experience improved health and well-being compared to residents living in non-TID PSH?
To explore this question, the study employs three complementary research approaches. First, it compares health and well-being outcomes between residents in TID PSH and those in PSH not designed with TID principles. Second, it examines changes in health and well-being among residents in TID PSH over time. Third, it analyzes qualitative interviews with staff and residents from both TID and non-TID PSH sites to understand how the built environment affects end users.
2. Materials and Methods
2.1. Study Setting
This study was conducted at five permanent supportive housing (PSH) buildings located along Colorado’s Front Range. Three of these sites were intentionally designed and constructed using a trauma-informed design (TID) approach, guided by the TID framework. The remaining two buildings served as control sites and were not designed with a dedicated TID approach (referred to here as “non-TID”). This paper tests differences in the design intentions of the TID and non-TID building, rather than providing a full assessment of building characteristics that would make one building “TID” and another building “non-TID”.
2.2. Research Design
This study employed a mixed-methods, quasi-experimental design. Residents completed surveys at two timepoints to assess changes in health and well-being over time. Additionally, the residents and staff participated in semi-structured interviews to provide a more nuanced understanding of how the built environment influences health and well-being.
2.3. Data Collection
Data collection took place from June 2023 to July 2024 across five PSH sites along Colorado’s Front Range. The sites were purposefully selected to represent both TID and non-TID PSH, as well as a balance of urban and suburban locations and properties operated by nonprofit organizations and housing authorities. The administrative staff at each selected site were contacted via email to request the participation of the population within their building, including both residents and staff.
Once the sites agreed to participate, the researchers asked the administrative staff to post flyers announcing the upcoming data collection dates and the incentive offered for survey participation. All the residents at each site were invited to complete a survey, with the participants receiving a USD 25 gift card to local vendors upon completion.
The surveys were administered to the residents at two timepoints, as detailed in Table 1. The first survey period spanned June to October 2023, and the second took place between April and July 2024, approximately 10 months later. Table 1 also provides each building’s opening date alongside the pre-test and post-test survey periods.

Table 1.
Study timeline across the five sites.
Semi-structured interviews with the residents and staff occurred in conjunction with the second survey administration. The semi-structured interview protocol is included as an appendix to the paper (Appendix A.2). As can be seen in Table 2, a total of 42 resident and 17 staff interviews were conducted. The residents participated in individual interviews, while the staff participated in a mix of individual and group interviews, all of which lasted approximately 60 min. The interviews were conducted in English and facilitated in person by one to two members of the research team. All the interviews were audio-recorded and transcribed with the participants’ permission. At the start of each interview, the researchers explained the study procedures and secured written consent from all the participants. All the participants were compensated with USD 25 gift cards to local vendors.
Table 2.
Total interviews and surveys at each study site.
2.4. Measures
There are no prior quantitative studies examining the impact of trauma-informed design (TID) on health and well-being, and our conceptual framework suggests that TID may affect a wide range of resident outcomes. Accordingly, we used a comprehensive set of measures to capture various aspects of health and well-being in this study. The resident survey included items addressing the following concepts: attention; body pain; conflict; emotional well-being; hope (including pathways and agency); housing safety and sense of welcome; perceived health; relationships; safety; service utilization; sleep and health; and stress. Detailed descriptions of the scales and survey items used to assess these constructs are provided in Appendix A.
The qualitative interviews followed semi-structured guides—one for the residents and one for the staff—with probes designed to elicit more in-depth feedback. Both the residents and the staff were asked about their perceptions of living or working at the study sites, focusing on their experiences of safety, comfort, connection, choice, health, and engagement with services and systems.
2.5. Data Analysis
Descriptive statistics were used to describe the participants’ characteristics and the scoring from the surveys. T-tests, adjusted for multiple comparisons, were used to assess the outcome changes between the TID and the non-TID participants, as well as changes in the TID participants’ responses over time.
The interview transcripts were analyzed via a three-cycle coding process led by two members of the research team, who were assisted by a research assistant. The researchers organized the initial codes by the categories of responses based on questions from the interview guide, recording themes that emerged directly from the data under each category onto a shared spreadsheet. Once the initial coding was completed by each of the researchers for each of the transcripts, the team examined the list of themes and accompanying quotations and reorganized and summarized the themes to reflect the relationships between the concepts. The reorganized themes were then printed out and posted to a wall, at which point, the team reviewed and further refined the conceptual relationships through a physical process of clustering ideas and describing the nature of the relationships between concepts.
3. Results
3.1. Participation Rates and Characteristics
Table 2 presents the total surveys completed at each site for both Timepoint 1 (T1) and Timepoint 2 (T2). As can be seen in Table 2, the survey attrition at T2 was notably high for the non-TID sites. Due to the high survey attrition rates for the non-TID sites at T2, we chose to complete two sets of analyses to test the impact of TID on health and well-being. First, the participant outcomes for TID were compared to non-TID at T1. Then, the participant outcomes at the TID-only sites were compared at T1 and T2. These results can be found in the “Model Testing of Outcomes” section of the results.
Table 3 provides the descriptive statistics for the study’s participants.
Table 3.
Study participant characteristics.
3.2. Outcome Descriptives
In Table 4, we present the outcome descriptive statistics (means and standard deviations) for the array of study outcomes. These means and standard deviations are for all the available data, and we included the sample size in italics for each descriptive statistic. This is important because our model testing was assessed on complete cases, so the means and standard deviations in Table 4 are different from the means and standard deviations in our model testing. Of note, the average length of stay for the participants at TID sites at T1 was 11.7 months, and the average length of stay for the participants at non-TID sites at T1 was 51.9 months.
Table 4.
Outcome descriptives.
3.3. Model Testing of Outcomes
Table 5 and Table 6 present the statistically significant results of our model testing (p < 0.05). It is important to note that for model testing, we used list-wise deletion for missing values and a complete case analysis. This means that for some model tests, the mean scores in Table 5 and Table 6 may be different from one another and also different from those reported in Table 4’s outcome descriptives.
Table 5.
Model testing of outcome changes, differences between TID T1 and non-TID T1.
Table 6.
Model testing of outcome changes, differences between TID T1 and T2.
First, in Table 5, we show the results of t-tests used to assess differences between the TID and the non-TID participant average T1 outcome scores. Second, in Table 6, we show the results of t-tests used to assess the differences between the T1 and the T2 participant average outcome scores at the TID-only sites.
The results from Table 5 show that, on average, the local sense of community (a subscale of relationships) was higher at the TID sites than the non-TID sites at T1. The results also show that, on average, body pain was lower at the non-TID sites than at the TID sites at T1. Body sensations (a subscale of psychological safety), as well as the quality of sleep and the hours slept, were higher at the non-TID sites.
In Table 6, which compares the TID participants’ scores at T1 and T2, the results show that, on average, nearby neighbors (a subscale of relationships) and self-attention increased. Also, pathways (a subscale of hope), psychological safety, and compassion (a subscale of relationships) all decreased. The results also show that, on average, conflict, psychological aggression, physical aggression, and mild violence all increased at the TID sites from T1 to T2.
3.4. Themes Emerging from Resident and Staff Interviews
The analysis of the semi-structured interviews with the residents and the staff across the TID and the non-TID buildings revealed a set of inter-related themes that deepen our understanding of how core TID principles—namely safety, comfort, connection, and choice—are experienced in practice. These themes also illuminate how design and operational decisions influence not only the well-being of end users but the deeper, often underexplored experience of dignity.
3.4.1. Safety
Safety emerged as a highly contextual and relative experience, one that exists along a spectrum from low to high levels. Many of the residents, in both the TID and the non-TID buildings, described low levels of safety in ways that underscored a basic threshold of survival, noting that “[It’s] better than being on the street,” “Well, I get through the day,” and “I feel safe in my apartment when I can lock the door but nowhere else.” These comments captured a compromised form of safety to which the residents had habituated. Those who experienced low-grade safety also described experiencing persistent loneliness, emotional withdrawal, and a sense of stagnation. Their narratives often included references to visible substance use in the building, an ongoing survival-oriented mindset, and a deep cynicism about systemic change or personal progress.
In the cases of low-grade safety, the residents also described their physical environments in ways that highlighted a lack of comfort, connection, and choice. Spaces in the building were often described as uncomfortable or uninviting, lacking social support networks, and an absence of perceived control throughout the building outside of their personal apartments. Specifically, the residents noted limited access to daylight, dark and narrow hallways, and a lack of visual access in communal areas. Institutional aesthetics—such as acoustic ceiling tiles, blank white walls, and harsh fluorescent lighting—contributed to an impersonal atmosphere that further diminished the residents’ sense of belonging.
In contrast, some of the residents from the TID buildings spoke about experiencing high-grade safety, characterized by a deeper sense of comfort, trust, and personal agency. This experience was often accompanied by sentiments recalling that “They really look out for you here” and “I feel good and comfortable everywhere in the building.” The residents in these environments described how they are able to give back to their community, engage in hobbies, and return to work or school.
In the case of high-grade safety, the residents also highlighted specific physical elements in their environment, noting a sense of physical and psychological security, identifying places of beauty, and pointing out a variety of spaces throughout the building that foster social connection.
Safety also appears to be deeply interdependent with the presence of comfort, connection, and choice. In other words, descriptions of low-grade safety were accompanied by low-grade experiences of comfort, connection, and choice. Alternatively, when the residents reported high-grade safety, they described high-grade experiences of comfort, connection, and choice. When comfort, connection, or choice were independently compromised, one’s sense of safety was also described in a compromised or lower-quality way.
Notably, the residents in all the buildings reported experiences of low-grade safety, but only the participants residing in the TID buildings reported high-grade safety. This highlights the potential of trauma-informed environments to not only promote high-grade experiences of safety, comfort, connection, and choice but to foster the outcomes that accompany those experiences, including future thinking, elevated self-worth, and an enhanced sense of dignity.
3.4.2. Comfort
Comfort emerged as an often under-articulated component of resident and staff experiences in PSH, operating both as a sensory condition and a psychological state. Comfort broadly describes opportunities for emotional regulation, elements of joy and beauty, and a sense of being welcomed into a space. Among the participants, its absence often signaled more than mere physical inconvenience—it marked environments as indifferent, institutional, or even hostile.
In resident narratives, comfort was often framed through descriptions of space as being either “welcoming,” “stressful,” or “peaceful.” Those residing in the non-TID buildings frequently described their units and shared spaces as sterile, dark, or loud—conditions that inhibited relaxation and regulation. Long, narrow hallways with little daylight, institutional finishes, and uninviting communal areas made it difficult for the residents to feel at ease in their surroundings. In some cases, this discomfort extended into private units, where inadequate lighting, poor soundproofing, or tight quarters left the residents feeling physically and emotionally unsettled.
By contrast, the residents in TID buildings more frequently used language associated with warmth, beauty, and hominess. They spoke of spaces that “felt good to be in” or “looked like someone cared,” noting how big windows, natural light, and nice furniture and finishes contributed to a feeling of psychological ease. These residents described engaging in creative or identity-affirming activities, such as art, music, or gardening—experiences directly tied to the physical environment’s ability to support such engagements.
3.4.3. Connection
Connection was another major theme, revealing significant differences in how the residents engaged with others and with shared spaces. While the residents across all the buildings primarily spent time in their individual units, this behavior carried different meanings depending on the context. In the non-TID buildings, staying in one’s apartment was often framed as a form of self-protection, as the residents felt the need to “keep to themselves,” avoid potential conflict, and disengage from a community with whom they did not associate. In contrast, the residents in the TID buildings described a more voluntary form of retreat into a space of personal respite and delight. These residents were also more likely to participate in communal activities, such as connecting with fellow residents over puzzles, sharing a meal in the community kitchen, or engaging in informal activities, like bicycle repair.
Of the available communal spaces, the outdoor spaces across all the sites—particularly the designated smoking areas—were the most frequented and were often cited as the main source of socialization in one’s day. In addition, the strongest social ties were often described as coalescing around specific shared life experiences, such as parenthood, age, or faith, highlighting the strength of cultural or tribal affiliations in PSH community building.
A recurring theme across the interviews at both the TID and the non-TID sites was the stress associated with both extremes of social exposure, including the overstimulation resulting from too much interaction and the isolation resulting from too little interaction. While connection was described as a major source of comfort and a sense of belonging for some, it was named as a key source of anxiety and distress for others. Loud neighbors, unpredictable interactions, and limited acoustic privacy were common complaints in communal environments, often prompting the residents to withdraw. On the other end of the spectrum, long stretches of isolation, especially when combined with feelings of discomfort and a lack of control over one’s space, were described as enhancing feelings of loneliness and depression.
3.4.4. Choice
Choice, closely tied to the concepts of autonomy and control, emerged as a powerful determinant of the residents’ well-being. Choice in their environment related to the ability of the residents to navigate and use spaces independently, access areas beyond their apartments, personalize shared environments, and understand how building policies would be enforced. The physical and operational aspects of the buildings significantly shaped these experiences. Key points of control, such as the front desk, security and surveillance systems, and entryway protocols influenced how the residents interpreted their autonomy and whether they felt protected or restricted.
When the residents felt they had choice and control, they often expressed trust in the staff, alignment with building policies, and a greater sense of community ownership. They described rules as consistent and fair and viewed systems, such as secure entry points and surveillance, as protective, rather than punitive. In contrast, when the residents felt they lacked choice and control within the environment, they often described feeling disempowered or dissatisfied with the building’s “punitive” rules. They reported lower levels of trust in the staff and security systems, expressing sentiments such as “This isn’t my building” or “I just want to get out of here.” Strict visitor policies, in particular, provoked a range of reactions across all the sites, illustrating the tension between personal freedom and collective safety.
3.4.5. Staff Perspectives
The staff’s perspectives echoed many of the experiences shared by the residents, particularly regarding the emotional and operational impact of the physical environment. The staff working in buildings they described as “welcoming” and “beautiful” highlighted that the space itself supported their ability to form positive relationships (for example, creating inspired spaces to gather and deliver a range of programming) and de-escalate tension (for example, offering open sightlines and adequate breathing room in concentrated areas). At the same time, the staff in both the TID and the non-TID buildings noted that PSH presents complex dynamics and, in times of chaos, it often feels overwhelming. Further, the staff are expected to manage the residents’ needs, often without adequate staffing, training, or procedural support.
Operational systems, such as 24/7 security, clear lines of sight, functional surveillance, and a strong sense of community, contributed significantly to the staff’s reported sense of personal safety and authority. When these systems were lacking or inconsistent, the staff described difficulties establishing and maintaining trust with the residents, particularly around sensitive issues, like visitor management. The inconsistent enforcement of policies led to perceptions of unfairness or neglect, further eroding community cohesion.
Ultimately, the interview findings demonstrate that safety is deeply intertwined with comfort, connection, and choice, and that these experiences are greatly influenced by a building’s design. Furthermore, a sense of safety, comfort, connection, and choice in one’s environment influences feelings of dignity. These findings reinforce the importance of TID in shaping not only safer spaces but environments where people can experience a fuller sense of personhood.
4. Discussion
This study tested whether the residents of TID PSH experience improved health and well-being as compared to the residents living in non-TID PSH. The quantitative and qualitative findings paint contrasting, yet complementary, pictures. The quantitative data indicate declines in several aspects of health and well-being among the TID residents, while the qualitative results reveal a more nuanced experience of safety and comfort within the TID buildings. Together, these findings underscore the complex and dynamic nature of PSH residency, where safety, conflict, and social relationships evolve over time for both the residents and the staff.
One key finding from the study is the seemingly paradoxical high-grade safety reported qualitatively by the residents in the TID buildings that was accompanied by increases in reported conflicts and aggression, as well as a decline in compassion, for others. While initially counterintuitive, member-checking sessions, which took place at the conclusion of the study, provided crucial interpretive insights. The residents and the staff frequently noted that as individuals begin to feel safer and more settled, they are more willing—and more able—to express their needs, frustrations, and boundaries. This can lead to interpersonal conflict, particularly in PSH contexts where the residents are navigating not only the stressors of past trauma and chronic homelessness but also the challenge of living around others facing similar difficulties. Such complexity reflects a trajectory in communal life where safety becomes the precondition for deeper social engagement, including both positive connection and inevitable tensions.
The qualitative findings demonstrate that safety emerges on a spectrum and is interdependent with comfort, connection, and choice, in which compromising or enhancing any one of these factors directly compromises or enhances an overall experience of safety and, thereby, dignity. Furthermore, these experiences are greatly influenced by the design of the surrounding environment, reinforcing the importance of trauma-informed design in shaping not only safer spaces but environments where people can experience a fuller sense of personhood.
A notable methodological consideration in interpreting the findings is the difference in the length of residency between the TID and the non-TID groups. The non-TID residents had been housed in their buildings for an average of 52 months, compared to just 12 months for those in TID PSH. Notably, the TID buildings were new, whereas both of the non-TID sites had been open for over a decade. The discrepancy in the length of residency may partially explain the reported outcomes, particularly the lower levels of physical ease (e.g., sleep quality and body sensation) among the TID participants. What appears to be poorer physical ease could instead reflect a natural acclimatization process, where increased time in housing brings not only familiarity and ownership but also more awareness of stressors. Time itself, then, may be a critical factor in how trauma-informed environments are experienced, and time itself is a confounding variable in the study.
The qualitative themes further emphasize the challenges faced by the residents in the first few years of PSH residency. During member-checking sessions, the residents and the staff alike emphasized that the initial years in PSH are regularly marked by instability, chaos, and adjustment—not only for the residents but for the frontline staff as well. Many of the staff noted that establishing a strong foundation of staffing stability and interpersonal relationships is essential before the benefits of TID can be fully realized. This was a recurring theme raised in member-checking sessions, highlighting that while the built environment matters, it must be embedded within a larger ecosystem of consistent, compassionate care and management practices.
The compilation of these discussion points suggest the necessity of attending to time, relationships, and context in TID evaluation. The process of “settling in” to PSH is likely not merely about physical placement but also developing a sense of safety, belonging, and identity within one’s environment. Future research should consider longitudinal studies to better capture the evolving nature of PSH residents’ experiences and the ways in which TID buildings foster (or hinder) a culture of home over time. Understanding these developmental processes will be essential for refining both architectural design and supportive housing practices.
Limitations
This study is the first of its kind, assessing the impact of TID on people formerly experiencing homelessness and moving into PSH and offering valuable contributions to the field. However, several limitations should be considered.
First, the differences observed between the participants at the TID and the non-TID sites may reflect variations in their length of residency, rather than the effects of TID itself. On average, the non-TID residents had lived in PSH for over four years, while the TID residents had been housed for less than one year. Thus, the health outcomes measured may be influenced by the degree to which the residents had adjusted to or stabilized in their housing environments.
Second, the low follow-up survey response rate among the non-TID participants may have introduced a bias, potentially affecting the reliability of the longitudinal comparisons.
Third, changes in health and well-being may require longer than the 12-month study period to become evident. It is possible that the measurable improvements associated with TID emerge only after the residents have spent several years in supportive housing.
Finally, isolating the specific influence of the built environment on resident outcomes remains challenging. The effects of physical design are difficult to disentangle from those of staff relationships, the quality of service delivery, the neighborhood context, and other environmental factors.
Taken together, these limitations highlight the need for further research using larger samples, longer longitudinal designs, and mixed-method approaches to better understand the impacts of TID in supportive housing.
5. Conclusions
As communities continue to address the complex challenges of homelessness, PSH design must move beyond basic shelter to become an active agent in health and well-being. This study contributes early empirical evidence that TID can play a meaningful role in shaping health and well-being outcomes for people transitioning from homelessness into PSH. Findings suggest that when design intentionally supports safety, comfort, connection, and choice, the residents are more likely to report an enhanced sense of belonging, agency, and dignity—experiences that are essential for long-term stability and recovery from trauma.
While the physical environment alone cannot resolve the deep structural and social inequities that contribute to homelessness, it remains a vital part of a comprehensive response. Trauma-informed environments, when paired with stable staffing and compassionate operational practices, have the potential to transform PSH from a place of survival to a place of healing and growth. As TID gains momentum in architecture, housing, and public health, future research should build on this foundational work to better understand how design interacts with social systems over time. Doing so will help ensure that supportive housing is not only accessible but restorative—and that every person who moves into housing has the opportunity to feel safe, supported, and truly at home.
Author Contributions
Conceptualization, D.B., R.M., B.M., and J.W.; methodology, D.B., R.M., and J.W.; validation, D.B. and B.M.; formal analysis, D.B., R.M., B.M., and J.W.; investigation, D.B., R.M., B.M., and J.W.; data curation, R.M. and B.M.; writing—original draft preparation, D.B., R.M., B.M., and J.W.; writing—review and editing, D.B., R.M., B.M., and J.W.; visualization, D.B., R.M., B.M., and J.W.; project administration, D.B., R.M., B.M., and J.W.; funding acquisition, D.B. and J.W. All authors have read and agreed to the published version of the manuscript.
Funding
This research was funded by the Kaiser Foundation funding #38362A and the Sozosei Foundation funding #38336A.
Institutional Review Board Statement
The study was conducted in accordance with the Declaration of Helsinki and approved by the Institutional Review Board of the University of Denver (protocol 1976302-4 on 3 January 2023).
Informed Consent Statement
Informed consent was obtained from all the subjects involved in the study.
Data Availability Statement
The data presented in this study are available on request from the corresponding author due to the privacy of the subjects being promised in the consenting process.
Acknowledgments
We would like to acknowledge the contributions of all the study partners that made this research possible. Our study partners include, but are not limited to, the staff and the residents at the following permanent supportive housing sites: Cornerstone Apartments, Mason Place, Rhonda’s Place, The Suites, and Valor on the Fax. Further partners also include the staff at the University of Denver and Shopworks Architecture.
Conflicts of Interest
The authors declare no conflicts of interest.
Abbreviations
The following abbreviations are used in this manuscript:
| PSH | permanent supportive housing |
| TID | trauma-informed design |
Appendix A
Appendix A.1. Description of Scales
Appendix A.1.1. Attention
Attention is assessed using nine items from the Attentional Function Index (Cimprich et al. 2011). The prompt asks, “At this time, how well do you feel you are functioning in each of the areas below?” Items assess the ability to start and follow through on activities, perform tasks requiring effort, make decisions, maintain focus, remember tasks, listen attentively, control impulses, and demonstrate patience. Responses are rated on a 1–10 scale, where 1 means “not at all” and 10 means “extremely well”. Higher scores indicate greater attentional functioning. The Cronbach’s alpha for the attention scale at baseline is 0.90.
Appendix A.1.2. Attention (Self)
An additional four items from the Attentional Function Index measure self-perceived attentional difficulties. The participants are prompted, “At this time, how would you rate yourself on the following?” Items include difficulty concentrating on details, frequency of mistakes, forgetfulness, and irritability. Responses are rated on a 1–10 scale, where 1 means “not at all” and 10 means “a great deal”. Higher scores reflect greater attentional difficulties. The Cronbach’s alpha score at baseline is 0.83.
Appendix A.1.3. Body Pain
Body pain is measured using two items from the MOS 36-Item Short-Form Health Survey (SF-36) (Ware and Sherbourne 1992): “How much bodily pain have you had during the last month?” and “During the last month, how much did pain interfere with your normal daily activities?” Responses are rated on a 1–6 scale, with 1 indicating no pain and 6 indicating very severe pain. Higher scores represent more pain and greater interference with daily activities. The Cronbach’s alpha score at baseline is 0.89.
Appendix A.1.4. Conflict
Conflict is measured using the Conflict Tactics Scale (Kuo and Sullivan 2001). The participants are prompted, “Rate how often you have acted in these ways in this building in the past 6 months.” Items assess a range of behaviors including verbal aggression, passive resistance, physical aggression, and the use of weapons. Examples include insulting or swearing, sulking, slamming doors, threatening or using physical violence, and the use of weapons. Responses are rated on a 1–5 scale, where 1 means “never” and 5 means “all the time”. Higher scores indicate more frequent conflict behaviors. The Cronbach’s alpha score at baseline is 0.93. Subscales include psychological aggression (Cronbach’s alpha score is 0.85), physical aggression (Cronbach’s alpha score is 0.97), mild violence (Cronbach’s alpha score is 0.92), and severe violence (Cronbach’s alpha score is 0.95).
Appendix A.1.5. Emotional Well-Being
Emotional well-being is assessed using 16 items: 7 from the Generalized Anxiety Disorder scale (GAD-7) (Spitzer et al. 2006) and 9 from the Patient Health Questionnaire (PHQ-9) (Kroenke et al. 1999). Both use the prompt, “Over the last two weeks, how often have you been bothered by any of the following problems?” The GAD-7 measures symptoms such as nervousness, inability to control worry, restlessness, and irritability. The PHQ-9 assesses depressive symptoms, such as anhedonia, sadness, sleep disturbance, fatigue, appetite changes, low self-worth, concentration difficulties, and suicidal ideation. Responses are scored on a 0–3 scale, where 0 means “not at all” and 3 means “nearly every day”. Higher scores indicate greater anxiety or depression and, thus, lower emotional well-being. The Cronbach’s alpha score at baseline is 0.94.
Appendix A.1.6. Hope
Hope is measured using eight items from the Hope Scale (Snyder et al. 1996). The prompt asks, “How true or false are the following statements?” Responses are scored on a 1–8 scale, where 1 means “definitely false” and 8 means “definitely true”. Items include “I can think of many ways to get out of a jam,” “I energetically pursue my goals,” and “I meet the goals that I set for myself.” Higher scores indicate greater hope. The Cronbach’s alpha score at baseline is 0.86. Subscales include pathways, which describes planning to accomplish goals, (Cronbach’s alpha score at baseline is 0.75) and agency, which describes goal-directed motivation (Cronbach’s alpha score at baseline is 0.81).
Appendix A.1.7. Housing Safety and Welcome
Two items assess the residents’ sense of safety and welcome: “On a scale of 1 to 10, where 1 is not safe at all and 10 is completely safe, how safe do you feel at this building?” and “On a scale of 1 to 10, where 1 is not welcome at all and 10 is completely welcome, how welcome do you feel at this building?” Higher scores indicate greater perceived safety and welcome. The Cronbach’s alpha score at baseline is 0.73
Appendix A.1.8. Perception of Health
Perceived health is measured with four items from the SF-36 (Ware and Sherbourne 1992): “I seem to get sick a little easier than other people,” “I am as healthy as anybody I know,” “I expect my health to get worse,” and “My health is excellent.” Responses are scored on a 1–5 scale, where 1 means “definitely true” and 5 means “definitely false”. Lower scores reflect a more positive perception of health. The Cronbach’s alpha score at baseline is 0.70.
Appendix A.1.9. Psychological Safety
Psychological safety is assessed using 29 items from the Neuroception of Psychological Safety Scale (NPSS) (Morton et al. 2024). The participants are asked, “Rate how well the following statements describe your feelings over the past week.” Items include statements about feeling valued, understood, cared for, and physically calm. Responses are scored on a 1–5 scale, where 1 means strongly disagree and 5 means strongly agree. Higher scores indicate greater psychological safety. The Cronbach’s alpha score at baseline is 0.94. Subscales include social engagement (Cronbach’s alpha score at baseline is 0.93), compassion (Cronbach’s alpha score at baseline is 0.86), and body sensations (Cronbach’s alpha score at baseline is 0.92).
Appendix A.1.10. Relationships
Relationship quality is measured using subscales from the Neighborhood Social Ties (NST) Scale (Kuo et al. 1998) and an additional indicator developed by the University of Denver’s Center for Housing and Homelessness Research (who conducted this study) CHHR. All items are scored on a 0–4 scale, where 0 means “not at all” and 4 means “very much”. Subscales include nearby neighbors (Cronbach’s alpha score at baseline is 0.87) (e.g., “How well do you know the people next door?”); a local sense of community (Cronbach’s aAlpha score at baseline is 0.73) (e.g., “Do people here acknowledge one another when passing in the hallway?”); and general social ties (Cronbach’s alpha score at baseline is 0.61) (e.g., “Are you content with the number of close friends you have?”). Higher scores indicate stronger social ties and better relationships. The Cronbach’s alpha score at baseline is 0.79.
Appendix A.1.11. Sleep and Health
Three items assess sleep and physical health. Sleep duration is assessed with the following prompt: “Thinking about the past week, on average, how many hours of sleep did you get in each 24-h period?” Sleep quality is assessed with the following prompt: “How would you rate the quality of your sleep?” (0 = terrible to 10 = excellent). Physical health is assessed with the following prompt: “How would you rate your overall physical health?” (0 = terrible to 10 = excellent). Higher scores reflect longer sleep duration, greater sleep quality, and better physical health.
Appendix A.1.12. Stress
Stress is assessed using six items from the Positive Mood subscale of the Profile of Mood States (POMS) (McNair et al. 1971). The participants are prompted, “Read each word below and rate how you have been feeling in the past week.” Items include lively, active, energetic, cheerful, full of pep, and vigorous. Responses are scored on a 0–4 scale, where 0 means not at all and 4 means extremely. Higher scores represent a more positive mood and, consequently, lower levels of stress. The Cronbach’s alpha score at baseline is 0.95.
Appendix A.2. Resident Interview Protocol
- Tell us about your experience in this building. How long have you been living here? How has it been so far? [rapport building and some context … can probe more questions if it’s fitting to make resident comfortable chatting]
- Probe: What were your first impressions?
- Probe: What was it like meeting staff?
- Probe: Did you make any immediate connections with neighbors/community members?
- Probe: In the early days did you hang out anywhere besides your apartment? Where/why?
- What parts of the building do you find yourself spending time in?
- Probe: What are you doing in those spaces? (i.e., socializing, relaxing, working, etc.)
- Probe: what is it about those parts of the building that help you (socialize, relax, work, etc.)
- Have you made good/positive connections with others in the building? (i.e., friends/people you can trust)
- Probe: How did you meet?
- Probe: Where do you hang out? What activities do you do there?
- Probe: What would be helpful in supporting your current or other connections in the building?
- Do you generally feel safe in the building?
- Probe if “yes”:
- Are there any places in the building that feel unsafe? Or that others may find unsafe? Places you avoid or dread going to?
- Probe if “no”:
- What places in particular feel unsafe? (or is it a general feeling)?
- Why? … What do you think it is about those spaces that make them feel unsafe?
- Are there any “hot spots” in the building? (i.e., places that you know of where people often have conflict?)
- Probe: What do you think it is about those areas?
- Are there parts of this building that help you to feel relaxed/restored?
- Probe: Can you tell me about those spaces? What about them makes you feel that way?
- Probe: Are there other spaces needed to make you feel more relaxed/restored?
- Are there parts of this building that help you to feel active/energized?
- Probe: Can you tell me about those spaces? What about them makes you feel that way?
- Probe: Are there other spaces needed to make you feel more active/energized?
- Do you feel that living in this building has impacted your health? (We think of ‘health’ as encompassing physical health—ex. Feeling active or inactive, accessibility, chronic conditions—as well as mental health—ex. feeling lonely, depressed, anxious.)
- Probe: How so?
- Probe: What about feelings of stress? Depression?
- Do you feel you’re better able to cope with life’s stressors since moving into this building? (ex. to manage a job, to maintain good relationships, to navigate programs/services, etc.)
- Probe: Please explain, or give examples?
- Do you feel more hopeful since moving into this building? (about life/your circumstances/your future)
- Probe: Can you tell me what you mean, or give me examples?
- This study looks at how buildings may or may not influence people’s interaction with police and the law. Can you tell me about that?
- Probe: Do you think this building (the layout, design, anything) has influenced your experience with police and the law?
- Probe: Do you think it has influenced other’s experiences?
- Is there anything else you’d like to share about your experience in this building?
References
- Adler, Kevin F., Donald W. Burnes, Amanda Banh, and Andrijana Bilbija. 2023. When We Walk By: Forgotten Humanity, Broken Systems, and the Role We Can Each Play in Ending Homelessness in America. Berkeley: North Atlantic Books. [Google Scholar]
- Ajeen, Rawan, Dana Ajeen, Jennifer P. Wisdom, Jeffrey A. Greene, Tina Lepage, Charlotta Sjoelin, Tasha Melvin, Tracey E. Hagan, Kelly F. Hunter, Ava Peters, and et al. 2023. The Impact of Trauma-Informed Design on Psychological Well-Being in Homeless Shelters. Psychological Services 20: 680–89. [Google Scholar] [CrossRef] [PubMed]
- Berens, Michael J. n.d. Design Resources for Homelessness—A Review of Research: Designing the Built Environment for Recovery from Homelessness. Available online: https://www.designresourcesforhomelessness.org/_files/ugd/48961a_029199af6a584ccba0be5d8cd578df0e.pdf (accessed on 10 March 2025).
- Bittencourt, Moema Bragança, and Maria Inês Amaro. 2019. Social work, human rights and conceptions of human dignity: The case of social workers in Lisbon. Portuguese Journal of Social Science 18: 341–58. [Google Scholar] [CrossRef]
- Brisson, Daniel, Chad Holtzinger, Rachelle Macur, Laura Rossbert, Stephanie Rachel Speer, and Jennifer Wilson. 2023. Designing for Healing, Dignity & Joy (v2): Iterating on the Trauma Informed-Design Framework. Denver: Shopworks Architecture. Available online: https://shopworksarc.com/wp-content/uploads/2023/06/2023-TID-Framework-v3.pdf (accessed on 6 June 2024).
- Cimprich, Bernadine, Moira Visovatti, and David L. Ronis. 2011. The attentional function index—A self-report cognitive measure. Psycho-Oncology 20: 194–202. [Google Scholar] [CrossRef] [PubMed]
- Design Resource for Homelessness, United Charitable. n.d. Home. Design Resources for Homelessness: An Online Knowledge Solution. Available online: https://www.designresourcesforhomelessness.org/ (accessed on 3 December 2024).
- Evans, William N., David C. Phillips, and Krista Ruffini. 2021. Policies to reduce and prevent homelessness: What we know and gaps in the research. Journal of Policy Analysis and Management 40: 914–63. [Google Scholar] [CrossRef]
- Faerden, Ann, Christine Rosenqvist, Mats Hakansson, Eline Strom-Gundersen, Ashild Stav, Jan Svartsund, Trude Rossaeg, Nils Davik, Elfrida Kvarstein, Geir Pedersen, and et al. 2023. Environmental transformations enhancing dignity in an acute psychiatric ward: Outcome of a user-driven service design project. HERD: Health Environments Research & Design Journal 16: 55–72. [Google Scholar] [CrossRef]
- Gallagher, Ann. 2004. Dignity and respect for dignity—Two key health professional values: Implications for nursing practice. Nursing Ethics 11: 587–99. [Google Scholar] [CrossRef] [PubMed]
- Hopper, Kim, Marybeth Shinn, Eugene Laska, Morris Meisner, and Joseph Wanderling. 2008. Estimating numbers of unsheltered homeless people through plant-capture and post count survey methods. American Journal of Public Health 98: 1438–42. [Google Scholar] [CrossRef] [PubMed]
- Kroenke, Kurt, Robert L. Spitzer, Janet B. W. Williams, and Bernd Löwe. 1999. Patient Health Questionnaire-9 (PHQ-9). Washington: American Psychological Association, APA PsycTests. [Google Scholar] [CrossRef]
- Kuo, Frances E., and William C. Sullivan. 2001. Aggression and violence in the inner city: Effects of environment via mental fatigue. Environment and Behavior 33: 543–71. [Google Scholar] [CrossRef]
- Kuo, Frances E., William C. Sullivan, Rebekah Levine Coley, and Liesette Brunson. 1998. Fertile ground for community: Inner-city neighborhood common spaces. American Journal of Community Psychology 26: 823–51. [Google Scholar] [CrossRef]
- McNair, Douglas M., Maurice Lorr, and Leo F. Droppleman. 1971. Profile of Mood States (POMS). San Diego: Educational & Industrial Testing Service. [Google Scholar]
- Metro Denver Homelessness Initiative. 2024. Available online: https://www.mdhi.org/data (accessed on 6 June 2025).
- Morton, Liza, Nicola Cogan, Jacek Kolacz, Calum Calderwood, Marek Nikolic, Thomas Bacon, Emily Pathe, Damien Williams, and Stephen W. Porges. 2024. A new measure of feeling safe: Developing psychometric properties of the Neuroception of Psychological Safety Scale (NPSS). Psychological Trauma: Theory, Research, Practice, and Policy 16: 701–8. [Google Scholar] [CrossRef] [PubMed]
- National Health Care for the Homeless Council. 2019. Homelessness & Health: What’s the Connection? Available online: https://nhchc.org/resource/homelessness-health-whats-the-connection/ (accessed on 25 March 2023).
- National Law Center on Homelessness & Poverty. 2017. Don’t Count on It: How the HUD Point-in-Time Count Underestimates the Homelessness Crisis in America. Available online: https://homelesslaw.org/wp-content/uploads/2018/10/HUD-PIT-report2017.pdf (accessed on 6 June 2025).
- Owen, Ceridwen, and James Crane. 2022. Trauma-Informed Design of supported housing: A scoping review through the lens of neuroscience. International Journal of Environmental Research and Public Health 19: 14279. [Google Scholar] [CrossRef] [PubMed]
- Pable, Jill, Yelena McLane, and Lauren Trujillo. 2021. Homelessness and the Built Environment: Designing for Unhoused Persons, 1st ed. London: Routledge. [Google Scholar] [CrossRef]
- Perkins & Will. 2021. Healthy Affordable Housing: The Toolkit: Sharing Lessons Learned from the Pandemic to Improve Affordable Housing. Washington: American Society of Interior Designers. [Google Scholar]
- Perron, Jeff L., Kristin Cleverley, and Sean A. Kidd. 2014. Resilience, loneliness, and psychological distress among homeless youth. Archives of Psychiatric Nursing 28: 226–29. [Google Scholar] [CrossRef] [PubMed]
- Pless, Nicola M., Maak Thomas, and Harris Howard. 2017. Art, Ethics and the Promotion of Human Dignity. Journal of Business Ethics 144: 223–32. [Google Scholar] [CrossRef]
- Preservation of Affordable Housing [POAH]. 2023. What Is Trauma-Informed Design? A Toolkit for Advancing Equity and Economic Opportunity in Affordable Housing. Available online: https://traumainformedhousing.poah.org/what-is-trauma-informed-design (accessed on 16 February 2025).
- Rollings, Kimberly A., and Christina S. Bollo. 2021. Permanent supportive housing design characteristics associated with the mental health of formerly homeless adults in the U.S. and Canada: An integrative review. International Journal of Environmental Research and Public Health 18: 9588. [Google Scholar] [CrossRef] [PubMed]
- Roncarati, Jill S., Travis P. Baggett, James J. O’Connell, Stephen W. Hwang, E. Francis Cook, Nancy Krieger, and Glorian Sorensen. 2018. Mortality among unsheltered homeless adults in Boston, Massachusetts, 2000–2009. JAMA Internal Medicine 178: 1242–48. [Google Scholar] [CrossRef] [PubMed]
- Snyder, C. Rick, Susie C. Sympson, Florence C. Ybasco, Tyrone F. Borders, Michael A. Babyak, and Raymond L. Higgins. 1996. Development and validation of the State Hope Scale. Journal of Personality and Social Psychology 70: 321–35. [Google Scholar] [CrossRef] [PubMed]
- Spitzer, Robert L., Kurt Kroenke, Janet B. W. Williams, and Bernd Löwe. 2006. Generalized Anxiety Disorder 7 (GAD-7). Washington: American Psychological Association, APA PsycTests. [Google Scholar] [CrossRef]
- Substance Abuse and Mental Health Services Administration (SAMHSA). 2014. SAMHSA’s Concept of Trauma and Guidance for a Trauma-Informed Approach. Available online: https://library.samhsa.gov/sites/default/files/sma14-4884.pdf (accessed on 6 June 2025).
- Swope, Carolyn B., and Diana Hernández. 2019. Housing as a determinant of health equity: A conceptual Model. Social Science & Medicine 243: 112571. [Google Scholar]
- U.S. Department of Housing and Urban Development. 2024. 2024 Annual Homelessness Assessment Report: Part 1: Point-in-Time (PIT). Available online: https://www.hud.gov/sites/dfiles/OCHCO/documents/2023-11cpdn.pdf (accessed on 1 May 2025).
- Ware, John E., and Cathy Donald Sherbourne. 1992. The MOS 36-item Short-Form Health Survey (SF-36): I. Conceptual framework and item selection. Medical Care 30: 473–83. [Google Scholar] [CrossRef] [PubMed]
Disclaimer/Publisher’s Note: The statements, opinions and data contained in all publications are solely those of the individual author(s) and contributor(s) and not of MDPI and/or the editor(s). MDPI and/or the editor(s) disclaim responsibility for any injury to people or property resulting from any ideas, methods, instructions or products referred to in the content. |
© 2025 by the authors. Licensee MDPI, Basel, Switzerland. This article is an open access article distributed under the terms and conditions of the Creative Commons Attribution (CC BY) license (https://creativecommons.org/licenses/by/4.0/).