1. Introduction
Evidence is available for the physical and mental health benefits of regular physical activity. Physical activity is an effective tool for emotion regulation and stress management. Regular physical activity improves mood and reduces symptoms of depression and anxiety (
Martín-Rodríguez et al. 2024;
Alam and Rufo 2019;
Ashdown-Franks et al. 2017). The findings of
Rocliffe et al. (
2024) support the beneficial effects of physical activity on adolescents’ mental health and well-being.
Buecker et al. (
2021) demonstrated the positive impact of extracurricular physical activity on mental health. Nevertheless, regular physical activity declines throughout life, and adolescence is the period when this decline is most pronounced. Based on the recommendations of the WHO, an average of 60 min per day of moderate- to vigorous-intensity aerobic physical activity among children and adolescents provides health benefits (
Bull et al. 2020;
World Health Organization 2020).
Despite these recommendations, global and national trends show a steady decline in adolescent physical activity. According to the
World Health Organization (
2020), more than 80% of adolescents worldwide do not meet the recommended daily levels of moderate to vigorous physical activity. This trend is alarming, as adolescence is a critical period for developing long-term health behaviors. In Hungary, the 2022 HBSC report indicates that both perceived teacher and peer support have declined significantly since 2018, mirroring a broader decline in student well-being and physical activity engagement (
Németh et al. 2024).
These patterns highlight the urgent need to understand and address the psychosocial factors that can support or hinder physical activity in this age group.
The social support of parents significantly increased the chance of Brazilian adolescents exercising moderately for 2 h, 5 h and 7 h per week (46.7–47.8–45.5%) than support from friends (23.8–23.6–21.2%) (
De Camargo et al. 2023). Based on the results of a survey conducted among Turkish adolescents, the perceived parental influence significantly increased the frequency of regular physical activity among young people, which indirectly also increased the level of satisfaction with the activity (
Aydın and Solmaz 2024). The correlation between the responses given by Mexican adolescents regarding their parents’ regular physical activity and their children’s physical activity was confirmed, which was demonstrated in relation to both parents in the case of girls, and their mothers in the case of boys (
Sánchez-Zamorano et al. 2019). The physical activity of Brazilian adolescents (n = 2361, average age 16.4 years) showed a direct correlation in the case of fathers in boys, and in the case of mothers in girls. However, an indirect relationship was demonstrated between the physical activity of both parents and friends and adolescents through the modeling of behavior and the provision of social support (
Cheng et al. 2014;
Mendonça and Farias Júnior 2015) and it was concluded, in their study among Brazilian 14–19-year-olds, (
n = 2859) that, based on gender and age, the type of social support related to physical activity (encouragement, joint participation, attention, invitation, positive feedback and travel help/joint trip) and its source (family or friends) resulted in different effects. For 17–19-year-olds, support from friends was mainly for boys, while family priority was decisive for 14–16-year-olds, mainly for girls. Regarding the type of support, in the case of 17–19-year-olds, for both genders, joint participation was associated with the regularity of physical activity, while among 14–16-year-olds, encouragement for girls and positive feedback for boys. In their research,
Chiarlitti and Kolen (
2017), based on their results obtained from pedometer data, found no relationship between children’s daily physical activity level and parental factors, including parents’ physical activity, support/encouragement and restrictions. Based on the opinion of the researchers, the lack of significant relationships between the variables means that more complicated interactions occur between children and their parents in connection with the modeling of physical activity. In the case of adolescents living in a Polish city, a positive relationship was revealed between support from parents, teachers and peers and physical activity (
Pluta et al. 2020). In the case of a survey conducted among African American adolescents, a relationship between physical activity and peer support was found only in boys (
Haidar et al. 2019).
One part of the effects of physical activity is important from a physiological point of view, since regular movement—including both organized physical activities and everyday physical activity—has countless beneficial effects on health. From a psychological point of view, many positive effects can be mentioned in terms of sports activities practiced at an optimal level, and it also improves social skills. The appearance and persistence of positive effects can only be achieved by exercising in the optimal quantity and quality. That is why it is crucial to identify the factors influencing physical activity, especially for children, which can have lifelong effects.
Based on the indicators of mental health used in the 2022 Hungarian HBSC study (
Németh et al. 2024), it can be stated that, compared to the 2018 data collection, there have been significant—mostly unfavorable—changes in young people’s subjective health across most indicators. The level of perceived teacher support among students in Hungary has been continuously declining, as has perceived peer support. Hungarian data are below the average of HBSC countries, which particularly justifies the periodic monitoring of underlying factors and the development of intervention programs based on the findings. Therefore, this study aimed to assess one aspect of mental health support by mapping psychosocial resources and physical activity to identify potential intervention points.
In order to better understand the contextual and environmental influences on adolescent behavior, our study also draws on concepts from Bronfenbrenner’s ecological systems theory and McLeroy’s socio-ecological model. Bronfenbrenner’s ecological systems theory emphasizes the layered influence of environmental systems on individual development, including the microsystem (e.g., family or school), mesosystem (interactions between microsystems), and exosystem (broader societal factors).
McLeroy’s socio-ecological model similarly posits that health behaviors are influenced by multiple levels, including intrapersonal factors, interpersonal relationships, institutional settings, the community context and public policy.
While Bronfenbrenner’s model focuses on the developmental context of the individual, McLeroy’s model is often applied in health behavior research to guide interventions. Including both frameworks allows us to better contextualize how family and school-based support systems shape physical activity habits in adolescents across multiple, interacting levels of influence.
These frameworks highlight the importance of family, school and broader social environments in shaping health behaviors, including physical activity. Although the present study is not a theory-testing work per se, these perspectives provide a conceptual lens for interpreting our findings and identifying avenues for future research (
McLeroy et al. 1988;
Bronfenbrenner 1979).
In our research, we examined the relationship between psychosocial resources (social support and school resources) and the intensity, regularity and quality of physical activity.
H1. We hypothesized that increasing social support is associated with more frequent and longer physical activity during leisure time.
H2. We hypothesized that increasing school resources have a positive effect on physical activity during leisure time (regularity and intensity).
2. Materials and Methods
We carried out our quantitative, cross-sectional research in Hungary, Western Transdanubia, in Vas and Zala counties, in public educational institutions providing full-time high-school education, after the consent of the school district and school principals.
The final sample consisted of 331 high-school students. The mean age of the participants was 16.79 years (SD = 0.79). Of the respondents, 34.2% were boys and 65.8% were girls. Participants represented diverse family backgrounds: 69.5% lived in two-parent families, 19.6% in single-parent families, 10.6% in restructured families and 0.3% in families without parents. Regarding parental education, 44.7% of mothers and 32.9% of fathers had a higher education degree. We informed the parents of the students concerned about the research in writing and asked for their passive consent. Before filling out the form, the students were also informed about their participation in the research, its purpose and ethical guidelines. Sampling was carried out by one-time convenience sampling within the target group (
Pakai and Kívés 2013). The primary sampling units were not the individual students, but the randomly selected classes (by systematic random method). All students of the selected classes were included in the survey. For the investigation, we had permission from 5 high schools, in which we had the opportunity to address 18 classes (
n = 331). In addition to assessing sociodemographic factors, the measurement tool used for our research included the HBSC (Health Behavior in School-aged Children) examining the health behavior of school-age children from a questionnaire on physical activity and school resources (
Németh and Költő 2016) and the MSPSS questionnaire for the subjective measurement of perceived social support. Demographic and sociological data were assessed using 7 questions, which were as follows: gender, age, place of residence, parents’ education and family structure. The MSPSS (Multidimensional Scale of Perceived Social Support) is a multidimensional scale for the subjective measurement of perceived social support, the purpose of which is to measure the perception of support from 3 sources: family, friends and significant others. The self-characteristic, self-completed questionnaire does not contain a reversed item. The questionnaire consists of 10 items: 4 statements are related to family, 3 statements are related to friends and 3 statements belong to the subfactor of significant others. Answers are given on a 5-point Likert-type scale. The score achieved on each scale is calculated by adding the items, and a total score can also be calculated, and the higher a person scores on a given factor, the higher the level of perceived social support (
Papp-Zipernovszky et al. 2017;
Zimet et al. 1988). Perceived social support at school (teachers and class community) was adapted from the HBSC research (
Németh and Költő 2016), which consisted of 3 questions each using a 5-point Likert scale. The range of the scale was 3–15 points, where a higher score meant higher perceived support. A value of 12 or above showed particularly high support. The questions examining the role of the school were taken from the measurement tool of the HBSC research, which measured the following areas: the students’ attitude towards school, the opinion about the school workload and the teachers’ assessment of the learning result (
Németh and Költő 2016). The statistical processing was carried out using version 22.0 of the IBM SPSS program package. In addition to descriptive statistical calculations, we used mathematical statistical methods to analyze our data (
t-test, ANOVA and χ
2 test with a significance level of
p < 0.05). The students completed the survey anonymously, which did not contain any information that could identify the students. After processing, the results were published only in aggregated form and the information about individuals was not published during the publication. Our research was carried out taking ethical compliance aspects into account. The processing and management of the data took place in accordance with the basic principles of the Helsinki Ethics Declaration (
Domján et al. 2014).
3. Results
3.1. Sample Presentation
In total, 34.2% of the respondents were boys and 65.8% were girls. The mean age was 16.79 years (SD = 0.79 years). The majority of students, 69.5%, lived in two-parent families, while 19.6% lived in single-parent families, 10.6% in restructured families and 0.3% in families without parents. Examining the education level of the parents, 44.7% of mothers and 32.9% of fathers had a higher education and the proportions were almost the same for secondary education, which characterized 43.2% of mothers and 44.1% of fathers. Examining the distribution according to the place of residence, the frequency of people living in the county seat (37.5%) and village/municipality (39.3%) was almost the same.
3.2. Physical Activity and Sociodemographic Variables
Based on the recommendation of the World Health Organization, at least 60 min of moderate-intensity physical activity per day is necessary for the 5–17-year-old age group, but there must also be vigorous-intensity physical activity at least three times a week, which strengthens muscles and bones (
World Health Organization 2010,
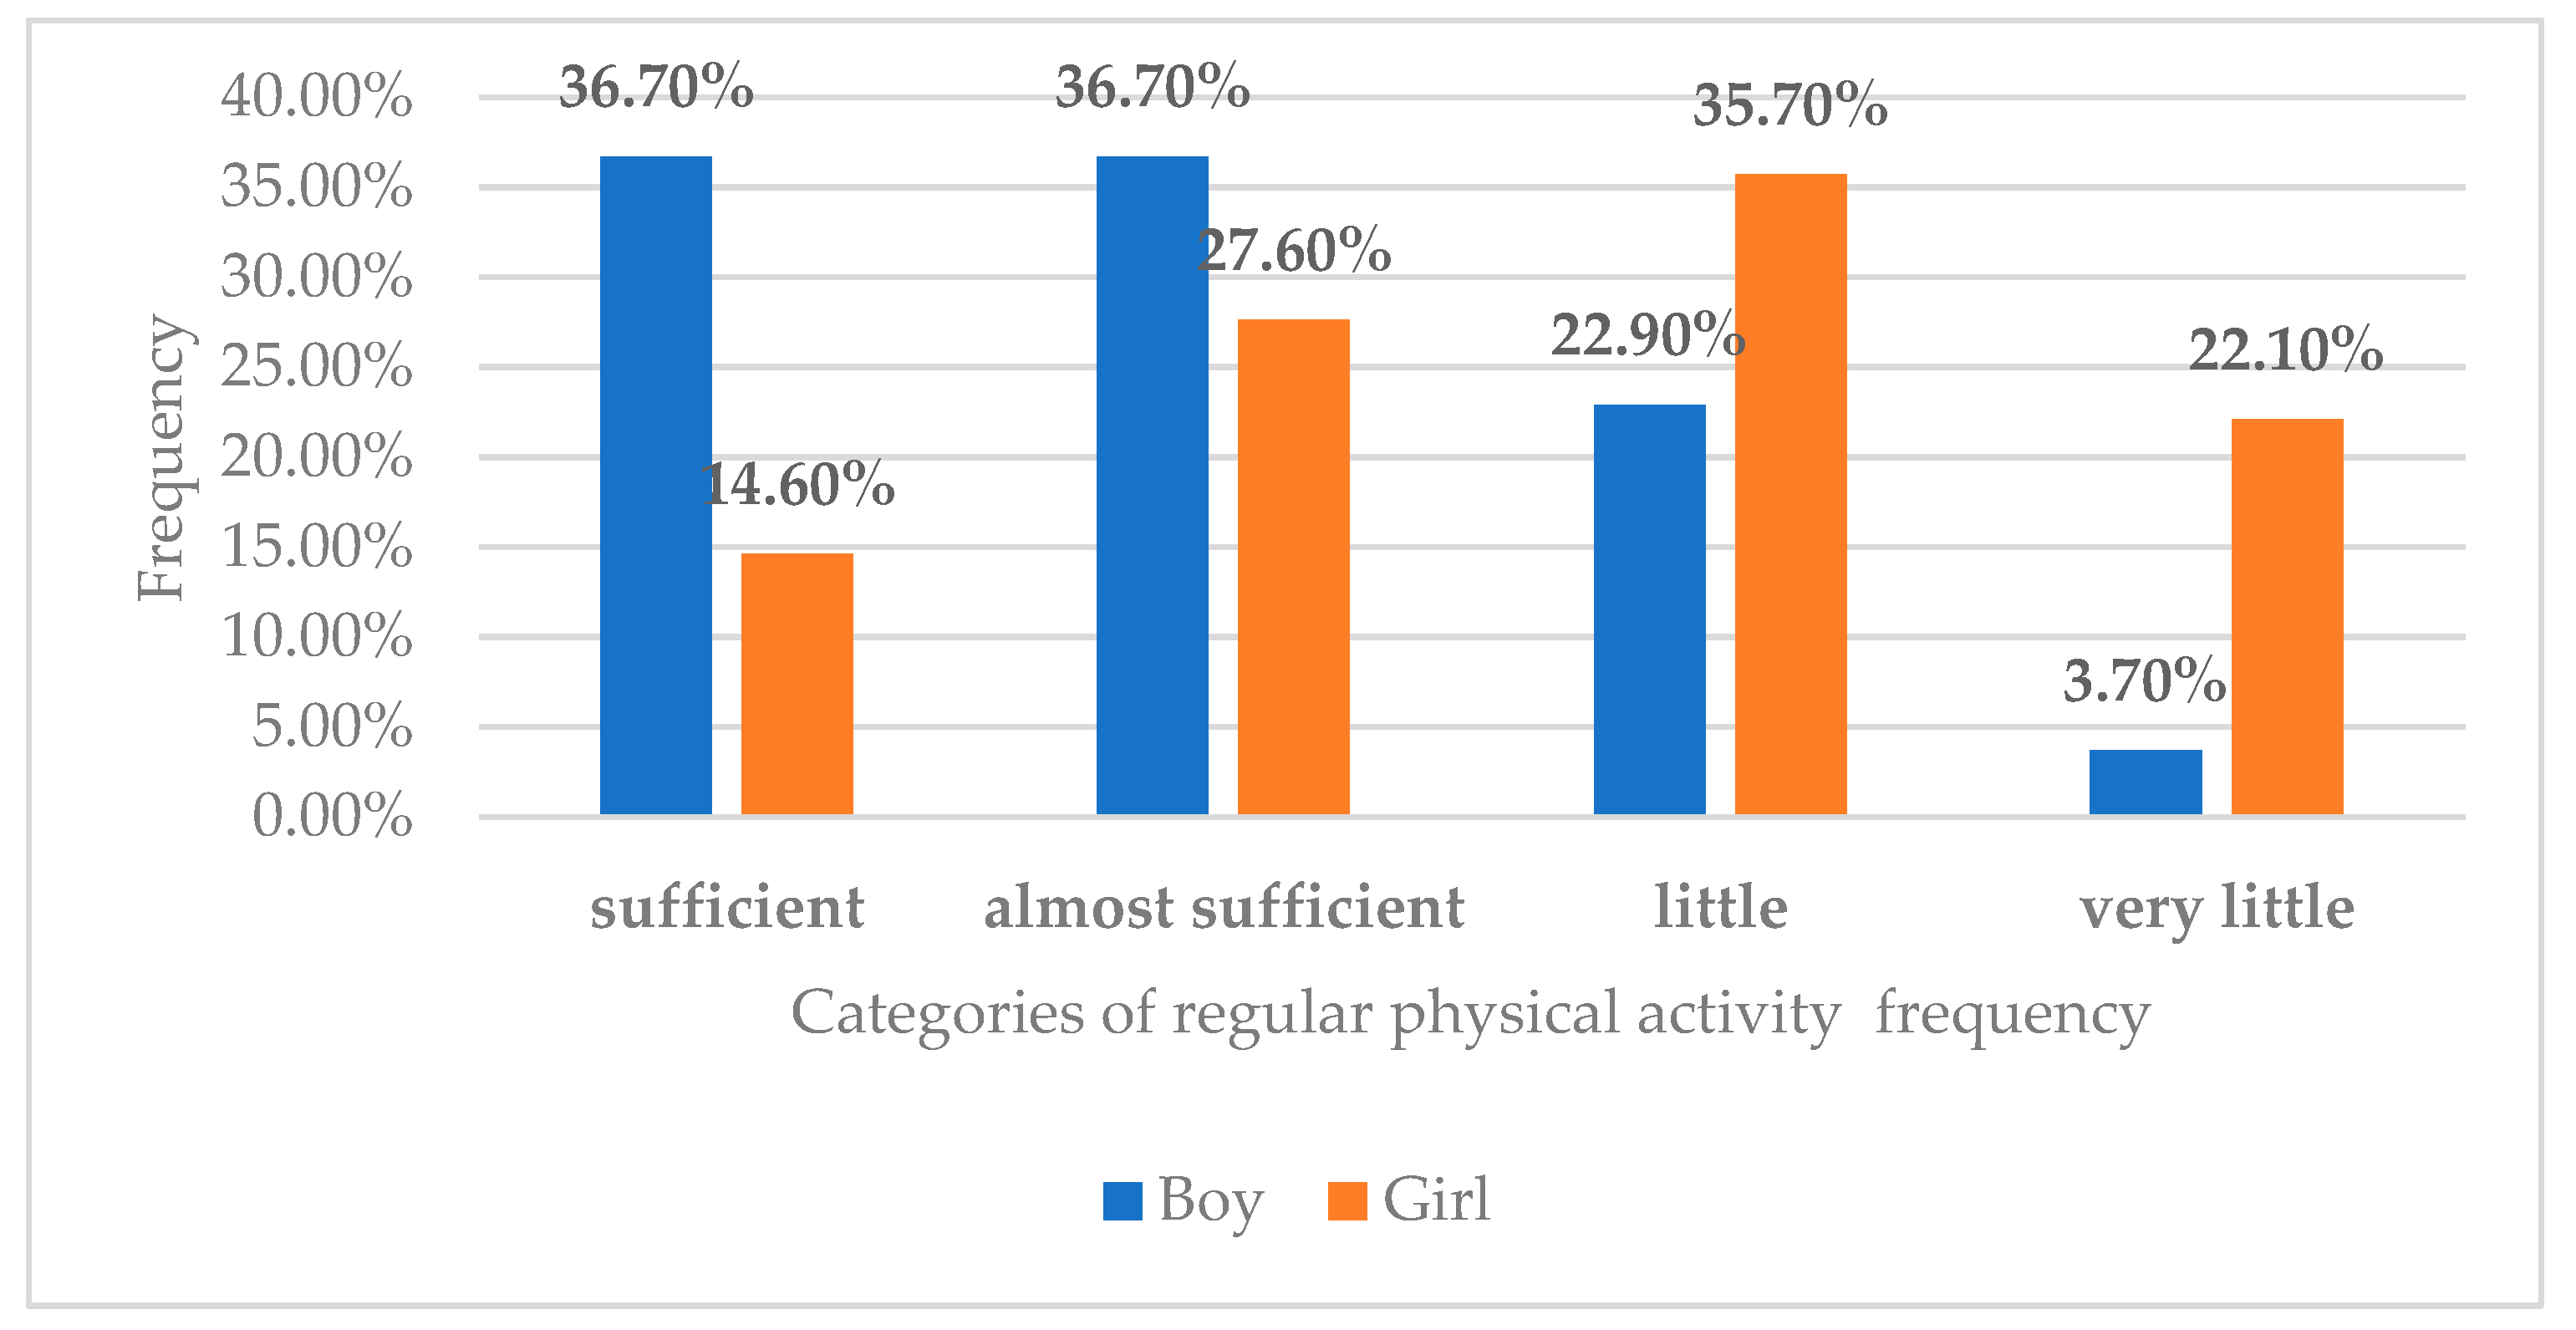
2020). In this study, “appropriate physical activity” refers to meeting this WHO recommendation—performing at least 60 min per day of moderate- to vigorous-intensity aerobic activity. Based on the WHO’s recommendation, we considered the amount of physical activity to be 60 min a day, and for classification into other categories, we used the classification of the HBSC research as a basis (adequate, if every day of the week; almost sufficient, if at least 5–6 days a week; little, if 3–4 days, and very little if 60 min of physical activity was achieved on 2 days or less). Examining the amount of physical activity on a weekly basis, it was sufficient for only 20.8% of the students, almost sufficient for 28.7%, little for 33.4%, and very little for 17.1%. Parallel to the decrease in the weekly frequency of physical activity, the average age increased significantly [F(3,305) 4.76,
p = 0.03] (adequate range M = 16.65 years, almost sufficient M = 16.69 years, not enough M = 16.78 years, very few M = 17.15 years). Our calculations based on gender confirmed a significant difference between the two groups in the amount of time spent on physical activity per week (χ
2 = 36.29,
p < 0.001). There were 2.5 times more boys (36.7%) in the corresponding category than girls (14.6%); in the very few provinces where the opposite occurred, the proportion of girls was exceptionally high (22.1%), seven times more than in the case of boys (3.7%) (
Figure 1).
Based on the type of residence, the time spent on physical activities per week did not differ significantly (χ2 = 3.165, p = 0.788). Those whose amount of movement could be classified in the appropriate range were those who lived in a county seat (20.9%), a city (26.0%) or a village/municipality (22.1%), but in the case of a very little movement time, similarly, we obtained the same data when examined according to place of residence (13.9%, 12.3% and 19.5%). Based on the educational level of the parents, we did not verify any significant difference in the frequency of the students’ physical activity (mother’s χ2 = 0.96 p = 0.98; father’s χ2 = 3.42, p = 0.75). We examined the similarity based on the education of mothers (primary education, 18.8%, secondary education, 23.1%, and tertiary education, 21.6%) and fathers (primary education, 19.4%, secondary education, 24.2%, and tertiary education, 21.2%), but this could also be said in the case of very little physical activity (mother—primary level, 12.5%, secondary level, 14.6%, and higher education, 15.8%; father—18.2%, 12.1% and 15.2%). The type of family (χ2 = 7.82, p = 0.56) and the number of siblings [F(3.305) 1.49, p = 0.21) did not show any correlation with the quantitative indicator of physical activity.
In terms of the quality of regular physical activity performed in free time, we considered at least 3 h a week of physical activity that caused the young person to sweat, which characterized 62.5% of the sample, while nearly 1/3 (37.5%) of the respondents classified as inappropriate. Regarding the quality of physical activity, 64.6% of boys and 61.3% of girls belonged to the appropriate range, so no significant difference can be seen on the basis of gender in the examined area (χ2 = 0.34, p = 0.55). The average age was almost the same for those classified in the appropriate (M = 16.82 years) and inappropriate groups (M = 16.74 years) [t(329) 0.87, p = 0.38]. The quality of movement was not differentiated by the place of residence (χ2 = 2.38, p = 0.303), the mother’s education (χ2 = 0.53, p = 0.76), the father’s education (χ2 = 5, 28, p = 0.701), nor the number of siblings [t(329) − 1.32, p = 0.19] or the type of family (χ2 = 1.58, p = 0.66).
3.3. Physical Activity and Social Support
In our research, we investigated the relationship between the degree of social support and physical activity from the side of family, friends, significant others, teachers and classmates as an important general resource. Using the validated Hungarian version of the Multidimensional Perceived Social Support Questionnaire (MSPSS) developed by Zimet in 1988, we measured the level of perceived social support on a five-point Likert-type scale: four statements for family, three statements for friends and three statements for the significant others subfactor. The reliability of the 10-item scale was adequate (Cronbach’s alpha = 0.89). The mean value of the aggregated scores of the support of significant others is 14.33 (SD = 1.61 max= 15 min= 3), the mean value of the support of friends is 13.45 (SD = 2.28 max = 15 min = 3), in the case of the family, the mean value was 17.31 (SD = 3.64 max = 20 min = 4) and the mean value of the aggregated social support was 45.09 (SD = 6.08 max = 50 min = 17). Social support at school was assessed using a 5-point Likert scale with three questions each concerning teachers (Cronbach’s alpha = 0.76) and classmates (Cronbach’s alpha = 0.89). The result was evaluated using the total score of the scale; a higher score indicated higher social support. Based on our results, the average of the classroom community’s perception of support was 10.51 (SD: 2.78 max: 15 min: 3), while that of the teachers was M = 9.41 (SD: 2.9 max: 15 min: 3).
The mean values of the perceived social support did not differ significantly for girls and boys for the total social support measured with the MSPSS questionnaire [t(325) − 1.38 p = 0.16], the family [t(326) 0.16 p = 0.87], friends [t(325) − 1.77, p = 0.07], teachers [t(328) 1.03, p = 0.30] and classmates [t(327) 0.097, p = 0, 92] cases. Support from significant others was significantly higher for girls (M = 14.53) than for boys (M = 13.35) [t(325) − 3.12, p = 0.002].
In our study, we could not prove the effect of social support on the weekly frequency of physical activity in any of the assessed areas (total social support [F(3,302) 0.75
p = 0.52), family [F(3,302) 0.467
p = 0.705), friends [F(3,302) 1.05
p = 0.37), significant others [F(3,302) 1.16
p = 0.32), teachers [F(3,305) 1.14
p = 0.33] and classmates [F(3.304) 0.54
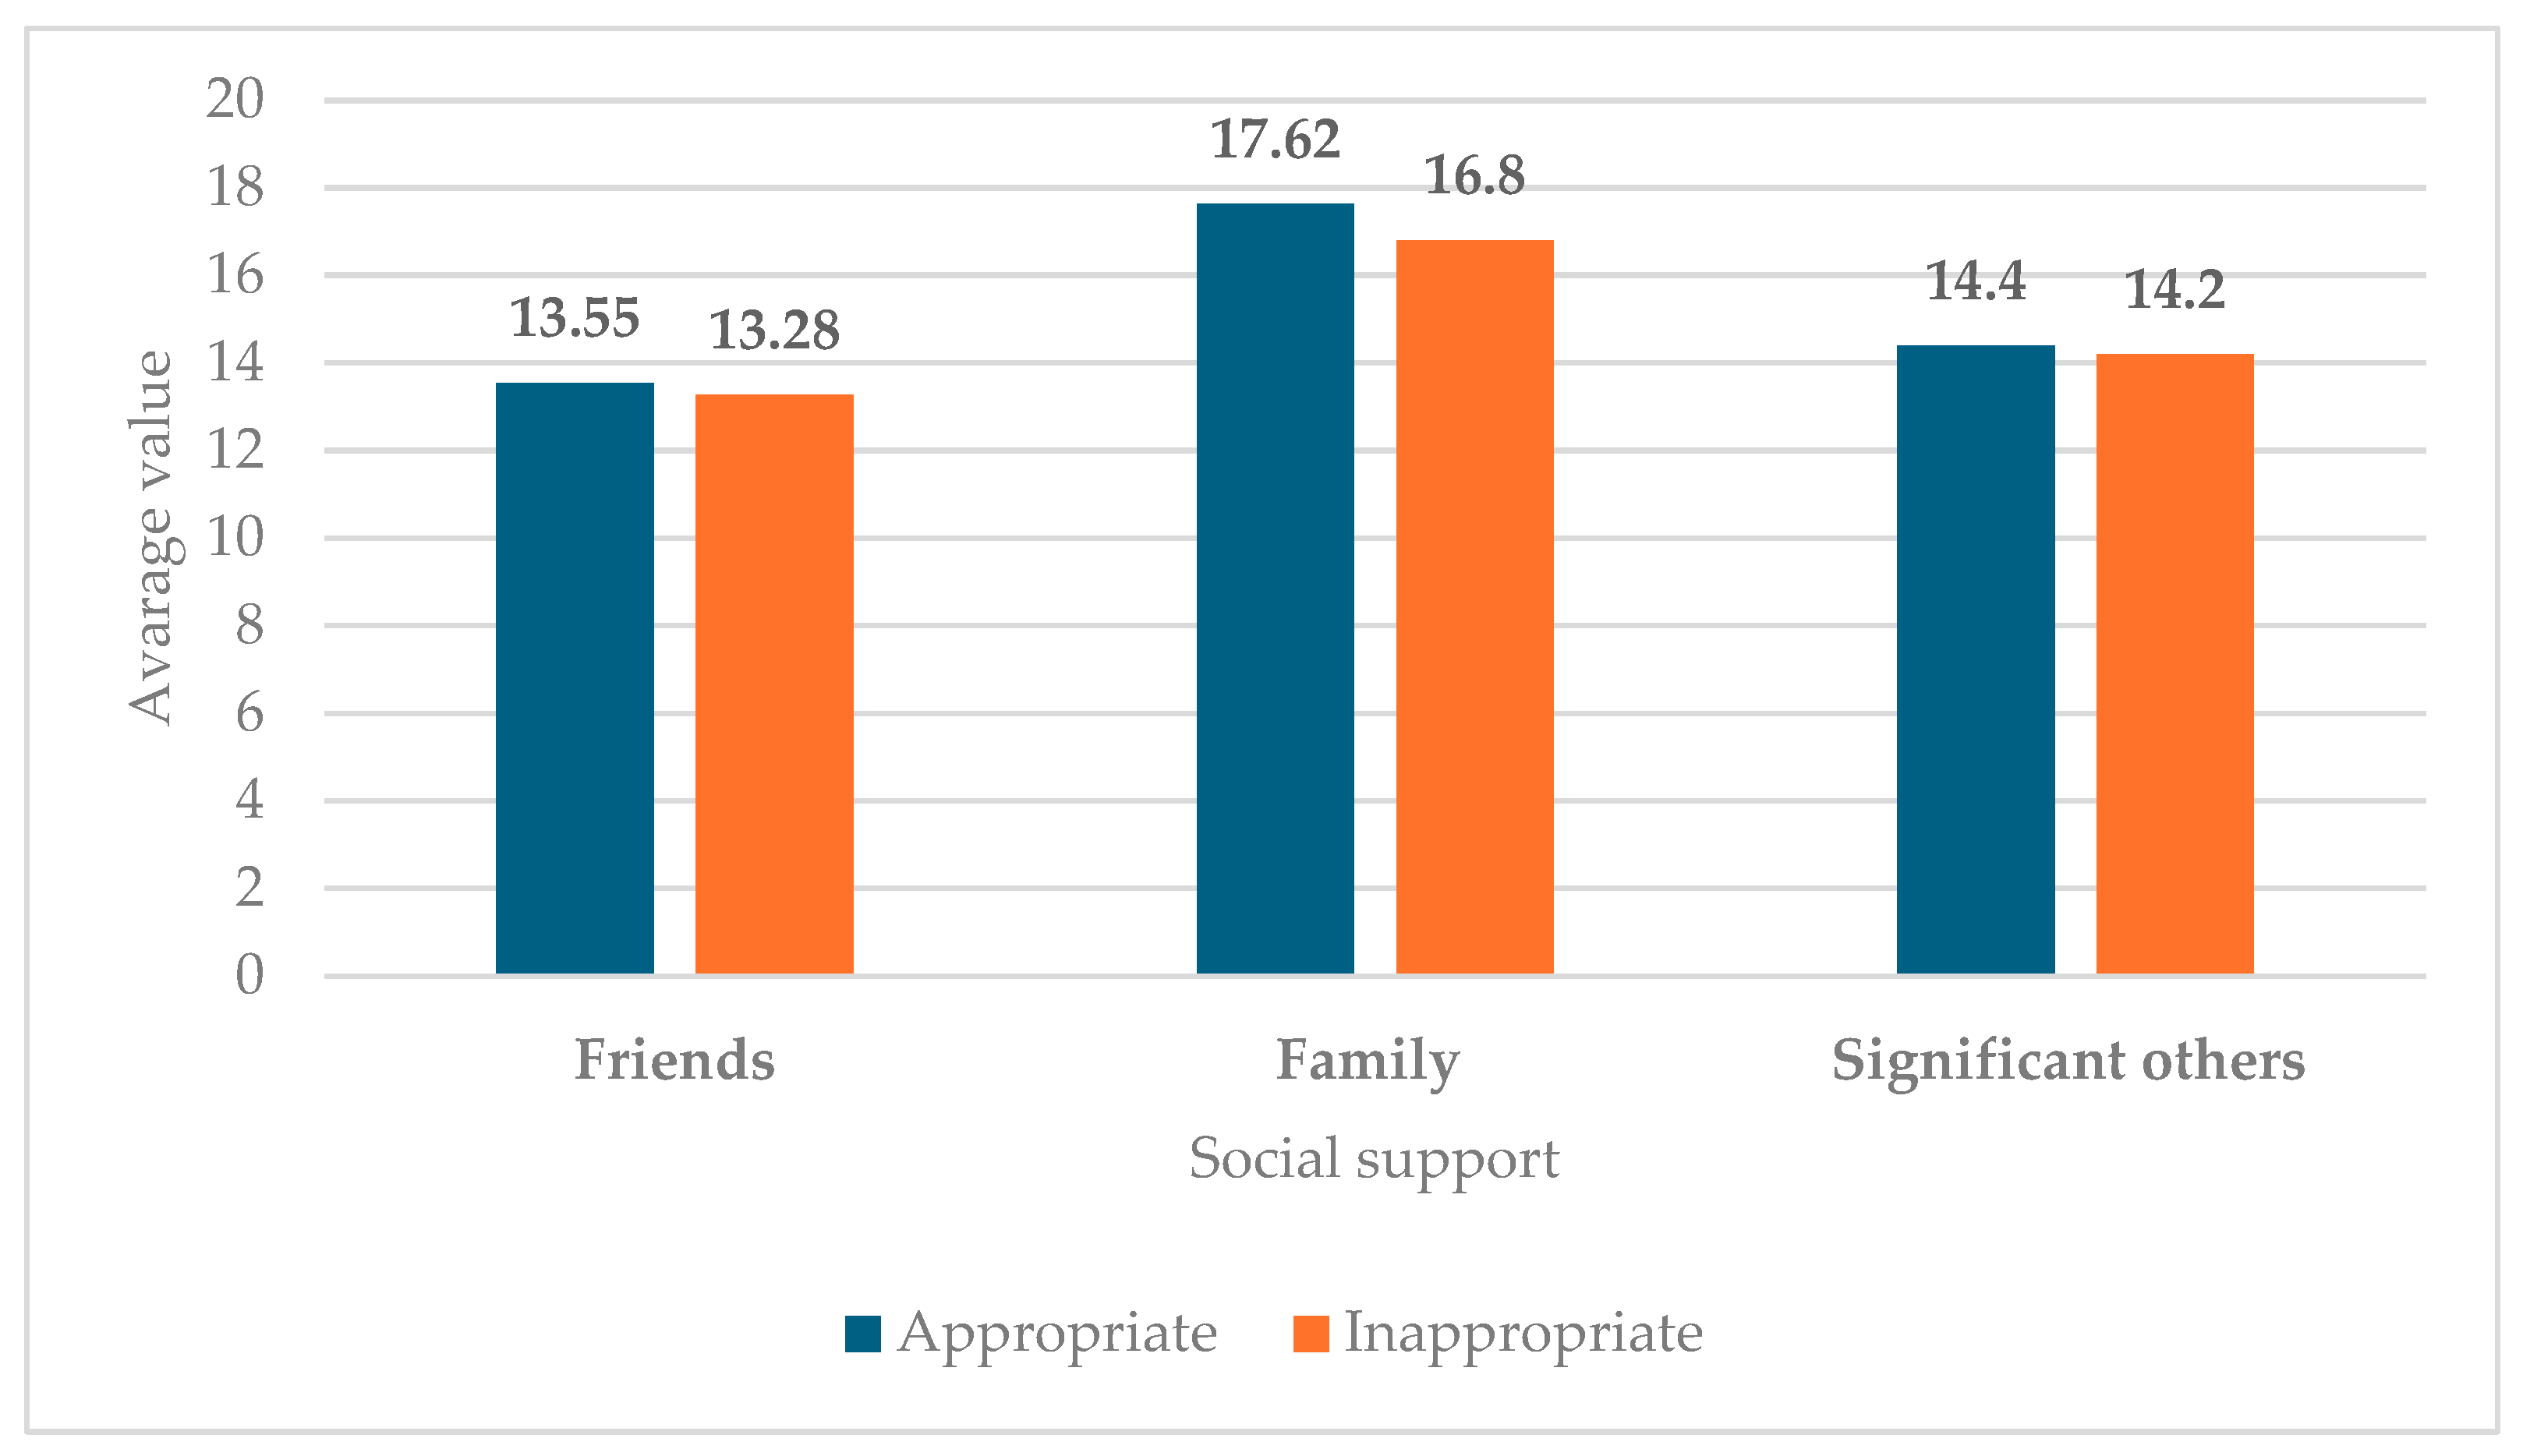
p = 0.65]). On the other hand, we measured higher mean values of perceived social support from the side of the family [t(326) − 1.98
p = 0.048] and teachers [t(329) − 1.96
p = 0.05] for the quality of physical activity in the appropriate range. The average value of the perceived support among those classified in the appropriate range of the qualitative indicator of physical activity was M = 17.55 for the family and M = 9.57 for the teachers’ support, while a lower value was measured for the individuals in the inappropriate category (family M = 17.08 teachers M = 9.01). The quality of physical activity did not differ more significantly in aggregated social support [t(326) − 1.18
p = 0.061], friends [t(326) − 1.05
p = 0.29], significant others [t(326 − 1.09
p = 0.27] (
Figure 2) and in the case of perceived support in relation to the classmates [t(328) − 1.32
p = 0.18].
3.4. Physical Activity and School Resources
In the children’s everyday life, school is a very important socialization arena, a source of health and it plays an important role in the development and shaping of the students’ lifestyles. Our research questions focused on the academic results, the attitude towards the school, the opinion about the school workload and the teachers’ assessment of the learning results. The last three items assessed school resources and their internal consistency, as measured by Cronbach’s alpha, which was adequate (0.86). Students’ feelings towards their school were assessed using a four-point Likert-type scale. Three out of four of the high-school students reported a positive attitude towards their school (29.31% like it very much, 42.06% like it a little), but 8.72% answered that they do not like it at all regarding their feelings about their educational institution. Additionally, 17% of the interviewed students did not find the tasks given by the public education institution to be difficult at all, 40.49% felt it a little, 36.47% found it quite stressful, while 6.04% felt it was very stressful. Based on the opinion of the students, the majority of their teachers categorized their school performance as them being average (in 37.36%) and good students (in 44.3%), while according to the opinion of the teachers, 11.63% of the respondents were among the best students. The academic average of the students was measured based on self-reporting, so the value obtained was M = 4.25 min = 2.8 max = 5 SD = 0.53. The attitude towards school was significantly higher for girls (M = 2.95) than for boys (M = 2.73) [t(328) − 2.08
p = 0.03]. Depressing feelings towards school tasks [t(328) − 0.037
p = 0.97] and the subjective opinion of teachers’ assessment of performance [t(328) − 0.04
p = 0.96] did not differ for boys and girls. The average values of the investigated school resource factors in each category of the quantitative index of physical activity were almost the same as the study average [F(3.305) 1.66
p = 0.17]: How stressful are school assignments [F(3.305) 0.21
p = 0.88]? How do your teachers evaluate your school performance [F(3,305) 30.31
p = 0.81]? We measured a higher level of attitude towards school among those who had a higher frequency of physical activity on a weekly basis (enough M = 3.07; almost enough M = 2.97; little M = 2.79; very little M = 2.56) [F(3.305) 3.07
p = 0.02]. The overwhelming feeling of schoolwork [t(329) 1.38
p = 0.16] and the students’ academic average [t(329) 1.24
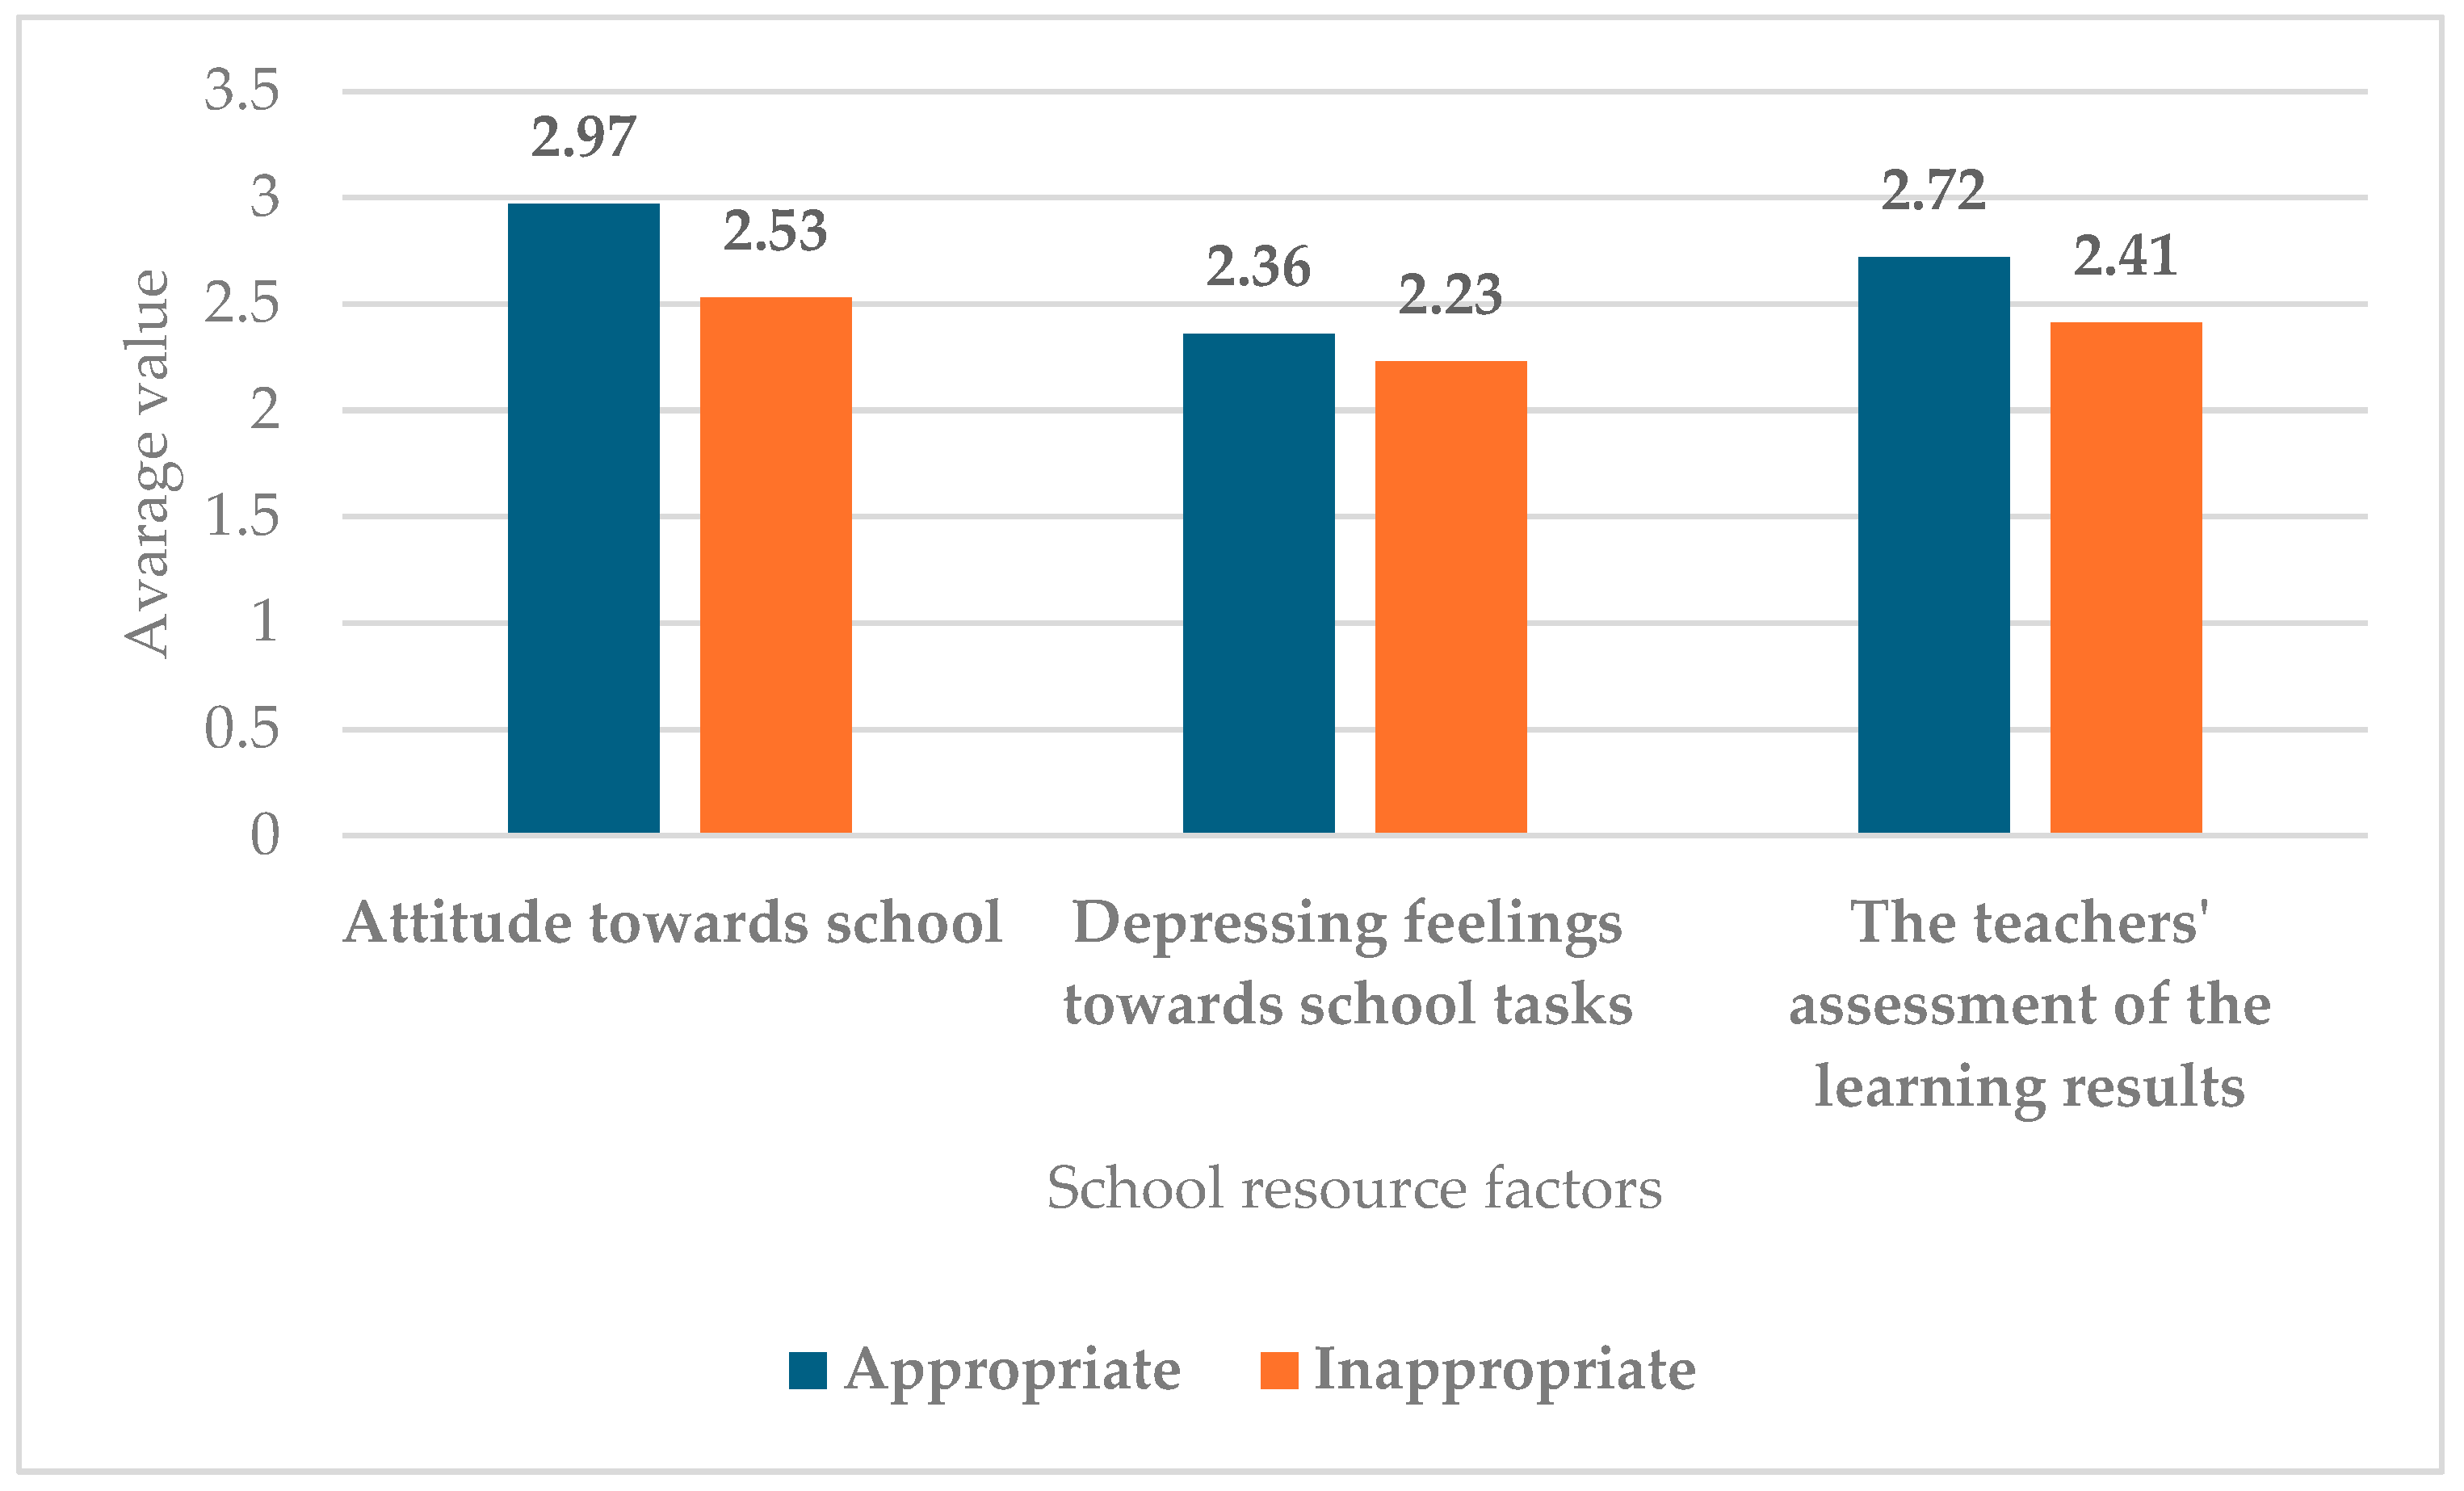
p = 0.21] did not show a relationship with the quality index of physical activity performed during leisure time. On the other hand, for those students whose physical activity intensity belonged to the appropriate category, their attitude towards school (adequate M = 2.97; inappropriate M = 2.53) [t(329) 2.29
p = 0.023]) and the mean value of the teachers’ assessment of their school performance (appropriate M = 2.72, inappropriate M = 2.41 [t(329) 2.39
p = 0.017]) were higher (
Figure 3).
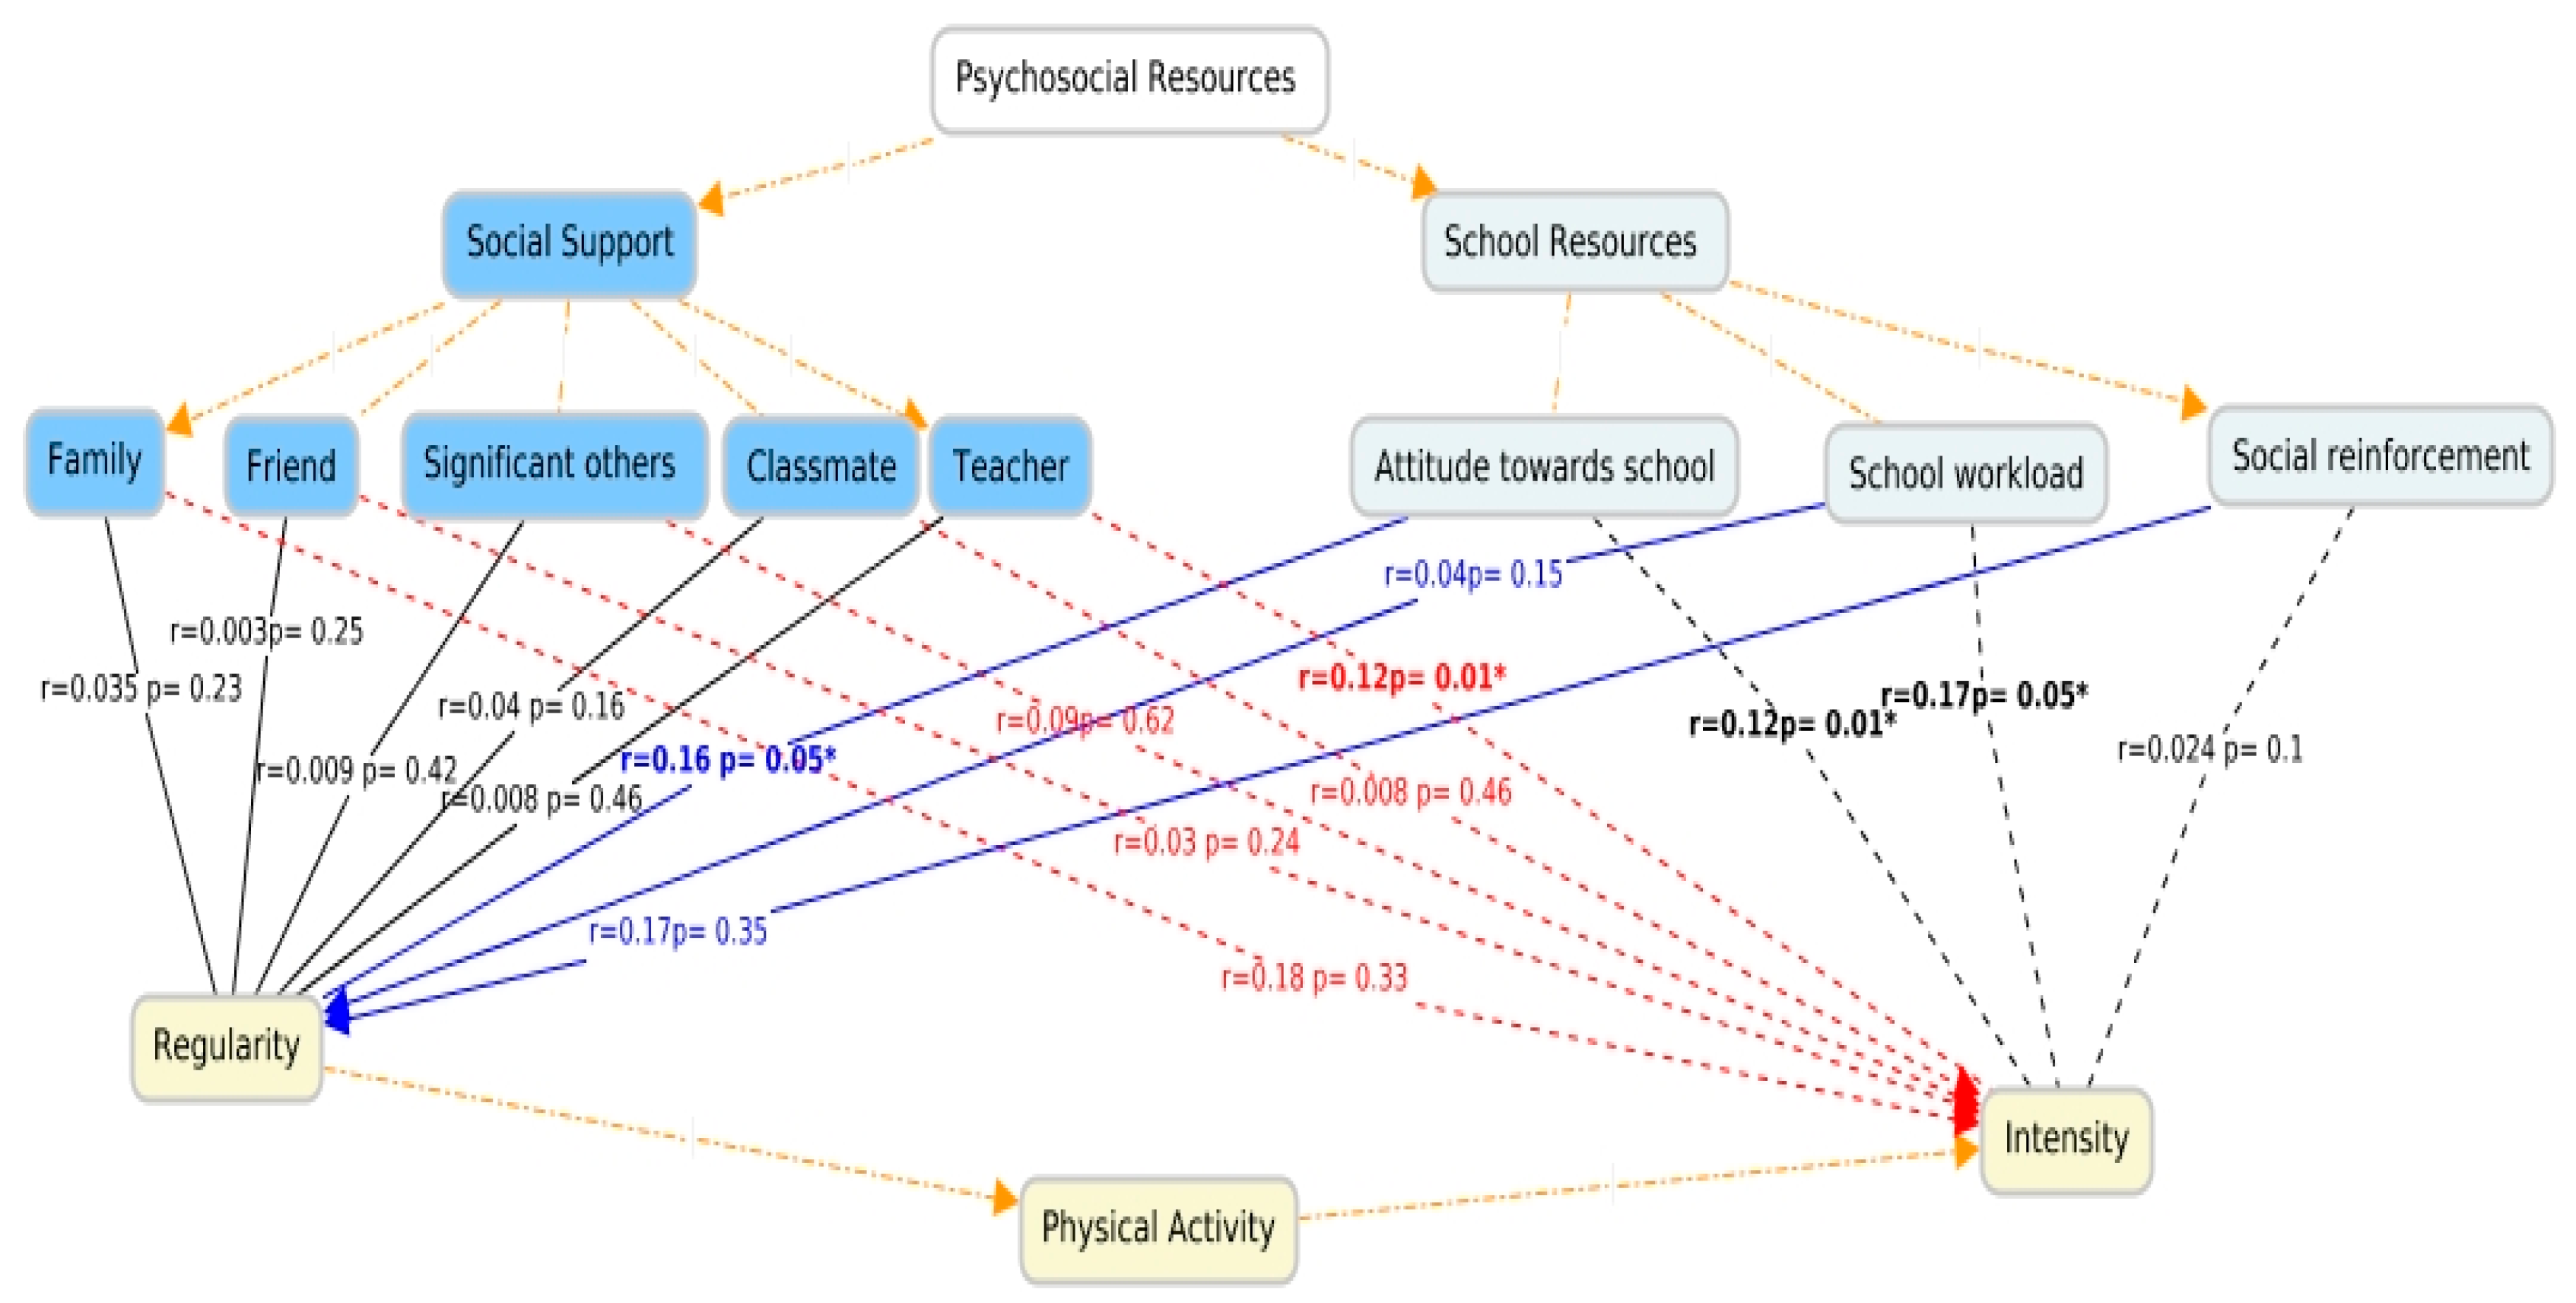
We examined the relationship between the quantitative and qualitative indicators of physical activity through the effects of psychosocial resources—school resources and social support. After the regression calculation, a correlation was detected between the qualitative indicators of movement and psychosocial resources (r = 0.20), with the determination coefficient showing the strength of the relationship to be R2 = 0.04. Psychosocial resources played a 4% role in the change in the qualitative values of physical activity. Based on the results of the ANOVA test, the relationship between the variables was not the work of chance (F(8;435) = 2.27, p = 0.022). We also examined the effect of the linear change in psychosocial resources on the development of the quantitative indicator of physical activity. The determination coefficient quantifying the strength of the relationship was R2 = 0.013. There was no detectable relationship between the variables examined (r = 0.055 F(8; 405) = 0.682, p = 0.707).
Psychosocial resources include various sources of social support, such as family (r = 0.035, p = 0.23), friends (r = 0.003, p = 0.25), significant others (r = 0.009, p = 0.42), classmates (r = 0.04, p = 0.16) and teacher support (r = 0.008; p = 0.46), but these did not show a significant relationship with the regularity of physical activity, meaning that these factors do not significantly influence the frequency of physical activities. However, the role of teachers showed a positive significant relationship with physical activity (r = 0.12; p = 0.01), just as attitudes towards school had a positive effect on the regularity of physical activities participation (r = 0.16; p = 0.05). In addition to psychosocial factors, school-related resources, such as attitude toward school, the school workload and social reinforcement, were also examined. The findings indicate that a positive attitude toward school is significantly associated with higher physical activity intensity (r = 0.12, p = 0.01), suggesting that individuals who maintain a more favorable perception of school are more likely to engage in high-intensity physical activity. Similarly, the school workload exhibits a significant positive correlation with physical activity intensity (r = 0.17, p = 0.05), indicating that higher academic demands do not necessarily discourage physical activity, but, in some cases, may even promote it.
On the other hand, no significant relationship was found between social reinforcement and physical activity intensity (r = 0.024,
p = 0.1), suggesting that social feedback alone does not play a substantial role in determining the level of physical activity engagement (
Table 1 and
Figure 4).
4. Discussion
A physically active lifestyle is positively related to the current state of health and reduces the chance of future chronic diseases. Given rising healthcare costs, reducing diseases associated with physical inactivity is of paramount importance. Identifying factors that influence physical activity—especially for children, which can have lifelong effects—is key. In our research, we examined the relationship between psychosocial resources (social support from family, friends, significant others, teachers, classmates and school resources)and the regularity and intensity of physical activity.
The average age of the respondents was 16.79 years, 1/3 of whom were boys, 39.3% lived in a village, 69.5% lived in a two-parent family and 44.7% of mothers and 32.9% of fathers had a higher education. The results of our own survey (20.8%) for those who can be classified in the appropriate category in terms of the amount of physical activity performed in their free time are HBSC nationally (21.3%) (
Rakić et al. 2024;
Németh et al. 2024) and internationally (20%) (
Rakić et al. 2024) agreed with the survey data. Almost 1/5 of the students performed the amount of physical activity corresponding to the health recommendations (
World Health Organization 2010,
2020), i.e., at least 60 min every day. Meanwhile, with regard to the quality of the physical activity, 62.5% of adolescents performed vigorous physical activity at least three times a week, as a result of which the young person sweated, based on the WHO recommendation, which is almost identical to the responses received in the HBSC survey (60%) (
Rakić et al. 2024). Based on the data received, it can be seen that the physical activity of young people does not meet the recommendations of the WHO. The investigated sociodemographic factors (the type of residence, mother’s/father’s educational level, family type and number of siblings) did not influence either the quantitative (
p > 0.05) or the qualitative (
p > 0.05) indicators of movement. In the case of the time spent on physical activities per week, boys (
p < 0.05) and younger people (
p < 0.05) showed a much more favorable picture, similar to previous research (
Rakić et al. 2024;
Németh et al. 2024;
K. Kovács 2016;
Perényi 2012). In our survey, however, the quality index of physical activity was not differentiated by gender (
p > 0.05) or age (
p > 0.05).
The degree of social support changes with age (
Papp-Zipernovszky et al. 2017), so we tried to compare the data we received with the results of the research conducted among individuals belonging to a similar age group. Pribék and his colleagues used the above-mentioned measuring instrument to measure the social support of university young adults (n = 395) (average age: 21.8 years). In the mentioned test sample, the average score of the MSPSS (M = 46.905) was the same as our own result (M = 45.09), the average value of the perceived support of the family was higher (own sample M = 17.31; research data M = 15.4), while support from others was significantly lower (own sample M = 14.33; research data M = 17.94) (
Pribék and Jámbori 2017) than the data obtained in our sample. In their research, Pribék and his colleagues addressed young university students, whose circle of acquaintances increases during the university years as they form relationships, so it is possible that the average value of the family’s overall score is lower and that of significant others is higher than in our research results. Based on the answers we received, similarly to Pribék et al., girls perceive significantly higher social support primarily from others (
p < 0.05) (
Pribék and Jámbori 2017). In the case of the amount of movement, neither family nor friends nor support from significant others was a differentiating factor (
p > 0.05). Examining the intensity of regular physical activity among students who belonged to the appropriate range, the average values of family social support were significantly higher (
p < 0.05), but no significant association was found for social support from friends or significant others (
p > 0.05). Several studies have confirmed the positive effect of family social support on the physical activity of young people (
Sanz-Martín et al. 2024;
De Camargo et al. 2023;
Su et al. 2022;
Lisboa et al. 2021;
Campos et al. 2019;
Cheng et al. 2014), similar to our results. Based on the data of the HBSC research, the social support belonging to the school, examining the teacher segment, was M = 10.1 points, while the average of classmate support was 10.7 points (
Németh et al. 2024). The results of our survey showed almost the same level of school social support from the class community as the data of the HBSC survey (M = 10.51), while we verified a minimally lower level of social support from the teachers (M = 9.41). In both cases, the data obtained from teachers and classmates indicated a higher-than-average level of support. Social support from classmates had no effect on physical activity during free time (
p > 0.05), while a better relationship with teachers was associated with physical activity at the appropriate intensity (
p < 0.05), which was also supported by research conducted among Polish youth (
Pluta et al. 2020).
Our findings are consistent with previous studies emphasizing the role of socio-demographic and psychosocial factors in shaping adolescents’ physical activity behavior. National Hungarian surveys (
Perényi 2012;
K. Kovács 2016;
Németh et al. 2024) and international HBSC reports confirm that gender and age differences persist in youth physical activity, with boys and younger adolescents more likely to engage in sufficient movement. These patterns also appear in our results.
The international HBSC data further highlight socioeconomic inequalities in access to physical activity opportunities, such as access to safe physical activities’ environments and family income levels, which influence participation in organized physical activities (
Rakić et al. 2024). Our data did not reveal a significant influence of parental education or residence type, but the role of social support—particularly from family and school—was clearly demonstrated.
The importance of role modeling and adult support is further underlined by results linking teachers’ and parents’ encouragement with physical activity participation (
Pluta et al. 2020;
Rachele et al. 2017). These findings stress the significance of school–family partnerships in promoting youth health behaviors and reinforce the need for integrated approaches in health promotion.
Social support—particularly from family and teachers—and positive school effects can be protective factors in terms of health, while negative experiences can be a risk. School can have a positive effect on students’ health; those students who learn better have higher life satisfaction, mention fewer subjective health complaints and behaviors that endanger health appear to a lesser extent, while protective factors appear in a higher proportion (
Németh and Költő 2016;
Márványkövi et al. 2013). The academic average of the students in our sample was 4.25, which meant we could not verify the positive effect on physical activity. The academic average of the students did not differ significantly based on the regularity or intensity of physical activity (
p > 0.05). In the examination of the school resources, we received almost identical answers to the results of the HBSC research along all the examined categories. As a comparison, we highlight one piece of data: those who marked the most positive response during the assessment of the attitude towards their school in the HBSC survey. This was typical for 33.0% of students in schools that were awarded the baccalaureate (
Németh and Költő 2016), while in our samples, this was a rate of 29.31%. In the case of the other two examined questions, we found that in our own sample there were more people who felt that their school tasks were stressful, but there were almost 10% more people who felt that their teachers rated their school performance higher compared to the data of the national HBSC survey (
Németh and Költő 2016).
In our survey, we verified a correlation between a higher level of some school resource factors and regular physical activity deemed appropriate based on the WHO recommendation. The level of attitude felt towards their school was higher among those students who performed an adequate quality and quantity of physical activity in their free time (p < 0.05). The assessment of school performance by teachers showed a relationship with physical activity performed at the appropriate intensity. (p < 0.05).
Our findings align with both ecological models by demonstrating that interpersonal (e.g., family and teacher support) and institutional (e.g., school attitudes and structure) factors are significantly associated with adolescents’ physical activity levels. Bronfenbrenner’s ecological systems theory highlights how microsystem-level influences, such as family and school, directly shape individual behavior. The observed decline in the perceived teacher and peer support (HBSC, 2022) may also indicate disruptions in the mesosystem. In contrast, McLeroy’s socio-ecological model emphasizes multilevel health interventions. The positive association between school attitudes and the physical activity intensity underscores the institutional level as a promising point for intervention.
Together, these models help us understand how adolescents’ social environments contribute to the physical activity behavior and suggest how policy and practice might address these influences in a coordinated way.
A limitation of our research is that it was a cross-sectional survey and did not examine other factors potentially influencing physical activity (e.g., access to facilities, family sports habits and the role of role models). We can mention the homogeneity of the sample and the inclusion of students from several schools as a strength.
5. Conclusions
Our study confirms that family and school resources play a significant role in supporting regular and intense physical activity among adolescents. Social support from family members and teachers, as well as a positive school climate, were positively associated with physical activity behaviors.
While these findings are consistent with the previous literature, they offer added value by presenting context-specific evidence from Hungary—an under-represented region in international research on adolescent physical activity. Moreover, the inclusion of both family- and school-related psychosocial factors allows for a more nuanced understanding of their relative importance.
We also acknowledge the study’s theoretical limitations. Although the original design was not built on an explicit explanatory model, we have since integrated Bronfenbrenner’s ecological systems theory and McLeroy’s socio-ecological framework into our interpretation to strengthen the conceptual underpinning of our findings. These models support our interpretation that multi-level environmental influences are essential in shaping youth physical activity behavior.
Furthermore, while the psychosocial instruments used (MSPSS, HBSC) do not measure support specifically targeted toward physical activity, their significant associations with activity levels point to valuable indirect mechanisms. This reinforces the relevance of broad social support structures and emphasizes the need for future studies to apply more activity-specific tools.
These findings underscore the importance of cooperation between schools and families in promoting a physically active lifestyle among youth. Schools should continue to offer structured opportunities for exercise, while families can support these efforts by providing emotional encouragement and modeling active behavior.
The combined influence of these psychosocial resources can foster long-term health benefits. Health promotion programs targeting adolescents should, therefore, include both school-based and family-oriented components to maximize the impact. Future research could explore additional factors such as facility access, motivation and cultural influences to further inform effective intervention strategies.
The cross-sectional design and homogeneity of the sample are limitations of the present study. However, the inclusion of multiple schools and the integration of validated measurement tools represent notable strengths that lay the foundation for theory-driven follow-up research.


