1. Introduction
Being around since the beginning of the 21st century, the new paradigms of intelligence-led police have not been successfully implemented in Mexico and in other developing countries for multiple reasons, with the lack of reliable criminal data being an important determiner.
Intelligence-led police characterizes a model that transitions from reactive to proactive police work aiming to prevent criminal offenses. The word intelligence implies the need to analyze and interpret information about criminality to support police authorities in their decision-making process to combat crime more efficiently, effectively, and economically (
Racic and Dostic 2024).
In a country where most crimes go unreported, uninvestigated, and unpunished, this model of police work is challenged for the need to have quality data in a consistent, reliable, and timely matter.
Given this necessity, our research seeks to find specific data sources, theoretical frameworks, and methodologies that are useful in detecting vulnerabilities, specifically on commercial burglary. In that sense, the present work aims to answer if commercial burglary can be identified using publicly available data when informed by criminological theory. If this is the case, this research further endeavors to find if these vulnerabilities exhibit spatial patterns that could lead to the implementation of targeted crime prevention policies.
Official figures support this pressing need; in the most recent victimization survey in 2024, the Mexican National Institute of Statistics and Geography (INEGI) reports that for the 31.3 million crimes that occurred during 2023, only 10.4% were formal complaints by victims to police authorities. Of this figure, only 68% led to an investigation, leaving 92.9% of the total crimes uninvestigated (
Instituto Nacional de Estadística y Geografía 2024c).
This figure is known as the “black figure” and has consistently been over 90% over the last 10 years in Mexico. This comes as a result of the lack of confidence in the integrity and effectiveness of governmental authorities, which demotivates victims to report incidents, leading to rising impunity and revictimization (
Calderon et al. 2021).
Facing this scenario, police departments are challenged to deploy strategies without knowing when, where, how, and why a crime has occurred, leaving the victims without justice and with the possibility of being targeted again.
By applying a case study in a major metropolitan area of Mexico, this research is guided by two central hypotheses. First, that vulnerabilities to commercial burglary can be effectively identified and addressed through the integration of criminological theory and publicly available data. Second, that these vulnerabilities are not randomly distributed across the urban landscape but instead follow identifiable agglomeration patterns that can assist in targeting public policy interventions to mitigate possible vulnerabilities.
Emerging from these hypothesis, important research questions will guide our work. Following our first hypothesis, we ask what specific data sources, theoretical frameworks, and methodologies are most useful in detecting these vulnerabilities? And second, are these vulnerabilities exhibiting statistically significant agglomeration patterns, and if so, how can these patterns inform targeted public policy responses?
By addressing these questions, this paper aims to support police intelligence efforts in Mexico by generating data through the analysis of public information and its relation to the theoretical framework of criminal motivations. To achieve this, we relate census data with the routine activity theory of crime developed by
Cohen and Felson (
1979) to detect high-vulnerability business burglary zones. With the intention of encapsulating the different dimensions of the routine-activity theory in one variable, we developed an index implementing a principal component analysis to a set of data that reflects the multiple factors that could motivate the commission of a business burglary.
To generate intelligence with the created variable, we spatially group our index by means of the global indicator of spatial association (LISA). The results allow us to create hot spots and focus strategies to combat business robbery on 16.82% of the studied territory, establishing an order of priorities to address the most vulnerable areas one by one. Also, the results allow us to propose prevention actions in broader zones by generating clusters around areas that share similar attributes.
This study contributes to the development of a replicable methodology for identifying vulnerable areas to commercial burglary across the national territory, while also enhancing the analysis of microregions in terms of security where, in many cases, there is a critical need for high-quality, consistent, and reliable information that can support intelligence efforts within law enforcement authorities. It also provides valuable information for the discussion and creation of public policies at the local level in Mexico that can help address the determinants of commercial burglary within the analyzed geographic context.
Building on this introductory section, this study provides a brief overview of the background of the study area, followed by a literature review of the key theories explaining commercial burglary. It also discusses the application of various geostatistical techniques used to analyze the issue. A section dedicated to data describes the sources of information and the processing methods applied. Finally, this study outlines the methodologies employed to achieve the research objectives and presents the results, accompanied by insights into their implications for understanding the phenomenon under investigation.
1.1. Context
According to the 2024 National Survey on Victimization and Perception of Public Security (ENVIPE), 60.7% of the population over 18 considers insecurity to be the most critical problem affecting them, surpassing other national and global concerns such as rising prices, unemployment, water scarcity, and corruption, among others (
Instituto Nacional de Estadística y Geografía 2024c).
To further illustrate the scale of the problem, data from the past decade show that, on average, one in every three households in Mexico has had at least one member fall victim to some form of crime.
The same study estimates that the overall cost of insecurity and crime to the Mexican population amounts to approximately 1.15% of the national GDP. This includes direct and indirect losses due to victimization, which collectively exceed $9 billion USD. As previously mentioned, due to the lack of reliable data, this economic burden underscores the consequences of crime on both personal and national levels.
Since this study is based on the premise that crime is unevenly distributed across geographic regions, uncovering the underlying drivers of criminal activity in a vast and diverse country like Mexico presents a significant challenge.
Vilalta and Muggah (
2016), however, offer a valuable framework for analyzing the causes and dynamics of crime by employing a range of geostatistical tools.
The authors draw on theoretical frameworks rooted in social disorganization and institutional anomie to analyze crime patterns. They incorporate data related to social inequality, educational attainment, residential mobility, family disruption, community engagement, and socioeconomic status to demonstrate that criminal activity in the local context is closely linked to both theoretical constructs. Their analysis supports the idea that structural and institutional factors jointly shape the conditions under which crime emerges and persists.
This later work is replicable across municipalities throughout the country and provides a strong foundation for understanding the key social and economic factors that shape the criminal phenomenon in Mexico. Additionally, studies such as that of
Jurado Flores et al. (
2023) on car theft focus on specific types of crime, offering insight into how certain forms of criminal behavior may be influenced—or even reshaped—by the underlying dynamics of society.
Despite this foundational understanding and with presidents from three different political parties, each implementing various security strategies and investing billions of pesos, crime rates remain relentless across the country, affecting all sectors of society.
One of the most impacted sectors, and one of the loudest in demanding solutions, is the business community. According to the Confederation of Employers of the Mexican Republic (COPARMEX), business theft increased by 11.3% during the first five years and two months of Andrés Manuel López Obrador’s administration compared to the same period in the previous term (
González 2024).
Official figures from INEGI confirm the sector’s vulnerability in its most recent publication of the 2024 National Survey on Business Victimization (ENVE). The survey reports that 1.3 million economic units were victims of crime nationwide in 2023, representing 27.2% of the country’s registered economic units, with the commercial sector being the most affected, compared to the industrial and service sectors (
Instituto Nacional de Estadística y Geografía 2024b).
While the data encompass all types of crimes affecting businesses, such as petty theft, theft of goods in transit, fraud, among others, extortion (25.5%) and theft of goods, money, or property (16.9%) alone account for over 40% of the reported cases.
It is crucial to highlight that the impact of crime on businesses is felt across all levels, but micro and small enterprises are particularly vulnerable. These companies suffer disproportionately from theft and, as a result, are often forced to invest in protective measures to shield themselves from future incidents. According to the ENVE, micro-sized businesses spend an average of $1600 USD on security measures, while small businesses allocate approximately $7850 USD for the same purpose.
As previously mentioned, a significant proportion of crimes in Mexico go unreported, uninvestigated, and unpunished, and commercial burglaries are no exception. The report reveals that at the national level, only 12.2% of commercial burglary incidents are reported to authorities, and even fewer—just 9.7%—lead to formal investigations. This figure varies significantly depending on the size of the company; only 8.6% of incidents involving micro businesses are pursued by authorities, compared to 37.6% for large corporations.
This disparity may reflect a broader issue of trust, as the study also finds that fewer than two-thirds of economic units express confidence in their local law enforcement agencies, underscoring the erosion of trust in the authorities tasked with ensuring public safety.
Given this context, a methodology that leverages publicly available data to uncover the underlying factors driving commercial burglary can serve as a valuable tool for developing informed policing strategies based on observed crime patterns. To achieve this, the authors employ data reduction techniques such as principal component analysis (PCA) alongside geostatistical methods to identify crime hotspots. This approach facilitates a deeper understanding of the phenomenon, enabling the design of more targeted and effective crime prevention policies.
In light of this national landscape, it is important to note that, according to official figures from the Executive Secretariat of the National Public Security System, crimes impacting businesses are classified as common law offenses, and under Article 21 of the Constitution, it is the responsibility of states and municipalities to prevent, investigate, and prosecute them.
This context provides a subnational framework for the policies and programs that could be implemented to mitigate the impact on businesses, underscoring the importance of analyzing the phenomenon at the local level. In search of a methodology that can be replicated across all municipalities in Mexico, this study draws on the criminological theory of routine activities to analyze, through geostatistical methods, the dynamics of commercial burglary in the Metropolitan Area of Monterrey. Specifically, a methodology is developed to identify microregions where vulnerable economic units are concentrated and to contribute to the creation of targeted public policies aimed at crime prevention.
1.2. Area of Study
With an estimated population of 5.3 million inhabitants, according to the latest INEGI census in 2020, the Metropolitan Area of Monterrey, located in the state of Nuevo León, is the second most populous metropolitan area in Mexico, second only to the Metropolitan Area of the Valley of Mexico, which includes Mexico City and its surrounding regions.
Due to its economic dynamism, INEGI reports that by the end of 2022, Nuevo León ranked third in its contribution to the national GDP, at 8%, following only Mexico City (14.6%) and the State of Mexico (9%) (
Instituto Nacional de Estadística y Geografía 2022).
According to the terms of reference for developing the metropolitan planning program for the region through 2050, published by the Government of Nuevo León in 2022, its geographical location on the trade route to the United States and Canada has driven industrial growth for several decades. This has led to a doubling of the population in the metropolitan area and a fivefold expansion of its urban sprawl over a 30-year period (
Secretaría de Movilidad y Planeación Urbana 2022).
The horizontal growth of urban sprawl, combined with population growth, poses a significant challenge for public security authorities. While the Monterrey Metropolitan Area is known for its high education levels, income, and basic service coverage compared to the rest of the country, the region has not been immune to the severe insecurity problem faced nationwide.
In 2022, the state of Nuevo León ranked 11th out of 32 states nationally, with a homicide rate of 24.82 per 100,000 inhabitants, higher than the national average of 20.92 homicides (
Observatorio de Seguridad y Justicia 2023).
In terms of the impact on businesses due to criminal activity, Nuevo León matches the national average of 28.1% criminal prevalence in economic units, according to the 2024 National Survey on Business Victimization (ENVE). However, in the previous 2020 survey, the prevalence was recorded at 32.43%.
As in the national context, businesses in Nuevo León are affected by extortion, shoplifting and by the theft or assault of goods, money, supplies, or assets. The survey reports that the average cost of crime per economic unit in Nuevo León is close to $3765 USD, with more than 75% of that amount allocated to protective measures.
As can be seen, there are areas of both high and low concentrations of economic units across the territory, which will be analyzed in the following sections using geostatistical methods to examine their relationship with various variables that influence the criminal phenomenon. Before proceeding with the analysis, a brief literature review is provided below, discussing the different theories and methods used to analyze crime in local contexts.
1.3. Literature Review
Over the years, various theories have attempted to explain the factors that may influence individuals’ decisions to commit crimes. As
Buonanno (
2003) points out, the study of crime spans several diverse and heterogeneous fields of knowledge, including criminology, economics, sociology, psychiatry, geography, and others.
As
Brantingham and Brantingham (
1981) suggest, the analysis could focus on various dimensions of the phenomenon, whether it be its legal dimension, the victim or offender dimension, or, lastly, its spatio-temporal dimension.
Guided by the spatial approach with which we tackle the criminal phenomenon in this study,
Anselin et al. (
2000) argue that crime distribution is determined by the intersection of criminal opportunities and motivated offenders in time and space, all within a social structure to which individuals belong.
For the purposes of this study and the identification of vulnerable areas for business theft, we focus on
Cohen and Felson’s (
1979) routine activity theory, in which the authors attribute the occurrence of a crime to the presence of a motivated offender, the availability of a suitable target, and the absence of a capable guardian to prevent it.
Similarly,
Van Dijk (
1994) proposes a supply-and-demand model in which criminals are the consumers of criminal opportunities, and their demand is motivated by factors such as time, energy, and the risk of punishment. Property owners, often unintentionally, provide the supply of criminal opportunities by leaving their possessions unprotected. As their defenses increase, the supply of criminal opportunities decreases.
According to the
Van Dijk (
1994) model, an increase in the number of criminal opportunities or greater supervision or protection of properties would alter the dynamics of supply and demand, impacting crime rates.
Recognizing the complex dynamics between social factors, economic activity, and crime,
Stacy et al. (
2017) note that most local studies on business theft have focused on social characteristics that are determinants of crime occurrence, with few studies addressing the characteristics of businesses themselves.
In a study conducted in the same geographical area analyzed in this paper,
Alvarado Lagunas et al. (
2020) reinforce the need to examine the Metropolitan Area of Monterrey from a business perspective, as the majority of literature on the subject emphasizes geographic, sociodemographic, and social factors when analyzing crime.
Using data collected from surveys of microbusiness owners and various characteristics of the locations of their businesses,
Alvarado Lagunas et al. (
2020) estimate the relative risk of experiencing theft using a Cox proportional hazards model, based on different explanatory variables.
Their findings indicate that business characteristics influence the likelihood of being victimized. For instance, the retail sector is 1.16 times more likely to experience theft than other sectors, and businesses that do not invest in security measures face a higher risk of theft compared to those that do.
Referring to the geographical dimension as a factor influencing criminal activity, as previously mentioned,
Anselin et al. (
2000) state that a location can be a factor influencing or shaping the criminal behavior of people who frequent a given area or attract individuals with similar criminal tendencies.
This geographically focused perspective has also been closely linked to the concept of vulnerability, particularly in relation to victims. Although the literature lacks a universally accepted definition of vulnerability, as noted by
Valderrey et al. (
2023), the term is frequently used in criminology to describe the likelihood that a person or element exposed to a threat will experience harm or loss—and struggle to recover from it.
This understanding of vulnerability is drawn from
Busso (
2001) and further supported by
Chardon (
2008), who characterizes vulnerability as a multidimensional and multicausal condition. It is associated with fragility, helplessness, institutional neglect, internal weaknesses, insecurity, degradation, poverty, and social exclusion.
Expanding on this,
Martínez Herrera et al. (
2020) offers a comprehensive synthesis of various definitions, framing vulnerability as a concept shaped by a complex interplay of physical, economic, technical, political, and cultural factors. These elements interact dynamically across multiple territorial scales, influencing exposure, fragility, and resilience in the context of crime and violence.
Following this perspective,
Moreno-Jaramillo and Brand (
2000) mention that the ability of individuals or communities to recognize the specific factors generating a threat, along with their capacity to mitigate them, becomes essential in reducing overall vulnerability.
In this context, vulnerability is shaped not only by inherent limitations but also by fragile structural conditions, deteriorating institutional support, and systemic disadvantages. From a public policy perspective, the concept of vulnerability extends beyond the mere presence of hazards to include the difficulties in accessing essential resources, coupled with the lack of institutional support and protective mechanisms. Effective methods for identifying vulnerability are crucial, as they can guide the formulation of targeted public policies and help prioritize interventions that address the underlying factors contributing to the presence of vulnerabilities.
While the main theories on the etiology of crime recognize that location, social structure, the presence of criminal opportunities, and motivated offenders are factors influencing crime, most studies on the subject assume that the relationships between the variables motivating crime are homogeneous (stationary) in space, overlooking what location might reveal in the analysis.
In other words, many studies have analyzed the relationships between crime rates and various social and economic variables, but few have explored these relationships using geostatistical analysis methods that integrate the spatial factor as an embedded element within the model being analyzed.
Understanding crime as a multifactorial concept,
Butt et al. (
2020) provide a synthesis of the main research methods employed for its analysis. By reviewing 49 studies on the detection and prediction of high-crime zones, the authors find that classification and clustering techniques are the preferred approaches for such analyses.
In addition to other methods such as regression analysis, time-series analysis, and other statistical techniques, more than 65% of the studies reviewed were approached using methodologies like principal component analysis, spatial density, and hierarchical clustering, among others.
Specifically, the authors also recommend using principal component analysis and cluster analysis to highlight the relationship between criminal phenomena and their explanatory variables, thus identifying clustering profiles in areas with similar characteristics.
Regarding the identification of high-crime zones,
Andresen (
2011) mentions that location cannot be considered in isolation, as its spatial neighbors must also be considered to understand local crime patterns. The author points out that there are positive relationships between spatial units, with high-crime areas being close to other high-crime zones. Similarly, areas with low crime rates tend to be near other low-crime areas.
Chainey (
2021) summarizes three widely used spatial techniques for identifying high-crime areas, or “hot spots”. The first uses point data or coordinate-type data to estimate kernel density (
Silverman 1986) through a map. The author also proposes the Gi* statistic (
Ord and Getis 1995) to compare local averages with global averages, identifying significantly different areas.
Finally, he describes generating clusters using global indicators of spatial association (LISA), a method coined by
Anselin (
1995) to compare the similarity of values at each polygon location and its neighboring locations through the Moran I index.
The choice of technique will depend on the type of data used for analysis. For example,
Alvarado Lagunas et al. (
2021) demonstrate a spatial density analysis of theft in microbusinesses in the Metropolitan Area of Monterrey using point-based geographic data.
While analyzing crime from a spatial perspective is not a methodological challenge due to the extensive groundwork laid by studies like those of
Ord and Getis (
1995) and
Anselin (
1995), spatial crime analysis does present a challenge due to the scarcity of criminological data at the spatial level that are publicly available from authorities.
In Mexico, as in much of the world, open data on criminal incidence are grouped according to global characteristics of the locations where crimes occur, such as neighborhoods, municipalities, states, or other larger geographic regions. However, as
Wang et al. (
2019) note, for confidentiality reasons, authorities often omit publishing the exact location of criminal incidents with latitude and longitude, as doing so could reveal victims’ locations and provide potential offenders with information about criminal opportunities.
This limitation may restrict the techniques available for analysis and create a gap in the information available for studies of criminological phenomena from a microregion-based approach. However, as demonstrated through our methodology, it is possible to detect high-incidence zones using open data while safeguarding confidentiality.
2. Materials and Methods
2.1. Data
In order to maintain a replicable database across the national territory, variables were incorporated at the level of urban AGEBS (Basic Geostatistical Areas) within the Monterrey Metropolitan Area. The cartographic data were obtained through the National Geostatistical Framework for the 2020 Population and Housing Census, provided by the National Institute of Statistics and Geography (INEGI).
The selected scale allows for a spatial analysis of the conditions within the Monterrey Metropolitan Area, dividing an area of approximately 5000 square kilometers into 1629 AGEBS.
Each AGEB unit of analysis was geographically linked to business locations reported in the National Directory of Economic Units (DENUE), generating various variables related to the number of establishments, employment figures, and the economic activities being carried out.
Similarly, each AGEB was linked with variables from the 2020 Population and Housing Census by INEGI, which includes a wide range of demographic, socioeconomic, and cultural characteristics. The specific variables used and their sources can be found in
Table 1 across the methodology section (
Instituto Nacional de Estadística y Geografía 2021).
2.2. Vinculation to Theory
Building upon our research objective, we aim to implement a methodology that integrates the main theories on the etiology of commercial burglary into an analysis that considers the geographical or spatial factors as a key determinant for identifying high-incidence areas.
The conceptualization of the routine activity theory, developed by
Cohen and Felson (
1979), serves as a framework to identify the variables that should be incorporated into our model.
According to the authors, the occurrence of a crime is attributed to the presence of a motivated offender, the availability of a suitable target, and the absence of a capable guardian to prevent it.
The variables used in the analysis, along with their relationship to the determinants of commercial burglary according to routine activity theory, are presented in the following table. The relationship between each variable and the criminal phenomenon is indicated in parentheses. Additionally, references to support the use of proxies can be found in
Table 2.
First, we associate variables such as employment, education, informality, and income proxies as factors that either motivate or, conversely, dissuade individuals from committing a robbery.
Becker’s (
1968) theory provides insight into how social structure reduces individuals’ incentives to engage in illicit activities. Improved economic and social conditions, reflected in higher levels of social development, influence the decision to act within the boundaries of the law.
In line with the previously discussed theory, the variables associated with the presence of a motivated offender also align with social disorganization theory (
Shaw and McKay 1942), which offers structural explanations for criminal behavior. Indicators such as the percentage of the employed population and health insurance affiliation serve as proxies for both economic stability and institutional access. Similarly, household access to paid internet and television services reflects broader socioeconomic status. When combined with average years of schooling, these variables collectively signal a degree of social integration and cohesion, which are key factors to demotivate criminal activity.
For the second determinant, we examine business characteristics to assess whether they constitute a suitable target. As noted by
Van Dijk (
1994), the lack of adequate protective measures increases the likelihood of being victimized. In this sense, smaller businesses often have lower budgets to allocate to security measures.
Aligned with Van Dijk’s perspective, establishments with more than ten employees serve as a proxy of economic units that can afford protective measures, thereby reducing their attractiveness as a suitable target.
Similarly, as demonstrated by
Alvarado Lagunas et al. (
2020), businesses with greater interaction between outsiders, such as those in retail and services, are more susceptible to commercial burglary. This observation is reinforced in Mexico by the ENVE 2024 report, which confirms a higher incidence in the retail and service industries compared to other sectors, like industry.
Based on this, the percentage of establishments not engaged in retail or service activities can be considered a factor that also reduces the availability and attractiveness of a suitable target for offenders.
Moreover, the presence of a suitable target is inherently linked to the opportunity for crime. In this context, burglaries are more likely to occur in areas with a higher concentration of potential targets. Consequently, the density of economic units, measured as the percentage of units relative to the total in a given area, emerges as a significant factor that increases the availability of targets.
Finally, the absence of a capable guardian to prevent crime is crucial. To address this, we turn to the theory of collective efficacy (
Sampson et al. 1997), which emphasizes social cohesion among neighbors and their willingness to intervene for the common good.
According to this theory, a stronger neighborhood network and deeper local attachment—measured through the number of occupied homes and the individuals who have lived in their homes for over five years—serve as a potential form of surveillance and intervention in case an incident arises.
As observed in
Table 1, only the percentage of establishments located in the AGEB relative to the total has a direct relationship with commercial burglary. In other words, the greater the number of establishments, the more opportunities for crime arise, according to
Van Dijk’s (
1994) theory. Therefore, to ensure all the variables are aligned in the same direction for analysis, the inverse of this variable was chosen for our calculations.
In Mexico, routine activity theory has been applied to explain the social impact of the prolonged climate of insecurity the country has experienced.
Ávila et al. (
2016) note that both criminal activity and the heightened perception of insecurity have significantly altered citizens’ lifestyles, reshaping patterns of social interaction and daily routines. These changes include avoiding leaving home, minimizing exposure to high-risk areas, and implementing surveillance or protective measures within their homes.
On the same topic,
Vilalta and Fondevila (
2021) apply routine activity theory to identify key factors that may contribute to residential burglary risk. Using data from victimization surveys, the authors present a robust framework for understanding how various elements interact to influence burglary occurrences. Among these factors are environmental conditions such as street lighting, community structures that help deter criminal behavior, and the visibility and ease of entry of potential residential targets.
In addition to routine activity theory, the concept of vulnerability is introduced to identify the underlying factors that may contribute to the risk of commercial burglary. As highlighted in the literature review, vulnerability refers to the susceptibility of a community, individual, or entity to harm arising from social, economic, environmental, and other structural conditions.
The integration of routine activity theory and vulnerability offers a valuable framework for understanding criminological dynamics. It enables an analysis of how daily routines—shaped by broader structural factors such as poverty, inadequate public services, and institutional fragility—can increase the exposure to criminal threats.
This perspective is further supported by empirical research in the Mexican context. Studies by
Jurado Flores et al. (
2023) specifically on car theft and
Vilalta and Muggah (
2016) on general crime demonstrate that areas with high levels of social vulnerability often overlap with zones of high criminal activity. These findings suggest that structural conditions and routine activities interact to produce environments that are particularly prone to crime.
A noteworthy contribution is the work of
Pérez et al. (
2019), who empirically measure the concept of vulnerability using publicly available data, providing valuable insights into its practical application and implications.
Likewise, the work of
Jiménez-García et al. (
2021) provides a Latin American context for the application of the concept of vulnerability, measured in terms of the capacities or limitations of families, and its relationship to various metrics of violence in the cities of Bogotá, Lima, and Santiago.
Drawing on data from 2640 households across 81 neighborhoods, the authors construct a social vulnerability index by applying descriptive statistics, correlational analysis, and exploratory factor analysis to identify and validate relevant indicators. These indicators include socioeconomic variables, household composition, access to services, and perceived security.
This study finds a positive association between social vulnerability and both the experience of victimization and the perception of violence. Additionally, it highlights a negative relationship between social vulnerability and the perceived legitimacy of police.
The literature reviewed emphasizes the critical importance of developing a measure of vulnerability to commercial burglary across the economic units under study. Within the framework of routine activity theory, such a measure can help uncover the social and structural conditions that contribute to criminal activity.
2.3. Procedure
Given the availability of a dataset that characterizes commercial burglary from multiple dimensions, it is necessary to employ an analytical technique that allows us to examine how the relationships between the set of variables behave, while also synthesizing the information.
In line with the preferred technique in studies on crime patterns analyzed by
Butt et al. (
2020), principal component analysis (PCA) is used to generate an index that encapsulates the various determinants of commercial burglary into a single variable, as dictated by the theories presented. In other words, we pretend to reduce a diverse set of variables related to commercial burglary into a single comprehensible variable.
Several studies, such as those by
Chatfield and Collins (
1980) and
Jolliffe (
2005), highlight the advantages of using this technique to examine relationships between correlated variables and then generate a new variable through linear combinations of them.
As discussed in the previous section, the index to be developed aims to assess the vulnerability of the economic units under study to commercial burglary, within the framework of routine activity theory. This index will henceforth be referred to as the commercial burglary vulnerability index.
The decision to employ a vulnerability index rather than a risk index is grounded in both methodological and conceptual considerations. Vulnerability, as a concept, focuses on the inherent characteristics of subjects that can potentially be addressed through targeted public policy interventions. In contrast, risk assessment generally requires a known and quantifiable threat, along with reliable data on exposure and hazard, which may not always be available or precise in the context of criminal activity.
Furthermore, the methodologies adopted in this study are not predictive in nature, as would typically be expected with a risk index. Instead, they are designed to highlight the zones where economic units are most likely to suffer if a crime occurs in the sense that micro and small business cannot afford to have external security or invest in protective measures as big companies do.
On that basis, to confirm the suitability of the chosen technique, the first step is to verify whether the dataset is suitable for analysis by conducting statistical tests that determine the presence or absence of correlations among the variables.
As a reference to confirm the adequacy of our data,
Williams et al. (
2010) state that Kaiser–Meyer–Olkin measures of sampling adequacy with values above 0.5 and significant Bartlett’s test of sphericity confirm the presence of correlations between the variables.
As shown in the results of
Table 3, both the Kaiser–Meyer–Olkin (KMO) measure of sampling adequacy and Bartlett’s test of sphericity indicate that the variables are correlated, making the decision to group them into a single index a correct methodology.
To reduce the variables into a single dimension, factor extraction is performed through principal component analysis (PCA).
Williams et al. (
2010) suggest retaining only those components whose initial eigenvalues are greater than 1 and that, when retained, explain more than 60% of the variance.
According to the data presented in
Table 4, the four extracted components explain 76.35% of the variability in the dataset. To understand how the information captured by each component can be grouped, the loadings are highlighted.
Based on the results, the first component primarily captures information related to the social context of the AGEB, including average years of schooling, occupied housing, and income proxies. This first component is directly linked to the motivational dimension established in routine activity theory.
The second component addresses business characteristics within the AGEB. Variables related to the number of employees and the sector type indicate that the second component is associated with the presence of opportunities and suitable targets.
Finally, components 3 and 4 are linear combinations of variables related to social cohesion within the AGEB and aspects of formal employment, theoretically linking them to the presence of a capable guardian able to prevent commercial burglary.
After confirming that the principal component analysis was both statistically and theoretically sound, factor scores were calculated for each of the extracted components. These scores were then weighted based on how much each component contributed to explaining the overall variance in the data.
This process led to the creation of a composite index that brings together the different variables and theories discussed earlier into one simplified measure. In practical terms, the factor scores from the four retained components were combined using a weighted sum, where each component’s influence was proportional to how much variance it explained. This approach helps make sure that the most important patterns in the data play a bigger role in shaping the final index.
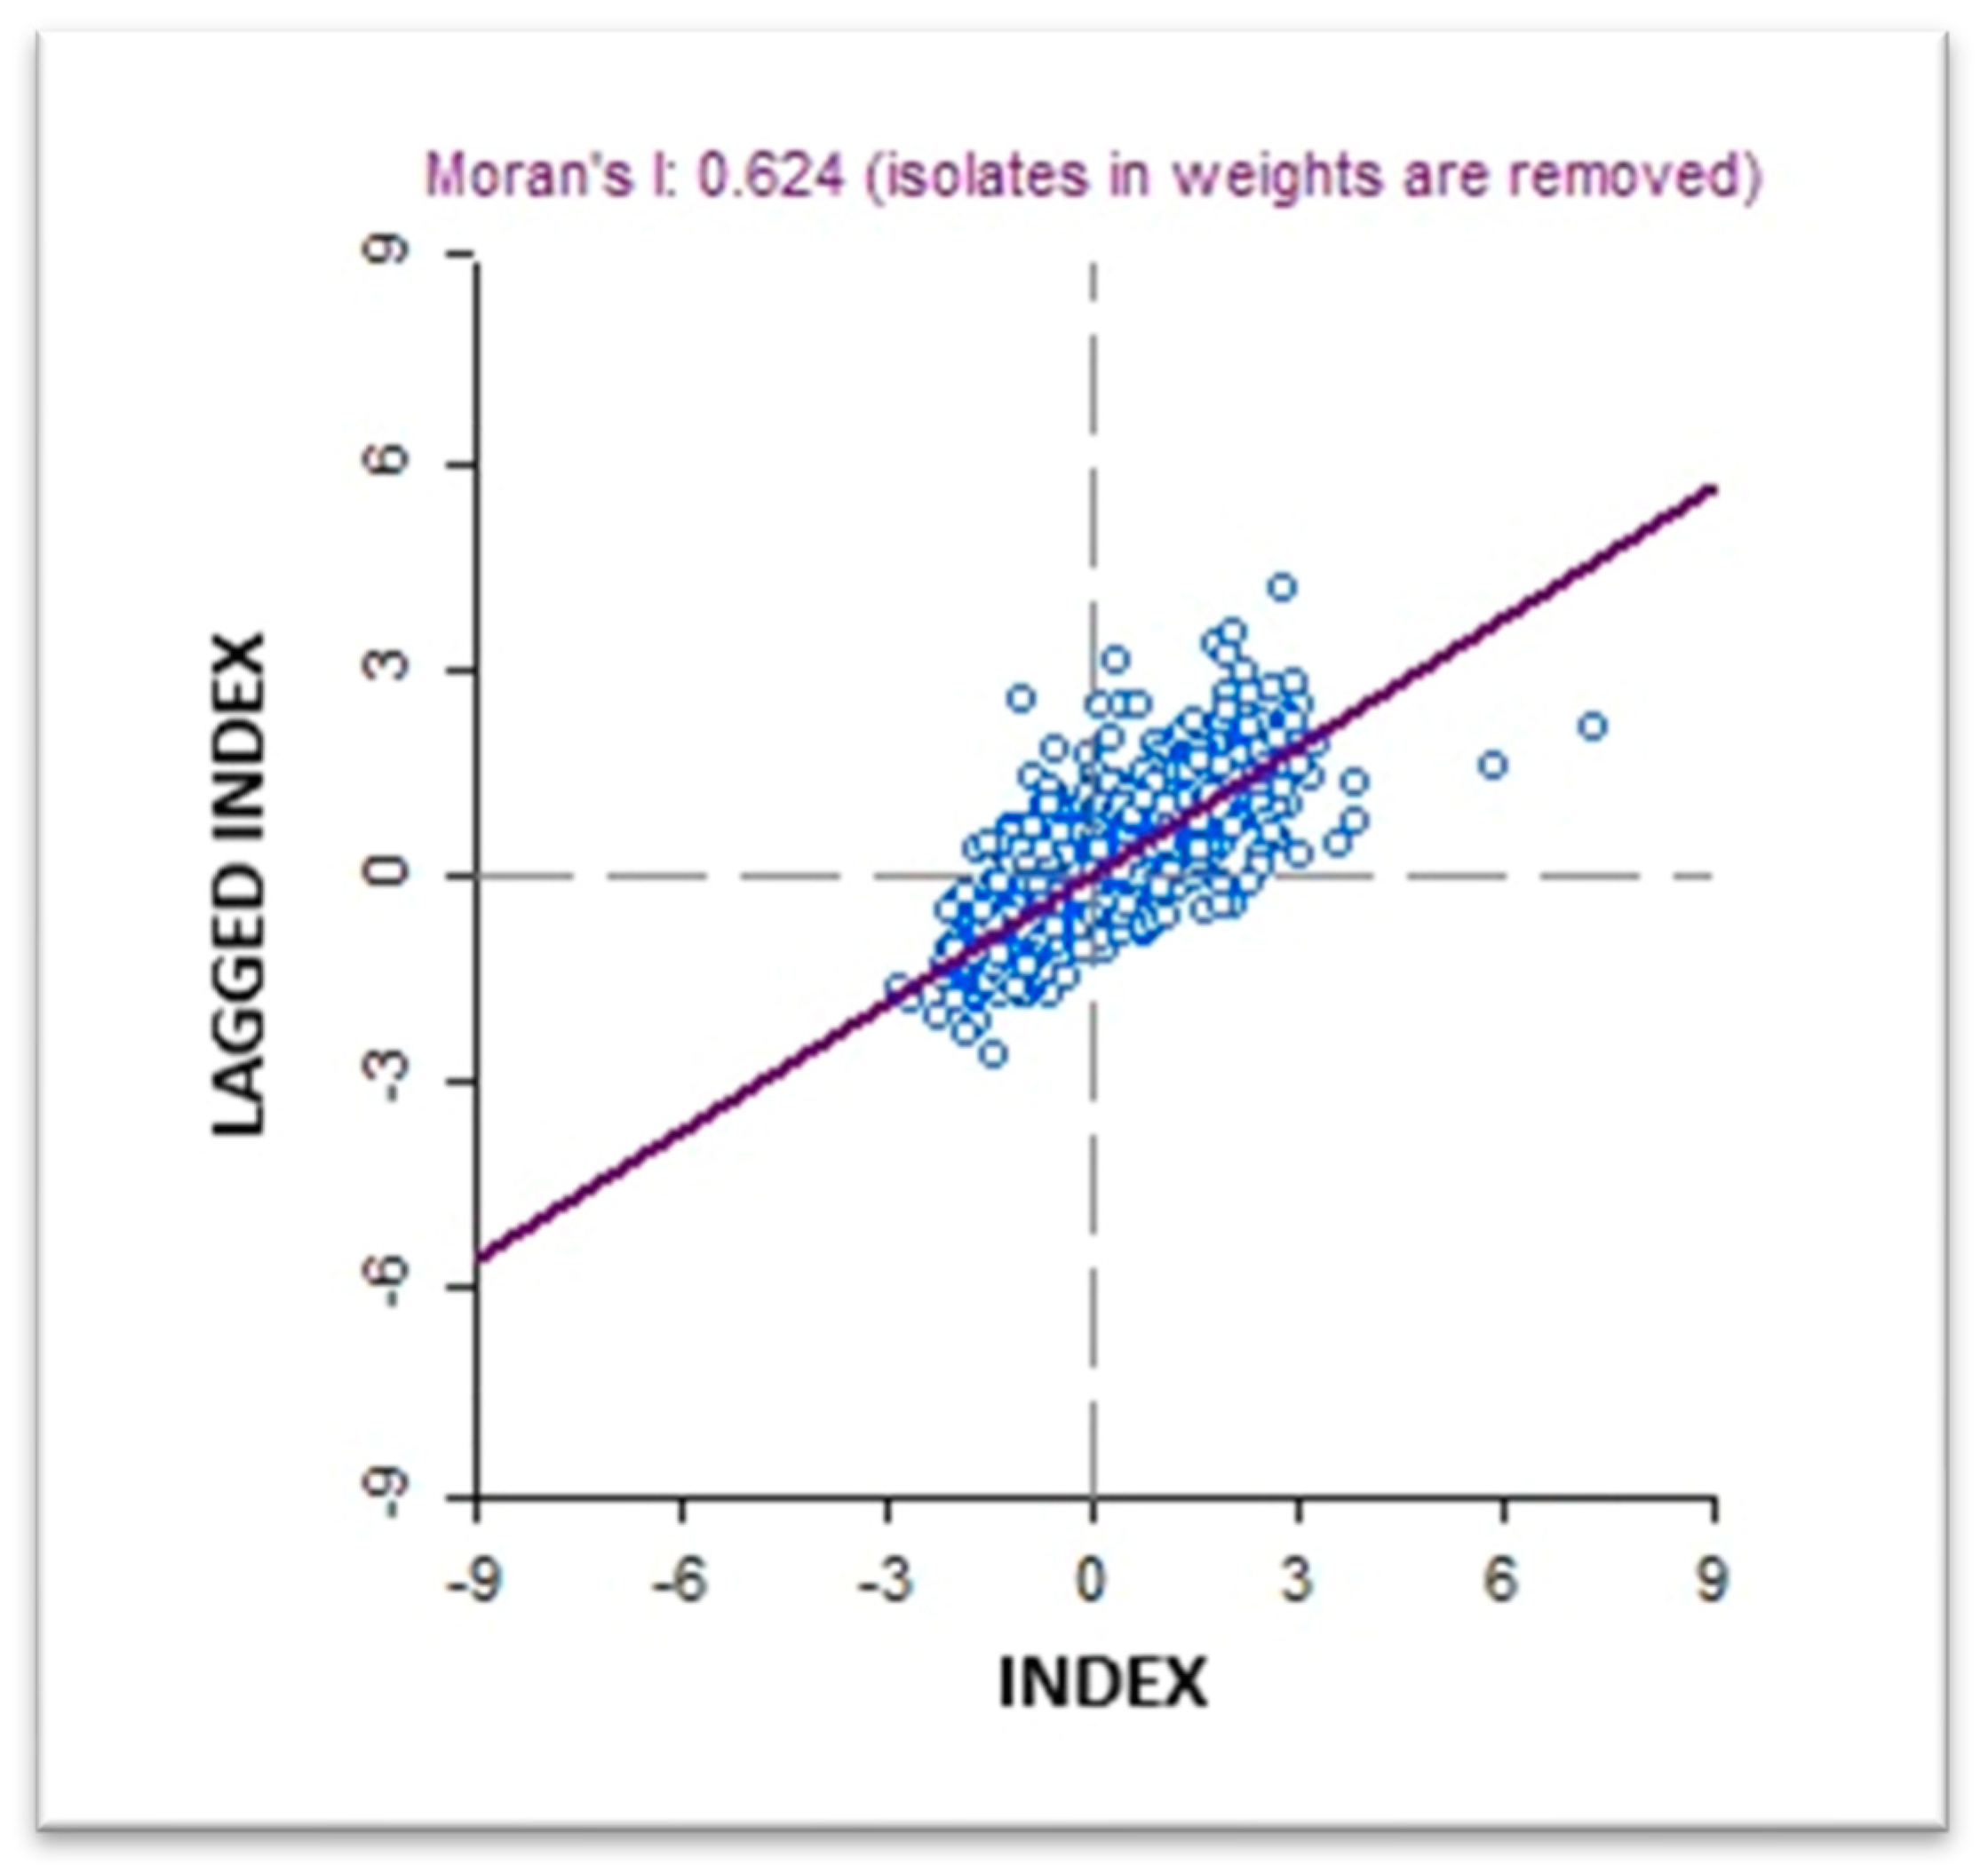
Given the geographical background of this paper, a Moran’s I test was used to confirm if there is any spatial pattern in the commercial burglary vulnerability index. This procedure helps us figure out if areas with similar vulnerability scores are grouped together or spread out randomly.
Figure 2 presents a scatterplot showing the relationship of the generated variable and the average value of its neighbors for the same variable, giving a Moran’s I value of 0.624, which shows a strong positive correlation, meaning that areas with higher vulnerability tend to be close to other areas with high vulnerability.
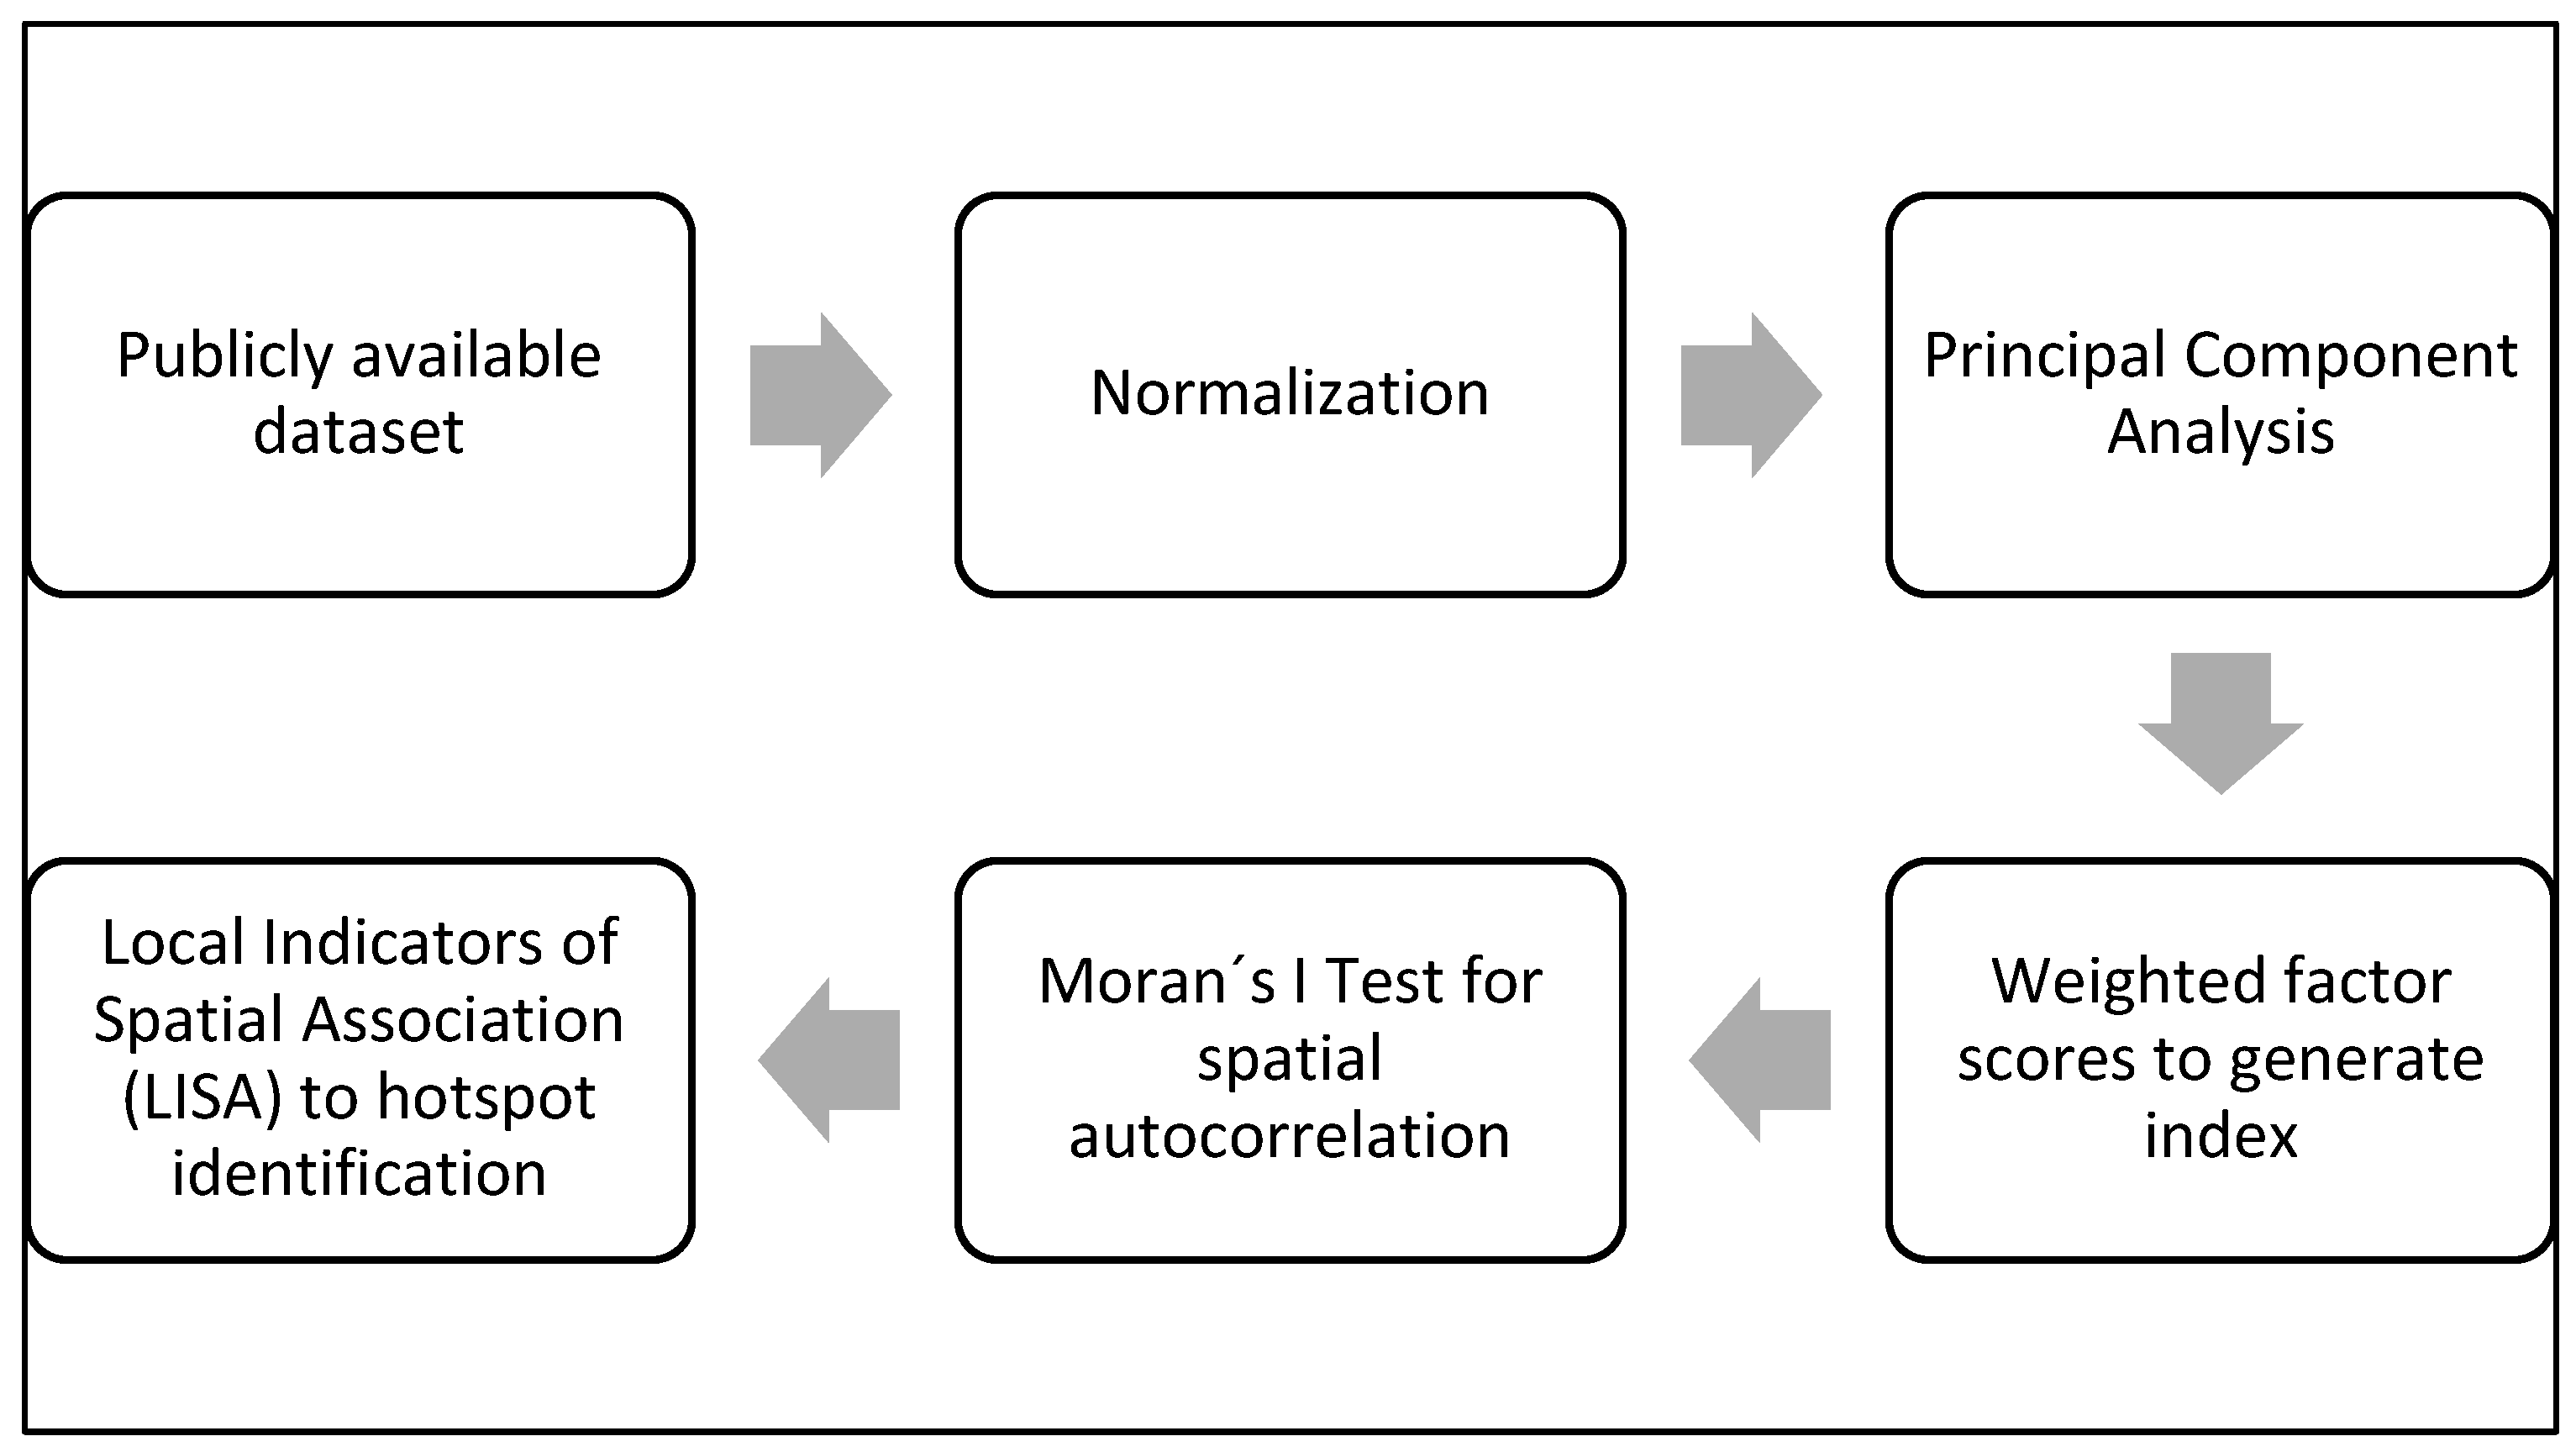
This result suggests that the vulnerability is not randomly distributed and sets the stage to further investigate, through geo-statistical tools, the local factors contributing to commercial burglary vulnerability. The interpretation of the index and its spatial treatment are described in the following section. Additionally, a workflow summarizing the methodology is presented in
Appendix A to improve the comprehension of our procedures.
3. Results
Once the methodology used to generate the index has been outlined, it is important to revisit the relationship between the commercial burglary phenomenon and the variables employed in its creation.
As mentioned earlier, the variables have an inverse relationship with commercial burglary, meaning that higher index values correspond to areas where there are fewer motivations to commit the crime. Opportunities for burglary are reduced in these areas due to the presence of establishments with a greater capacity to invest in protective measures, as well as a stronger social attachment from residents who can act as a deterrent or guardian against potential criminals.
Conversely, lower index values correspond to areas more vulnerable to being targeted. This interpretation allows us to name this index as the commercial burglary vulnerability index.
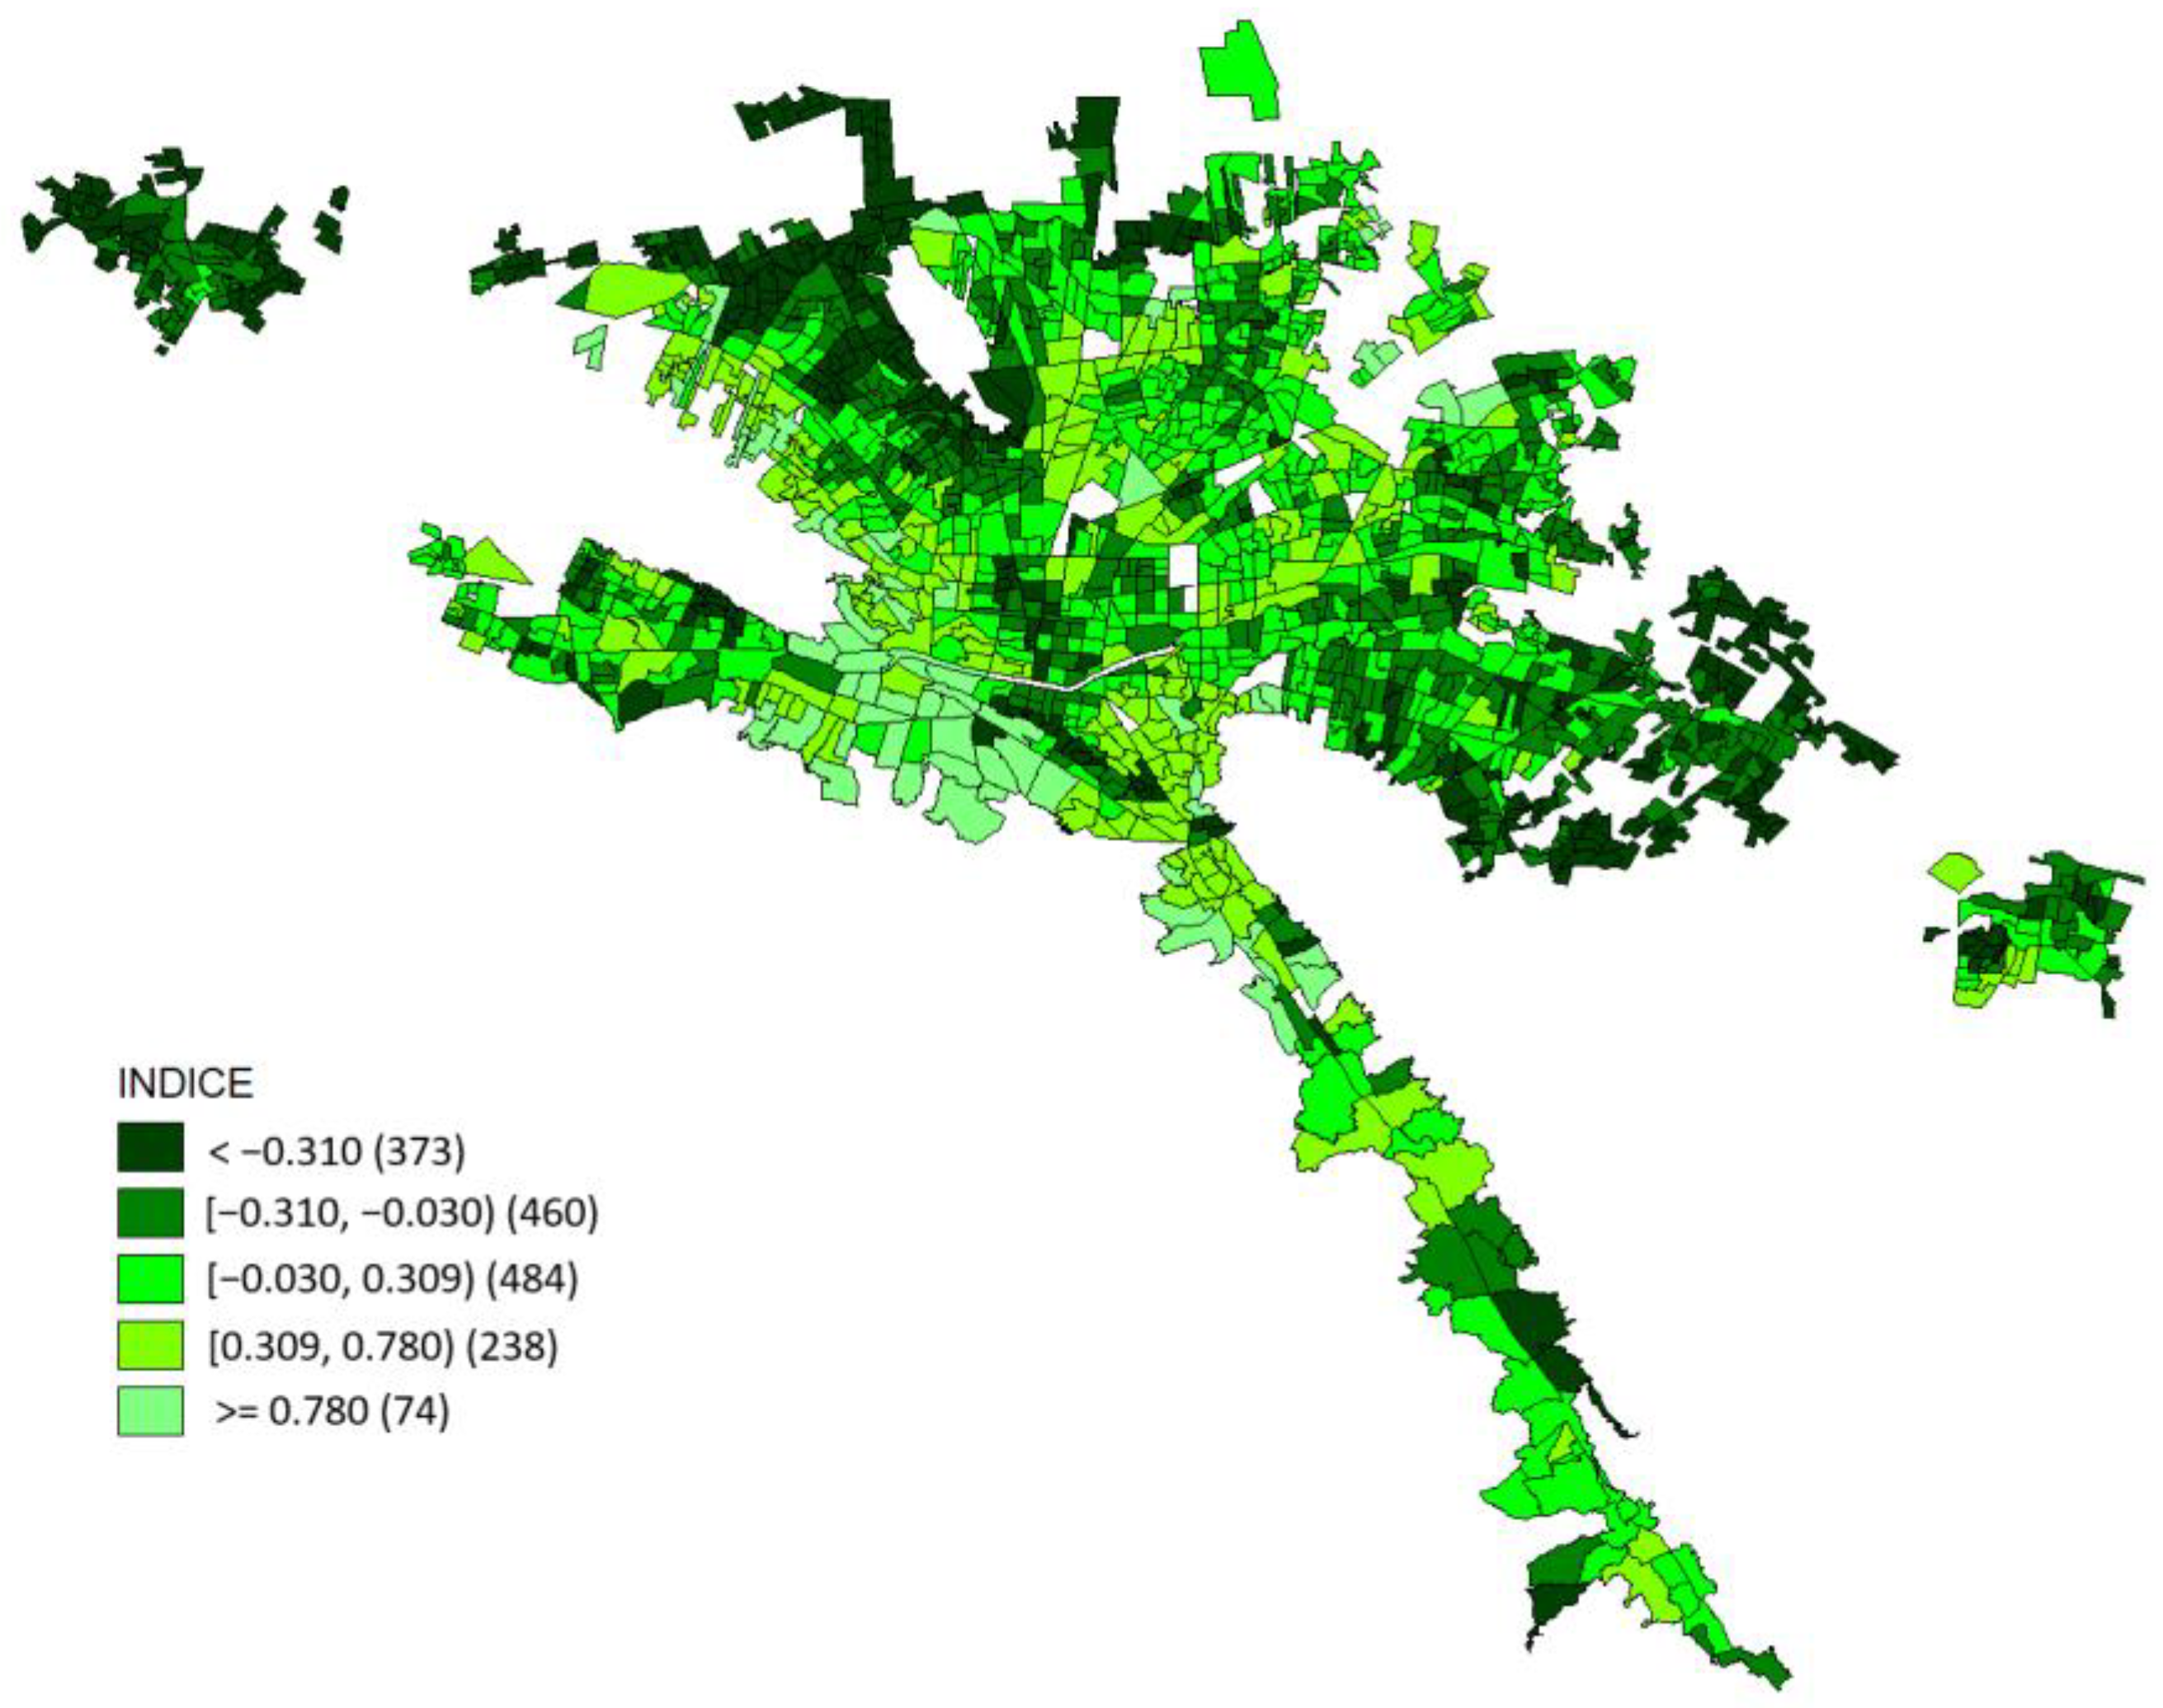
To support decision-making in the public sector, visualizing the generated index through a natural breaks map will help organize police efforts to address commercial burglary. As shown in
Figure 3, the darker areas represent approximately the 23% AGEBs most vulnerable to being targeted.
The map above will allow for the targeting of strategies to address the potential motivations behind crime, strengthen protective measures for establishments, or form neighborhood networks, among other initiatives to build social cohesion.
Based on the natural breaks map, it can be observed that the areas with the lowest index values are concentrated in both the city center and the periphery of the metropolitan area. Guided by the opportunity dimension of routine activity theory, the index reflects the vulnerability present in the city center, aligning with the concentration of economic units shown in
Figure 1.
As mentioned in the literature review,
Andresen (
2011) notes that location should not be considered in isolation, but rather in relation to its spatial neighbors in order to understand local crime patterns.
In this regard, the technique developed by
Anselin (
1995) is employed to create clusters through local indicators of spatial association (LISA) and a “queen” neighborhood type matrix between the study units.
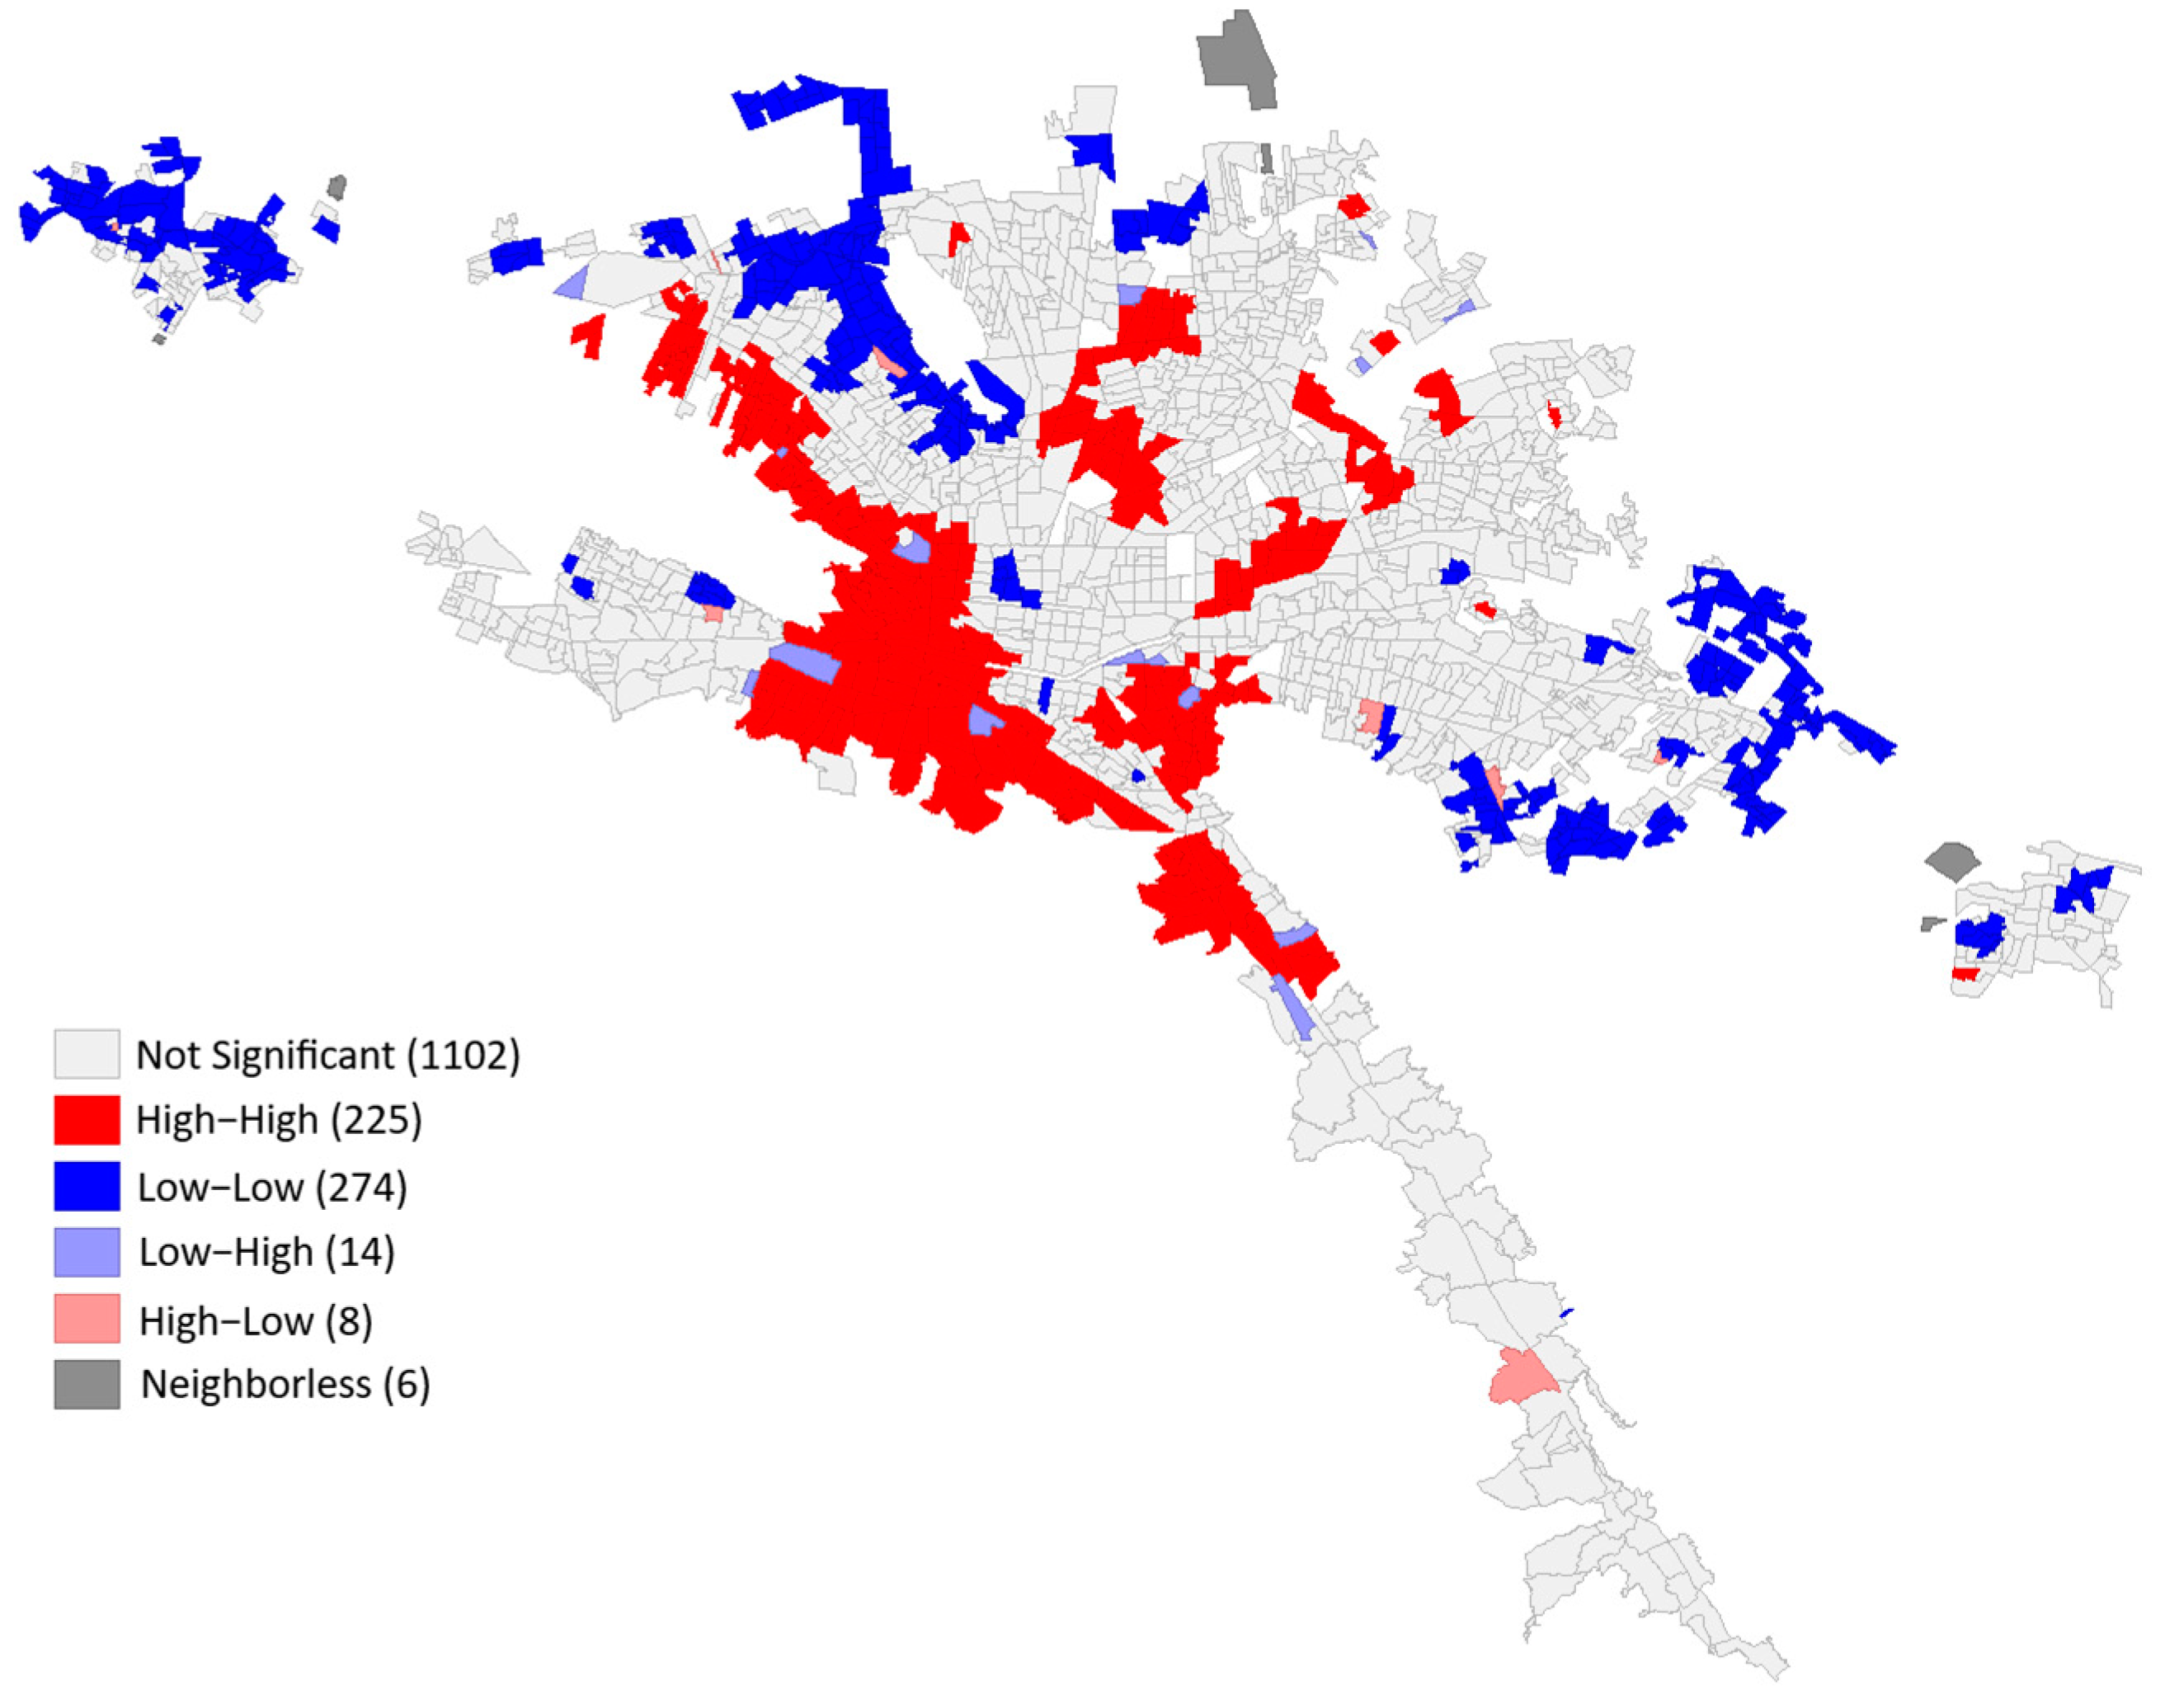
The previous process, shown in
Figure 4, results in the identification of high or low vulnerability zones, also known as hotspots, which will help continue focusing police efforts to reduce commercial burglaries and establish sector-specific strategies throughout the city.
In this study, we used LISA to better understand how commercial burglary vulnerability is distributed across different areas. This technique offers two key advantages that made it the most appropriate choice for our analysis.
First, it works well with the type of geographic data used in the analysis, which are polygon-shaped units. Some other techniques, like kernel density estimation (KDE), are designed for point or line data, making them unsuitable in this case.
Second, unlike other clustering techniques, through the application of LISA, it is possible to identify not only hot spots, but also cold spots and spatial outliers. Overall, using LISA allowed us to uncover meaningful spatial patterns in vulnerability that other tools might miss, giving us a stronger foundation for understanding where targeted interventions could be most effective.
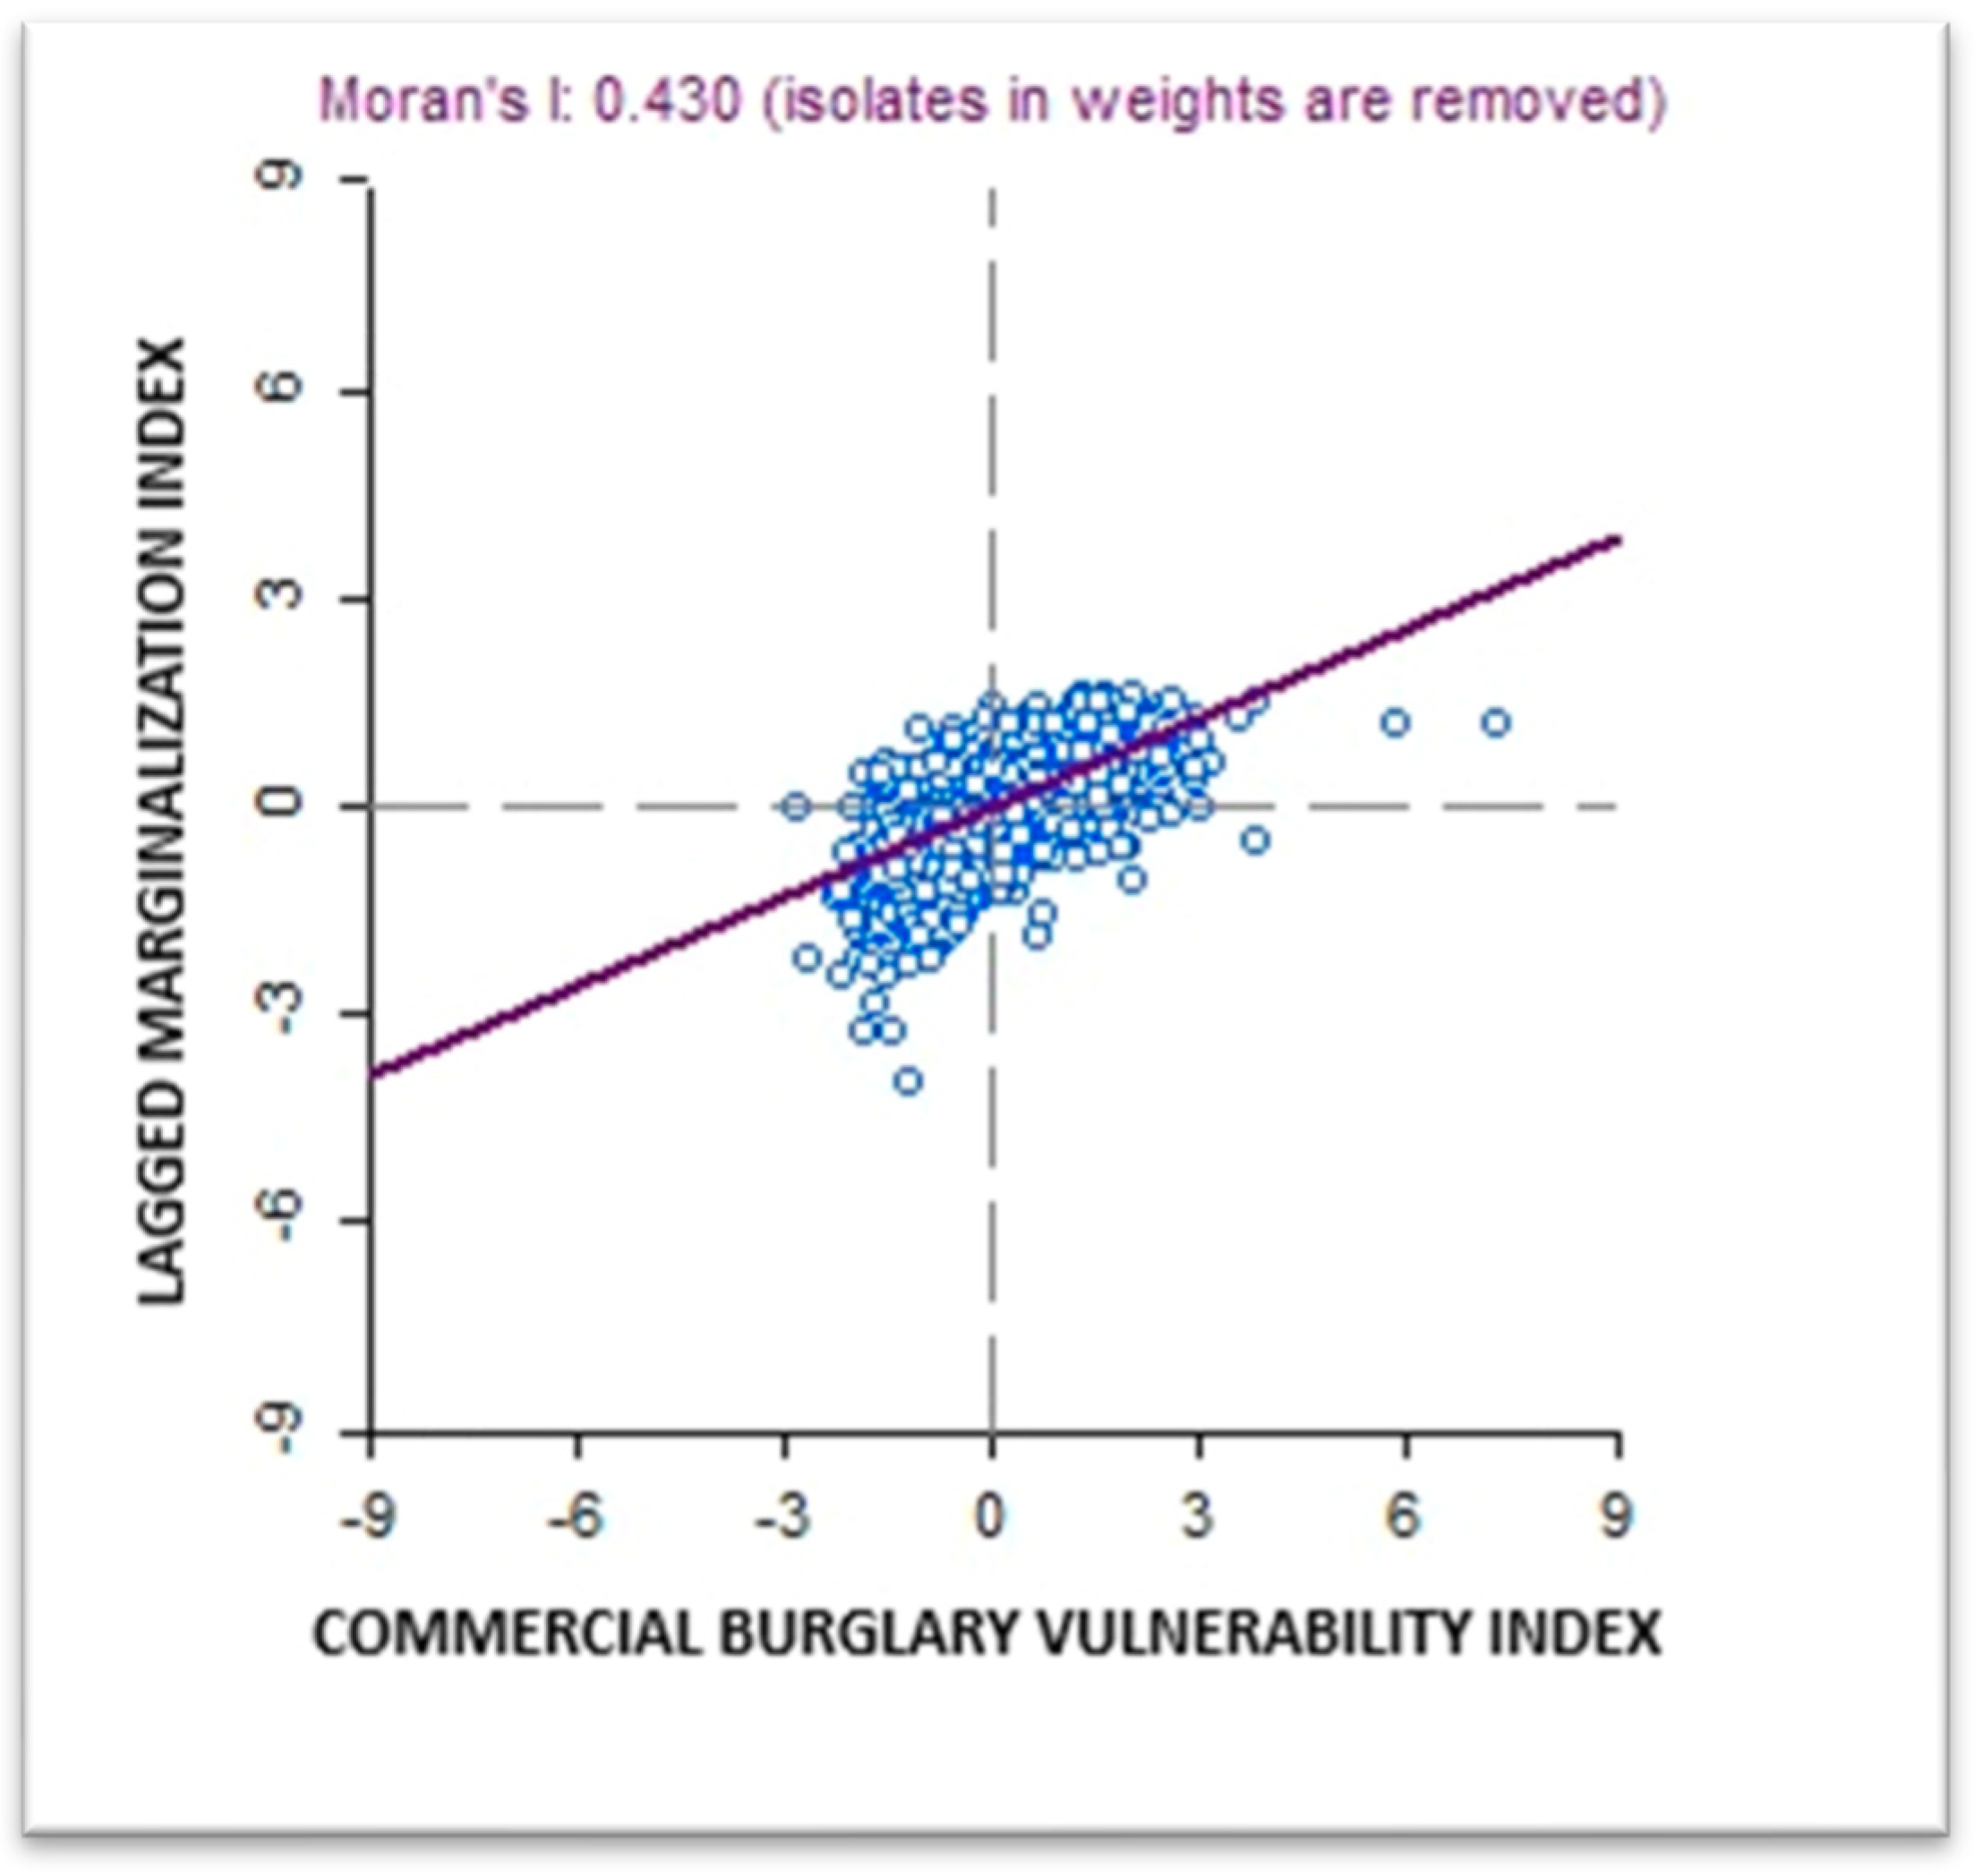
Finally, due to the unavailability of official commercial burglary data at the local level, direct empirical validation of the model is not possible. As an alternative, a proxy validation was conducted by spatially correlating the commercial burglary vulnerability index developed in this study with an official marginalization index produced by the National Population Council (CONAPO). This official index captures levels of marginalization based on socioeconomic indicators such as education, access to basic public services, housing quality, and income (
Consejo Nacional de Población 2021).
Figure 5 displays the results of a bivariate Moran’s I test, which was employed to assess the spatial correlation between the two indices. The resulting value of 0.430 indicates a moderate-to-strong positive spatial association, suggesting that areas with higher levels of socioeconomic marginalization are also more vulnerable to commercial burglary. This finding supports the premise that underlying social and economic conditions play a critical role in shaping crime vulnerability patterns.
However, it is important to acknowledge that this validation approach has limitations, particularly on its assumption that marginalization, measured in CONAPO’s terms, is a proxy for direct crime data on commercial burglary. Additionally, the spatial correlation noted depends on the type of neighborhood matrix defined and could result in a different outcome depending on the analysis design.
To strengthen the evaluation of the model, expert validation, through consultations with local law enforcement officials, urban planners, or criminologists, could serve as a valuable complementary strategy. Expert insights could help assess the validity of the index and ensure that it aligns with on-the-ground realities of commercial burglary. Further steps can be taken in collaboration with local authorities given full disclosure on official data to validate the performance of the index.
In the following section, we will explore the implications of both high and low concentrations of values, examining how these variations can influence outcomes. Additionally, we will highlight the key contributions of this analysis in reinforcing law enforcement strategies, providing valuable insights for more effective decision-making and resource allocation.
4. Discussion
As mentioned earlier, the lowest index values correspond to the areas most vulnerable to being targeted. According to
Figure 4, 274 AGEBs are also affected by low index values in their neighboring areas. These zones, labeled as “low–low” on the map, represent the hotspots for commercial burglary in the Metropolitan Area of Monterrey and account for 16.82% of the studied territory.
In an area encompassing over 160,000 economic units spread across more than 5000 square kilometers, this information could serve as a valuable tool for focusing law enforcement efforts on strategic surveillance and promoting preventive measures. Now, authorities can more effectively target high-vulnerability areas, prioritize resource allocation, and implement proactive actions that help mitigate potential threats, ultimately reducing the likelihood of commercial burglary incidents.
Furthermore, understanding the underlying factors that contribute to an area’s vulnerability to crime can inform the design of targeted public policies aimed at addressing those specific conditions. For instance, if limited economic capacity is identified as a key factor preventing businesses from implementing protective measures, authorities can strategically direct support to those economic units. This may include subsidizing security enhancements such as alarm systems, reinforced windows, or improved access control at entry points. Such targeted interventions not only strengthen local resilience but also contribute to broader crime prevention efforts.
Additionally, if a lack of social cohesion is identified as a contributing factor to vulnerability, community engagement policies can be implemented to strengthen local networks and promote collective security. Encouraging collaboration among business owners and neighboring residents can enhance informal surveillance and reinforce the presence of capable guardians, thereby creating a more resilient and watchful environment that deters criminal activity.
Long-term crime prevention must also address the underlying structural economic and social conditions that contribute to criminal behavior. Factors such as limited access to education, poverty, inequality, and unemployment create environments where criminal activity may become a perceived necessity or opportunity. By implementing comprehensive policies aimed at improving these systemic conditions, authorities can help reduce the root causes of crime and foster more stable, equitable communities.
Grouping the AGEBs according to the generated index allows for the organization of resources, policies, and strategies for sectors that share similar characteristics. It is important to note that areas not highlighted correspond to AGEBs that were not significant in their spatial association tests using Moran’s I statistic.
The 225 AGEBs classified as “high–high” represent areas that are less prone to commercial burglary, as they exhibit strengths in the various components that make up the index. As mentioned before, this classification can inform law enforcement strategies by allowing efforts and resources to be reallocated toward more vulnerable areas, where the need for surveillance and preventive action is more pressing.
Finally, it is also crucial to analyze what
Anselin (
1995) refers to as outliers—vulnerable areas surrounded by zones with strengths, categorized as “low–high”, and conversely, areas with strengths surrounded by vulnerable zones, labeled “high–low”.
Unlike areas grouped in the same direction, there are 22 AGEBs that require a specific strategy, as their neighbors do not share the characteristics defining the vulnerability of the zone.
The previous results provide two different alternatives for developing law enforcement strategies to combat commercial burglary using public data. The first involves prioritizing the AGEBs with the most determining factors of crime, addressing them individually. The second strategy presents clusters of AGEBs sharing common characteristics, allowing for broader action plans in larger territorial areas.
Despite certain limitations, which will be further addressed, the methodology presented is fully replicable across the entire national territory, as the required datasets are available for all 2469 municipalities in the country. Both the Population and Housing Census and the National Directory of Economic Units are available for download through the official website of the National Institute of Statistics and Geography (INEGI).
With basic geostatistical training, local governments, regardless of their size or resources, can carry out similar analyses. This is facilitated using open-source tools and software, along with the fact that the computational demands of the procedure are minimal.
Additional implementation guidance could be found in the official methodology of CONAPO’s marginalization index, which follows in detail the same procedure performed by the authors. Furthermore, government agencies can take advantage of a growing repository of publicly available code scripts and community-developed resources within open-source platforms, such as Python or R, to adopt and tailor these analytical techniques to their local contexts.
Regarding the limitations of the present study, a notable temporal limitation arises from the reliance on census data, which are only updated every ten years. Although intermediate estimates are available through national surveys conducted every five years, these do not offer the same level of detail or coverage, potentially affecting the timeliness and precision of the analysis.
Additionally, the use of proxy indicators to model social behavior carries the risk of introducing bias, particularly if the chosen indicator does not accurately or fully represent the underlying behavior it is intended to measure. This can lead to the misinterpretation of results or the oversimplification of complex social dynamics, ultimately affecting the validity of the analysis and the reliability of any resulting policy recommendations. Further insight into the limitations of using proxies in the social sciences is provided by
Knox et al. (
2022).
On the technical side, the methodology presents limitations as principal component analysis and local indicators of spatial association present known flaws.
For instance, when using normalized data inputs, principal component analysis may be biased in the presence of extreme values, hiding deficiencies or masking strengths depending on the direction of the extreme value (
Libório et al. 2025).
On a related note,
Greco et al. (
2018) critique the methodology for its inherent subjectivity, particularly in the decisions made by the analyst when applying principal component analysis. These include the selection of the number of components to retain, the choice of rotation method, and the assignment of weights for dimensionality reduction. According to the authors, such methodological choices can significantly influence the outcomes, introducing potential bias and inconsistency into the analysis.
This element of subjectivity is also a point of concern when applying local indicators of spatial association (LISA), as the outcomes are highly sensitive to analytical choices such as the spatial weights matrix definition, significance thresholds, and the spatial scale of analysis.
LeSage and Pace (
2014) address what they refer to as “the biggest myth in spatial econometrics”, arguing that while sensitivity exists, it is often overstated. They advocate for the use of well-specified spatial models and emphasize the importance of rigorous specification testing to ensure that spatial analyses remain robust and theoretically grounded.
Finally, and no less important, the unintended consequences of spatializing social issues have been increasingly recognized in literature. While spatial analysis can offer valuable insights, it also carries the risk of stigmatizing specific areas or communities, especially when labels such as “vulnerable” or “marginalized” are applied. According to
Calderón-Figueroa et al. (
2022), such labels may reinforce negative perceptions and contribute to social and economic exclusion.
5. Conclusions
This study delves into the proactive measures that law enforcement can take to prevent commercial burglaries in Mexico, leveraging publicly available data to inform strategic decisions. By analyzing determinants of crime based on theory, this approach aims to strengthen police intervention and enhance the effectiveness of prevention efforts. The insights gained from this analysis can help optimize resource allocation, improve surveillance tactics, and ultimately reduce the incidence of commercial burglaries.
Empirical research on commercial burglary in Mexico and Latin America remains relatively scarce. Some notable studies, such as those by
Motta (
2016) and
Mugellini (
2013), primarily focus on the impact of crime on business performance and the development of reliable measurement instruments.
However, there is a limited body of research addressing the underlying factors that make specific areas vulnerable to commercial burglary.
Nevertheless, victimization surveys and crime burden estimates, such as those conducted by
Perez-Vincent et al. (
2024) and published by the Inter-American Development Bank (IDB), provide valuable insights that can assist public authorities in understanding the phenomenon and developing targeted strategies to mitigate its impact.
While the literature review presented in this study is not exhaustive, it establishes a solid foundation for understanding commercial burglary through spatial and theoretical frameworks. The authors recognize that further exploration of emerging theories, particularly those addressing evolving forms of commercial crime, such as cybercrime, could significantly deepen our understanding of criminal behavior.
Additionally, the review acknowledges the omission of temporal dimensions of crime and business-specific factors, both of which could enrich the analysis and offer more comprehensive insights into the dynamics of commercial burglary.
Fotheringham and Sachdeva (
2022) note that the methodologies outlined here have gained prominence over the past two decades. Increasingly, their usefulness is recognized in optimizing interventions aimed at improving society.
As pioneers in the implementation of these methodologies, the authors advocate for adopting a “local-thinking” approach when working with data and propose the use of geostatistical tools as a complement to global model analyses.
The local analysis of crime dynamics becomes even more significant in Mexico, as municipalities are the front line in combating and preventing common crimes, and as said before, police departments are challenged to deploy strategies without knowing when, where, how, and why a crime has occurred, leaving the victims without justice and with the possibility of being targeted again.
This approach could prove instrumental in deploying intelligence-led policing strategies, enhancing operational effectiveness, and fostering greater public trust in the integrity and efficacy of law enforcement agencies.
Likewise, if the analysis is extended to describe and model the determinants of other types of incidents, the methodology could be applied to identify vulnerable areas for social issues and crimes, such as domestic violence.
In this sense, the methodologies and tools presented here could assist authorities at all three levels of government in Mexico, not only in optimizing strategies to combat crime but also in diagnosing and implementing actions to prevent it.


